Active versus expectant management for women in the third stage of labour
Información
- DOI:
- https://doi.org/10.1002/14651858.CD007412.pub4Copiar DOI

- Base de datos:
-
- Cochrane Database of Systematic Reviews
- Versión publicada:
-
- 02 marzo 2015see what's new
- Tipo:
-
- Intervention
- Etapa:
-
- Review
- Grupo Editorial Cochrane:
-
Grupo Cochrane de Embarazo y parto
- Copyright:
-
- Copyright © 2015 The Cochrane Collaboration. Published by John Wiley & Sons, Ltd.
Cifras del artículo
Altmetric:
Citado por:
Autores
Contributions of authors
Cecily Begley (CB) drafted the background section and all other authors contributed to editing the text. All review authors contributed to the drafting of the inclusion criteria for the review. Gill Gyte (GG) and Declan Devane (DD) added the methodology section with other authors commenting. CB and GG abstracted and pooled data. William McGuire checked data entry, DD prepared the 'Summary of findings' table, which was checked by Andrew Weeks. GG, DD and CB wrote the results section with other authors commenting. CB and GG wrote the discussion and implications sections, with input from all authors.
Sources of support
Internal sources
-
(GG) The University of Liverpool, UK.
External sources
-
(GG) National Institute for Health Research, UK.
2009 Version of this review was supported by the NIHR NHS Cochrane Collaboration Programme Grant Scheme award for NHS‐prioritised centrally‐managed, pregnancy and childbirth systematic reviews: CPGS02
Declarations of interest
Cecily Begley was the lead researcher on the 'Dublin trial' (Begley 1990).
Gill Gyte has written extensively on third‐stage management and is currently involved in the development of trial protocols to assess the impact on mother and infant of deferred cord clamping in preterm infants.
Andrew Weeks is also on the same trial team related to the timing of cord clamping as well as investigating the use of misoprostol for postpartum haemorrhage prophylaxis in rural Uganda. He is also one of nine inventors of a small resuscitation trolley (the BASICS trolley) that allows neonatal resuscitation with an intact cord.
Acknowledgements
We acknowledge the work of the previous review team, upon which the protocol was based (Prendiville 2000), and also the contribution of Deirdre Murphy and Sue McDonald in the previous versions of this review. We thank the trial authors who provided additional information on request: Beck (on behalf of Muller), Begley, Hoffman, Rogers/Elbourne, Thilaganathan.
Particular thanks to Therese Dowswell, who contributed greatly to data extraction and tables on a previous version.
As part of the pre‐publication editorial process, this review has been commented on by three peers (an editor and two referees who are external to the editorial team), a member of the Pregnancy and Childbirth Group's international panel of consumers and the Group's Statistical Adviser (in 2009).
Thanks to Nazie AmirAnsari and Alireza Karbalaei who translated Vasegh 2005a and Emily Lemon who translated Muller 1996.
Version history
| Published | Title | Stage | Authors | Version |
| 2019 Feb 13 | Active versus expectant management for women in the third stage of labour | Review | Cecily M Begley, Gillian ML Gyte, Declan Devane, William McGuire, Andrew Weeks, Linda M Biesty | |
| 2015 Mar 02 | Active versus expectant management for women in the third stage of labour | Review | Cecily M Begley, Gillian ML Gyte, Declan Devane, William McGuire, Andrew Weeks | |
| 2011 Nov 09 | Active versus expectant management for women in the third stage of labour | Review | Cecily M Begley, Gillian ML Gyte, Declan Devane, William McGuire, Andrew Weeks | |
| 2010 Jul 07 | Active versus expectant management for women in the third stage of labour | Review | Cecily M Begley, Gillian ML Gyte, Deirdre J Murphy, Declan Devane, Susan J McDonald, William McGuire | |
| 2008 Oct 08 | Active versus expectant management for women in the third stage of labour | Protocol | Cecily M Begley, Declan Devane, Deirdre J Murphy, Gillian ML Gyte, Susan J McDonald, William McGuire | |
Differences between protocol and review
We did not carry out additional searching as proposed. We decided after looking at the variation in the interventions and controls used in the studies that we had clinical heterogeneity between the studies (Table 1) and so we have used a random‐effects meta‐analysis throughout the review.
We have changed the labels on the secondary outcomes of 'Primary postpartum haemorrhage (> 500 mL)' and 'Secondary postpartum haemorrhage (> 500 mL)' to 'Primary maternal blood loss > 500 mL' and 'Secondary maternal blood loss > 500 mL' respectively. This is because we believe that in research the term 'haemorrhage' should be reserved for excessive blood loss. We have also included reference to the mean Hb values in order to provide an outcome that was calculated by blinded personnel.
We have modified the wording in the methods sections for 'Assessment of heterogeneity', 'Assessment of reporting biases' and 'Data synthesis' to update them with the new methods being used by the group, developed in conjunction with the group's statisticians, Simon Gates and Richard Riley. We have used these new methods in the review.
We decided to reduce the number of outcomes, in line with the Cochrane Handbook of Systematic Reviews of Interventions recommendations. We made the following changes to outcomes.
Nine primary outcomes reduced to seven
Clinical signs of severe blood loss at the time of birth, e.g. woman feeling breathless, weak, faint, pale, exhausted: moved to secondary outcomes list.
Evidence of acidaemia indicated by a pH less than seven or base deficit greater than 12 mmol/L in umbilical arterial cord blood, or (c) neonatal blood sample in first hour of life, or both: removed.
Apgar score less than seven at five minutes, and neonatal ('hypoxic ischaemic') encephalopathy assessed using Sarnat staging: moved to secondary outcomes list.
Changes to primary outcomes
All PPH amounts and mean blood losses are now expressed at three time periods "at the time of the birth", "after delivery of placenta and up to 24 hours", and "at the time of birth and up to 24 hours". This was done because it was noted that the two primary outcomes "Severe primary PPH (clinically estimated or measured blood loss greater than or equal to 1000 mL at time of birth and up to 24 hours)" and "Very severe primary PPH (clinically estimated or measured blood loss greater than or equal to 2500 mL at time of birth and up to 24 hours)", which were based on the international definition of postpartum haemorrhage (PPH) could, in fact, provide misleading results if study authors measured or estimated blood loss at birth, and over a period of some hours in the first 24 hours, and added all amounts together to provide an overall PPH rate. While this estimate could also be useful, it raises the PPH rate artificially in comparison with studies that do not do this. Accordingly, we have changed the first two primary outcomes to “Severe primary postpartum haemorrhage (clinically estimated or measured blood loss greater than or equal to 1000 mL at time of birth)” and “Very severe primary PPH (clinically estimated or measured blood loss greater than or equal to 2500 mL at time of birth)” and have included the original definitions as secondary outcomes.
"Maternal Hb concentration less than 9 g/dL 24 to 48 hours postpartum" changed to "Maternal Hb concentration less than 9 g/dL 24 to 72 hours postpartum" ‐ as Hb levels may be taken within the first three days postnatal, rather than the first two.
Secondary outcomes deleted (to reduce number of outcomes)
-
Iron therapy during the puerperium.
-
Length of the third stage greater than or equal to 60 minutes.
-
Nausea between birth of baby and discharge from the labour ward.
-
Headache between birth of baby and discharge from the labour ward.
-
Maternal views of third‐stage management (assessed using a validated questionnaire).
-
Maternal Hb concentration less than 9 g/dL postdischarge and up to six weeks.
-
Sequelae of PPH (length of stay; infection; re‐admission).
-
Infant Hb level and iron indices beyond three months.
Changes to secondary outcomes
"Administration of oral or rectal analgesia (e.g. paracetamol, codeine, non‐steroidals) between birth of the baby and discharge from the labour ward" and "Administration of opiate analgesia between birth of the baby and discharge from the labour ward" combined as "Administration of any analgesia between birth of the baby and discharge from the labour ward".
"Secondary blood loss equal to or greater than 500 mL (clinically estimated or measured after 24 hours and before six weeks)" and "Any vaginal bleeding needing treatment (after 24 hours and before six weeks)" and "Uterotonic treatment after 24 hours and before six weeks" combined as "Secondary blood loss/any vaginal bleeding needing treatment (after 24 hours and before six weeks)".
"Infant Hb level (Hb) at 24 to 48 hours" changed to "at 24 to 72 hours", as Hb levels may be taken within the first three days postnatal, rather than the first two.
"Intraventricular haemorrhage (preterm infants): (i) grade III/IV; (ii) all grades (Sarnat 1976)" changed to "Papille grade III/IV intraventricular haemorrhage (for infants born before 34 weeks' gestation only)".
"Transfusion requirements (preterm infants): (i) number of infants exposed to one or more red blood cell transfusions; (ii) number of transfusions per infant; (iii) number of donors to whom the infant was exposed" changed to "Number of infants who received a red blood cell transfusion".
"Breastfeeding at discharge from hospital and at interval assessments until six months" changed to "Exclusive breastfeeding at discharge from hospital".
New secondary outcomes included
"Neonatal mortality" included.
Keywords
MeSH
Medical Subject Headings (MeSH) Keywords
- Birth Weight;
- Constriction;
- Delivery, Obstetric [adverse effects, *methods];
- Jaundice, Neonatal [therapy];
- Labor Stage, Third [*physiology];
- Oxytocics [*administration & dosage, adverse effects];
- Placenta;
- Postpartum Hemorrhage [*prevention & control];
- Randomized Controlled Trials as Topic;
- *Watchful Waiting;
Medical Subject Headings Check Words
Female; Humans; Infant, Newborn; Pregnancy;
PICO
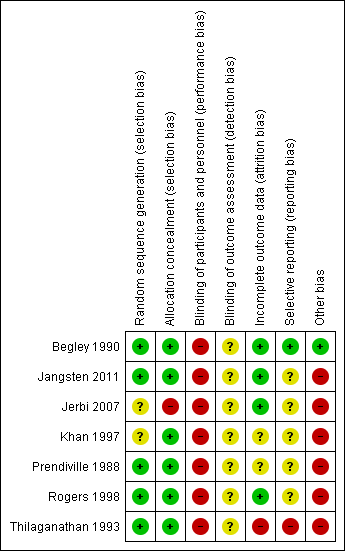
Methodological quality summary: review authors' judgements about each methodological quality item for each included study.

Comparison 1 Active versus expectant management of 3rd stage of labour (all women), Outcome 1 Severe primary postpartum haemorrhage (PPH) at time of birth (clinically estimated or measured blood loss ≥ 1000 mL).

Comparison 1 Active versus expectant management of 3rd stage of labour (all women), Outcome 4 Maternal Hb < 9 g/dL 24‐72 hours postpartum.

Comparison 1 Active versus expectant management of 3rd stage of labour (all women), Outcome 5 Admission to neonatal special/intensive care.

Comparison 1 Active versus expectant management of 3rd stage of labour (all women), Outcome 6 Neonatal jaundice requiring phototherapy or exchange transfusion.

Comparison 1 Active versus expectant management of 3rd stage of labour (all women), Outcome 10 Primary blood loss ≥ 500 mL at time of birth (clinically estimated or measured).

Comparison 1 Active versus expectant management of 3rd stage of labour (all women), Outcome 13 Mean maternal blood loss (mL) at time of birth (clinically estimated or measured).
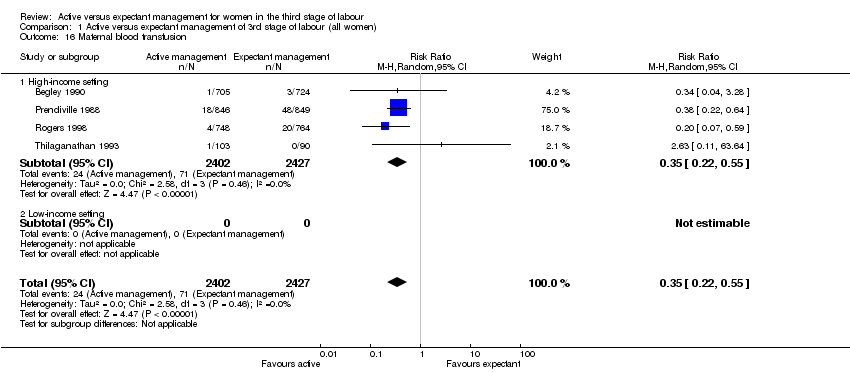
Comparison 1 Active versus expectant management of 3rd stage of labour (all women), Outcome 16 Maternal blood transfusion.
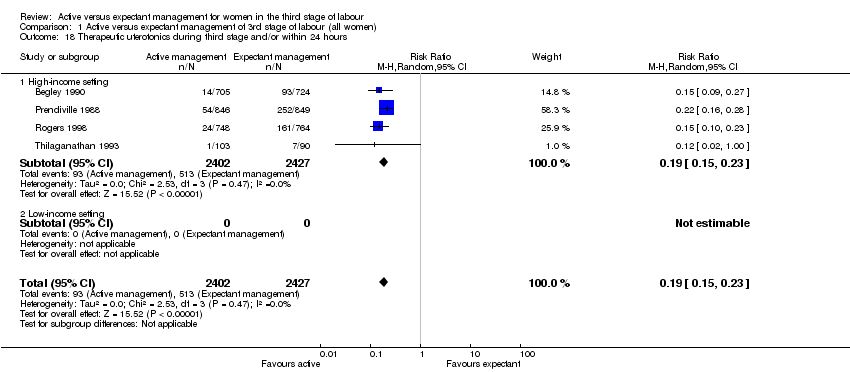
Comparison 1 Active versus expectant management of 3rd stage of labour (all women), Outcome 18 Therapeutic uterotonics during third stage and/or within 24 hours.

Comparison 1 Active versus expectant management of 3rd stage of labour (all women), Outcome 19 Mean length of third stage.

Comparison 1 Active versus expectant management of 3rd stage of labour (all women), Outcome 20 Manual removal of placenta as defined by authors.
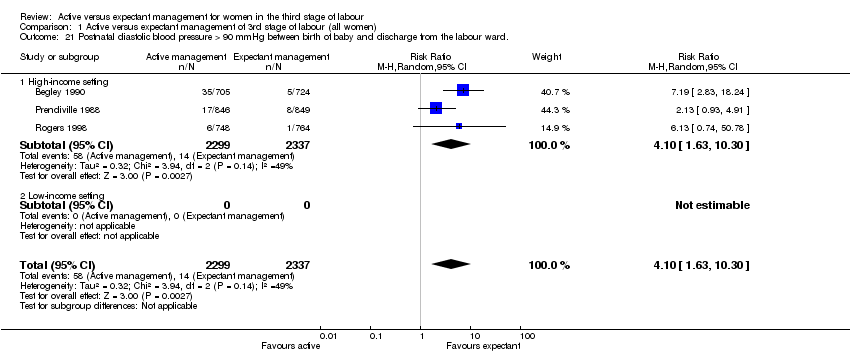
Comparison 1 Active versus expectant management of 3rd stage of labour (all women), Outcome 21 Postnatal diastolic blood pressure > 90 mmHg between birth of baby and discharge from the labour ward..
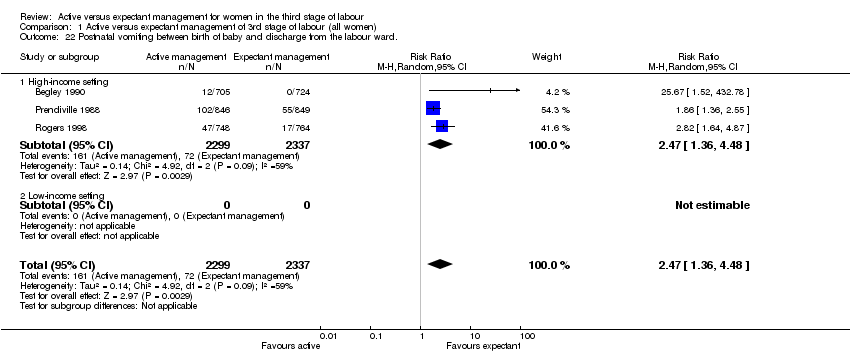
Comparison 1 Active versus expectant management of 3rd stage of labour (all women), Outcome 22 Postnatal vomiting between birth of baby and discharge from the labour ward..

Comparison 1 Active versus expectant management of 3rd stage of labour (all women), Outcome 23 Any analgesia between birth of the baby and discharge from labour ward.

Comparison 1 Active versus expectant management of 3rd stage of labour (all women), Outcome 25 Secondary blood loss/any vaginal bleeding needing treatment (after 24 hours and up to 6 weeks).

Comparison 1 Active versus expectant management of 3rd stage of labour (all women), Outcome 27 Surgical evacuation of retained products of conception.

Comparison 1 Active versus expectant management of 3rd stage of labour (all women), Outcome 28 Afterpains ‐ abdominal pain associated with the contracting uterus in the postpartum period..
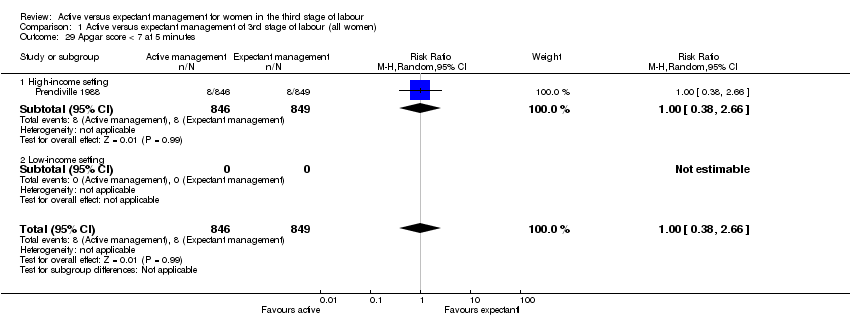
Comparison 1 Active versus expectant management of 3rd stage of labour (all women), Outcome 29 Apgar score < 7 at 5 minutes.

Comparison 1 Active versus expectant management of 3rd stage of labour (all women), Outcome 30 Birthweight.
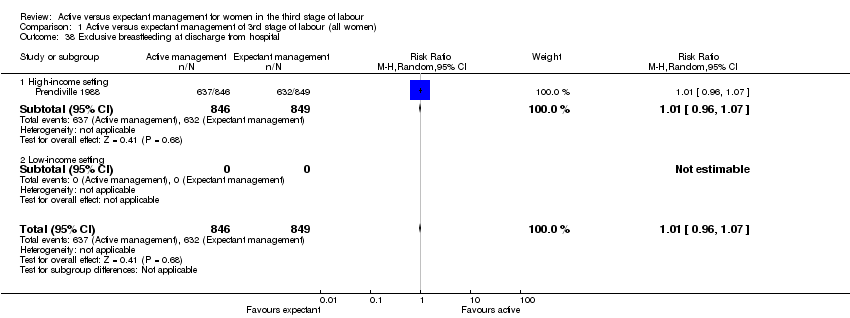
Comparison 1 Active versus expectant management of 3rd stage of labour (all women), Outcome 38 Exclusive breastfeeding at discharge from hospital.

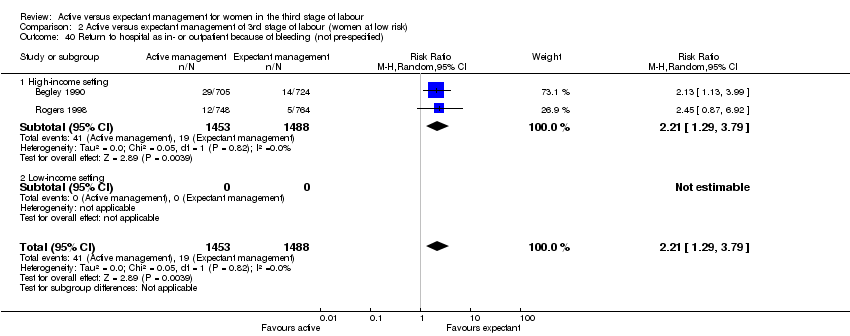
Comparison 1 Active versus expectant management of 3rd stage of labour (all women), Outcome 40 Return to hospital as in‐ or outpatient because of bleeding (not pre‐specified).
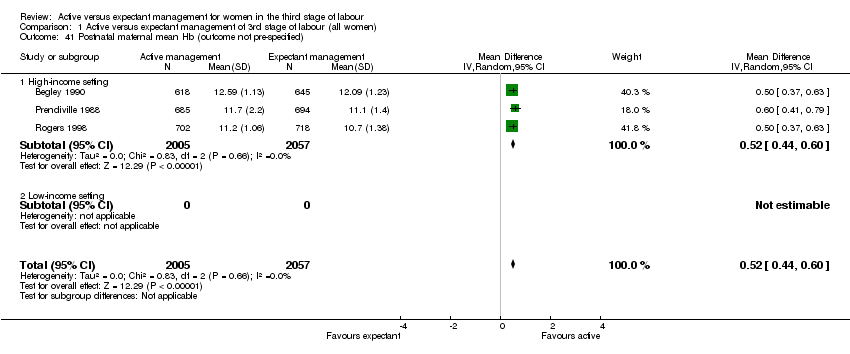
Comparison 1 Active versus expectant management of 3rd stage of labour (all women), Outcome 41 Postnatal maternal mean Hb (outcome not pre‐specified).
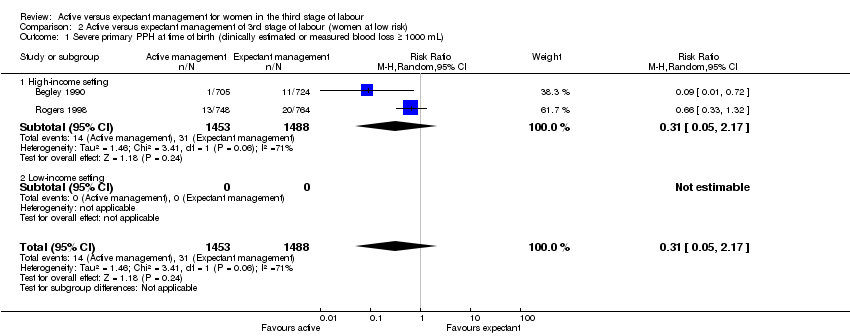
Comparison 2 Active versus expectant management of 3rd stage of labour (women at low risk), Outcome 1 Severe primary PPH at time of birth (clinically estimated or measured blood loss ≥ 1000 mL).

Comparison 2 Active versus expectant management of 3rd stage of labour (women at low risk), Outcome 4 Maternal Hb < 9 g/dL at 24‐72 hr.

Comparison 2 Active versus expectant management of 3rd stage of labour (women at low risk), Outcome 5 Admission to neonatal special/intensive care.

Comparison 2 Active versus expectant management of 3rd stage of labour (women at low risk), Outcome 6 Neonatal jaundice requiring phototherapy or exchange transfusion.

Comparison 2 Active versus expectant management of 3rd stage of labour (women at low risk), Outcome 10 Primary blood loss ≥ 500 mL at time of birth (clinically estimated or measured).

Comparison 2 Active versus expectant management of 3rd stage of labour (women at low risk), Outcome 13 Mean maternal blood loss (mL at the time of birth, clinically estimated or measured.

Comparison 2 Active versus expectant management of 3rd stage of labour (women at low risk), Outcome 16 Maternal blood transfusion.

Comparison 2 Active versus expectant management of 3rd stage of labour (women at low risk), Outcome 18 Therapeutic uterotonics during third stage and/or within 24 hours.
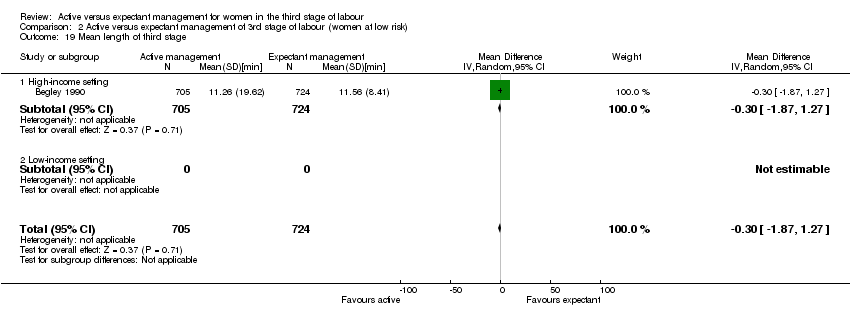
Comparison 2 Active versus expectant management of 3rd stage of labour (women at low risk), Outcome 19 Mean length of third stage.

Comparison 2 Active versus expectant management of 3rd stage of labour (women at low risk), Outcome 20 Manual removal of placenta as defined by authors.
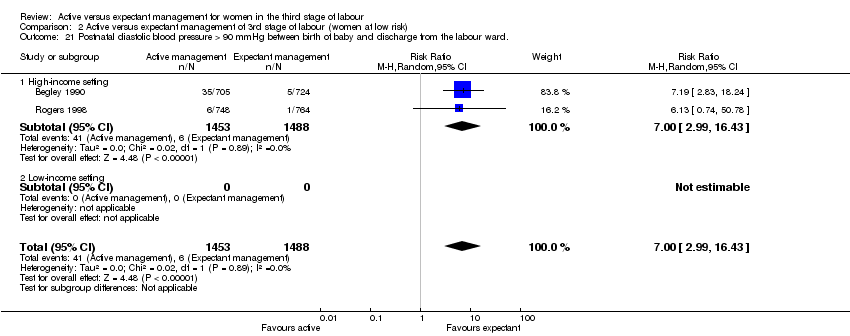
Comparison 2 Active versus expectant management of 3rd stage of labour (women at low risk), Outcome 21 Postnatal diastolic blood pressure > 90 mmHg between birth of baby and discharge from the labour ward..

Comparison 2 Active versus expectant management of 3rd stage of labour (women at low risk), Outcome 22 Postnatal vomiting between birth of baby and discharge from the labour ward..

Comparison 2 Active versus expectant management of 3rd stage of labour (women at low risk), Outcome 23 Any analgesia between birth of the baby and up to discharge from labour ward.

Comparison 2 Active versus expectant management of 3rd stage of labour (women at low risk), Outcome 25 Secondary blood loss/any vaginal bleeding needing treatment (after 24 hours and up to 6 weeks).

Comparison 2 Active versus expectant management of 3rd stage of labour (women at low risk), Outcome 27 Surgical evacuation of retained products of conception.

Comparison 2 Active versus expectant management of 3rd stage of labour (women at low risk), Outcome 28 Afterpains ‐ abdominal pain associated with the contracting uterus in the postpartum period..
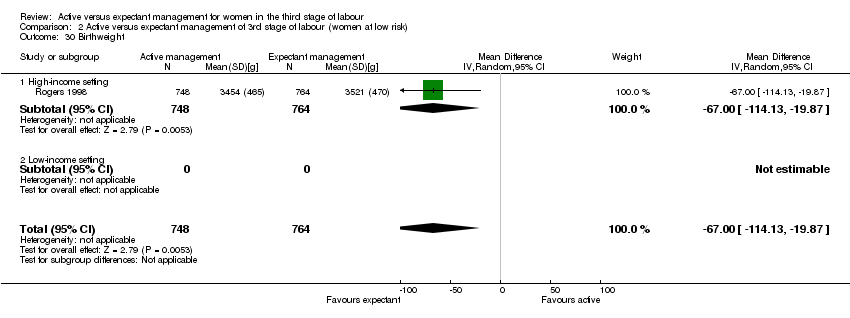
Comparison 2 Active versus expectant management of 3rd stage of labour (women at low risk), Outcome 30 Birthweight.
Comparison 2 Active versus expectant management of 3rd stage of labour (women at low risk), Outcome 40 Return to hospital as in‐ or outpatient because of bleeding (not pre‐specified).

Comparison 2 Active versus expectant management of 3rd stage of labour (women at low risk), Outcome 41 Postnatal maternal mean Hb (outcome not pre‐specified).

Comparison 10 Active versus mixed management (uterotonic after placental delivery, immediate cord clamping and no CCT) , Outcome 1 Severe primary PPH at time of birth (clinically estimated or measured blood loss ≥ 1000 mL).
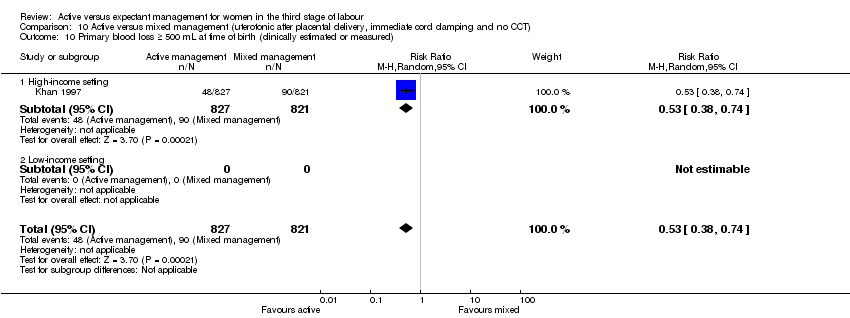
Comparison 10 Active versus mixed management (uterotonic after placental delivery, immediate cord clamping and no CCT) , Outcome 10 Primary blood loss ≥ 500 mL at time of birth (clinically estimated or measured).

Comparison 10 Active versus mixed management (uterotonic after placental delivery, immediate cord clamping and no CCT) , Outcome 16 Maternal blood transfusion.
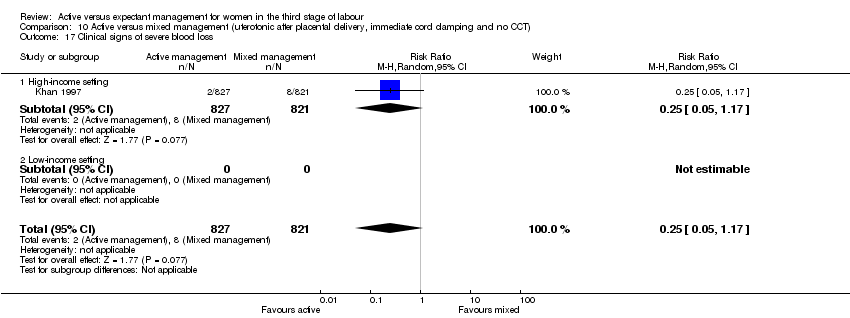
Comparison 10 Active versus mixed management (uterotonic after placental delivery, immediate cord clamping and no CCT) , Outcome 17 Clinical signs of severe blood loss.
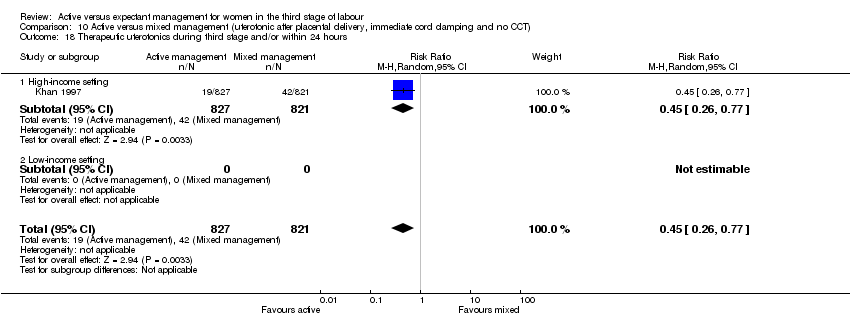
Comparison 10 Active versus mixed management (uterotonic after placental delivery, immediate cord clamping and no CCT) , Outcome 18 Therapeutic uterotonics during third stage and/or within 24 hours.

Comparison 10 Active versus mixed management (uterotonic after placental delivery, immediate cord clamping and no CCT) , Outcome 19 Mean length of third stage.

Comparison 11 Active versus mixed management (no routine uterotonic, early cord clamping, no CCT), Outcome 1 Severe primary PPH at time of birth (clinically estimated or measured blood loss ≥ 1000 mL).

Comparison 11 Active versus mixed management (no routine uterotonic, early cord clamping, no CCT), Outcome 4 Maternal Hb < 9 g/dL at 24‐72 hr.

Comparison 11 Active versus mixed management (no routine uterotonic, early cord clamping, no CCT), Outcome 10 Primary blood loss ≥ 500 mL at time of birth (clinically estimated or measured).

Comparison 11 Active versus mixed management (no routine uterotonic, early cord clamping, no CCT), Outcome 13 Mean maternal blood loss (mL) at time of birth (clinically estimated or measured).
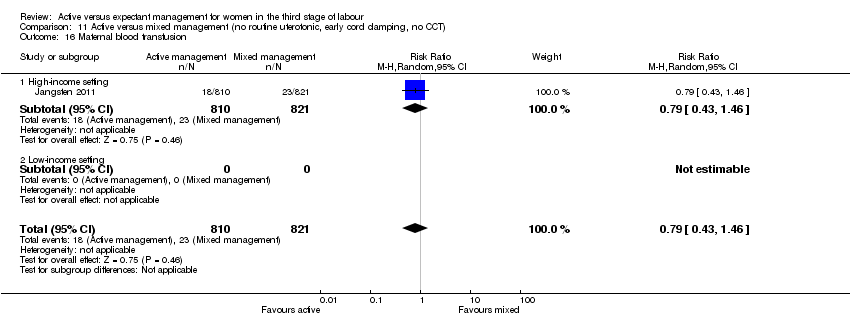
Comparison 11 Active versus mixed management (no routine uterotonic, early cord clamping, no CCT), Outcome 16 Maternal blood transfusion.

Comparison 11 Active versus mixed management (no routine uterotonic, early cord clamping, no CCT), Outcome 18 Therapeutic uterotonics during third stage and/or within 24 hours.

Comparison 11 Active versus mixed management (no routine uterotonic, early cord clamping, no CCT), Outcome 19 Mean length of third stage.

Comparison 11 Active versus mixed management (no routine uterotonic, early cord clamping, no CCT), Outcome 20 Manual removal of placenta as defined by authors.

Comparison 11 Active versus mixed management (no routine uterotonic, early cord clamping, no CCT), Outcome 28 Not prespecified: afterpains at 2 hours after birth (id 20458).

Comparison 11 Active versus mixed management (no routine uterotonic, early cord clamping, no CCT), Outcome 29 Not pre‐specified: afterpains the day after birth (id 20458).
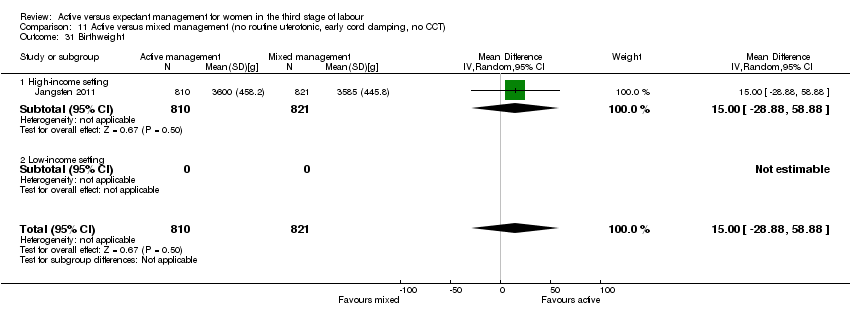
Comparison 11 Active versus mixed management (no routine uterotonic, early cord clamping, no CCT), Outcome 31 Birthweight.

Comparison 11 Active versus mixed management (no routine uterotonic, early cord clamping, no CCT), Outcome 42 Postnatal maternal mean Hb (outcome not pre‐specified).

Comparison 11 Active versus mixed management (no routine uterotonic, early cord clamping, no CCT), Outcome 43 Severe primary PPH after placental delivery and up to 2 hours (clinically estimated or measured blood loss ≥ 1000 mL) ‐ not pre‐specified.
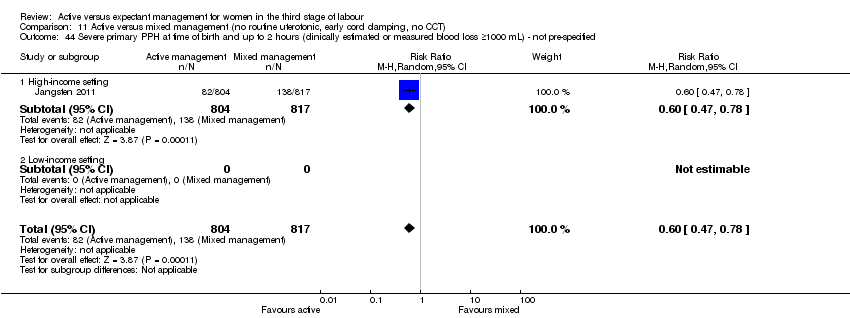
Comparison 11 Active versus mixed management (no routine uterotonic, early cord clamping, no CCT), Outcome 44 Severe primary PPH at time of birth and up to 2 hours (clinically estimated or measured blood loss ≥1000 mL) ‐ not pre‐specified.

Comparison 11 Active versus mixed management (no routine uterotonic, early cord clamping, no CCT), Outcome 45 Mean blood loss (mL) (clinically estimated or measured at birth and up to 2 hours (not pre‐specified).

Comparison 12 Active versus mixed management (no routine uterotonic, early cord clamping, CCT), Outcome 4 Maternal Hb < 9 g/dL at 24‐72 hr.

Comparison 12 Active versus mixed management (no routine uterotonic, early cord clamping, CCT), Outcome 19 Mean length of third stage.
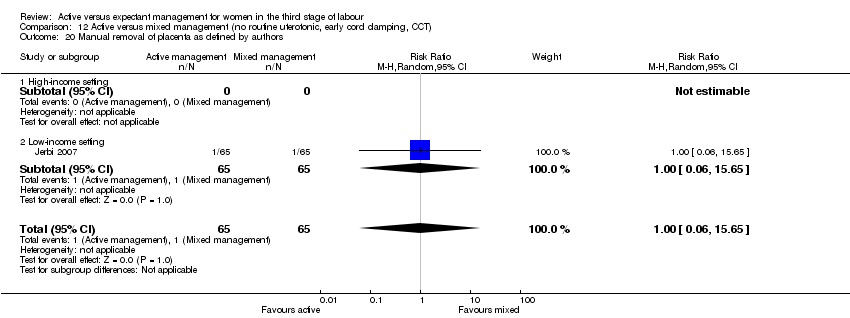
Comparison 12 Active versus mixed management (no routine uterotonic, early cord clamping, CCT), Outcome 20 Manual removal of placenta as defined by authors.
| Active versus expectant management of the third stage of labour (all women) | ||||||
| Population: all women who expected a vaginal birth at 24 weeks' gestation or later | ||||||
| Outcomes | Illustrative comparative risks* (95% CI) | Relative effect | No of Participants | Quality of the evidence | Comments | |
| Assumed risk | Corresponding risk | |||||
| Expectant management of the third stage of labour | Active management of the third stage of labour | |||||
| Severe primary postpartum haemorrhage (PPH) (clinically estimated or measured blood loss ≥ to 1000 mL at time of birth) | 24 per 1000 | 8 per 1000 | RR 0.34 | 4636 | ⊕⊝⊝⊝ | |
| Very severe primary PPH (clinically estimated or measured blood loss ≥ to 2500 mL at time of birth) | See comment | See comment | Not estimable | 0 | See comment | No data |
| Maternal mortality | See comment | See comment | Not estimable | 0 | See comment | No data |
| Maternal Hb < 9 g/dL 24 to 72 hours postpartum | 71 per 1000 | 36 per 1000 | RR 0.5 | 1572 | ⊕⊕⊝⊝ | |
| Admission to neonatal special/intensive care | 52 per 1000 | 42 per 1000 | RR 0.81 | 3207 | ⊕⊕⊝⊝ | |
| Neonatal jaundice requiring phototherapy or exchange transfusion | 49 per 1000 | 47 per 1000 | RR 0.96 | 3142 | ⊕⊝⊝⊝ | |
| Neonatal polycythaemia treated with dilutional exchange transfusion | See comment | See comment | Not estimable | 0 | See comment | No data |
| *The basis for the assumed risk (e.g. the median control group risk across studies) is provided in footnotes. The corresponding risk (and its 95% confidence interval) is based on the assumed risk in the comparison group and the relative effect of the intervention (and its 95% CI). | ||||||
| GRADE Working Group grades of evidence | ||||||
| 1Risk of bias: of the 3 trials providing data for this outcome, all 3 are at low risk of bias for sequence generation (selection bias), allocation concealment (selection bias) and for incomplete outcome data (attrition bias). 2 are at low risk of selective reporting (reporting bias) and 1 is unclear. 1 study is at high risk of other bias (see 'Risk of bias' tables). 2Risk of bias: of the 2 trials providing data for this outcome, both are at low risk of bias for sequence generation (selection bias) and allocation concealment (selection bias), 1 is at low risk of bias for incomplete outcome data (attrition bias) while the other is high‐risk. 1 is at high‐‐risk of selective reporting (reporting bias) and 1 is unclear. Both studies are at high risk of other bias (see 'Risk of bias' tables). 3Risk of bias: of the 2 trials providing data for this outcome, both are at low risk of bias for sequence generation (selection bias), allocation concealment (selection bias) and for incomplete outcome data (attrition bias). 1 is at low‐risk of selective reporting (reporting bias) and 1 is unclear. 1 study is at high risk of other bias and the other is at low risk of bias (see 'Risk of bias' tables). 4Risk of bias: Of the 2 trials providing data for this outcome, both are at low risk of bias for sequence generation (selection bias), allocation concealment (selection bias) and for incomplete outcome data (attrition bias). 1 is at low‐risk of selective reporting (reporting bias) and 1 is unclear. 1 study is at high risk of other bias and the other is at low risk of bias (see 'Risk of bias' tables). | ||||||
| Terms | Definitions used in this review | ||||||
| Expectant management of third stage of labour | 1. A prophylactic uterotonic agent is not administered; | ||||||
| Active management of third stage of labour | 1. The routine administration of a prophylactic uterotonic drug just before, with, or immediately after, the birth of the baby; | ||||||
| Mixed management of third stage of labour | A mixture of some of the components of both active and expectant management of third stage, but without exclusively containing all the components of either. There can be a number of different mixed third stage managements, for example: | ||||||
| Early prophylactic uterotonic | Prophylactic uterotonic drug administered just before, with, or immediately after, the birth of the infant. | ||||||
| Delayed prophylactic uterotonic | Prophylactic uterotonic drug administered after the cord pulsation has ceased. | ||||||
| Early cord clamping | The application of a clamp to the umbilical cord within 60 seconds of the birth of the infant (McDonald 2013). | ||||||
| Delayed cord clamping | The application of a clamp to the umbilical cord greater than 1 minute after birth or when cord pulsation has ceased (McDonald 2013). | ||||||
| Sarnat staging for hypoxic ischaemic encephalopathy (Sarnat 1976) | Stage 1 (mild): hyper‐alertness, hyper‐reflexia, dilated pupils, tachycardia, absence of seizures. Stage 2 (moderate): lethargy, hyper‐reflexia, miosis, bradycardia, seizures, hypotonia with weak suck and Moro reflexes. Stage 3 (severe): stupor, flaccidity, small to mid‐position pupils which react poorly to light, decreased stretch reflexes, hypothermia and absent Moro. | ||||||
| Active management protocol | Expectant management protocol | Active management used | Expectant management used | |
| (Bristol trial) | • IM syntometrine (5 units oxytocin + 0.5 mg ergometrine) (IM 10 units oxytocin if raised BP) Immediately after birth of anterior shoulder. • Clamp cord 30 seconds after birth. • CCT when uterus contracted. | • Try not to give oxytocic. • Try to leave cord attached to baby until placenta delivered. • Try not to use CCT or any manual interference with uterus at the fundus. • Encourage mother to adopt posture aiding delivery with gravity. • If placenta not delivered spontaneously wait, try putting baby to breast, and encourage maternal effort as above. | • Full active management (99%). • 99% cord clamped and cut before delivery of placenta. • 99% CCT. • 217 (26%) upright.
| • Full expectant management 403 (48%). • Full active management 168 (20%). • 278 (32%) had mixed management. • Cord left unclamped till pulsation ceased 48%. • Placenta delivered by maternal effort 60% and CCT 40%. • 416 (49%) upright. • 30% received uterotonic for treatment. |
| (Dublin trial) | • IV ergometrine 0.5 mg immediately following birth. • Try to clamp cord within 30 seconds. • When uterus contracted, attempt CCT. • Try not to give any special instructions re posture.
| • No oxytocic drug routinely. • Try to leave cord attached to baby until pulsation has ceased. • Placenta may be delivered by maternal effort or gentle controlled cord traction once separated. • Encourage mother to breastfeed. Help her to kneel/sit/squat. | • All given IV ergometrine before delivery of placenta. • 89% cord clamped and cut. • 93% CCT and 5% maternal effort. • 7% upright and 93% recumbent. | • 14% were given ergometrine for treatment, not prophylactically, 6 (0.83%) before placenta delivered. • Cord left unclamped till pulsation ceased 42%. • Placenta delivered by maternal effort 32% and gentle CCT 66%. • 11% upright. |
| (Hinchingbrooke trial) | •IM syntometrine (5 units oxytocin + 0.5 mg ergometrine) (IM 10 units oxytocin if raised blood pressure). • As soon as possible after birth of anterior shoulder (within 2 minutes of birth). • Immediate cord clamping and cutting. • CCT or maternal effort. • Women randomised to upright and recumbent in both arms. | • No uterotonic drug. • No cord clamping until after pulsation ceased. • Delivery of placenta within 1 hour by maternal effort. | • 699 (93.4%) had full active management. • 2 (0.3%) had fully expectant management. • 47 (6.2%) had mixed. • 95% given prophylactic uterotonic before delivery of placenta. • 93% cord clamped before pulsation ceased. • 46% CCT. • 44% upright (when placenta delivered). | • 488 (63.9%) had full expectant management. • 19 (2.5%) had fully active management. • 257 (33.6%) had mixed. • 21% received oxytocic for treatment, 2.5% prophylactically. • Cord left unclamped till pulsation ceased 70%. • Placenta delivered by CCT 12%. • 43% upright (when placenta delivered). |
| Thilaganathan 1993(Brighton trial) | • Syntometrine 1 mL (IM or IV, route not specified). • As soon as baby born. • Cord was “immediately clamped”. • Placenta delivered with CCT.
| • No oxytocic. • Cord not cut or clamped until after pulsation ceased (unless there were contraindications). • Deliver placenta by maternal effort after signs of separation. “when the placenta could be felt in the vagina, the midwife could then assist delivery of the placenta”. • Upright position encouraged. | • No information. | • No information. |
| (Abu Dhabi trial) | • IM oxytocin 10 units at delivery of anterior shoulder. • Immediate cord clamping and cutting. • CCT as soon as the uterus was contracted firmly ‐ repeated every 2‐3 minutes.
| • No oxytocic prior to delivery of placenta. • Cord clamped and cut after delivery. • No CCT. • No fundal massage. • Maternal expulsion after signs of separation. • IV infusion of oxytocin 10 units in 500 mL normal saline given slowly. | • No information. | • No information. |
| BP: blood pressure | ||||
| Outcome or subgroup title | No. of studies | No. of participants | Statistical method | Effect size |
| 1 Severe primary postpartum haemorrhage (PPH) at time of birth (clinically estimated or measured blood loss ≥ 1000 mL) Show forest plot | 3 | 4636 | Risk Ratio (M‐H, Random, 95% CI) | 0.34 [0.14, 0.87] |
| 1.1 High‐income setting | 3 | 4636 | Risk Ratio (M‐H, Random, 95% CI) | 0.34 [0.14, 0.87] |
| 1.2 Low‐income setting | 0 | 0 | Risk Ratio (M‐H, Random, 95% CI) | 0.0 [0.0, 0.0] |
| 2 Very severe primary PPH at time of birth (clinically estimated or measured blood loss ≥ 2500 mL) | 0 | 0 | Risk Ratio (M‐H, Random, 95% CI) | 0.0 [0.0, 0.0] |
| 2.1 High‐income setting | 0 | 0 | Risk Ratio (M‐H, Random, 95% CI) | 0.0 [0.0, 0.0] |
| 2.2 Low‐income setting | 0 | 0 | Risk Ratio (M‐H, Random, 95% CI) | 0.0 [0.0, 0.0] |
| 3 Maternal mortality | 0 | 0 | Risk Ratio (M‐H, Random, 95% CI) | 0.0 [0.0, 0.0] |
| 3.1 High‐income setting | 0 | 0 | Risk Ratio (M‐H, Random, 95% CI) | 0.0 [0.0, 0.0] |
| 3.2 Low‐income setting | 0 | 0 | Risk Ratio (M‐H, Random, 95% CI) | 0.0 [0.0, 0.0] |
| 4 Maternal Hb < 9 g/dL 24‐72 hours postpartum Show forest plot | 2 | 1572 | Risk Ratio (M‐H, Random, 95% CI) | 0.50 [0.30, 0.83] |
| 4.1 High‐income setting | 2 | 1572 | Risk Ratio (M‐H, Random, 95% CI) | 0.50 [0.30, 0.83] |
| 4.2 Low‐income setting | 0 | 0 | Risk Ratio (M‐H, Random, 95% CI) | 0.0 [0.0, 0.0] |
| 5 Admission to neonatal special/intensive care Show forest plot | 2 | 3207 | Risk Ratio (M‐H, Random, 95% CI) | 0.81 [0.60, 1.11] |
| 5.1 High‐income setting | 2 | 3207 | Risk Ratio (M‐H, Random, 95% CI) | 0.81 [0.60, 1.11] |
| 5.2 Low‐income setting | 0 | 0 | Risk Ratio (M‐H, Random, 95% CI) | 0.0 [0.0, 0.0] |
| 6 Neonatal jaundice requiring phototherapy or exchange transfusion Show forest plot | 2 | 3142 | Risk Ratio (M‐H, Random, 95% CI) | 0.96 [0.55, 1.68] |
| 6.1 High‐income setting | 2 | 3142 | Risk Ratio (M‐H, Random, 95% CI) | 0.96 [0.55, 1.68] |
| 6.2 Low‐income setting | 0 | 0 | Risk Ratio (M‐H, Random, 95% CI) | 0.0 [0.0, 0.0] |
| 7 Neonatal polycythaemia treated with dilutional exchange transfusion | 0 | 0 | Risk Ratio (M‐H, Random, 95% CI) | 0.0 [0.0, 0.0] |
| 7.1 High‐income setting | 0 | 0 | Risk Ratio (M‐H, Random, 95% CI) | 0.0 [0.0, 0.0] |
| 7.2 Low‐income setting | 0 | 0 | Risk Ratio (M‐H, Random, 95% CI) | 0.0 [0.0, 0.0] |
| 8 Severe primary PPH after placental delivery and up to 24 hours (clinically estimated or measured blood loss ≥ 1000 mL) | 0 | 0 | Risk Ratio (M‐H, Random, 95% CI) | 0.0 [0.0, 0.0] |
| 8.1 High‐income setting | 0 | 0 | Risk Ratio (M‐H, Random, 95% CI) | 0.0 [0.0, 0.0] |
| 8.2 Low‐income setting | 0 | 0 | Risk Ratio (M‐H, Random, 95% CI) | 0.0 [0.0, 0.0] |
| 9 Severe primary PPH at time of birth and up to 24 hours (clinically estimated or measured blood loss ≥ 1000 mL) | 0 | 0 | Risk Ratio (M‐H, Random, 95% CI) | 0.0 [0.0, 0.0] |
| 9.1 High‐income setting | 0 | 0 | Risk Ratio (M‐H, Random, 95% CI) | 0.0 [0.0, 0.0] |
| 9.2 Low‐income setting | 0 | 0 | Risk Ratio (M‐H, Random, 95% CI) | 0.0 [0.0, 0.0] |
| 10 Primary blood loss ≥ 500 mL at time of birth (clinically estimated or measured) Show forest plot | 3 | 4636 | Risk Ratio (M‐H, Random, 95% CI) | 0.34 [0.27, 0.44] |
| 10.1 High‐income setting | 3 | 4636 | Risk Ratio (M‐H, Random, 95% CI) | 0.34 [0.27, 0.44] |
| 10.2 Low‐income setting | 0 | 0 | Risk Ratio (M‐H, Random, 95% CI) | 0.0 [0.0, 0.0] |
| 11 Primary blood loss ≥ 500 mL after delivery of placenta and up to 24 hours (clinically estimated or measured) | 0 | 0 | Risk Ratio (M‐H, Random, 95% CI) | 0.0 [0.0, 0.0] |
| 11.1 High‐income setting | 0 | 0 | Risk Ratio (M‐H, Random, 95% CI) | 0.0 [0.0, 0.0] |
| 11.2 Low‐income setting | 0 | 0 | Risk Ratio (M‐H, Random, 95% CI) | 0.0 [0.0, 0.0] |
| 12 Primary blood loss ≥ 500 mL at time of birth and up to 24 hours (clinically estimated or measured) | 0 | 0 | Risk Ratio (M‐H, Random, 95% CI) | 0.0 [0.0, 0.0] |
| 12.1 High‐income setting | 0 | 0 | Risk Ratio (M‐H, Random, 95% CI) | 0.0 [0.0, 0.0] |
| 12.2 Low‐income setting | 0 | 0 | Risk Ratio (M‐H, Random, 95% CI) | 0.0 [0.0, 0.0] |
| 13 Mean maternal blood loss (mL) at time of birth (clinically estimated or measured) Show forest plot | 2 | 2941 | Mean Difference (IV, Random, 95% CI) | ‐78.80 [‐95.96, ‐61.64] |
| 13.1 High‐income setting | 2 | 2941 | Mean Difference (IV, Random, 95% CI) | ‐78.80 [‐95.96, ‐61.64] |
| 13.2 Low‐income setting | 0 | 0 | Mean Difference (IV, Random, 95% CI) | 0.0 [0.0, 0.0] |
| 14 Mean maternal blood loss (mL) after delivery of placenta and up to 24 hours (clinically estimated or measured) | 0 | 0 | Mean Difference (IV, Random, 95% CI) | 0.0 [0.0, 0.0] |
| 14.1 High‐income setting | 0 | 0 | Mean Difference (IV, Random, 95% CI) | 0.0 [0.0, 0.0] |
| 14.2 Low‐income setting | 0 | 0 | Mean Difference (IV, Random, 95% CI) | 0.0 [0.0, 0.0] |
| 15 Mean maternal blood loss (mL at time of birth and up to 24 hours (clinically estimated or measured) | 0 | 0 | Mean Difference (IV, Random, 95% CI) | 0.0 [0.0, 0.0] |
| 15.1 High‐income setting | 0 | 0 | Mean Difference (IV, Random, 95% CI) | 0.0 [0.0, 0.0] |
| 15.2 Low‐income setting | 0 | 0 | Mean Difference (IV, Random, 95% CI) | 0.0 [0.0, 0.0] |
| 16 Maternal blood transfusion Show forest plot | 4 | 4829 | Risk Ratio (M‐H, Random, 95% CI) | 0.35 [0.22, 0.55] |
| 16.1 High‐income setting | 4 | 4829 | Risk Ratio (M‐H, Random, 95% CI) | 0.35 [0.22, 0.55] |
| 16.2 Low‐income setting | 0 | 0 | Risk Ratio (M‐H, Random, 95% CI) | 0.0 [0.0, 0.0] |
| 17 Clinical signs of severe blood loss | 0 | 0 | Risk Ratio (M‐H, Random, 95% CI) | 0.0 [0.0, 0.0] |
| 17.1 High‐income setting | 0 | 0 | Risk Ratio (M‐H, Random, 95% CI) | 0.0 [0.0, 0.0] |
| 17.2 Low‐income setting | 0 | 0 | Risk Ratio (M‐H, Random, 95% CI) | 0.0 [0.0, 0.0] |
| 18 Therapeutic uterotonics during third stage and/or within 24 hours Show forest plot | 4 | 4829 | Risk Ratio (M‐H, Random, 95% CI) | 0.19 [0.15, 0.23] |
| 18.1 High‐income setting | 4 | 4829 | Risk Ratio (M‐H, Random, 95% CI) | 0.19 [0.15, 0.23] |
| 18.2 Low‐income setting | 0 | 0 | Risk Ratio (M‐H, Random, 95% CI) | 0.0 [0.0, 0.0] |
| 19 Mean length of third stage Show forest plot | 1 | 1429 | Mean Difference (IV, Random, 95% CI) | ‐0.30 [‐1.87, 1.27] |
| 19.1 High‐income setting | 1 | 1429 | Mean Difference (IV, Random, 95% CI) | ‐0.30 [‐1.87, 1.27] |
| 19.2 Low‐income setting | 0 | 0 | Mean Difference (IV, Random, 95% CI) | 0.0 [0.0, 0.0] |
| 20 Manual removal of placenta as defined by authors Show forest plot | 4 | 4829 | Risk Ratio (M‐H, Random, 95% CI) | 1.78 [0.57, 5.56] |
| 20.1 High‐income setting | 4 | 4829 | Risk Ratio (M‐H, Random, 95% CI) | 1.78 [0.57, 5.56] |
| 20.2 Low‐income setting | 0 | 0 | Risk Ratio (M‐H, Random, 95% CI) | 0.0 [0.0, 0.0] |
| 21 Postnatal diastolic blood pressure > 90 mmHg between birth of baby and discharge from the labour ward. Show forest plot | 3 | 4636 | Risk Ratio (M‐H, Random, 95% CI) | 4.10 [1.63, 10.30] |
| 21.1 High‐income setting | 3 | 4636 | Risk Ratio (M‐H, Random, 95% CI) | 4.10 [1.63, 10.30] |
| 21.2 Low‐income setting | 0 | 0 | Risk Ratio (M‐H, Random, 95% CI) | 0.0 [0.0, 0.0] |
| 22 Postnatal vomiting between birth of baby and discharge from the labour ward. Show forest plot | 3 | 4636 | Risk Ratio (M‐H, Random, 95% CI) | 2.47 [1.36, 4.48] |
| 22.1 High‐income setting | 3 | 4636 | Risk Ratio (M‐H, Random, 95% CI) | 2.47 [1.36, 4.48] |
| 22.2 Low‐income setting | 0 | 0 | Risk Ratio (M‐H, Random, 95% CI) | 0.0 [0.0, 0.0] |
| 23 Any analgesia between birth of the baby and discharge from labour ward Show forest plot | 1 | 1429 | Risk Ratio (M‐H, Random, 95% CI) | 2.53 [1.34, 4.78] |
| 23.1 High‐income setting | 1 | 1429 | Risk Ratio (M‐H, Random, 95% CI) | 2.53 [1.34, 4.78] |
| 23.2 Low‐income setting | 0 | 0 | Risk Ratio (M‐H, Random, 95% CI) | 0.0 [0.0, 0.0] |
| 24 Women's assessment of pain during third stage as reported by authors. | 0 | 0 | Risk Ratio (M‐H, Random, 95% CI) | 0.0 [0.0, 0.0] |
| 24.1 High‐income setting | 0 | 0 | Risk Ratio (M‐H, Random, 95% CI) | 0.0 [0.0, 0.0] |
| 24.2 Low‐income setting | 0 | 0 | Risk Ratio (M‐H, Random, 95% CI) | 0.0 [0.0, 0.0] |
| 25 Secondary blood loss/any vaginal bleeding needing treatment (after 24 hours and up to 6 weeks) Show forest plot | 3 | 4636 | Risk Ratio (M‐H, Random, 95% CI) | 1.10 [0.40, 2.99] |
| 25.1 High‐income setting | 3 | 4636 | Risk Ratio (M‐H, Random, 95% CI) | 1.10 [0.40, 2.99] |
| 25.2 Low‐income setting | 0 | 0 | Risk Ratio (M‐H, Random, 95% CI) | 0.0 [0.0, 0.0] |
| 26 Amount of lochia either estimated or measured after 24 hours and up to discharge from hospital. | 0 | 0 | Mean Difference (IV, Random, 95% CI) | 0.0 [0.0, 0.0] |
| 26.1 High‐income setting | 0 | 0 | Mean Difference (IV, Random, 95% CI) | 0.0 [0.0, 0.0] |
| 26.2 Low‐income setting | 0 | 0 | Mean Difference (IV, Random, 95% CI) | 0.0 [0.0, 0.0] |
| 27 Surgical evacuation of retained products of conception Show forest plot | 3 | 4636 | Risk Ratio (M‐H, Random, 95% CI) | 0.74 [0.32, 1.71] |
| 27.1 High‐income setting | 3 | 4636 | Risk Ratio (M‐H, Random, 95% CI) | 0.74 [0.32, 1.71] |
| 27.2 Low‐income setting | 0 | 0 | Risk Ratio (M‐H, Random, 95% CI) | 0.0 [0.0, 0.0] |
| 28 Afterpains ‐ abdominal pain associated with the contracting uterus in the postpartum period. Show forest plot | 1 | 1429 | Risk Ratio (M‐H, Random, 95% CI) | 2.53 [1.34, 4.78] |
| 28.1 High‐income setting | 1 | 1429 | Risk Ratio (M‐H, Random, 95% CI) | 2.53 [1.34, 4.78] |
| 28.2 Low‐income setting | 0 | 0 | Risk Ratio (M‐H, Random, 95% CI) | 0.0 [0.0, 0.0] |
| 29 Apgar score < 7 at 5 minutes Show forest plot | 1 | 1695 | Risk Ratio (M‐H, Random, 95% CI) | 1.00 [0.38, 2.66] |
| 29.1 High‐income setting | 1 | 1695 | Risk Ratio (M‐H, Random, 95% CI) | 1.00 [0.38, 2.66] |
| 29.2 Low‐income setting | 0 | 0 | Risk Ratio (M‐H, Random, 95% CI) | 0.0 [0.0, 0.0] |
| 30 Birthweight Show forest plot | 2 | 3207 | Mean Difference (IV, Random, 95% CI) | ‐76.90 [‐108.51, ‐45.30] |
| 30.1 High‐income setting | 2 | 3207 | Mean Difference (IV, Random, 95% CI) | ‐76.90 [‐108.51, ‐45.30] |
| 30.2 Low‐income setting | 0 | 0 | Mean Difference (IV, Random, 95% CI) | 0.0 [0.0, 0.0] |
| 31 Neonatal encephalopathy assessed using Sarnat staging (Sarnat 1976; Table 1). | 0 | 0 | Risk Ratio (M‐H, Random, 95% CI) | 0.0 [0.0, 0.0] |
| 31.1 High‐income setting | 0 | 0 | Risk Ratio (M‐H, Random, 95% CI) | 0.0 [0.0, 0.0] |
| 31.2 Low‐income setting | 0 | 0 | Risk Ratio (M‐H, Random, 95% CI) | 0.0 [0.0, 0.0] |
| 32 Neonatal mortality | 0 | 0 | Risk Ratio (M‐H, Random, 95% CI) | 0.0 [0.0, 0.0] |
| 32.1 High‐income setting | 0 | 0 | Risk Ratio (M‐H, Random, 95% CI) | 0.0 [0.0, 0.0] |
| 32.2 Low‐income setting | 0 | 0 | Risk Ratio (M‐H, Random, 95% CI) | 0.0 [0.0, 0.0] |
| 33 Intraventricular haemorrhage ‐ Papille grade III/IV ‐ (for infants born before 34 weeks' gestation only). | 0 | 0 | Risk Ratio (M‐H, Random, 95% CI) | 0.0 [0.0, 0.0] |
| 33.1 High‐income setting | 0 | 0 | Risk Ratio (M‐H, Random, 95% CI) | 0.0 [0.0, 0.0] |
| 33.2 Low‐income setting | 0 | 0 | Risk Ratio (M‐H, Random, 95% CI) | 0.0 [0.0, 0.0] |
| 34 Number of infants who received a red blood cell transfusion. | 0 | 0 | Risk Ratio (M‐H, Random, 95% CI) | 0.0 [0.0, 0.0] |
| 34.1 High‐income setting | 0 | 0 | Risk Ratio (M‐H, Random, 95% CI) | 0.0 [0.0, 0.0] |
| 34.2 Low‐income setting | 0 | 0 | Risk Ratio (M‐H, Random, 95% CI) | 0.0 [0.0, 0.0] |
| 35 Infant Hb level at 24 to 72 hours | 0 | 0 | Mean Difference (IV, Random, 95% CI) | 0.0 [0.0, 0.0] |
| 35.1 High‐income setting | 0 | 0 | Mean Difference (IV, Random, 95% CI) | 0.0 [0.0, 0.0] |
| 35.2 Low‐income setting | 0 | 0 | Mean Difference (IV, Random, 95% CI) | 0.0 [0.0, 0.0] |
| 36 Infant Hb level at 3‐6 months | 0 | 0 | Mean Difference (IV, Random, 95% CI) | 0.0 [0.0, 0.0] |
| 36.1 High‐income setting | 0 | 0 | Mean Difference (IV, Random, 95% CI) | 0.0 [0.0, 0.0] |
| 36.2 Low‐income setting | 0 | 0 | Mean Difference (IV, Random, 95% CI) | 0.0 [0.0, 0.0] |
| 37 Infant iron indices (ferritin) at 3 to 6 months. | 0 | 0 | Risk Ratio (M‐H, Random, 95% CI) | 0.0 [0.0, 0.0] |
| 37.1 High‐income setting | 0 | 0 | Risk Ratio (M‐H, Random, 95% CI) | 0.0 [0.0, 0.0] |
| 37.2 Low‐income setting | 0 | 0 | Risk Ratio (M‐H, Random, 95% CI) | 0.0 [0.0, 0.0] |
| 38 Exclusive breastfeeding at discharge from hospital Show forest plot | 1 | 1695 | Risk Ratio (M‐H, Random, 95% CI) | 1.01 [0.96, 1.07] |
| 38.1 High‐income setting | 1 | 1695 | Risk Ratio (M‐H, Random, 95% CI) | 1.01 [0.96, 1.07] |
| 38.2 Low‐income setting | 0 | 0 | Risk Ratio (M‐H, Random, 95% CI) | 0.0 [0.0, 0.0] |
| 39 Neurodevelopmental, cognitive or developmental outcomes assessed after age 18 months. | 0 | 0 | Risk Ratio (M‐H, Random, 95% CI) | 0.0 [0.0, 0.0] |
| 39.1 High‐income setting | 0 | 0 | Risk Ratio (M‐H, Random, 95% CI) | 0.0 [0.0, 0.0] |
| 39.2 Low‐income setting | 0 | 0 | Risk Ratio (M‐H, Random, 95% CI) | 0.0 [0.0, 0.0] |
| 40 Return to hospital as in‐ or outpatient because of bleeding (not pre‐specified) Show forest plot | 2 | 2941 | Risk Ratio (M‐H, Random, 95% CI) | 2.21 [1.29, 3.79] |
| 40.1 High‐income setting | 2 | 2941 | Risk Ratio (M‐H, Random, 95% CI) | 2.21 [1.29, 3.79] |
| 40.2 Low‐income setting | 0 | 0 | Risk Ratio (M‐H, Random, 95% CI) | 0.0 [0.0, 0.0] |
| 41 Postnatal maternal mean Hb (outcome not pre‐specified) Show forest plot | 3 | 4062 | Mean Difference (IV, Random, 95% CI) | 0.52 [0.44, 0.60] |
| 41.1 High‐income setting | 3 | 4062 | Mean Difference (IV, Random, 95% CI) | 0.52 [0.44, 0.60] |
| 41.2 Low‐income setting | 0 | 0 | Mean Difference (IV, Random, 95% CI) | 0.0 [0.0, 0.0] |
| Outcome or subgroup title | No. of studies | No. of participants | Statistical method | Effect size |
| 1 Severe primary PPH at time of birth (clinically estimated or measured blood loss ≥ 1000 mL) Show forest plot | 2 | 2941 | Risk Ratio (M‐H, Random, 95% CI) | 0.31 [0.05, 2.17] |
| 1.1 High‐income setting | 2 | 2941 | Risk Ratio (M‐H, Random, 95% CI) | 0.31 [0.05, 2.17] |
| 1.2 Low‐income setting | 0 | 0 | Risk Ratio (M‐H, Random, 95% CI) | 0.0 [0.0, 0.0] |
| 2 Very severe primary PPH at time of birth (clinically estimated or measured blood loss ≥ 2500 mL) | 0 | 0 | Risk Ratio (M‐H, Random, 95% CI) | 0.0 [0.0, 0.0] |
| 2.1 High‐income setting | 0 | 0 | Risk Ratio (M‐H, Random, 95% CI) | 0.0 [0.0, 0.0] |
| 2.2 Low‐income setting | 0 | 0 | Risk Ratio (M‐H, Random, 95% CI) | 0.0 [0.0, 0.0] |
| 3 Maternal mortality | 0 | 0 | Risk Ratio (M‐H, Random, 95% CI) | 0.0 [0.0, 0.0] |
| 3.1 High‐income setting | 0 | 0 | Risk Ratio (M‐H, Random, 95% CI) | 0.0 [0.0, 0.0] |
| 3.2 Low‐income setting | 0 | 0 | Risk Ratio (M‐H, Random, 95% CI) | 0.0 [0.0, 0.0] |
| 4 Maternal Hb < 9 g/dL at 24‐72 hr Show forest plot | 1 | 193 | Risk Ratio (M‐H, Random, 95% CI) | 0.17 [0.02, 1.47] |
| 4.1 High‐income setting | 1 | 193 | Risk Ratio (M‐H, Random, 95% CI) | 0.17 [0.02, 1.47] |
| 4.2 Low‐income setting | 0 | 0 | Risk Ratio (M‐H, Random, 95% CI) | 0.0 [0.0, 0.0] |
| 5 Admission to neonatal special/intensive care Show forest plot | 1 | 1512 | Risk Ratio (M‐H, Random, 95% CI) | 1.02 [0.55, 1.88] |
| 5.1 High‐income setting | 1 | 1512 | Risk Ratio (M‐H, Random, 95% CI) | 1.02 [0.55, 1.88] |
| 5.2 Low‐income setting | 0 | 0 | Risk Ratio (M‐H, Random, 95% CI) | 0.0 [0.0, 0.0] |
| 6 Neonatal jaundice requiring phototherapy or exchange transfusion Show forest plot | 1 | 1447 | Risk Ratio (M‐H, Random, 95% CI) | 1.31 [0.78, 2.18] |
| 6.1 High‐income setting | 1 | 1447 | Risk Ratio (M‐H, Random, 95% CI) | 1.31 [0.78, 2.18] |
| 6.2 Low‐income setting | 0 | 0 | Risk Ratio (M‐H, Random, 95% CI) | 0.0 [0.0, 0.0] |
| 7 Neonatal polycythaemia treated with dilutional exchange transfusion | 0 | 0 | Risk Ratio (M‐H, Random, 95% CI) | 0.0 [0.0, 0.0] |
| 7.1 High‐income setting | 0 | 0 | Risk Ratio (M‐H, Random, 95% CI) | 0.0 [0.0, 0.0] |
| 7.2 Low‐income setting | 0 | 0 | Risk Ratio (M‐H, Random, 95% CI) | 0.0 [0.0, 0.0] |
| 8 Severe primary PPH after placental delivery and up to 24 hours (clinically estimated or measured blood loss ≥ 1000 mL) | 0 | 0 | Risk Ratio (M‐H, Random, 95% CI) | 0.0 [0.0, 0.0] |
| 8.1 High‐income setting | 0 | 0 | Risk Ratio (M‐H, Random, 95% CI) | 0.0 [0.0, 0.0] |
| 8.2 Low‐income setting | 0 | 0 | Risk Ratio (M‐H, Random, 95% CI) | 0.0 [0.0, 0.0] |
| 9 Severe primary PPH at time of birth and up to 24 hours (clinically estimated or measured blood loss ≥ 1000 mL) | 0 | 0 | Risk Ratio (M‐H, Random, 95% CI) | 0.0 [0.0, 0.0] |
| 9.1 High‐income setting | 0 | 0 | Risk Ratio (M‐H, Random, 95% CI) | 0.0 [0.0, 0.0] |
| 9.2 Low‐income setting | 0 | 0 | Risk Ratio (M‐H, Random, 95% CI) | 0.0 [0.0, 0.0] |
| 10 Primary blood loss ≥ 500 mL at time of birth (clinically estimated or measured) Show forest plot | 2 | 2941 | Risk Ratio (M‐H, Random, 95% CI) | 0.33 [0.20, 0.56] |
| 10.1 High‐income setting | 2 | 2941 | Risk Ratio (M‐H, Random, 95% CI) | 0.33 [0.20, 0.56] |
| 10.2 Low‐income setting | 0 | 0 | Risk Ratio (M‐H, Random, 95% CI) | 0.0 [0.0, 0.0] |
| 11 Primary blood loss ≥ 500 mL after delivery of placenta and up to 24 hours (clinically estimated or measured) | 0 | 0 | Risk Ratio (M‐H, Random, 95% CI) | 0.0 [0.0, 0.0] |
| 11.1 High‐income setting | 0 | 0 | Risk Ratio (M‐H, Random, 95% CI) | 0.0 [0.0, 0.0] |
| 11.2 Low‐income setting | 0 | 0 | Risk Ratio (M‐H, Random, 95% CI) | 0.0 [0.0, 0.0] |
| 12 Primary blood loss ≥ 500 mL at time of birth and up to 24 hours (clinically estimated or measured) | 0 | 0 | Risk Ratio (M‐H, Random, 95% CI) | 0.0 [0.0, 0.0] |
| 12.1 High‐income setting | 0 | 0 | Risk Ratio (M‐H, Random, 95% CI) | 0.0 [0.0, 0.0] |
| 12.2 Low‐income setting | 0 | 0 | Risk Ratio (M‐H, Random, 95% CI) | 0.0 [0.0, 0.0] |
| 13 Mean maternal blood loss (mL at the time of birth, clinically estimated or measured Show forest plot | 2 | 2941 | Mean Difference (IV, Random, 95% CI) | ‐78.80 [‐95.96, ‐61.64] |
| 13.1 High‐income setting | 2 | 2941 | Mean Difference (IV, Random, 95% CI) | ‐78.80 [‐95.96, ‐61.64] |
| 13.2 Low‐income setting | 0 | 0 | Mean Difference (IV, Random, 95% CI) | 0.0 [0.0, 0.0] |
| 14 Mean maternal blood loss (mL) after delivery of placenta and up to 24 hours (clinically estimated or measured) | 0 | 0 | Mean Difference (IV, Random, 95% CI) | 0.0 [0.0, 0.0] |
| 14.1 High‐income setting | 0 | 0 | Mean Difference (IV, Random, 95% CI) | 0.0 [0.0, 0.0] |
| 14.2 Low‐income setting | 0 | 0 | Mean Difference (IV, Random, 95% CI) | 0.0 [0.0, 0.0] |
| 15 Mean maternal blood loss (mL) at time of birth and up to 24 hours (clinically estimated or measured) | 0 | 0 | Mean Difference (IV, Random, 95% CI) | 0.0 [0.0, 0.0] |
| 15.1 High‐income setting | 0 | 0 | Mean Difference (IV, Random, 95% CI) | 0.0 [0.0, 0.0] |
| 15.2 Low‐income setting | 0 | 0 | Mean Difference (IV, Random, 95% CI) | 0.0 [0.0, 0.0] |
| 16 Maternal blood transfusion Show forest plot | 3 | 3134 | Risk Ratio (M‐H, Random, 95% CI) | 0.30 [0.10, 0.88] |
| 16.1 High‐income setting | 3 | 3134 | Risk Ratio (M‐H, Random, 95% CI) | 0.30 [0.10, 0.88] |
| 16.2 Low‐income setting | 0 | 0 | Risk Ratio (M‐H, Random, 95% CI) | 0.0 [0.0, 0.0] |
| 17 Clinical signs of severe blood loss | 0 | 0 | Risk Ratio (M‐H, Random, 95% CI) | 0.0 [0.0, 0.0] |
| 17.1 High‐income setting | 0 | 0 | Risk Ratio (M‐H, Random, 95% CI) | 0.0 [0.0, 0.0] |
| 17.2 Low‐income setting | 0 | 0 | Risk Ratio (M‐H, Random, 95% CI) | 0.0 [0.0, 0.0] |
| 18 Therapeutic uterotonics during third stage and/or within 24 hours Show forest plot | 3 | 3134 | Risk Ratio (M‐H, Random, 95% CI) | 0.15 [0.11, 0.21] |
| 18.1 High‐income setting | 3 | 3134 | Risk Ratio (M‐H, Random, 95% CI) | 0.15 [0.11, 0.21] |
| 18.2 Low‐income setting | 0 | 0 | Risk Ratio (M‐H, Random, 95% CI) | 0.0 [0.0, 0.0] |
| 19 Mean length of third stage Show forest plot | 1 | 1429 | Mean Difference (IV, Random, 95% CI) | ‐0.30 [‐1.87, 1.27] |
| 19.1 High‐income setting | 1 | 1429 | Mean Difference (IV, Random, 95% CI) | ‐0.30 [‐1.87, 1.27] |
| 19.2 Low‐income setting | 0 | 0 | Mean Difference (IV, Random, 95% CI) | 0.0 [0.0, 0.0] |
| 20 Manual removal of placenta as defined by authors Show forest plot | 3 | 3134 | Risk Ratio (M‐H, Random, 95% CI) | 3.58 [0.42, 30.61] |
| 20.1 High‐income setting | 3 | 3134 | Risk Ratio (M‐H, Random, 95% CI) | 3.58 [0.42, 30.61] |
| 20.2 Low‐income setting | 0 | 0 | Risk Ratio (M‐H, Random, 95% CI) | 0.0 [0.0, 0.0] |
| 21 Postnatal diastolic blood pressure > 90 mmHg between birth of baby and discharge from the labour ward. Show forest plot | 2 | 2941 | Risk Ratio (M‐H, Random, 95% CI) | 7.00 [2.99, 16.43] |
| 21.1 High‐income setting | 2 | 2941 | Risk Ratio (M‐H, Random, 95% CI) | 7.00 [2.99, 16.43] |
| 21.2 Low‐income setting | 0 | 0 | Risk Ratio (M‐H, Random, 95% CI) | 0.0 [0.0, 0.0] |
| 22 Postnatal vomiting between birth of baby and discharge from the labour ward. Show forest plot | 2 | 2941 | Risk Ratio (M‐H, Random, 95% CI) | 5.63 [0.69, 46.08] |
| 22.1 High‐income setting | 2 | 2941 | Risk Ratio (M‐H, Random, 95% CI) | 5.63 [0.69, 46.08] |
| 22.2 Low‐income setting | 0 | 0 | Risk Ratio (M‐H, Random, 95% CI) | 0.0 [0.0, 0.0] |
| 23 Any analgesia between birth of the baby and up to discharge from labour ward Show forest plot | 1 | 1429 | Risk Ratio (M‐H, Random, 95% CI) | 2.53 [1.34, 4.78] |
| 23.1 High‐income setting | 1 | 1429 | Risk Ratio (M‐H, Random, 95% CI) | 2.53 [1.34, 4.78] |
| 23.2 Low‐income setting | 0 | 0 | Risk Ratio (M‐H, Random, 95% CI) | 0.0 [0.0, 0.0] |
| 24 Women's assessment of pain during third stage as reported by authors. | 0 | 0 | Risk Ratio (M‐H, Random, 95% CI) | 0.0 [0.0, 0.0] |
| 24.1 High‐income setting | 0 | 0 | Risk Ratio (M‐H, Random, 95% CI) | 0.0 [0.0, 0.0] |
| 24.2 Low‐income setting | 0 | 0 | Risk Ratio (M‐H, Random, 95% CI) | 0.0 [0.0, 0.0] |
| 25 Secondary blood loss/any vaginal bleeding needing treatment (after 24 hours and up to 6 weeks) Show forest plot | 2 | 2941 | Risk Ratio (M‐H, Random, 95% CI) | 1.78 [0.69, 4.60] |
| 25.1 High‐income setting | 2 | 2941 | Risk Ratio (M‐H, Random, 95% CI) | 1.78 [0.69, 4.60] |
| 25.2 Low‐income setting | 0 | 0 | Risk Ratio (M‐H, Random, 95% CI) | 0.0 [0.0, 0.0] |
| 26 Amount of lochia either estimated or measured after 24 hours and up to discharge from hospital. | 0 | 0 | Mean Difference (IV, Random, 95% CI) | 0.0 [0.0, 0.0] |
| 26.1 High‐income setting | 0 | 0 | Mean Difference (IV, Random, 95% CI) | 0.0 [0.0, 0.0] |
| 26.2 Low‐income setting | 0 | 0 | Mean Difference (IV, Random, 95% CI) | 0.0 [0.0, 0.0] |
| 27 Surgical evacuation of retained products of conception Show forest plot | 2 | 2941 | Risk Ratio (M‐H, Random, 95% CI) | 0.69 [0.12, 3.98] |
| 27.1 High‐income setting | 2 | 2941 | Risk Ratio (M‐H, Random, 95% CI) | 0.69 [0.12, 3.98] |
| 27.2 Low‐income setting | 0 | 0 | Risk Ratio (M‐H, Random, 95% CI) | 0.0 [0.0, 0.0] |
| 28 Afterpains ‐ abdominal pain associated with the contracting uterus in the postpartum period. Show forest plot | 1 | 1429 | Risk Ratio (M‐H, Random, 95% CI) | 2.53 [1.34, 4.78] |
| 28.1 High‐income setting | 1 | 1429 | Risk Ratio (M‐H, Random, 95% CI) | 2.53 [1.34, 4.78] |
| 28.2 Low‐income setting | 0 | 0 | Risk Ratio (M‐H, Random, 95% CI) | 0.0 [0.0, 0.0] |
| 29 Apgar score < 7 at 5 minutes | 0 | 0 | Risk Ratio (M‐H, Random, 95% CI) | 0.0 [0.0, 0.0] |
| 29.1 High‐income setting | 0 | 0 | Risk Ratio (M‐H, Random, 95% CI) | 0.0 [0.0, 0.0] |
| 29.2 Low‐income setting | 0 | 0 | Risk Ratio (M‐H, Random, 95% CI) | 0.0 [0.0, 0.0] |
| 30 Birthweight Show forest plot | 1 | 1512 | Mean Difference (IV, Random, 95% CI) | ‐67.0 [‐114.13, ‐19.87] |
| 30.1 High‐income setting | 1 | 1512 | Mean Difference (IV, Random, 95% CI) | ‐67.0 [‐114.13, ‐19.87] |
| 30.2 Low‐income setting | 0 | 0 | Mean Difference (IV, Random, 95% CI) | 0.0 [0.0, 0.0] |
| 31 Neonatal encephalopathy assessed using Sarnat staging (Sarnat 1976; Table 1). | 0 | 0 | Risk Ratio (M‐H, Random, 95% CI) | 0.0 [0.0, 0.0] |
| 31.1 High‐income setting | 0 | 0 | Risk Ratio (M‐H, Random, 95% CI) | 0.0 [0.0, 0.0] |
| 31.2 Low‐income setting | 0 | 0 | Risk Ratio (M‐H, Random, 95% CI) | 0.0 [0.0, 0.0] |
| 32 Neonatal mortality | 0 | 0 | Risk Ratio (M‐H, Random, 95% CI) | 0.0 [0.0, 0.0] |
| 32.1 High‐income setting | 0 | 0 | Risk Ratio (M‐H, Random, 95% CI) | 0.0 [0.0, 0.0] |
| 32.2 Low‐income setting | 0 | 0 | Risk Ratio (M‐H, Random, 95% CI) | 0.0 [0.0, 0.0] |
| 33 Intraventricular haemorrhage ‐ Papille grade III/IV ‐ (for infants born before 34 weeks' gestation only). | 0 | 0 | Risk Ratio (M‐H, Random, 95% CI) | 0.0 [0.0, 0.0] |
| 33.1 High‐income setting | 0 | 0 | Risk Ratio (M‐H, Random, 95% CI) | 0.0 [0.0, 0.0] |
| 33.2 Low‐income setting | 0 | 0 | Risk Ratio (M‐H, Random, 95% CI) | 0.0 [0.0, 0.0] |
| 34 Number of infants exposed to one or more red blood cell transfusions | 0 | 0 | Risk Ratio (M‐H, Random, 95% CI) | 0.0 [0.0, 0.0] |
| 34.1 High‐income setting | 0 | 0 | Risk Ratio (M‐H, Random, 95% CI) | 0.0 [0.0, 0.0] |
| 34.2 Low‐income setting | 0 | 0 | Risk Ratio (M‐H, Random, 95% CI) | 0.0 [0.0, 0.0] |
| 35 Infant Hb level at 24 to 72 hours | 0 | 0 | Mean Difference (IV, Random, 95% CI) | 0.0 [0.0, 0.0] |
| 35.1 High‐income setting | 0 | 0 | Mean Difference (IV, Random, 95% CI) | 0.0 [0.0, 0.0] |
| 35.2 Low‐income setting | 0 | 0 | Mean Difference (IV, Random, 95% CI) | 0.0 [0.0, 0.0] |
| 36 Infant Hb level at 3‐6 months | 0 | 0 | Mean Difference (IV, Random, 95% CI) | 0.0 [0.0, 0.0] |
| 36.1 High‐income setting | 0 | 0 | Mean Difference (IV, Random, 95% CI) | 0.0 [0.0, 0.0] |
| 36.2 Low‐income setting | 0 | 0 | Mean Difference (IV, Random, 95% CI) | 0.0 [0.0, 0.0] |
| 37 Infant iron indices (ferritin) at 3 to 6 months. | 0 | 0 | Risk Ratio (M‐H, Random, 95% CI) | 0.0 [0.0, 0.0] |
| 37.1 High‐income setting | 0 | 0 | Risk Ratio (M‐H, Random, 95% CI) | 0.0 [0.0, 0.0] |
| 37.2 Low‐income setting | 0 | 0 | Risk Ratio (M‐H, Random, 95% CI) | 0.0 [0.0, 0.0] |
| 38 Exclusive breastfeeding at discharge from hospital | 0 | 0 | Risk Ratio (M‐H, Random, 95% CI) | 0.0 [0.0, 0.0] |
| 38.1 High‐income setting | 0 | 0 | Risk Ratio (M‐H, Random, 95% CI) | 0.0 [0.0, 0.0] |
| 38.2 Low‐income setting | 0 | 0 | Risk Ratio (M‐H, Random, 95% CI) | 0.0 [0.0, 0.0] |
| 39 Neurodevelopmental, cognitive or developmental outcomes assessed after age 18 months. | 0 | 0 | Risk Ratio (M‐H, Random, 95% CI) | 0.0 [0.0, 0.0] |
| 39.1 High‐income setting | 0 | 0 | Risk Ratio (M‐H, Random, 95% CI) | 0.0 [0.0, 0.0] |
| 39.2 Low‐income setting | 0 | 0 | Risk Ratio (M‐H, Random, 95% CI) | 0.0 [0.0, 0.0] |
| 40 Return to hospital as in‐ or outpatient because of bleeding (not pre‐specified) Show forest plot | 2 | 2941 | Risk Ratio (M‐H, Random, 95% CI) | 2.21 [1.29, 3.79] |
| 40.1 High‐income setting | 2 | 2941 | Risk Ratio (M‐H, Random, 95% CI) | 2.21 [1.29, 3.79] |
| 40.2 Low‐income setting | 0 | 0 | Risk Ratio (M‐H, Random, 95% CI) | 0.0 [0.0, 0.0] |
| 41 Postnatal maternal mean Hb (outcome not pre‐specified) Show forest plot | 2 | 2683 | Mean Difference (IV, Random, 95% CI) | 0.5 [0.41, 0.59] |
| 41.1 High‐income setting | 2 | 2683 | Mean Difference (IV, Random, 95% CI) | 0.5 [0.41, 0.59] |
| 41.2 Low‐income setting | 0 | 0 | Mean Difference (IV, Random, 95% CI) | 0.0 [0.0, 0.0] |
| Outcome or subgroup title | No. of studies | No. of participants | Statistical method | Effect size |
| 1 Severe primary PPH at time of birth (clinically estimated or measured blood loss ≥ 1000 mL) | 0 | 0 | Risk Ratio (M‐H, Random, 95% CI) | 0.0 [0.0, 0.0] |
| 1.1 High‐income setting | 0 | 0 | Risk Ratio (M‐H, Random, 95% CI) | 0.0 [0.0, 0.0] |
| 1.2 Low‐income setting | 0 | 0 | Risk Ratio (M‐H, Random, 95% CI) | 0.0 [0.0, 0.0] |
| 2 Very severe primary PPH at time of birth (clinically estimated or measured blood loss ≥ 2500 mL) | 0 | 0 | Risk Ratio (M‐H, Random, 95% CI) | 0.0 [0.0, 0.0] |
| 2.1 High‐income setting | 0 | 0 | Risk Ratio (M‐H, Random, 95% CI) | 0.0 [0.0, 0.0] |
| 2.2 Low‐income setting | 0 | 0 | Risk Ratio (M‐H, Random, 95% CI) | 0.0 [0.0, 0.0] |
| 3 Maternal mortality | 0 | 0 | Risk Ratio (M‐H, Random, 95% CI) | 0.0 [0.0, 0.0] |
| 3.1 High‐income setting | 0 | 0 | Risk Ratio (M‐H, Random, 95% CI) | 0.0 [0.0, 0.0] |
| 3.2 Low‐income setting | 0 | 0 | Risk Ratio (M‐H, Random, 95% CI) | 0.0 [0.0, 0.0] |
| 4 Maternal Hb < 9 g/dL at 24‐72 hr | 0 | 0 | Risk Ratio (M‐H, Random, 95% CI) | 0.0 [0.0, 0.0] |
| 4.1 High‐income setting | 0 | 0 | Risk Ratio (M‐H, Random, 95% CI) | 0.0 [0.0, 0.0] |
| 4.2 Low‐income setting | 0 | 0 | Risk Ratio (M‐H, Random, 95% CI) | 0.0 [0.0, 0.0] |
| 5 Admission to neonatal special/intensive care | 0 | 0 | Risk Ratio (M‐H, Random, 95% CI) | 0.0 [0.0, 0.0] |
| 5.1 High‐income setting | 0 | 0 | Risk Ratio (M‐H, Random, 95% CI) | 0.0 [0.0, 0.0] |
| 5.2 Low‐income setting | 0 | 0 | Risk Ratio (M‐H, Random, 95% CI) | 0.0 [0.0, 0.0] |
| 6 Neonatal jaundice requiring phototherapy or exchange transfusion | 0 | 0 | Risk Ratio (M‐H, Random, 95% CI) | 0.0 [0.0, 0.0] |
| 6.1 High‐income setting | 0 | 0 | Risk Ratio (M‐H, Random, 95% CI) | 0.0 [0.0, 0.0] |
| 6.2 Low‐income setting | 0 | 0 | Risk Ratio (M‐H, Random, 95% CI) | 0.0 [0.0, 0.0] |
| 7 Neonatal polycythaemia treated with dilutional exchange transfusion | 0 | 0 | Risk Ratio (M‐H, Random, 95% CI) | 0.0 [0.0, 0.0] |
| 7.1 High‐income setting | 0 | 0 | Risk Ratio (M‐H, Random, 95% CI) | 0.0 [0.0, 0.0] |
| 7.2 Low‐income setting | 0 | 0 | Risk Ratio (M‐H, Random, 95% CI) | 0.0 [0.0, 0.0] |
| Outcome or subgroup title | No. of studies | No. of participants | Statistical method | Effect size |
| 1 Severe primary PPH at time of birth (clinically estimated or measured blood loss ≥ 1000 mL) Show forest plot | 1 | 1648 | Risk Ratio (M‐H, Random, 95% CI) | 0.23 [0.09, 0.55] |
| 1.1 High‐income setting | 1 | 1648 | Risk Ratio (M‐H, Random, 95% CI) | 0.23 [0.09, 0.55] |
| 1.2 Low‐income setting | 0 | 0 | Risk Ratio (M‐H, Random, 95% CI) | 0.0 [0.0, 0.0] |
| 2 Very severe primary PPH at time of birth (clinically estimated or measured blood loss ≥ 2500 mL) | 0 | 0 | Risk Ratio (M‐H, Random, 95% CI) | 0.0 [0.0, 0.0] |
| 2.1 High‐income setting | 0 | 0 | Risk Ratio (M‐H, Random, 95% CI) | 0.0 [0.0, 0.0] |
| 2.2 Low‐income setting | 0 | 0 | Risk Ratio (M‐H, Random, 95% CI) | 0.0 [0.0, 0.0] |
| 3 Maternal mortality | 0 | 0 | Risk Ratio (M‐H, Random, 95% CI) | 0.0 [0.0, 0.0] |
| 3.1 High‐income setting | 0 | 0 | Risk Ratio (M‐H, Random, 95% CI) | 0.0 [0.0, 0.0] |
| 3.2 Low‐income setting | 0 | 0 | Risk Ratio (M‐H, Random, 95% CI) | 0.0 [0.0, 0.0] |
| 4 Maternal Hb < 9 g/dL at 24‐72 hr | 0 | 0 | Risk Ratio (M‐H, Random, 95% CI) | 0.0 [0.0, 0.0] |
| 4.1 High‐income setting | 0 | 0 | Risk Ratio (M‐H, Random, 95% CI) | 0.0 [0.0, 0.0] |
| 4.2 Low‐income setting | 0 | 0 | Risk Ratio (M‐H, Random, 95% CI) | 0.0 [0.0, 0.0] |
| 5 Admission to neonatal special/intensive care | 0 | 0 | Risk Ratio (M‐H, Random, 95% CI) | 0.0 [0.0, 0.0] |
| 5.1 High‐income setting | 0 | 0 | Risk Ratio (M‐H, Random, 95% CI) | 0.0 [0.0, 0.0] |
| 5.2 Low‐income setting | 0 | 0 | Risk Ratio (M‐H, Random, 95% CI) | 0.0 [0.0, 0.0] |
| 6 Neonatal jaundice requiring phototherapy or exchange transfusion | 0 | 0 | Risk Ratio (M‐H, Random, 95% CI) | 0.0 [0.0, 0.0] |
| 6.1 High‐income setting | 0 | 0 | Risk Ratio (M‐H, Random, 95% CI) | 0.0 [0.0, 0.0] |
| 6.2 Low‐income setting | 0 | 0 | Risk Ratio (M‐H, Random, 95% CI) | 0.0 [0.0, 0.0] |
| 7 Neonatal polycythaemia treated with dilutional exchange transfusion | 0 | 0 | Risk Ratio (M‐H, Random, 95% CI) | 0.0 [0.0, 0.0] |
| 7.1 High‐income setting | 0 | 0 | Risk Ratio (M‐H, Random, 95% CI) | 0.0 [0.0, 0.0] |
| 7.2 Low‐income setting | 0 | 0 | Risk Ratio (M‐H, Random, 95% CI) | 0.0 [0.0, 0.0] |
| 8 Severe primary PPH after placental delivery and up to 24 hours (clinically estimated or measured blood loss ≥ 1000 mL) | 0 | 0 | Risk Ratio (M‐H, Random, 95% CI) | 0.0 [0.0, 0.0] |
| 8.1 High‐income setting | 0 | 0 | Risk Ratio (M‐H, Random, 95% CI) | 0.0 [0.0, 0.0] |
| 8.2 Low‐income setting | 0 | 0 | Risk Ratio (M‐H, Random, 95% CI) | 0.0 [0.0, 0.0] |
| 9 Severe primary PPH at time of birth and up to 24 hours (clinically estimated or measured blood loss ≥1000 mL) | 0 | 0 | Risk Ratio (M‐H, Random, 95% CI) | 0.0 [0.0, 0.0] |
| 9.1 High‐income setting | 0 | 0 | Risk Ratio (M‐H, Random, 95% CI) | 0.0 [0.0, 0.0] |
| 9.2 Low‐income setting | 0 | 0 | Risk Ratio (M‐H, Random, 95% CI) | 0.0 [0.0, 0.0] |
| 10 Primary blood loss ≥ 500 mL at time of birth (clinically estimated or measured) Show forest plot | 1 | 1648 | Risk Ratio (M‐H, Random, 95% CI) | 0.53 [0.38, 0.74] |
| 10.1 High‐income setting | 1 | 1648 | Risk Ratio (M‐H, Random, 95% CI) | 0.53 [0.38, 0.74] |
| 10.2 Low‐income setting | 0 | 0 | Risk Ratio (M‐H, Random, 95% CI) | 0.0 [0.0, 0.0] |
| 11 Primary blood loss ≥ 500 mL after delivery of placenta and up to 24 hours (clinically estimated or measured) | 0 | 0 | Risk Ratio (M‐H, Random, 95% CI) | 0.0 [0.0, 0.0] |
| 11.1 High‐income setting | 0 | 0 | Risk Ratio (M‐H, Random, 95% CI) | 0.0 [0.0, 0.0] |
| 11.2 Low‐income setting | 0 | 0 | Risk Ratio (M‐H, Random, 95% CI) | 0.0 [0.0, 0.0] |
| 12 Primary blood loss ≥ 500 mL at time of birth and up to 24 hours (clinically estimated or measured) | 0 | 0 | Risk Ratio (M‐H, Random, 95% CI) | 0.0 [0.0, 0.0] |
| 12.1 High‐income setting | 0 | 0 | Risk Ratio (M‐H, Random, 95% CI) | 0.0 [0.0, 0.0] |
| 12.2 Low‐income setting | 0 | 0 | Risk Ratio (M‐H, Random, 95% CI) | 0.0 [0.0, 0.0] |
| 13 Mean maternal blood loss (mL) at time of birth (clinically estimated or measured) | 0 | 0 | Mean Difference (IV, Random, 95% CI) | 0.0 [0.0, 0.0] |
| 13.1 High‐income setting | 0 | 0 | Mean Difference (IV, Random, 95% CI) | 0.0 [0.0, 0.0] |
| 13.2 Low‐income setting | 0 | 0 | Mean Difference (IV, Random, 95% CI) | 0.0 [0.0, 0.0] |
| 14 Mean maternal blood loss (mL) after delivery of placenta and up to 24 hours (clinically estimated or measured) | 0 | 0 | Mean Difference (IV, Random, 95% CI) | 0.0 [0.0, 0.0] |
| 14.1 High‐income setting | 0 | 0 | Mean Difference (IV, Random, 95% CI) | 0.0 [0.0, 0.0] |
| 14.2 Low‐income setting | 0 | 0 | Mean Difference (IV, Random, 95% CI) | 0.0 [0.0, 0.0] |
| 15 Mean maternal blood loss (mL) at time of birth and up to 24 hours (clinically estimated or measured) | 0 | 0 | Mean Difference (IV, Random, 95% CI) | 0.0 [0.0, 0.0] |
| 15.1 High‐income setting | 0 | 0 | Mean Difference (IV, Random, 95% CI) | 0.0 [0.0, 0.0] |
| 15.2 Low‐income setting | 0 | 0 | Mean Difference (IV, Random, 95% CI) | 0.0 [0.0, 0.0] |
| 16 Maternal blood transfusion Show forest plot | 1 | 1648 | Risk Ratio (M‐H, Random, 95% CI) | 0.25 [0.03, 2.22] |
| 16.1 High‐income setting | 1 | 1648 | Risk Ratio (M‐H, Random, 95% CI) | 0.25 [0.03, 2.22] |
| 16.2 Low‐income setting | 0 | 0 | Risk Ratio (M‐H, Random, 95% CI) | 0.0 [0.0, 0.0] |
| 17 Clinical signs of severe blood loss Show forest plot | 1 | 1648 | Risk Ratio (M‐H, Random, 95% CI) | 0.25 [0.05, 1.17] |
| 17.1 High‐income setting | 1 | 1648 | Risk Ratio (M‐H, Random, 95% CI) | 0.25 [0.05, 1.17] |
| 17.2 Low‐income setting | 0 | 0 | Risk Ratio (M‐H, Random, 95% CI) | 0.0 [0.0, 0.0] |
| 18 Therapeutic uterotonics during third stage and/or within 24 hours Show forest plot | 1 | 1648 | Risk Ratio (M‐H, Random, 95% CI) | 0.45 [0.26, 0.77] |
| 18.1 High‐income setting | 1 | 1648 | Risk Ratio (M‐H, Random, 95% CI) | 0.45 [0.26, 0.77] |
| 18.2 Low‐income setting | 0 | 0 | Risk Ratio (M‐H, Random, 95% CI) | 0.0 [0.0, 0.0] |
| 19 Mean length of third stage Show forest plot | 1 | 1648 | Mean Difference (IV, Random, 95% CI) | ‐10.0 [‐10.24, ‐9.76] |
| 19.1 High‐income setting | 1 | 1648 | Mean Difference (IV, Random, 95% CI) | ‐10.0 [‐10.24, ‐9.76] |
| 19.2 Low‐income setting | 0 | 0 | Mean Difference (IV, Random, 95% CI) | 0.0 [0.0, 0.0] |
| 20 Manual removal of placenta as defined by authors | 0 | 0 | Risk Ratio (M‐H, Random, 95% CI) | 0.0 [0.0, 0.0] |
| 20.1 High‐income setting | 0 | 0 | Risk Ratio (M‐H, Random, 95% CI) | 0.0 [0.0, 0.0] |
| 20.2 Low‐income setting | 0 | 0 | Risk Ratio (M‐H, Random, 95% CI) | 0.0 [0.0, 0.0] |
| 21 Postnatal diastolic blood pressure > 90 mmHg between birth of baby and discharge from the labour ward. | 0 | 0 | Risk Ratio (M‐H, Random, 95% CI) | 0.0 [0.0, 0.0] |
| 21.1 High‐income setting | 0 | 0 | Risk Ratio (M‐H, Random, 95% CI) | 0.0 [0.0, 0.0] |
| 21.2 Low‐income setting | 0 | 0 | Risk Ratio (M‐H, Random, 95% CI) | 0.0 [0.0, 0.0] |
| 22 Postnatal vomiting between birth of baby and discharge from the labour ward | 0 | 0 | Risk Ratio (M‐H, Random, 95% CI) | 0.0 [0.0, 0.0] |
| 22.1 High‐income setting | 0 | 0 | Risk Ratio (M‐H, Random, 95% CI) | 0.0 [0.0, 0.0] |
| 22.2 Low‐income setting | 0 | 0 | Risk Ratio (M‐H, Random, 95% CI) | 0.0 [0.0, 0.0] |
| 23 Any analgesia between birth of the baby and discharge from labour ward | 0 | 0 | Risk Ratio (M‐H, Random, 95% CI) | 0.0 [0.0, 0.0] |
| 23.1 High‐income setting | 0 | 0 | Risk Ratio (M‐H, Random, 95% CI) | 0.0 [0.0, 0.0] |
| 23.2 Low‐income setting | 0 | 0 | Risk Ratio (M‐H, Random, 95% CI) | 0.0 [0.0, 0.0] |
| 24 Women's assessment of pain during third stage as reported by authors | 0 | 0 | Risk Ratio (M‐H, Random, 95% CI) | 0.0 [0.0, 0.0] |
| 24.1 High‐income setting | 0 | 0 | Risk Ratio (M‐H, Random, 95% CI) | 0.0 [0.0, 0.0] |
| 24.2 Low‐income setting | 0 | 0 | Risk Ratio (M‐H, Random, 95% CI) | 0.0 [0.0, 0.0] |
| 25 Secondary blood loss/any vaginal bleeding needing treatment (after 24 hours and up to 6 weeks) | 0 | 0 | Risk Ratio (M‐H, Random, 95% CI) | 0.0 [0.0, 0.0] |
| 25.1 High‐income setting | 0 | 0 | Risk Ratio (M‐H, Random, 95% CI) | 0.0 [0.0, 0.0] |
| 25.2 Low‐income setting | 0 | 0 | Risk Ratio (M‐H, Random, 95% CI) | 0.0 [0.0, 0.0] |
| 26 Amount of lochia either estimated or measured after 24 hours and up to discharge from hospital | 0 | 0 | Mean Difference (IV, Random, 95% CI) | 0.0 [0.0, 0.0] |
| 26.1 High‐income setting | 0 | 0 | Mean Difference (IV, Random, 95% CI) | 0.0 [0.0, 0.0] |
| 26.2 Low‐income setting | 0 | 0 | Mean Difference (IV, Random, 95% CI) | 0.0 [0.0, 0.0] |
| 27 Surgical evacuation of retained products of conception | 0 | 0 | Risk Ratio (M‐H, Random, 95% CI) | 0.0 [0.0, 0.0] |
| 27.1 High‐income setting | 0 | 0 | Risk Ratio (M‐H, Random, 95% CI) | 0.0 [0.0, 0.0] |
| 27.2 Low‐income setting | 0 | 0 | Risk Ratio (M‐H, Random, 95% CI) | 0.0 [0.0, 0.0] |
| 28 Afterpains ‐ abdominal pain associated with the contracting uterus in the postpartum period | 0 | 0 | Risk Ratio (M‐H, Random, 95% CI) | 0.0 [0.0, 0.0] |
| 28.1 High‐income setting | 0 | 0 | Risk Ratio (M‐H, Random, 95% CI) | 0.0 [0.0, 0.0] |
| 28.2 Low‐income setting | 0 | 0 | Risk Ratio (M‐H, Random, 95% CI) | 0.0 [0.0, 0.0] |
| 29 Apgar score < 7 at 5 minutes | 0 | 0 | Risk Ratio (M‐H, Random, 95% CI) | 0.0 [0.0, 0.0] |
| 29.1 High‐income setting | 0 | 0 | Risk Ratio (M‐H, Random, 95% CI) | 0.0 [0.0, 0.0] |
| 29.2 Low‐income setting | 0 | 0 | Risk Ratio (M‐H, Random, 95% CI) | 0.0 [0.0, 0.0] |
| 30 Birthweight | 0 | 0 | Mean Difference (IV, Random, 95% CI) | 0.0 [0.0, 0.0] |
| 30.1 High‐income setting | 0 | 0 | Mean Difference (IV, Random, 95% CI) | 0.0 [0.0, 0.0] |
| 30.2 Low‐income setting | 0 | 0 | Mean Difference (IV, Random, 95% CI) | 0.0 [0.0, 0.0] |
| 31 Neonatal encephalopathy assessed using Sarnat staging (Sarnat 1976; Table 1) | 0 | 0 | Risk Ratio (M‐H, Random, 95% CI) | 0.0 [0.0, 0.0] |
| 31.1 High‐income setting | 0 | 0 | Risk Ratio (M‐H, Random, 95% CI) | 0.0 [0.0, 0.0] |
| 31.2 Low‐income setting | 0 | 0 | Risk Ratio (M‐H, Random, 95% CI) | 0.0 [0.0, 0.0] |
| 32 Neonatal mortality | 0 | 0 | Risk Ratio (M‐H, Random, 95% CI) | 0.0 [0.0, 0.0] |
| 32.1 High‐income setting | 0 | 0 | Risk Ratio (M‐H, Random, 95% CI) | 0.0 [0.0, 0.0] |
| 32.2 Low‐income setting | 0 | 0 | Risk Ratio (M‐H, Random, 95% CI) | 0.0 [0.0, 0.0] |
| 33 Intraventricular haemorrhage ‐ Papille grade III/IV ‐ (for infants born before 34 weeks' gestation only). | 0 | 0 | Risk Ratio (M‐H, Random, 95% CI) | 0.0 [0.0, 0.0] |
| 33.1 High‐income setting | 0 | 0 | Risk Ratio (M‐H, Random, 95% CI) | 0.0 [0.0, 0.0] |
| 33.2 Low‐income setting | 0 | 0 | Risk Ratio (M‐H, Random, 95% CI) | 0.0 [0.0, 0.0] |
| 34 Number of infants who received a red blood cell transfusion. | 0 | 0 | Risk Ratio (M‐H, Random, 95% CI) | 0.0 [0.0, 0.0] |
| 34.1 High‐income setting | 0 | 0 | Risk Ratio (M‐H, Random, 95% CI) | 0.0 [0.0, 0.0] |
| 34.2 Low‐income setting | 0 | 0 | Risk Ratio (M‐H, Random, 95% CI) | 0.0 [0.0, 0.0] |
| 35 Infant Hb level at 24 to 72 hours | 0 | 0 | Mean Difference (IV, Random, 95% CI) | 0.0 [0.0, 0.0] |
| 35.1 High‐income setting | 0 | 0 | Mean Difference (IV, Random, 95% CI) | 0.0 [0.0, 0.0] |
| 35.2 Low‐income setting | 0 | 0 | Mean Difference (IV, Random, 95% CI) | 0.0 [0.0, 0.0] |
| 36 Infant Hb level at 3‐6 months | 0 | 0 | Mean Difference (IV, Random, 95% CI) | 0.0 [0.0, 0.0] |
| 36.1 High‐income setting | 0 | 0 | Mean Difference (IV, Random, 95% CI) | 0.0 [0.0, 0.0] |
| 36.2 Low‐income setting | 0 | 0 | Mean Difference (IV, Random, 95% CI) | 0.0 [0.0, 0.0] |
| 37 Infant iron indices (ferritin) at 3 to 6 months. | 0 | 0 | Risk Ratio (M‐H, Random, 95% CI) | 0.0 [0.0, 0.0] |
| 37.1 High‐income setting | 0 | 0 | Risk Ratio (M‐H, Random, 95% CI) | 0.0 [0.0, 0.0] |
| 37.2 Low‐income setting | 0 | 0 | Risk Ratio (M‐H, Random, 95% CI) | 0.0 [0.0, 0.0] |
| 38 Exclusive breastfeeding at discharge from hospital | 0 | 0 | Risk Ratio (M‐H, Random, 95% CI) | 0.0 [0.0, 0.0] |
| 38.1 High‐income setting | 0 | 0 | Risk Ratio (M‐H, Random, 95% CI) | 0.0 [0.0, 0.0] |
| 38.2 Low‐income setting | 0 | 0 | Risk Ratio (M‐H, Random, 95% CI) | 0.0 [0.0, 0.0] |
| 39 Neurodevelopmental, cognitive or developmental outcomes assessed after age 18 months. | 0 | 0 | Risk Ratio (M‐H, Random, 95% CI) | 0.0 [0.0, 0.0] |
| 39.1 High‐income setting | 0 | 0 | Risk Ratio (M‐H, Random, 95% CI) | 0.0 [0.0, 0.0] |
| 39.2 Low‐income setting | 0 | 0 | Risk Ratio (M‐H, Random, 95% CI) | 0.0 [0.0, 0.0] |
| 40 Return to hospital as in‐ or outpatient because of bleeding (not pre‐specified) | 0 | 0 | Risk Ratio (M‐H, Random, 95% CI) | 0.0 [0.0, 0.0] |
| 40.1 High‐income setting | 0 | 0 | Risk Ratio (M‐H, Random, 95% CI) | 0.0 [0.0, 0.0] |
| 40.2 Low‐income setting | 0 | 0 | Risk Ratio (M‐H, Random, 95% CI) | 0.0 [0.0, 0.0] |
| 41 Postnatal maternal mean Hb (outcome not pre‐specified) | 0 | 0 | Mean Difference (IV, Random, 95% CI) | 0.0 [0.0, 0.0] |
| 41.1 High‐income setting | 0 | 0 | Mean Difference (IV, Random, 95% CI) | 0.0 [0.0, 0.0] |
| 41.2 Low‐income setting | 0 | 0 | Mean Difference (IV, Random, 95% CI) | 0.0 [0.0, 0.0] |
| Outcome or subgroup title | No. of studies | No. of participants | Statistical method | Effect size |
| 1 Severe primary PPH at time of birth (clinically estimated or measured blood loss ≥ 1000 mL) Show forest plot | 1 | 1621 | Risk Ratio (M‐H, Random, 95% CI) | 0.78 [0.48, 1.24] |
| 1.1 High‐income setting | 1 | 1621 | Risk Ratio (M‐H, Random, 95% CI) | 0.78 [0.48, 1.24] |
| 1.2 Low‐income setting | 0 | 0 | Risk Ratio (M‐H, Random, 95% CI) | 0.0 [0.0, 0.0] |
| 2 Very severe primary PPH at time of birth (clinically estimated or measured blood loss ≥ 2500 mL) | 0 | 0 | Risk Ratio (M‐H, Random, 95% CI) | 0.0 [0.0, 0.0] |
| 2.1 High‐income setting | 0 | 0 | Risk Ratio (M‐H, Random, 95% CI) | 0.0 [0.0, 0.0] |
| 2.2 Low‐income setting | 0 | 0 | Risk Ratio (M‐H, Random, 95% CI) | 0.0 [0.0, 0.0] |
| 3 Maternal mortality | 0 | 0 | Risk Ratio (M‐H, Random, 95% CI) | 0.0 [0.0, 0.0] |
| 3.1 High‐income setting | 0 | 0 | Risk Ratio (M‐H, Random, 95% CI) | 0.0 [0.0, 0.0] |
| 3.2 Low‐income setting | 0 | 0 | Risk Ratio (M‐H, Random, 95% CI) | 0.0 [0.0, 0.0] |
| 4 Maternal Hb < 9 g/dL at 24‐72 hr Show forest plot | 1 | 1631 | Risk Ratio (M‐H, Random, 95% CI) | 1.23 [0.75, 2.01] |
| 4.1 High‐income setting | 1 | 1631 | Risk Ratio (M‐H, Random, 95% CI) | 1.23 [0.75, 2.01] |
| 4.2 Low‐income setting | 0 | 0 | Risk Ratio (M‐H, Random, 95% CI) | 0.0 [0.0, 0.0] |
| 5 Admission to neonatal special/intensive care | 0 | 0 | Risk Ratio (M‐H, Random, 95% CI) | 0.0 [0.0, 0.0] |
| 5.1 High‐income setting | 0 | 0 | Risk Ratio (M‐H, Random, 95% CI) | 0.0 [0.0, 0.0] |
| 5.2 Low‐income setting | 0 | 0 | Risk Ratio (M‐H, Random, 95% CI) | 0.0 [0.0, 0.0] |
| 6 Neonatal jaundice requiring phototherapy or exchange transfusion | 0 | 0 | Risk Ratio (M‐H, Random, 95% CI) | 0.0 [0.0, 0.0] |
| 6.1 High‐income setting | 0 | 0 | Risk Ratio (M‐H, Random, 95% CI) | 0.0 [0.0, 0.0] |
| 6.2 Low‐income setting | 0 | 0 | Risk Ratio (M‐H, Random, 95% CI) | 0.0 [0.0, 0.0] |
| 7 Neonatal polycythaemia treated with dilutional exchange transfusion | 0 | 0 | Risk Ratio (M‐H, Random, 95% CI) | 0.0 [0.0, 0.0] |
| 7.1 High‐income setting | 0 | 0 | Risk Ratio (M‐H, Random, 95% CI) | 0.0 [0.0, 0.0] |
| 7.2 Low‐income setting | 0 | 0 | Risk Ratio (M‐H, Random, 95% CI) | 0.0 [0.0, 0.0] |
| 8 Severe primary PPH after placental delivery and up to 24 hours (clinically estimated or measured blood loss ≥ 1000 mL) | 0 | 0 | Risk Ratio (M‐H, Random, 95% CI) | 0.0 [0.0, 0.0] |
| 8.1 High‐income setting | 0 | 0 | Risk Ratio (M‐H, Random, 95% CI) | 0.0 [0.0, 0.0] |
| 8.2 Low‐income setting | 0 | 0 | Risk Ratio (M‐H, Random, 95% CI) | 0.0 [0.0, 0.0] |
| 9 Severe primary PPH at time of birth and up to 24 hours (clinically estimated or measured blood loss ≥1000 mL) | 0 | 0 | Risk Ratio (M‐H, Random, 95% CI) | 0.0 [0.0, 0.0] |
| 9.1 High‐income setting | 0 | 0 | Risk Ratio (M‐H, Random, 95% CI) | 0.0 [0.0, 0.0] |
| 9.2 Low‐income setting | 0 | 0 | Risk Ratio (M‐H, Random, 95% CI) | 0.0 [0.0, 0.0] |
| 10 Primary blood loss ≥ 500 mL at time of birth (clinically estimated or measured) Show forest plot | 1 | 1621 | Risk Ratio (M‐H, Random, 95% CI) | 0.51 [0.40, 0.66] |
| 10.1 High‐income setting | 1 | 1621 | Risk Ratio (M‐H, Random, 95% CI) | 0.51 [0.40, 0.66] |
| 10.2 Low‐income setting | 0 | 0 | Risk Ratio (M‐H, Random, 95% CI) | 0.0 [0.0, 0.0] |
| 11 Primary blood loss ≥ 500 mL after delivery of placenta and up to 24 hours (clinically estimated or measured) | 0 | 0 | Risk Ratio (M‐H, Random, 95% CI) | 0.0 [0.0, 0.0] |
| 11.1 High‐income setting | 0 | 0 | Risk Ratio (M‐H, Random, 95% CI) | 0.0 [0.0, 0.0] |
| 11.2 Low‐income setting | 0 | 0 | Risk Ratio (M‐H, Random, 95% CI) | 0.0 [0.0, 0.0] |
| 12 Primary blood loss ≥ 500 mL at time of birth and up to 24 hours (clinically estimated or measured) | 0 | 0 | Risk Ratio (M‐H, Random, 95% CI) | 0.0 [0.0, 0.0] |
| 12.1 High‐income setting | 0 | 0 | Risk Ratio (M‐H, Random, 95% CI) | 0.0 [0.0, 0.0] |
| 12.2 Low‐income setting | 0 | 0 | Risk Ratio (M‐H, Random, 95% CI) | 0.0 [0.0, 0.0] |
| 13 Mean maternal blood loss (mL) at time of birth (clinically estimated or measured) Show forest plot | 1 | 1621 | Mean Difference (IV, Random, 95% CI) | ‐94.0 [‐126.57, ‐61.43] |
| 13.1 High‐income setting | 1 | 1621 | Mean Difference (IV, Random, 95% CI) | ‐94.0 [‐126.57, ‐61.43] |
| 13.2 Low‐income setting | 0 | 0 | Mean Difference (IV, Random, 95% CI) | 0.0 [0.0, 0.0] |
| 14 Mean maternal blood loss (mL) after delivery of placenta and up to 24 hours (clinically estimated or measured) | 0 | 0 | Mean Difference (IV, Random, 95% CI) | 0.0 [0.0, 0.0] |
| 14.1 High‐income setting | 0 | 0 | Mean Difference (IV, Random, 95% CI) | 0.0 [0.0, 0.0] |
| 14.2 Low‐income setting | 0 | 0 | Mean Difference (IV, Random, 95% CI) | 0.0 [0.0, 0.0] |
| 15 Mean maternal blood loss (mL) at time of birth and up to 24 hours (clinically estimated or measured) | 0 | 0 | Mean Difference (IV, Random, 95% CI) | 0.0 [0.0, 0.0] |
| 15.1 High‐income setting | 0 | 0 | Mean Difference (IV, Random, 95% CI) | 0.0 [0.0, 0.0] |
| 15.2 Low‐income setting | 0 | 0 | Mean Difference (IV, Random, 95% CI) | 0.0 [0.0, 0.0] |
| 16 Maternal blood transfusion Show forest plot | 1 | 1631 | Risk Ratio (M‐H, Random, 95% CI) | 0.79 [0.43, 1.46] |
| 16.1 High‐income setting | 1 | 1631 | Risk Ratio (M‐H, Random, 95% CI) | 0.79 [0.43, 1.46] |
| 16.2 Low‐income setting | 0 | 0 | Risk Ratio (M‐H, Random, 95% CI) | 0.0 [0.0, 0.0] |
| 17 Clinical signs of severe blood loss | 0 | 0 | Risk Ratio (M‐H, Random, 95% CI) | 0.0 [0.0, 0.0] |
| 17.1 High‐income setting | 0 | 0 | Risk Ratio (M‐H, Random, 95% CI) | 0.0 [0.0, 0.0] |
| 17.2 Low‐income setting | 0 | 0 | Risk Ratio (M‐H, Random, 95% CI) | 0.0 [0.0, 0.0] |
| 18 Therapeutic uterotonics during third stage and/or within 24 hours Show forest plot | 1 | 1631 | Risk Ratio (M‐H, Random, 95% CI) | 0.39 [0.33, 0.48] |
| 18.1 High‐income setting | 1 | 1631 | Risk Ratio (M‐H, Random, 95% CI) | 0.39 [0.33, 0.48] |
| 18.2 Low‐income setting | 0 | 0 | Risk Ratio (M‐H, Random, 95% CI) | 0.0 [0.0, 0.0] |
| 19 Mean length of third stage Show forest plot | 1 | 1631 | Mean Difference (IV, Random, 95% CI) | ‐1.60 [‐3.08, ‐0.12] |
| 19.1 High‐income setting | 1 | 1631 | Mean Difference (IV, Random, 95% CI) | ‐1.60 [‐3.08, ‐0.12] |
| 19.2 Low‐income setting | 0 | 0 | Mean Difference (IV, Random, 95% CI) | 0.0 [0.0, 0.0] |
| 20 Manual removal of placenta as defined by authors Show forest plot | 1 | 1631 | Risk Ratio (M‐H, Random, 95% CI) | 1.25 [0.71, 2.21] |
| 20.1 High‐income setting | 1 | 1631 | Risk Ratio (M‐H, Random, 95% CI) | 1.25 [0.71, 2.21] |
| 20.2 Low‐income setting | 0 | 0 | Risk Ratio (M‐H, Random, 95% CI) | 0.0 [0.0, 0.0] |
| 21 Postnatal diastolic blood pressure > 90 mmHg between birth of baby and discharge from the labour ward. | 0 | 0 | Risk Ratio (M‐H, Random, 95% CI) | 0.0 [0.0, 0.0] |
| 21.1 High‐income setting | 0 | 0 | Risk Ratio (M‐H, Random, 95% CI) | 0.0 [0.0, 0.0] |
| 21.2 Low‐income setting | 0 | 0 | Risk Ratio (M‐H, Random, 95% CI) | 0.0 [0.0, 0.0] |
| 22 Postnatal vomiting between birth of baby and discharge from the labour ward | 0 | 0 | Risk Ratio (M‐H, Random, 95% CI) | 0.0 [0.0, 0.0] |
| 22.1 High‐income setting | 0 | 0 | Risk Ratio (M‐H, Random, 95% CI) | 0.0 [0.0, 0.0] |
| 22.2 Low‐income setting | 0 | 0 | Risk Ratio (M‐H, Random, 95% CI) | 0.0 [0.0, 0.0] |
| 23 Any analgesia between birth of the baby and discharge from labour ward | 0 | 0 | Risk Ratio (M‐H, Random, 95% CI) | 0.0 [0.0, 0.0] |
| 23.1 High‐income setting | 0 | 0 | Risk Ratio (M‐H, Random, 95% CI) | 0.0 [0.0, 0.0] |
| 23.2 Low‐income setting | 0 | 0 | Risk Ratio (M‐H, Random, 95% CI) | 0.0 [0.0, 0.0] |
| 24 Women's assessment of pain during third stage as reported by authors | 0 | 0 | Risk Ratio (M‐H, Random, 95% CI) | 0.0 [0.0, 0.0] |
| 24.1 High‐income setting | 0 | 0 | Risk Ratio (M‐H, Random, 95% CI) | 0.0 [0.0, 0.0] |
| 24.2 Low‐income setting | 0 | 0 | Risk Ratio (M‐H, Random, 95% CI) | 0.0 [0.0, 0.0] |
| 25 Secondary blood loss/any vaginal bleeding needing treatment (after 24 hours and up to 6 weeks) | 0 | 0 | Risk Ratio (M‐H, Random, 95% CI) | 0.0 [0.0, 0.0] |
| 25.1 High‐income setting | 0 | 0 | Risk Ratio (M‐H, Random, 95% CI) | 0.0 [0.0, 0.0] |
| 25.2 Low‐income setting | 0 | 0 | Risk Ratio (M‐H, Random, 95% CI) | 0.0 [0.0, 0.0] |
| 26 Amount of lochia either estimated or measured after 24 hours and up to discharge from hospital | 0 | 0 | Mean Difference (IV, Random, 95% CI) | 0.0 [0.0, 0.0] |
| 26.1 High‐income setting | 0 | 0 | Mean Difference (IV, Random, 95% CI) | 0.0 [0.0, 0.0] |
| 26.2 Low‐income setting | 0 | 0 | Mean Difference (IV, Random, 95% CI) | 0.0 [0.0, 0.0] |
| 27 Surgical evacuation of retained products of conception | 0 | 0 | Risk Ratio (M‐H, Random, 95% CI) | 0.0 [0.0, 0.0] |
| 27.1 High‐income setting | 0 | 0 | Risk Ratio (M‐H, Random, 95% CI) | 0.0 [0.0, 0.0] |
| 27.2 Low‐income setting | 0 | 0 | Risk Ratio (M‐H, Random, 95% CI) | 0.0 [0.0, 0.0] |
| 28 Not prespecified: afterpains at 2 hours after birth (id 20458) Show forest plot | 1 | 1425 | Mean Difference (IV, Fixed, 95% CI) | ‐2.80 [‐4.62, ‐0.98] |
| 28.1 High‐income setting | 1 | 1425 | Mean Difference (IV, Fixed, 95% CI) | ‐2.80 [‐4.62, ‐0.98] |
| 28.2 Low‐income setting | 0 | 0 | Mean Difference (IV, Fixed, 95% CI) | 0.0 [0.0, 0.0] |
| 29 Not pre‐specified: afterpains the day after birth (id 20458) Show forest plot | 1 | 1336 | Mean Difference (IV, Fixed, 95% CI) | ‐3.0 [‐5.33, ‐0.67] |
| 29.1 High‐income setting | 1 | 1336 | Mean Difference (IV, Fixed, 95% CI) | ‐3.0 [‐5.33, ‐0.67] |
| 29.2 Low‐income setting | 0 | 0 | Mean Difference (IV, Fixed, 95% CI) | 0.0 [0.0, 0.0] |
| 30 Apgar score < 7 at 5 minutes | 0 | 0 | Risk Ratio (M‐H, Random, 95% CI) | 0.0 [0.0, 0.0] |
| 30.1 High‐income setting | 0 | 0 | Risk Ratio (M‐H, Random, 95% CI) | 0.0 [0.0, 0.0] |
| 30.2 Low‐income setting | 0 | 0 | Risk Ratio (M‐H, Random, 95% CI) | 0.0 [0.0, 0.0] |
| 31 Birthweight Show forest plot | 1 | 1631 | Mean Difference (IV, Random, 95% CI) | 15.0 [‐28.88, 58.88] |
| 31.1 High‐income setting | 1 | 1631 | Mean Difference (IV, Random, 95% CI) | 15.0 [‐28.88, 58.88] |
| 31.2 Low‐income setting | 0 | 0 | Mean Difference (IV, Random, 95% CI) | 0.0 [0.0, 0.0] |
| 32 Neonatal encephalopathy assessed using Sarnat staging (Sarnat 1976; Table 1) | 0 | 0 | Risk Ratio (M‐H, Random, 95% CI) | 0.0 [0.0, 0.0] |
| 32.1 High‐income setting | 0 | 0 | Risk Ratio (M‐H, Random, 95% CI) | 0.0 [0.0, 0.0] |
| 32.2 Low‐income setting | 0 | 0 | Risk Ratio (M‐H, Random, 95% CI) | 0.0 [0.0, 0.0] |
| 33 Neonatal mortality | 0 | 0 | Risk Ratio (M‐H, Random, 95% CI) | 0.0 [0.0, 0.0] |
| 33.1 High‐income setting | 0 | 0 | Risk Ratio (M‐H, Random, 95% CI) | 0.0 [0.0, 0.0] |
| 33.2 Low‐income setting | 0 | 0 | Risk Ratio (M‐H, Random, 95% CI) | 0.0 [0.0, 0.0] |
| 34 Intraventricular haemorrhage ‐ Papille grade III/IV ‐ (for infants born before 34 weeks' gestation only). | 0 | 0 | Risk Ratio (M‐H, Random, 95% CI) | 0.0 [0.0, 0.0] |
| 34.1 High‐income setting | 0 | 0 | Risk Ratio (M‐H, Random, 95% CI) | 0.0 [0.0, 0.0] |
| 34.2 Low‐income setting | 0 | 0 | Risk Ratio (M‐H, Random, 95% CI) | 0.0 [0.0, 0.0] |
| 35 Number of infants who received a red blood cell transfusion. | 0 | 0 | Risk Ratio (M‐H, Random, 95% CI) | 0.0 [0.0, 0.0] |
| 35.1 High‐income setting | 0 | 0 | Risk Ratio (M‐H, Random, 95% CI) | 0.0 [0.0, 0.0] |
| 35.2 Low‐income setting | 0 | 0 | Risk Ratio (M‐H, Random, 95% CI) | 0.0 [0.0, 0.0] |
| 36 Infant Hb level at 24 to 72 hours | 0 | 0 | Mean Difference (IV, Random, 95% CI) | 0.0 [0.0, 0.0] |
| 36.1 High‐income setting | 0 | 0 | Mean Difference (IV, Random, 95% CI) | 0.0 [0.0, 0.0] |
| 36.2 Low‐income setting | 0 | 0 | Mean Difference (IV, Random, 95% CI) | 0.0 [0.0, 0.0] |
| 37 Infant Hb level at 3‐6 months | 0 | 0 | Mean Difference (IV, Random, 95% CI) | 0.0 [0.0, 0.0] |
| 37.1 High‐income setting | 0 | 0 | Mean Difference (IV, Random, 95% CI) | 0.0 [0.0, 0.0] |
| 37.2 Low‐income setting | 0 | 0 | Mean Difference (IV, Random, 95% CI) | 0.0 [0.0, 0.0] |
| 38 Infant iron indices (ferritin) at 3 to 6 months. | 0 | 0 | Risk Ratio (M‐H, Random, 95% CI) | 0.0 [0.0, 0.0] |
| 38.1 High‐income setting | 0 | 0 | Risk Ratio (M‐H, Random, 95% CI) | 0.0 [0.0, 0.0] |
| 38.2 Low‐income setting | 0 | 0 | Risk Ratio (M‐H, Random, 95% CI) | 0.0 [0.0, 0.0] |
| 39 Exclusive breastfeeding at discharge from hospital | 0 | 0 | Risk Ratio (M‐H, Random, 95% CI) | 0.0 [0.0, 0.0] |
| 39.1 High‐income setting | 0 | 0 | Risk Ratio (M‐H, Random, 95% CI) | 0.0 [0.0, 0.0] |
| 39.2 Low‐income setting | 0 | 0 | Risk Ratio (M‐H, Random, 95% CI) | 0.0 [0.0, 0.0] |
| 40 Neurodevelopmental, cognitive or developmental outcomes assessed after age 18 months. | 0 | 0 | Risk Ratio (M‐H, Random, 95% CI) | 0.0 [0.0, 0.0] |
| 40.1 High‐income setting | 0 | 0 | Risk Ratio (M‐H, Random, 95% CI) | 0.0 [0.0, 0.0] |
| 40.2 Low‐income setting | 0 | 0 | Risk Ratio (M‐H, Random, 95% CI) | 0.0 [0.0, 0.0] |
| 41 Return to hospital as in‐ or outpatient because of bleeding (not pre‐specified) | 0 | 0 | Risk Ratio (M‐H, Random, 95% CI) | 0.0 [0.0, 0.0] |
| 42 Postnatal maternal mean Hb (outcome not pre‐specified) Show forest plot | 1 | 1631 | Mean Difference (IV, Random, 95% CI) | 0.28 [0.14, 0.42] |
| 42.1 High‐income setting | 1 | 1631 | Mean Difference (IV, Random, 95% CI) | 0.28 [0.14, 0.42] |
| 42.2 Low‐income setting | 0 | 0 | Mean Difference (IV, Random, 95% CI) | 0.0 [0.0, 0.0] |
| 43 Severe primary PPH after placental delivery and up to 2 hours (clinically estimated or measured blood loss ≥ 1000 mL) ‐ not pre‐specified Show forest plot | 1 | 1621 | Risk Ratio (M‐H, Random, 95% CI) | 0.54 [0.39, 0.74] |
| 43.1 High‐income setting | 1 | 1621 | Risk Ratio (M‐H, Random, 95% CI) | 0.54 [0.39, 0.74] |
| 43.2 Low‐income setting | 0 | 0 | Risk Ratio (M‐H, Random, 95% CI) | 0.0 [0.0, 0.0] |
| 44 Severe primary PPH at time of birth and up to 2 hours (clinically estimated or measured blood loss ≥1000 mL) ‐ not pre‐specified Show forest plot | 1 | 1621 | Risk Ratio (M‐H, Random, 95% CI) | 0.60 [0.47, 0.78] |
| 44.1 High‐income setting | 1 | 1621 | Risk Ratio (M‐H, Random, 95% CI) | 0.60 [0.47, 0.78] |
| 44.2 Low‐income setting | 0 | 0 | Risk Ratio (M‐H, Random, 95% CI) | 0.0 [0.0, 0.0] |
| 45 Mean blood loss (mL) (clinically estimated or measured at birth and up to 2 hours (not pre‐specified) Show forest plot | 1 | 1621 | Mean Difference (IV, Random, 95% CI) | ‐49.0 [‐75.52, ‐22.48] |
| 45.1 High‐income setting | 1 | 1621 | Mean Difference (IV, Random, 95% CI) | ‐49.0 [‐75.52, ‐22.48] |
| 45.2 Low‐income setting | 0 | 0 | Mean Difference (IV, Random, 95% CI) | 0.0 [0.0, 0.0] |
| Outcome or subgroup title | No. of studies | No. of participants | Statistical method | Effect size |
| 1 Severe primary PPH at time of birth (clinically estimated or measured blood loss ≥ 1000 mL) | 0 | 0 | Risk Ratio (M‐H, Random, 95% CI) | 0.0 [0.0, 0.0] |
| 1.1 High‐income setting | 0 | 0 | Risk Ratio (M‐H, Random, 95% CI) | 0.0 [0.0, 0.0] |
| 1.2 Low‐income setting | 0 | 0 | Risk Ratio (M‐H, Random, 95% CI) | 0.0 [0.0, 0.0] |
| 2 Very severe primary PPH at time of birth (clinically estimated or measured blood loss ≥ 2500 mL) | 0 | 0 | Risk Ratio (M‐H, Random, 95% CI) | 0.0 [0.0, 0.0] |
| 2.1 High‐income setting | 0 | 0 | Risk Ratio (M‐H, Random, 95% CI) | 0.0 [0.0, 0.0] |
| 2.2 Low‐income setting | 0 | 0 | Risk Ratio (M‐H, Random, 95% CI) | 0.0 [0.0, 0.0] |
| 3 Maternal mortality | 0 | 0 | Risk Ratio (M‐H, Random, 95% CI) | 0.0 [0.0, 0.0] |
| 3.1 High‐income setting | 0 | 0 | Risk Ratio (M‐H, Random, 95% CI) | 0.0 [0.0, 0.0] |
| 3.2 Low‐income setting | 0 | 0 | Risk Ratio (M‐H, Random, 95% CI) | 0.0 [0.0, 0.0] |
| 4 Maternal Hb < 9 g/dL at 24‐72 hr Show forest plot | 1 | 130 | Risk Ratio (M‐H, Random, 95% CI) | 0.8 [0.34, 1.90] |
| 4.1 High‐income setting | 0 | 0 | Risk Ratio (M‐H, Random, 95% CI) | 0.0 [0.0, 0.0] |
| 4.2 Low‐income setting | 1 | 130 | Risk Ratio (M‐H, Random, 95% CI) | 0.8 [0.34, 1.90] |
| 5 Admission to neonatal special/intensive care | 0 | 0 | Risk Ratio (M‐H, Random, 95% CI) | 0.0 [0.0, 0.0] |
| 5.1 High‐income setting | 0 | 0 | Risk Ratio (M‐H, Random, 95% CI) | 0.0 [0.0, 0.0] |
| 5.2 Low‐income setting | 0 | 0 | Risk Ratio (M‐H, Random, 95% CI) | 0.0 [0.0, 0.0] |
| 6 Neonatal jaundice requiring phototherapy or exchange transfusion | 0 | 0 | Risk Ratio (M‐H, Random, 95% CI) | 0.0 [0.0, 0.0] |
| 6.1 High‐income setting | 0 | 0 | Risk Ratio (M‐H, Random, 95% CI) | 0.0 [0.0, 0.0] |
| 6.2 Low‐income setting | 0 | 0 | Risk Ratio (M‐H, Random, 95% CI) | 0.0 [0.0, 0.0] |
| 7 Neonatal polycythaemia treated with dilutional exchange transfusion | 0 | 0 | Risk Ratio (M‐H, Random, 95% CI) | 0.0 [0.0, 0.0] |
| 7.1 High‐income setting | 0 | 0 | Risk Ratio (M‐H, Random, 95% CI) | 0.0 [0.0, 0.0] |
| 7.2 Low‐income setting | 0 | 0 | Risk Ratio (M‐H, Random, 95% CI) | 0.0 [0.0, 0.0] |
| 8 Severe primary PPH after placental delivery and up to 24 hours (clinically estimated or measured blood loss ≥ 1000 mL) | 0 | 0 | Risk Ratio (M‐H, Random, 95% CI) | 0.0 [0.0, 0.0] |
| 8.1 High‐income setting | 0 | 0 | Risk Ratio (M‐H, Random, 95% CI) | 0.0 [0.0, 0.0] |
| 8.2 Low‐income setting | 0 | 0 | Risk Ratio (M‐H, Random, 95% CI) | 0.0 [0.0, 0.0] |
| 9 Severe primary PPH at time of birth and up to 24 hours (clinically estimated or measured blood loss ≥1000 mL) | 0 | 0 | Risk Ratio (M‐H, Random, 95% CI) | 0.0 [0.0, 0.0] |
| 9.1 High‐income setting | 0 | 0 | Risk Ratio (M‐H, Random, 95% CI) | 0.0 [0.0, 0.0] |
| 9.2 Low‐income setting | 0 | 0 | Risk Ratio (M‐H, Random, 95% CI) | 0.0 [0.0, 0.0] |
| 10 Primary blood loss ≥ 500 mL at time of birth (clinically estimated or measured) | 0 | 0 | Risk Ratio (M‐H, Random, 95% CI) | 0.0 [0.0, 0.0] |
| 10.1 High‐income setting | 0 | 0 | Risk Ratio (M‐H, Random, 95% CI) | 0.0 [0.0, 0.0] |
| 10.2 Low‐income setting | 0 | 0 | Risk Ratio (M‐H, Random, 95% CI) | 0.0 [0.0, 0.0] |
| 11 Primary blood loss ≥ 500 mL after delivery of placenta and up to 24 hours (clinically estimated or measured) | 0 | 0 | Risk Ratio (M‐H, Random, 95% CI) | 0.0 [0.0, 0.0] |
| 11.1 High‐income setting | 0 | 0 | Risk Ratio (M‐H, Random, 95% CI) | 0.0 [0.0, 0.0] |
| 11.2 Low‐income setting | 0 | 0 | Risk Ratio (M‐H, Random, 95% CI) | 0.0 [0.0, 0.0] |
| 12 Primary blood loss ≥ 500 mL at time of birth and up to 24 hours (clinically estimated or measured) | 0 | 0 | Risk Ratio (M‐H, Random, 95% CI) | 0.0 [0.0, 0.0] |
| 12.1 High‐income setting | 0 | 0 | Risk Ratio (M‐H, Random, 95% CI) | 0.0 [0.0, 0.0] |
| 12.2 Low‐income setting | 0 | 0 | Risk Ratio (M‐H, Random, 95% CI) | 0.0 [0.0, 0.0] |
| 13 Mean maternal blood loss (mL) at time of birth (clinically estimated or measured) | 0 | 0 | Mean Difference (IV, Random, 95% CI) | 0.0 [0.0, 0.0] |
| 13.1 High‐income setting | 0 | 0 | Mean Difference (IV, Random, 95% CI) | 0.0 [0.0, 0.0] |
| 13.2 Low‐income setting | 0 | 0 | Mean Difference (IV, Random, 95% CI) | 0.0 [0.0, 0.0] |
| 14 Mean maternal blood loss (mL) after delivery of placenta and up to 24 hours (clinically estimated or measured) | 0 | 0 | Mean Difference (IV, Random, 95% CI) | 0.0 [0.0, 0.0] |
| 14.1 High‐income setting | 0 | 0 | Mean Difference (IV, Random, 95% CI) | 0.0 [0.0, 0.0] |
| 14.2 Low‐income setting | 0 | 0 | Mean Difference (IV, Random, 95% CI) | 0.0 [0.0, 0.0] |
| 15 Mean maternal blood loss (mL) at time of birth and up to 24 hours (clinically estimated or measured) | 0 | 0 | Mean Difference (IV, Random, 95% CI) | 0.0 [0.0, 0.0] |
| 15.1 High‐income setting | 0 | 0 | Mean Difference (IV, Random, 95% CI) | 0.0 [0.0, 0.0] |
| 15.2 Low‐income setting | 0 | 0 | Mean Difference (IV, Random, 95% CI) | 0.0 [0.0, 0.0] |
| 16 Maternal blood transfusion | 0 | 0 | Risk Ratio (M‐H, Random, 95% CI) | 0.0 [0.0, 0.0] |
| 16.1 High‐income setting | 0 | 0 | Risk Ratio (M‐H, Random, 95% CI) | 0.0 [0.0, 0.0] |
| 16.2 Low‐income setting | 0 | 0 | Risk Ratio (M‐H, Random, 95% CI) | 0.0 [0.0, 0.0] |
| 17 Clinical signs of severe blood loss | 0 | 0 | Risk Ratio (M‐H, Random, 95% CI) | 0.0 [0.0, 0.0] |
| 17.1 High‐income setting | 0 | 0 | Risk Ratio (M‐H, Random, 95% CI) | 0.0 [0.0, 0.0] |
| 17.2 Low‐income setting | 0 | 0 | Risk Ratio (M‐H, Random, 95% CI) | 0.0 [0.0, 0.0] |
| 18 Therapeutic uterotonics during third stage and/or within 24 hours | 0 | 0 | Risk Ratio (M‐H, Random, 95% CI) | 0.0 [0.0, 0.0] |
| 18.1 High‐income setting | 0 | 0 | Risk Ratio (M‐H, Random, 95% CI) | 0.0 [0.0, 0.0] |
| 18.2 Low‐income setting | 0 | 0 | Risk Ratio (M‐H, Random, 95% CI) | 0.0 [0.0, 0.0] |
| 19 Mean length of third stage Show forest plot | 1 | 130 | Mean Difference (IV, Random, 95% CI) | ‐8.12 [‐9.72, ‐6.52] |
| 19.1 High‐income setting | 0 | 0 | Mean Difference (IV, Random, 95% CI) | 0.0 [0.0, 0.0] |
| 19.2 Low‐income setting | 1 | 130 | Mean Difference (IV, Random, 95% CI) | ‐8.12 [‐9.72, ‐6.52] |
| 20 Manual removal of placenta as defined by authors Show forest plot | 1 | 130 | Risk Ratio (M‐H, Random, 95% CI) | 1.0 [0.06, 15.65] |
| 20.1 High‐income setting | 0 | 0 | Risk Ratio (M‐H, Random, 95% CI) | 0.0 [0.0, 0.0] |
| 20.2 Low‐income setting | 1 | 130 | Risk Ratio (M‐H, Random, 95% CI) | 1.0 [0.06, 15.65] |
| 21 Postnatal diastolic blood pressure > 90 mmHg between birth of baby and discharge from the labour ward. | 0 | 0 | Risk Ratio (M‐H, Random, 95% CI) | 0.0 [0.0, 0.0] |
| 21.1 High‐income setting | 0 | 0 | Risk Ratio (M‐H, Random, 95% CI) | 0.0 [0.0, 0.0] |
| 21.2 Low‐income setting | 0 | 0 | Risk Ratio (M‐H, Random, 95% CI) | 0.0 [0.0, 0.0] |
| 22 Postnatal vomiting between birth of baby and discharge from the labour ward | 0 | 0 | Risk Ratio (M‐H, Random, 95% CI) | 0.0 [0.0, 0.0] |
| 22.1 High‐income setting | 0 | 0 | Risk Ratio (M‐H, Random, 95% CI) | 0.0 [0.0, 0.0] |
| 22.2 Low‐income setting | 0 | 0 | Risk Ratio (M‐H, Random, 95% CI) | 0.0 [0.0, 0.0] |
| 23 Any analgesia between birth of the baby and discharge from labour ward | 0 | 0 | Risk Ratio (M‐H, Random, 95% CI) | 0.0 [0.0, 0.0] |
| 23.1 High‐income setting | 0 | 0 | Risk Ratio (M‐H, Random, 95% CI) | 0.0 [0.0, 0.0] |
| 23.2 Low‐income setting | 0 | 0 | Risk Ratio (M‐H, Random, 95% CI) | 0.0 [0.0, 0.0] |
| 24 Women's assessment of pain during third stage as reported by authors | 0 | 0 | Risk Ratio (M‐H, Random, 95% CI) | 0.0 [0.0, 0.0] |
| 24.1 High‐income setting | 0 | 0 | Risk Ratio (M‐H, Random, 95% CI) | 0.0 [0.0, 0.0] |
| 24.2 Low‐income setting | 0 | 0 | Risk Ratio (M‐H, Random, 95% CI) | 0.0 [0.0, 0.0] |
| 25 Secondary blood loss/any vaginal bleeding needing treatment (after 24 hours and up to 6 weeks) | 0 | 0 | Risk Ratio (M‐H, Random, 95% CI) | 0.0 [0.0, 0.0] |
| 25.1 High‐income setting | 0 | 0 | Risk Ratio (M‐H, Random, 95% CI) | 0.0 [0.0, 0.0] |
| 25.2 Low‐income setting | 0 | 0 | Risk Ratio (M‐H, Random, 95% CI) | 0.0 [0.0, 0.0] |
| 26 Amount of lochia either estimated or measured after 24 hours and up to discharge from hospital | 0 | 0 | Mean Difference (IV, Random, 95% CI) | 0.0 [0.0, 0.0] |
| 26.1 High‐income setting | 0 | 0 | Mean Difference (IV, Random, 95% CI) | 0.0 [0.0, 0.0] |
| 26.2 Low‐income setting | 0 | 0 | Mean Difference (IV, Random, 95% CI) | 0.0 [0.0, 0.0] |
| 27 Surgical evacuation of retained products of conception | 0 | 0 | Risk Ratio (M‐H, Random, 95% CI) | 0.0 [0.0, 0.0] |
| 27.1 High‐income setting | 0 | 0 | Risk Ratio (M‐H, Random, 95% CI) | 0.0 [0.0, 0.0] |
| 27.2 Low‐income setting | 0 | 0 | Risk Ratio (M‐H, Random, 95% CI) | 0.0 [0.0, 0.0] |
| 28 Afterpains ‐ abdominal pain associated with the contracting uterus in the postpartum period | 0 | 0 | Risk Ratio (M‐H, Random, 95% CI) | 0.0 [0.0, 0.0] |
| 28.1 High‐income setting | 0 | 0 | Risk Ratio (M‐H, Random, 95% CI) | 0.0 [0.0, 0.0] |
| 28.2 Low‐income setting | 0 | 0 | Risk Ratio (M‐H, Random, 95% CI) | 0.0 [0.0, 0.0] |
| 29 Apgar score < 7 at 5 minutes | 0 | 0 | Risk Ratio (M‐H, Random, 95% CI) | 0.0 [0.0, 0.0] |
| 29.1 High‐income setting | 0 | 0 | Risk Ratio (M‐H, Random, 95% CI) | 0.0 [0.0, 0.0] |
| 29.2 Low‐income setting | 0 | 0 | Risk Ratio (M‐H, Random, 95% CI) | 0.0 [0.0, 0.0] |
| 30 Birthweight | 0 | 0 | Mean Difference (IV, Random, 95% CI) | 0.0 [0.0, 0.0] |
| 30.1 High‐income setting | 0 | 0 | Mean Difference (IV, Random, 95% CI) | 0.0 [0.0, 0.0] |
| 30.2 Low‐income setting | 0 | 0 | Mean Difference (IV, Random, 95% CI) | 0.0 [0.0, 0.0] |
| 31 Neonatal encephalopathy assessed using Sarnat staging (Sarnat 1976; Table 1) | 0 | 0 | Risk Ratio (M‐H, Random, 95% CI) | 0.0 [0.0, 0.0] |
| 31.1 High‐income setting | 0 | 0 | Risk Ratio (M‐H, Random, 95% CI) | 0.0 [0.0, 0.0] |
| 31.2 Low‐income setting | 0 | 0 | Risk Ratio (M‐H, Random, 95% CI) | 0.0 [0.0, 0.0] |
| 32 Neonatal mortality | 0 | 0 | Risk Ratio (M‐H, Random, 95% CI) | 0.0 [0.0, 0.0] |
| 32.1 High‐income setting | 0 | 0 | Risk Ratio (M‐H, Random, 95% CI) | 0.0 [0.0, 0.0] |
| 32.2 Low‐income setting | 0 | 0 | Risk Ratio (M‐H, Random, 95% CI) | 0.0 [0.0, 0.0] |
| 33 Intraventricular haemorrhage ‐ Papille grade III/IV ‐ (for infants born before 34 weeks' gestation only). | 0 | 0 | Risk Ratio (M‐H, Random, 95% CI) | 0.0 [0.0, 0.0] |
| 33.1 High‐income setting | 0 | 0 | Risk Ratio (M‐H, Random, 95% CI) | 0.0 [0.0, 0.0] |
| 33.2 Low‐income setting | 0 | 0 | Risk Ratio (M‐H, Random, 95% CI) | 0.0 [0.0, 0.0] |
| 34 Number of infants who received a red blood cell transfusion. | 0 | 0 | Risk Ratio (M‐H, Random, 95% CI) | 0.0 [0.0, 0.0] |
| 34.1 High‐income setting | 0 | 0 | Risk Ratio (M‐H, Random, 95% CI) | 0.0 [0.0, 0.0] |
| 34.2 Low‐income setting | 0 | 0 | Risk Ratio (M‐H, Random, 95% CI) | 0.0 [0.0, 0.0] |
| 35 Infant Hb level at 24 to 72 hours | 0 | 0 | Mean Difference (IV, Random, 95% CI) | 0.0 [0.0, 0.0] |
| 35.1 High‐income setting | 0 | 0 | Mean Difference (IV, Random, 95% CI) | 0.0 [0.0, 0.0] |
| 35.2 Low‐income setting | 0 | 0 | Mean Difference (IV, Random, 95% CI) | 0.0 [0.0, 0.0] |
| 36 Infant Hb level at 3‐6 months | 0 | 0 | Mean Difference (IV, Random, 95% CI) | 0.0 [0.0, 0.0] |
| 36.1 High‐income setting | 0 | 0 | Mean Difference (IV, Random, 95% CI) | 0.0 [0.0, 0.0] |
| 36.2 Low‐income setting | 0 | 0 | Mean Difference (IV, Random, 95% CI) | 0.0 [0.0, 0.0] |
| 37 Infant iron indices (ferritin) at 3 to 6 months. | 0 | 0 | Risk Ratio (M‐H, Random, 95% CI) | 0.0 [0.0, 0.0] |
| 37.1 High‐income setting | 0 | 0 | Risk Ratio (M‐H, Random, 95% CI) | 0.0 [0.0, 0.0] |
| 37.2 Low‐income setting | 0 | 0 | Risk Ratio (M‐H, Random, 95% CI) | 0.0 [0.0, 0.0] |
| 38 Exclusive breastfeeding at discharge from hospital | 0 | 0 | Risk Ratio (M‐H, Random, 95% CI) | 0.0 [0.0, 0.0] |
| 38.1 High‐income setting | 0 | 0 | Risk Ratio (M‐H, Random, 95% CI) | 0.0 [0.0, 0.0] |
| 38.2 Low‐income setting | 0 | 0 | Risk Ratio (M‐H, Random, 95% CI) | 0.0 [0.0, 0.0] |
| 39 Neurodevelopmental, cognitive or developmental outcomes assessed after age 18 months. | 0 | 0 | Risk Ratio (M‐H, Random, 95% CI) | 0.0 [0.0, 0.0] |
| 39.1 High‐income setting | 0 | 0 | Risk Ratio (M‐H, Random, 95% CI) | 0.0 [0.0, 0.0] |
| 39.2 Low‐income setting | 0 | 0 | Risk Ratio (M‐H, Random, 95% CI) | 0.0 [0.0, 0.0] |
| 40 Return to hospital as in‐ or outpatient because of bleeding (not pre‐specified) | 0 | 0 | Risk Ratio (M‐H, Random, 95% CI) | 0.0 [0.0, 0.0] |
| 40.1 High‐income setting | 0 | 0 | Risk Ratio (M‐H, Random, 95% CI) | 0.0 [0.0, 0.0] |
| 40.2 Low‐income setting | 0 | 0 | Risk Ratio (M‐H, Random, 95% CI) | 0.0 [0.0, 0.0] |
| 41 Postnatal maternal mean Hb (outcome not pre‐specified) | 0 | 0 | Mean Difference (IV, Random, 95% CI) | 0.0 [0.0, 0.0] |
| 41.1 High‐income setting | 0 | 0 | Mean Difference (IV, Random, 95% CI) | 0.0 [0.0, 0.0] |
| 41.2 Low‐income setting | 0 | 0 | Mean Difference (IV, Random, 95% CI) | 0.0 [0.0, 0.0] |