Active versus expectant management for women in the third stage of labour
Abstract
Background
Active management of the third stage of labour involves giving a prophylactic uterotonic, early cord clamping and controlled cord traction to deliver the placenta. With expectant management, signs of placental separation are awaited and the placenta is delivered spontaneously. Active management was introduced to try to reduce haemorrhage, a major contributor to maternal mortality in low‐income countries.
Objectives
To compare the effectiveness of active versus expectant management of the third stage of labour.
Search methods
We searched the Cochrane Pregnancy and Childbirth Group Trials Register (30 September 2014) and reference lists of retrieved studies.
Selection criteria
Randomised and quasi‐randomised controlled trials comparing active versus expectant management of the third stage of labour.
Data collection and analysis
Two review authors independently assessed the studies for inclusion, assessed risk of bias and carried out data extraction.
Main results
We included seven studies (involving 8247 women), all undertaken in hospitals, six in high‐income countries and one in a low‐income country. Four studies compared active versus expectant management, and three compared active versus a mixture of managements. We used random‐effects in the analyses because of clinical heterogeneity. There was an absence of high‐quality evidence according to GRADE assessments for our primary outcomes. The evidence suggested that for women at mixed levels of risk of bleeding, active management showed a reduction in the average risk of maternal primary haemorrhage at time of birth (more than 1000 mL) (average risk ratio (RR) 0.34, 95% confidence interval (CI) 0.14 to 0.87, three studies, 4636 women, GRADE:very low quality) and of maternal haemoglobin (Hb) less than 9 g/dL following birth (average RR 0.50, 95% CI 0.30 to 0.83, two studies, 1572 women, GRADE:low quality). We also found no difference in the incidence in admission of infants to neonatal units (average RR 0.81, 95% CI 0.60 to 1.11, two studies, 3207 infants, GRADE:low quality) nor in the incidence of infant jaundice requiring treatment (0.96, 95% CI 0.55 to 1.68, two studies, 3142 infants, GRADE:very low quality). There were no data on our other primary outcomes of very severe postpartum haemorrhage (PPH) at the time of birth (more than 2500 mL), maternal mortality, or neonatal polycythaemia needing treatment.
Active management also showed a significant decrease in primary blood loss greater than 500 mL, and mean maternal blood loss at birth, maternal blood transfusion and therapeutic uterotonics during the third stage or within the first 24 hours, or both, and significant increases in maternal diastolic blood pressure, vomiting after birth, after‐pains, use of analgesia from birth up to discharge from the labour ward and more women returning to hospital with bleeding (outcome not pre‐specified). There was also a decrease in the baby's birthweight with active management, reflecting the lower blood volume from interference with placental transfusion.
In the subgroup of women at low risk of excessive bleeding, there were similar findings, except there was no significant difference identified between groups for severe haemorrhage or maternal Hb less than 9 g/dL (at 24 to 72 hours).
Hypertension and interference with placental transfusion might be avoided by using modifications to the active management package, e.g. omitting ergot and deferring cord clamping, but we have no direct evidence of this here.
Authors' conclusions
Although there is a lack of high‐quality evidence, active management of the third stage reduced the risk of haemorrhage greater than 1000 mL at the time of birth in a population of women at mixed risk of excessive bleeding, but adverse effects were identified. Women should be given information on the benefits and harms of both methods to support informed choice. Given the concerns about early cord clamping and the potential adverse effects of some uterotonics, it is critical now to look at the individual components of third‐stage management. Data are also required from low‐income countries.
PICO
Plain language summary
Delivering the placenta with active, expectant or mixed management in the third stage of labour
Background
Once a baby is born, the womb (uterus) continues to contract, causing the placenta to separate from the wall of the uterus. The mother then delivers the placenta, or 'after‐birth'. This is called expectant management of the third stage of labour. Active management of the third stage involves three components: 1) giving a drug (a uterotonic) to contract the uterus; 2) clamping the cord early (usually before, alongside, or immediately after giving the uterotonic), and this is before cord pulsation stops; 3) traction is applied to the cord with counter‐pressure on the uterus to deliver the placenta (controlled cord traction). Specific ways the three components are used often vary. Mixed management uses some, but not all, of the three components. Active management was introduced to try to reduce severe blood loss at birth (haemorrhage). This is a major cause of women dying in low‐income countries where women are more likely to be poorly nourished, anaemic and have infectious diseases. In high‐income countries, severe bleeding occurs much less often, yet active management has become standard practice in many countries.
Our review question
In this review, we looked at different ways of managing the third stage of labour, and asked what are the benefits and harms for all women and, specifically, for women at low risk of severe bleeding? We found seven studies involving 8247 women as of May 2014. All were in hospital settings, six in high‐income countries and one in a low‐income country. Four studies compared active with expectant management and three compared active with mixed management.
What the studies showed
Overall, the quality of the evidence was generally low and more data are needed to be confident in the findings. For all women, irrespective of their risk of severe bleeding, active management reduced severe bleeding and anaemia. However, it also reduced the baby’s birthweight and increased the mother's blood pressure, after‐pains, vomiting and the number of women returning to hospital with bleeding. For women at low risk of bleeding, findings were similar though there was no difference in risk of severe bleeding.
Overall
Women should be given information antenatally to help them make informed choices. Some adverse effects experienced by mothers may possibly be avoided by using specific drugs. Delaying cord clamping may benefit the baby by preventing the reduction in birth weight from early cord clamping, but more research is needed. Also, it may be that just giving a uterotonic might reduce severe bleeding, without using the other parts of active management. More research is particularly needed in low‐income countries.
Authors' conclusions
Summary of findings
| Active versus expectant management of the third stage of labour (all women) | ||||||
| Population: all women who expected a vaginal birth at 24 weeks' gestation or later | ||||||
| Outcomes | Illustrative comparative risks* (95% CI) | Relative effect | No of Participants | Quality of the evidence | Comments | |
| Assumed risk | Corresponding risk | |||||
| Expectant management of the third stage of labour | Active management of the third stage of labour | |||||
| Severe primary postpartum haemorrhage (PPH) (clinically estimated or measured blood loss ≥ to 1000 mL at time of birth) | 24 per 1000 | 8 per 1000 | RR 0.34 | 4636 | ⊕⊝⊝⊝ | |
| Very severe primary PPH (clinically estimated or measured blood loss ≥ to 2500 mL at time of birth) | See comment | See comment | Not estimable | 0 | See comment | No data |
| Maternal mortality | See comment | See comment | Not estimable | 0 | See comment | No data |
| Maternal Hb < 9 g/dL 24 to 72 hours postpartum | 71 per 1000 | 36 per 1000 | RR 0.5 | 1572 | ⊕⊕⊝⊝ | |
| Admission to neonatal special/intensive care | 52 per 1000 | 42 per 1000 | RR 0.81 | 3207 | ⊕⊕⊝⊝ | |
| Neonatal jaundice requiring phototherapy or exchange transfusion | 49 per 1000 | 47 per 1000 | RR 0.96 | 3142 | ⊕⊝⊝⊝ | |
| Neonatal polycythaemia treated with dilutional exchange transfusion | See comment | See comment | Not estimable | 0 | See comment | No data |
| *The basis for the assumed risk (e.g. the median control group risk across studies) is provided in footnotes. The corresponding risk (and its 95% confidence interval) is based on the assumed risk in the comparison group and the relative effect of the intervention (and its 95% CI). | ||||||
| GRADE Working Group grades of evidence | ||||||
| 1Risk of bias: of the 3 trials providing data for this outcome, all 3 are at low risk of bias for sequence generation (selection bias), allocation concealment (selection bias) and for incomplete outcome data (attrition bias). 2 are at low risk of selective reporting (reporting bias) and 1 is unclear. 1 study is at high risk of other bias (see 'Risk of bias' tables). 2Risk of bias: of the 2 trials providing data for this outcome, both are at low risk of bias for sequence generation (selection bias) and allocation concealment (selection bias), 1 is at low risk of bias for incomplete outcome data (attrition bias) while the other is high‐risk. 1 is at high‐‐risk of selective reporting (reporting bias) and 1 is unclear. Both studies are at high risk of other bias (see 'Risk of bias' tables). 3Risk of bias: of the 2 trials providing data for this outcome, both are at low risk of bias for sequence generation (selection bias), allocation concealment (selection bias) and for incomplete outcome data (attrition bias). 1 is at low‐risk of selective reporting (reporting bias) and 1 is unclear. 1 study is at high risk of other bias and the other is at low risk of bias (see 'Risk of bias' tables). 4Risk of bias: Of the 2 trials providing data for this outcome, both are at low risk of bias for sequence generation (selection bias), allocation concealment (selection bias) and for incomplete outcome data (attrition bias). 1 is at low‐risk of selective reporting (reporting bias) and 1 is unclear. 1 study is at high risk of other bias and the other is at low risk of bias (see 'Risk of bias' tables). | ||||||
Background
Description of the condition
The third stage of labour is the time from the birth of the baby to the expulsion of the placenta and membranes. Once the baby is born, the uterus continues to contract and reduce in size. There is a lack of full understanding of the physiology of the third stage of labour, but recent work using ultrasonography has demonstrated that the process of placental separation has three distinct phases (Herman 2002). The first, or latent phase, consists of strong uterine contractions, which lead to thickening of the uterine muscle, thus causing a shearing force to occur between the elastic uterine wall and the more rigid placenta (Herman 2002). Continued contractions lead to gradual separation of the placenta, commencing at one of the poles (most commonly the lower) and spreading slowly during the contraction or detachment phase until full separation occurs. This is followed by delivery of the placenta in the expulsion phase (Herman 2002). Muscle fibres surrounding the maternal vessels contract to prevent excessive bleeding (Inch 1985) and the mother's coagulation system is activated temporarily (Bonnar 1970).
There is always some blood loss during the third stage of labour as the placenta separates and is delivered, but what might be considered a normal amount of loss is the subject of debate (Gyte 1992). Nevertheless, some women can suffer from considerable blood loss during or after the third stage of labour. This can be a primary haemorrhage (within the first 24 hours) (Mousa 2014) or a secondary haemorrhage (between 24 hours and six weeks) (McDonald 2003). Postpartum haemorrhage (PPH) is commonly defined as a blood loss in excess of 500 mL (WHO 2003), with severe haemorrhage being a loss of 1000 mL or more and very severe haemorrhage being a loss of 2500 mL or more (Bloomfield 1990; Greer 1998; Penney 2005). However, the impact of blood loss at birth on an individual woman can vary considerably and will depend not only on the volume of blood lost, but also on her general state of health, the speed of the loss, her haemoglobin (Hb) levels at the time and her coagulation system. It is well documented that blood loss is consistently under‐ or over‐estimated by clinicians (Razvi 2008), although many centres do try to measure and record blood loss accurately. In well‐nourished women, some consider that, in general, there is little impact from a blood loss of 500 mL (Bloomfield 1990), this being equivalent to a routine blood donation (Burnley 2006), but in women in low‐income countries who may be poorly nourished and anaemic, this loss can cause considerable morbidity or mortality. It has been estimated that at least 25% of maternal deaths in a number of countries are due to haemorrhage ‐ most due to PPH (Abouzaher 1998; Khan 2006). The vast majority of these happen in the developing world, and PPH is the leading cause of maternal mortality in sub‐Saharan Africa (Lazarus 2005). However, a study in Mexico (Romero‐Gutierrez 2007) reported that while the leading cause of maternal death was haemorrhage, two‐thirds of bleeding‐related deaths resulted from placental abruption, placenta accreta, placenta praevia, and peripartum hysterectomy, rather than uterine atony (poor contraction of the muscles in the uterus). Significant morbidity does occur, though, from major bleeding due to uterine atony, which is far more common than the other causes of bleeding listed above. The seriousness with which PPH is viewed by professionals is evidenced in joint policy statements between the International Confederation of Midwives (ICM) and the International Federation of Gynaecology and Obstetrics (FIGO) (ICM‐FIGO 2003; ICM‐FIGO 2006), and the World Health Organization (WHO 2003), all of which have recommended active management of the third stage of labour. Debate continues among women and practitioners on the optimum method of management of the third stage of labour to balance the benefits and harms.
There are two distinct approaches to the clinical management of the third stage of labour: expectant and active management. However, a third approach is sometimes used that consists of a combination of components of both expectant and active management: this has been referred to as 'mixed management' or the 'piecemeal approach' (Prendiville 1989). Expectant, active and mixed management approaches, and comparisons of different types of active management, have been the subject of a number of critical reviews (Elbourne 1995; Gyte 1994; Maughan 2006; McDonald 2007a; Prendiville 1989; Prendiville 1996; Soltani 2008).
Description of the intervention
(a) Expectant management of the third stage of labour
Expectant management is also known as conservative or physiological management and is popular in some northern European countries (Nordstrom 1997) and in New Zealand (Dixon 2013). It is also practised on occasion in midwife‐led units and in home births in the United Kingdom and Ireland (Begley 2009; Blackburn 2008; Fry 2007; Kanikosmay 2007), and is the usual practice in domiciliary care in some parts of the developing world. The main principle of expectant management is a 'hands off' approach, where signs of placental separation are awaited and the placenta is delivered spontaneously or with the aid of gravity, maternal pushing or, sometimes, nipple stimulation (Begley 2012; Inch 1985), hence:
-
a prophylactic uterotonic agent is not administered;
-
ideally, the umbilical cord is neither clamped nor cut until the placenta has been delivered but, as a minimum, caregivers have waited until cord pulsation has ceased; and
-
the placenta is delivered spontaneously with the aid of gravity and sometimes by maternal effort (Begley 2012; Rogers 1998).
There can be variations within expectant management. For example, some caregivers will wait for the placenta to be delivered before clamping and cutting the cord whilst others, for convenience, just wait until pulsation has finished. Breastfeeding or other means of stimulating the physiological release of oxytocin, such as nipple stimulation, is sometimes also used (Bullough 1989) but is not an essential component of expectant management.
(b) Active management of the third stage of labour
In active management of the third stage of labour, the clinician intervenes by using the following package of interventions (Prendiville 1989):
-
the routine administration of a prophylactic uterotonic drug just before, with, or immediately after, the birth of the baby;
-
early cord clamping and cutting* (i.e. prior to, alongside, or immediately after administration of an oxytocic, which is before cord pulsation ceases); and
-
controlled cord traction to deliver the placenta.
* current WHO recommendations (WHO 2012) are to delay cord clamping, although the National Institute for Health and Clinical Excellence (NICE) still supports early cord clamping (NICE 2007).
These interventions are implemented routinely and prophylactically in an attempt to reduce the blood loss associated with the third stage of labour and to reduce the risk of PPH. There are many possible variations with this package of interventions.
-
There are different uterotonic drugs that can be used, e.g. oxytocin (intravenous (IV) or intramuscular (IM)); syntometrine (IM); ergometrine (IV or IM); misoprostol (IM) (Liabsuetrakul 2007; McDonald 2007b; Su 2012; Tunçalp 2012; Westhoff 2013). There is also debate over the route of administration and dosage of the drugs used. However, recent guidelines from WHO, FIGO, ICM and NICE all recommend the use of 10 IU (international units) of oxytocin IM ((ICM‐FIGO 2003; NICE 2007; WHO 2012). Misoprostol is potentially the most important uterotonic for use in some low‐income countries because it is stable at ambient temperatures and is inexpensive (Parsons 2007). However, it does have adverse side effects (Mousa 2014), such as shivering, nausea and headaches, and it has been shown to be less effective than other agents (Tunçalp 2012).
-
There are differing timings for giving the prophylactic uterotonic drug, e.g. with the crowning of the baby's head; with the birth of the anterior shoulder; immediately after the birth of the baby; after the birth of the baby but before the placenta is delivered (Harris 2004) and after the placenta is delivered (Winter 2007). The timing of administration of uterotonic drugs is the subject of another Cochrane review (Soltani 2010).
-
There can be variation in the time when the cord is clamped and cut; this can be immediately the baby is born; within a set time after the birth, e.g. within 30 seconds, or a minute; or anytime before umbilical cord pulsation ceases (McDonald 2013; Rabe 2012; Van Rheenan 2007).
-
There are also different timings for the initiation of controlled cord traction, such as waiting for signs of placental separation or not (McDonald 2003).
-
There can also be a delay in using the whole package of active management until after cord pulsation ceases, which has been described as ‘delayed active management’ (Gyte 2006).
-
Some guidelines (e.g. ICM‐FIGO 2003) add uterine massage to the active management package although there is little evidence to support this (Abdel‐Aleem 2010).
Placental cord drainage is sometimes used with active management of the third stage. This involves releasing the clamp on the maternal end of the umbilical cord to allow the blood from the placental side to drain, thus reducing the size of the placenta and thereby hoping to help separation and reduce the chance of a retained placenta (Prendiville 1989; Soltani 2011).
Some of these variations in the components of active management of the third stage of labour may no longer be considered good practice (e.g.,early cord clamping), but may, nonetheless, be used in included studies identified for this review.
(c) Mixed management of the third stage of labour
Mixed management of the third stage of labour, (or 'combined' or 'piecemeal' management), which consists of a mixture of some of the components of both active and expectant management of the third stage, but without exclusively containing all the components of either. Although active management of the third stage is usually recommended (ICM‐FIGO 2006; NICE 2007; WHO 2003), there are many variations, and in practice some women may actually receive mixed management (Harris 2006; Mercer 2000). Mixed management of the third stage might include, for example: (1) early uterotonic administration, cord clamping after pulsation ceases and controlled cord traction; or (2) delayed uterotonic administration until cord pulsation ceases, then cord clamping and controlled cord traction. These forms of mixed management of the third stage are of interest because of the evidence of benefits from delayed cord clamping for the baby (McDonald 2013; Mercer 2008; Rabe 2012).
How the intervention might work
Expectant management
Expectant management of the third stage relies on the natural contractions of the uterus, stimulated by a surge of physiological oxytocin at birth, and anything that interferes with this oxytocin release may reduce the effectiveness of the physiological process in the third stage (Inch 1985). Release of oxytocin can, for example, be inhibited by anxiety through the excess release of adrenaline (Buckley 2004).
Hence, expectant management of the third stage of labour is commonly only considered appropriate following a labour where there has been no interference with the natural release of oxytocin, e.g. where oxytocin augmentation, induction, epidural or narcotic analgesia, or both, have not been used (Buckley 2004; Fry 2007); but some will consider that these aspects still need to be assessed in well‐designed studies. This type of labour is more likely when the woman has positive psychological support from her midwife, or other trained supporter, who encourages her to listen to her body's messages about movement, positioning, hydration and nutrition (Buckley 2004; Hodnett 2013; Sandall 2013).
Active management
In active management of the third stage of labour, it is suggested that the prophylactic administration of a uterotonic will reduce bleeding and the risk of severe haemorrhage (Greer 1998; Prendiville 1989). The role of early cord clamping and controlled cord traction in the reduction of bleeding is less clear, but it is thought that once the uterotonic drug has been administered, it is important to deliver the placenta quickly to prevent it being retained. Applying a clamp to the cord thus gives the caregiver something to grasp in order to deliver the placenta quickly by applying controlled cord traction. Active management of the third stage has been standard practice in many parts of the world for many years (Prendiville 1989). Recently, however, arguments have been put forward for a delay in cord clamping, pointing out that it is not an evidence‐based part of the package of active management (Weeks 2007). A Cochrane review found that neither early nor late cord clamping showed any significant difference in PPH rates (McDonald 2013).
A number of Cochrane reviews have been conducted examining different aspects of active management of the third stage of labour. These include reviews on prophylactic oxytocin in the third stage of labour (Westhoff 2013); prophylactic ergometrine‐oxytocin versus oxytocin for the third stage of labour (McDonald 2007b); prophylactic use of ergot alkaloids in the third stage of labour (Liabsuetrakul 2007); prostaglandins for preventing PPH (Tunçalp 2012); oxytocin agonists for preventing PPH (Su 2012); timing of cord clamping in term infants (McDonald 2013) and timing of cord clamping in preterm infants (Rabe 2012).
Potential adverse effects
Interventions used in active management of third stage have some adverse effects, due mainly to the uterotonic drugs used and to the common practice of early clamping of the cord.
Uterotonic drugs can increase the risk of hypertension, nausea and vomiting for women (Maughan 2006), and which appear to be related to the use of ergometrine‐based drugs. Active management in many countries has moved away from ergometrine‐based uterotonics, for this reason, and possibly also due to clinicians' fear of retained placenta, although a review of ergometrine‐based drugs compared with other uterotonics showed no difference in rates of manual removal of placentae (McDonald 2007b).
The potential consequences for the newborn infant of active management of the third stage of labour relate mainly to the timing of cord clamping. The effects on the neonate of early versus deferred cord clamping have been explored in Cochrane and other systematic reviews (Hutton 2007; McDonald 2013; Rabe 2012). Early cord clamping reduces the volume of placental blood transfusion and thus reduces the baby's blood volume at birth by about 20% for term infants (RCOG 2009; Werner 2005). This results in lower blood haematocrit (HCT) levels and Hb concentrations after birth in term infants but the long‐term importance of this effect is unknown (Hutton 2007; McDonald 2013; Prendiville 1989; Van Rheenan 2007). Potentially, placental transfusion may be more important for infants born in low‐ and middle‐income settings where iron‐deficiency anaemia exacerbated by nutritional and infectious insults may have substantial and long‐term adverse effects on growth and development (Van Rheenan 2007). For preterm infants, another specific concern is the effect of postnatal placental transfusion on neonatal haemodynamic transition processes. The Cochrane review of early versus delayed cord clamping for preterm infants found some evidence that infants who had early cord clamping had a higher risk of hypotension treated with volume‐transfusion and of intraventricular haemorrhage (Rabe 2012).
In contrast, early cord clamping also results in lower postnatal levels of plasma bilirubin and a lower incidence of neonatal jaundice that requires phototherapy (McDonald 2013; Rabe 2012). Treatment of neonatal jaundice may result in mother‐infant separation that delays the initiation and establishment of breastfeeding and disrupts early neonatal metabolic adaptation (Mercer 2001). For infants born in low‐ or middle‐income settings, or in rural or remote settings distant from healthcare facilities, the need for phototherapy (or its lack of availability) may be of greater clinical importance.
If uterotonic drugs are administered before delivery of the infant, for example, inadvertently prior to the birth of an undiagnosed twin, then disruption of the placental‐uterine wall interface and interruption of placental‐umbilical blood flow may cause acute perinatal asphyxia compromising neonatal cardio‐respiratory transition. Newborn infants compromised at birth are more likely to need transition support (cardio‐respiratory resuscitation). If an asphyxial insult has been severe or prolonged (for example, if exacerbated by obstructed labour such as shoulder dystocia) then other potential consequences may include neonatal encephalopathy with its associated risk of mortality and long‐term neurodevelopmental morbidity.
Why it is important to do this review
This review was undertaken because of the need to determine if active, expectant management, or a mixed management package, was most likely to be of overall benefit. It is important to assess the impact of all these forms of care on both the mother and baby. We believe that this review is highly relevant to families and clinicians, as women frequently enquire about the differences in third‐stage management during the antenatal period.
Objectives
-
To compare the effects of active versus expectant management of the third stage of labour on severe primary PPH and other maternal and infant outcomes.
-
To compare variations in the packages of active and expectant management of the third stage of labour on severe primary PPH and other maternal and infant outcomes.
Methods
Criteria for considering studies for this review
Types of studies
We included all randomised, and quasi‐randomised, controlled trials of active versus expectant management of the third stage of labour.
Types of participants
All women who expected a vaginal birth at 24 weeks' gestation or later. We looked at women in high‐income countries separately from women in low‐/middle‐income countries.
Types of interventions
(a) Active management of the third stage of labour, which is here defined as the package of interventions comprising:
-
the administration of a prophylactic uterotonic just before, with, or immediately after the birth of the baby;
-
early cord clamping and cutting (from immediately after the birth of the baby's head in the case of a nuchal cord, or immediately after the birth of the baby to, usually, within a minute of birth);
-
controlled cord traction to aid the delivery of the placenta.
(b) Expectant management of the third stage of labour, which is here defined as:
-
no prophylactic administration of a uterotonic;
-
the umbilical cord is neither clamped nor cut until the placenta has been delivered or until cord pulsation has ceased; and
-
the placenta is delivered spontaneously with the aid of gravity and sometimes by maternal effort;
-
none of the components of active management, described above, are employed routinely.
(c) Mixed management of the third stage of labour consists of a mixture of some of the components of both active and expectant management of the third stage, but without exclusively containing all the components of either (Table 1).
| Terms | Definitions used in this review | ||||||
| Expectant management of third stage of labour | 1. A prophylactic uterotonic agent is not administered; | ||||||
| Active management of third stage of labour | 1. The routine administration of a prophylactic uterotonic drug just before, with, or immediately after, the birth of the baby; | ||||||
| Mixed management of third stage of labour | A mixture of some of the components of both active and expectant management of third stage, but without exclusively containing all the components of either. There can be a number of different mixed third stage managements, for example: | ||||||
| Early prophylactic uterotonic | Prophylactic uterotonic drug administered just before, with, or immediately after, the birth of the infant. | ||||||
| Delayed prophylactic uterotonic | Prophylactic uterotonic drug administered after the cord pulsation has ceased. | ||||||
| Early cord clamping | The application of a clamp to the umbilical cord within 60 seconds of the birth of the infant (McDonald 2013). | ||||||
| Delayed cord clamping | The application of a clamp to the umbilical cord greater than 1 minute after birth or when cord pulsation has ceased (McDonald 2013). | ||||||
| Sarnat staging for hypoxic ischaemic encephalopathy (Sarnat 1976) | Stage 1 (mild): hyper‐alertness, hyper‐reflexia, dilated pupils, tachycardia, absence of seizures. Stage 2 (moderate): lethargy, hyper‐reflexia, miosis, bradycardia, seizures, hypotonia with weak suck and Moro reflexes. Stage 3 (severe): stupor, flaccidity, small to mid‐position pupils which react poorly to light, decreased stretch reflexes, hypothermia and absent Moro. | ||||||
Comparisons
-
Active versus expectant management of the third stage of labour.
-
Active versus mixed management with early prophylactic uterotonic administration, delayed cord clamping and controlled cord traction.
-
Active versus mixed management, with delayed prophylactic uterotonic administration, delayed cord clamping and controlled cord traction.
-
Active management with prophylactic uterotonic given before or with the birth of baby versus active management with prophylactic uterotonic drug given immediately after birth of the baby.
-
Expectant versus mixed management with early prophylactic uterotonic administration, delayed cord clamping and controlled cord traction.
-
Expectant versus mixed management with delayed prophylactic uterotonic administration, delayed cord clamping and controlled cord traction.
Comparisons two to six were included because of the review team's awareness of these different forms of clinical management of the third stage of labour and following the results of two reviews that indicated the benefits of delaying cord clamping for the baby (McDonald 2013; Rabe 2012). There are other variations of mixed management that could also be considered, e.g. variations in controlled cord traction (Mshweshwe 2009), but we considered the above to be the most commonly used and thus important to review.
Types of outcome measures
We selected outcome measures in order of importance with due recognition of the core data set of outcome measures identified by Devane et al (Devane 2007).
Primary outcomes
Maternal
-
*Severe primary PPH at time of birth (clinically estimated or measured blood loss greater than or equal to 1000 mL).
-
*Very severe primary PPH at time of birth (clinically estimated or measured blood loss greater than or equal to 2500 mL).
-
Maternal mortality.
-
Maternal Hb concentration less than 9 g/dL 24 to 72 hours postpartum.
Infant
-
Admission to neonatal special care or intensive care unit.
-
Neonatal jaundice requiring phototherapy or exchange transfusion.
-
Neonatal polycythaemia treated with dilutional exchange transfusion.
Secondary outcomes
Maternal
-
*Severe primary PPH after delivery of placenta and up to 24 hours (clinically estimated or measured blood loss greater than or equal to 1000 mL).
-
*Severe primary PPH at time of birth and up to 24 hours (clinically estimated or measured blood loss greater than or equal to 1000 mL).
-
*Primary blood loss equal to or greater than 500 mL at time of birth (clinically estimated or measured).
-
*Primary blood loss equal to or greater than 500 mL after delivery of placenta and up to 24 hours (clinically estimated or measured).
-
*Primary blood loss equal to or greater than 500 mL at time of birth and up to 24 hours (clinically estimated or measured).
-
*Mean blood loss (mL) at time of birth (clinically estimated or measured).
-
*Mean blood loss (mL) after delivery of placenta and up to 24 hours (clinically estimated or measured).
-
*Mean blood loss (mL) at time of birth and up to 24 hours (clinically estimated or measured)
-
Maternal blood transfusion.
-
Clinical signs of severe blood loss at the time of birth, e.g. woman feeling breathless, weak, faint, pale, exhausted.
-
Therapeutic uterotonics during the third stage or within the first 24 hours, or both.
-
Mean length of the third stage (minutes).
-
Manual removal of the placenta as defined by authors.
-
Diastolic blood pressure greater than 90 mmHg between birth of baby and discharge from the labour ward.
-
Vomiting between birth of baby and discharge from the labour ward.
-
Any analgesia between birth of the baby and discharge from the labour ward.
-
Women's assessment of pain during the third stage as reported by authors.
-
Secondary blood loss/any vaginal bleeding needing treatment (after 24 hours and before six weeks).
-
Amount of lochia either estimated or measured after 24 hours and up to discharge from hospital.
-
Surgical evacuation of retained products of conception.
-
Afterpains ‐ abdominal pain associated with the contracting uterus in the postpartum period.
Infant
-
Apgar score less than seven at five minutes.
-
Birthweight.
-
Neonatal encephalopathy assessed using Sarnat staging (Sarnat 1976; Table 1).
-
Neonatal mortality (not pre‐specified).
-
Intraventricular haemorrhage ‐ papille grade III/IV (for infants born before 34 weeks' gestation only).
-
Number of infants who received a red blood cell transfusion.
-
Infant Hb level at 24 to 72 hours.
-
Infant Hb level at three to six months.
-
Infant iron indices (ferritin) at three to six months.
-
Exclusive breastfeeding at discharge.
-
Neurodevelopmental, cognitive or developmental outcomes assessed after age 18 months.
* All PPH amounts and mean blood losses are now expressed at three time periods "at the time of the birth", "after delivery of the placenta and up to 24 hours", and "at the time of birth and up to 24 hours".
Search methods for identification of studies
The following methods section of this review is based on a standard template used by the Cochrane Pregnancy and Childbirth Group.
Electronic searches
We contacted the Trials Search Co‐ordinator to search the Cochrane Pregnancy and Childbirth Group’s Trials Register (30 September 2014)
The Cochrane Pregnancy and Childbirth Group’s Trials Register is maintained by the Trials Search Co‐ordinator and contains trials identified from:
-
monthly searches of the Cochrane Central Register of Controlled Trials (CENTRAL);
-
weekly searches of MEDLINE;
-
weekly searches of Embase;
-
handsearches of 30 journals and the proceedings of major conferences;
-
weekly current awareness alerts for a further 44 journals plus monthly BioMed Central email alerts.
Details of the search strategies for CENTRAL, MEDLINE and Embase, the list of handsearched journals and conference proceedings, and the list of journals reviewed via the current awareness service can be found in the ‘Specialized Register’ section within the editorial information about the Cochrane Pregnancy and Childbirth Group.
Trials identified through the searching activities described above are each assigned to a review topic (or topics). The Trials Search Co‐ordinator searches the register for each review using the topic list rather than keywords.
In the protocol, we proposed to do a supplementary search in addition to that described above. On further discussion, we decided that the Trials Search Co‐ordinator search would be adequate.
Searching other resources
We retrieved additional relevant references cited in papers identified through the above search strategy and assessed their suitability for inclusion in the review.
We did not apply any language or date restrictions.
Data collection and analysis
For methods used in the previous version of this review, see 'Begley 2011a'.
For this update, the following methods were used for assessing the three reports that were identified as a result of the updated search.
The following methods section of this review is based on a standard template used by the Cochrane Pregnancy and Childbirth Group.
Selection of studies
We obtained all potentially eligible trials identified by the search strategy as full‐text papers and two review authors assessed each study for potential inclusion. We resolved any disagreements through discussion with at least one additional review author. One paper and one abstract required translation. We sought missing information from nine authors, and received five replies.
Data extraction and management
We designed a form to extract data. Two review authors (Cecily Begley (CB), GG (Gill Gyte) extracted the data independently from each study using the agreed form. We resolved discrepancies through discussion with at least one additional review author. Two review authors (GG, Declan Devane (DD)) and a member of the Cochrane Pregnancy and Childbirth Group's staff independently reviewed Begley's paper (Begley 1990) and the lead author of this review was not involved in any discussions of the paper's inclusion, or assessment of its risk of bias status. We used the Review Manager software (RevMan 2014) to enter all data, which were checked independently.
Assessment of risk of bias in included studies
Two review authors (GG, DD or GG, CB) independently assessed risk of bias as a measure of methodological quality of included studies using the criteria outlined in the Cochrane Handbook for Systematic Reviews of Interventions (Higgins 2011). When information regarding any of the criteria was unclear, we contacted the authors of the original reports to provide further details. Where these data were unobtainable, and the missing data were thought to introduce serious bias, we explored the impact of including such studies in the overall assessment of results by sensitivity analysis. We used the following criteria in the assessment of bias.
(1) Random sequence generation (checking for possible selection bias)
We described for each included study the method used to generate the allocation sequence in sufficient detail to allow an assessment of whether it should produce comparable groups.
We assessed the method as:
-
low risk of bias (any truly random process, e.g. random number table; computer random number generator);
-
high risk of bias (any non‐random process, e.g. odd or even date of birth; hospital or clinic record number);
-
unclear risk of bias.
(2) Allocation concealment (checking for possible selection bias)
We described for each included study the method used to conceal allocation to interventions prior to assignment and assessed whether intervention allocation could have been foreseen in advance of, or during recruitment, or changed after assignment.
We assessed the methods as:
-
low risk of bias (e.g. telephone or central randomisation; consecutively numbered sealed opaque envelopes);
-
high risk of bias (open random allocation; unsealed or non‐opaque envelopes, alternation; date of birth);
-
unclear risk of bias.
(3.1) Blinding of participants and personnel (checking for possible performance bias)
It is not possible to blind participants or personnel in these trials, as the fact that a uterotonic has been given (rather than a placebo, or nothing) is usually apparent to both women (who feel a strong contraction or pain) and clinicians (who can see or feel a strongly contracted uterus) following injection of a uterotonic. In addition, it is clear, in many cases, to both women and clinicians if early versus late cord clamping is practised or if cord traction versus maternal effort is used. It is usually possible to blind technicians who conduct laboratory tests, but this does not always happen so cannot be presumed to be so.
We assessed the methods as:
-
high risk of bias for participants;
-
high risk of bias for personnel.
(3.2) Blinding of outcome assessment (checking for possible detection bias)
We described for each included study the methods used, if any, to blind outcome assessors from knowledge of which intervention a participant received. We assessed blinding separately for different outcomes or classes of outcomes. It is usually possible to blind technicians who conduct laboratory tests, but this does not always happen so cannot be presumed to be so.
We assessed methods used to blind outcome assessment as:
-
low, high or unclear risk of bias.
(4) Incomplete data collection (checking for possible attrition bias due to the amount, nature and handling of incomplete outcome data)
We describe for each included study and for each outcome the completeness of data, including attrition and exclusions from the analysis. We state whether attrition and exclusions were reported, the numbers included in the analysis at each stage (compared with the total randomised participants), reasons for attrition or exclusion where reported, and whether missing data were balanced across groups or were related to outcomes. Where sufficient information was reported or was sought and supplied by the trial authors, we re‐included missing data in the analyses. No studies required re‐analysis with the original allocated treatment groups being restored to their correct groups. Following these steps, studies were assessed as:
-
low risk of bias ‐ less than 10% attrition at any stage, or 10% to 15% attrition in small sections of data, equal in both groups and due to natural fall‐out of long‐term follow‐up;
-
high risk of bias ‐ more than 20% attrition, or more than 15% exclusion at any stage when the reason for missing data was likely to be related to true outcomes;
-
unclear risk of bias.
Acknowledging that with long‐term follow‐up, complete data are difficult to attain, we discussed whether missing data greater than 20% might (a) be reasonably expected, and (b) impact on outcomes; if the latter, we excluded such studies. We subjected studies where attrition levels were unclear, or missing data greater than 15% occurred, to sensitivity analysis.
(5) Selective reporting bias
We describe for each included study how we examined the possibility of selective outcome reporting bias and we assessed reporting methods as:
-
low risk of bias (where it is clear that all of the study’s pre‐specified outcomes and all expected outcomes of interest to the review have been reported);
-
high risk of bias (where not all the study’s pre‐specified outcomes have been reported; one or more reported primary outcomes were not pre‐specified; outcomes of interest were reported incompletely and so could not be used; study failed to include results of a key outcome that would be expected to have been reported);
-
unclear risk of bias.
(6) Other sources of bias
We also assessed and describe for each included study any important concerns we had about other possible sources of bias (e.g. specific study design, trial stopped early; extreme baseline imbalances). We thus assessed studies as being:
-
low risk of bias;
-
high risk of bias (problems detailed);
-
unclear risk of bias.
(7) Overall risk of bias
We made explicit judgements about whether or not studies were at high risk of bias, according to the criteria given in the Cochrane Handbook for Systematic Reviews of Interventions with reference to (1) to (6) above (Higgins 2011). As necessary, we explored the impact of the level of bias through undertaking sensitivity analyses.
For this update the quality of the evidence was assessed using the GRADE approach (Schunemann 2009) in order to assess the quality of the body of evidence relating to the following outcomes for the main comparison.
-
Maternal *Severe primary PPH at time of birth (clinically estimated or measured blood loss greater than or equal to 1000 mL).
-
*Very severe primary PPH at time of birth (clinically estimated or measured blood loss greater than or equal to 2500 mL).
-
Maternal mortality.
-
Maternal Hb concentration less than 9 g/dL 24 to 72 hours postpartum.
-
Infant admission to neonatal special care or intensive care unit.
-
Neonatal jaundice requiring phototherapy or exchange transfusion.
-
Neonatal polycythaemia treated with dilutional exchange transfusion.
We used GRADE profiler (GRADEpro 2014) to import data from Review Manager 5.3 (RevMan 2014) in order to create ’Summary of findings’ tables. A summary of the intervention effect and a measure of quality for each of the above outcomes was produced using the GRADE approach. The GRADE approach uses five considerations (study limitations, consistency of effect, imprecision, indirectness and publication bias) to assess the quality of the body of evidence for each outcome. The evidence can be downgraded from 'high quality' by one level for serious (or by two levels for very serious) limitations, depending on assessments for risk of bias, indirectness of evidence, serious inconsistency, imprecision of effect estimates or potential publication bias.
Measures of treatment effect
Dichotomous data
For dichotomous data, we presented results as summary risk ratio with (RR) 95% confidence intervals (CIs).
Continuous data
For continuous data, we used the mean difference (MD) as outcomes were measured in the same way between trials. We planned to use the standardised mean difference (SMD) to combine trials that measured the same outcome, but used different scales, but this was not required.
Unit of analysis issues
Cluster‐randomised trials
We identified no cluster‐randomised trials in this review.
In future updates, we will include cluster‐randomised trials in the analyses along with individually‐randomised trials. We will adjust their sample sizes using the methods described in the Handbook [Section 16.3.4 or 16.3.6] using an estimate of the intracluster correlation co‐efficient (ICC) derived from the trial (if possible), from a similar trial or from a study of a similar population. If we use ICCs from other sources, we will report this and conduct sensitivity analyses to investigate the effect of variation in the ICC. If we identify both cluster‐randomised trials and individually‐randomised trials, we plan to synthesise the relevant information. We will consider it reasonable to combine the results from both if there is little heterogeneity between the study designs and the interaction between the effect of intervention and the choice of randomisation unit is considered to be unlikely.
We will also acknowledge heterogeneity in the randomisation unit and perform a sensitivity analysis to investigate the effects of the randomisation unit.
Cross‐over trials
This is not an eligible study design for this review.
Dealing with missing data
We analysed data on all participants with available data in the group to which they were allocated, regardless of whether or not they received the allocated intervention. If, in the original reports, participants were not analysed in the group to which they were randomised, and there was sufficient information in the trial report or in information obtained from the trial authors, we planned to restore them to the correct group and analyse accordingly (i.e. intention‐to‐treat (ITT) analysis). No studies required re‐analysis with the original allocated treatment groups being restored to their correct groups. We used the number of women randomised minus the number of participants known to have missing data as the denominators. Where loss to follow‐up was greater than 20%, or where trial authors had excluded participants at a level greater than 15% and for reasons that were deemed to impact on outcomes, we excluded that study.
Assessment of heterogeneity
We assessed statistical heterogeneity in each meta‐analysis using the Tau² (tau‐squared), I² and Chi² statistics. We regarded heterogeneity as substantial if the Tau² was greater than zero and either an I² was greater than 30% or there was a low P value (< 0.10) in the Chi² test for heterogeneity.
Assessment of reporting biases
If there had been 10 or more studies in the meta‐analysis, we would have investigated reporting biases (such as publication bias) using funnel plots. We would have assessed funnel plot asymmetry visually. If asymmetry was suggested by a visual assessment, we would have performed exploratory analyses to investigate it.
Where we suspected reporting bias (see 'Selective reporting bias' above), we contacted study authors asking them to provide missing outcome data. If this had not been possible, and the missing data were thought to introduce serious bias, we would have explored the impact of including such studies in the overall assessment of results by conducting a sensitivity analysis.
Data synthesis
We carried out statistical analysis using the Review Manager software (RevMan 2014). We used random‐effect meta‐analyses for combining data because we considered that there was clinical heterogeneity sufficient to expect that the underlying treatment effects differed between trials. The random‐effects summary has been treated as the average of the range of possible treatment effects and we have discussed the clinical implications of treatment effects differing between trials. If we had considered that the average treatment effect was not clinically meaningful, we would not have combined trials. We have presented the results as the average treatment effect with its 95% CI, and the estimates of Tau², Chi² P value and I² (Higgins 2011). We found significant clinical and/or methodological heterogeneity between studies sufficient to suggest that treatment effects might differ between trials, which supported our choice of random‐effects meta‐analysis.
Subgroup analysis and investigation of heterogeneity
We did not undertake any interaction tests (Deeks 2001), as we were unable to conduct all subgroup analyses as planned, due to lack of usable data. We had planned the following subgroup analyses:
-
low risk of PPH versus high risk of PPH;
-
spontaneous versus operative vaginal birth;
-
nulliparous versus multiparous women;
-
low‐income versus high‐income setting;
-
full‐term versus preterm birth (including outcomes specific to preterm babies).
In the end, we were able to look at the data on women at low risk of bleeding separate from the data on women irrespective of risk of bleeding. In addition, all the included studies in the main analysis were undertaken in high‐income countries. A trial on controlled cord traction, undertaken in eight low‐income countries (Gulmezoglu 2012), was excluded as it was an RCT of active management with and without controlled cord traction, so was not a comparison of active and expectant management within the definitions used in the review.
Sensitivity analysis
We performed sensitivity analysis based on trial quality, separating high‐quality trials from trials of lower quality. 'High quality' was, for the purposes of this sensitivity analysis, defined as a trial having adequate sequence generation, allocation concealment and an attrition rate of less than 20%, given the stated importance of attrition as a quality measure (Tierney 2005).
Results
Description of studies
Results of the search
Our search of the literature identified 27 citations relating to 17 studies of potential relevance.
Included studies
We included seven studies involving 8247 women (Begley 1990; Jangsten 2011; Jerbi 2007; Khan 1997; Prendiville 1988; Rogers 1998; Thilaganathan 1993) (seeCharacteristics of included studies). Included studies were conducted in the UK (Prendiville 1988; Rogers 1998; Thilaganathan 1993), Ireland (Begley 1990), Sweden (Jangsten 2011), Tunisia (Jerbi 2007) and Abu Dhabi (Khan 1997). All studies took place in hospital settings.
Four studies (4829 women) compared active versus expectant management (Begley 1990; Prendiville 1988; Rogers 1998; Thilaganathan 1993), and three studies (3418 women) compared active versus mixed management (Jangsten 2011; Jerbi 2007; Khan 1997). In all trials, participants were healthy pregnant women expected to give birth vaginally. Three studies included only women classified as being at low risk of bleeding or its effects (Begley 1990; Rogers 1998; Thilaganathan 1993), and four (Jangsten 2011; Jerbi 2007; Khan 1997; Prendiville 1988) included women irrespective of their risk of bleeding.
Considerable differences were seen in the protocols for both active and expectant management in the various trials (Table 2).
| Active management protocol | Expectant management protocol | Active management used | Expectant management used | |
| (Bristol trial) | • IM syntometrine (5 units oxytocin + 0.5 mg ergometrine) (IM 10 units oxytocin if raised BP) Immediately after birth of anterior shoulder. • Clamp cord 30 seconds after birth. • CCT when uterus contracted. | • Try not to give oxytocic. • Try to leave cord attached to baby until placenta delivered. • Try not to use CCT or any manual interference with uterus at the fundus. • Encourage mother to adopt posture aiding delivery with gravity. • If placenta not delivered spontaneously wait, try putting baby to breast, and encourage maternal effort as above. | • Full active management (99%). • 99% cord clamped and cut before delivery of placenta. • 99% CCT. • 217 (26%) upright.
| • Full expectant management 403 (48%). • Full active management 168 (20%). • 278 (32%) had mixed management. • Cord left unclamped till pulsation ceased 48%. • Placenta delivered by maternal effort 60% and CCT 40%. • 416 (49%) upright. • 30% received uterotonic for treatment. |
| (Dublin trial) | • IV ergometrine 0.5 mg immediately following birth. • Try to clamp cord within 30 seconds. • When uterus contracted, attempt CCT. • Try not to give any special instructions re posture.
| • No oxytocic drug routinely. • Try to leave cord attached to baby until pulsation has ceased. • Placenta may be delivered by maternal effort or gentle controlled cord traction once separated. • Encourage mother to breastfeed. Help her to kneel/sit/squat. | • All given IV ergometrine before delivery of placenta. • 89% cord clamped and cut. • 93% CCT and 5% maternal effort. • 7% upright and 93% recumbent. | • 14% were given ergometrine for treatment, not prophylactically, 6 (0.83%) before placenta delivered. • Cord left unclamped till pulsation ceased 42%. • Placenta delivered by maternal effort 32% and gentle CCT 66%. • 11% upright. |
| (Hinchingbrooke trial) | •IM syntometrine (5 units oxytocin + 0.5 mg ergometrine) (IM 10 units oxytocin if raised blood pressure). • As soon as possible after birth of anterior shoulder (within 2 minutes of birth). • Immediate cord clamping and cutting. • CCT or maternal effort. • Women randomised to upright and recumbent in both arms. | • No uterotonic drug. • No cord clamping until after pulsation ceased. • Delivery of placenta within 1 hour by maternal effort. | • 699 (93.4%) had full active management. • 2 (0.3%) had fully expectant management. • 47 (6.2%) had mixed. • 95% given prophylactic uterotonic before delivery of placenta. • 93% cord clamped before pulsation ceased. • 46% CCT. • 44% upright (when placenta delivered). | • 488 (63.9%) had full expectant management. • 19 (2.5%) had fully active management. • 257 (33.6%) had mixed. • 21% received oxytocic for treatment, 2.5% prophylactically. • Cord left unclamped till pulsation ceased 70%. • Placenta delivered by CCT 12%. • 43% upright (when placenta delivered). |
| Thilaganathan 1993(Brighton trial) | • Syntometrine 1 mL (IM or IV, route not specified). • As soon as baby born. • Cord was “immediately clamped”. • Placenta delivered with CCT.
| • No oxytocic. • Cord not cut or clamped until after pulsation ceased (unless there were contraindications). • Deliver placenta by maternal effort after signs of separation. “when the placenta could be felt in the vagina, the midwife could then assist delivery of the placenta”. • Upright position encouraged. | • No information. | • No information. |
| (Abu Dhabi trial) | • IM oxytocin 10 units at delivery of anterior shoulder. • Immediate cord clamping and cutting. • CCT as soon as the uterus was contracted firmly ‐ repeated every 2‐3 minutes.
| • No oxytocic prior to delivery of placenta. • Cord clamped and cut after delivery. • No CCT. • No fundal massage. • Maternal expulsion after signs of separation. • IV infusion of oxytocin 10 units in 500 mL normal saline given slowly. | • No information. | • No information. |
BP: blood pressure
CCT: controlled cord traction
IM: intramuscular
IV: intravenous
Interventions in the ‘active’ management groups
In the studies there were various uterotonic regimens used. These were intravenous (IV) ergometrine 0.5 mg (Begley 1990), IM syntometrine (5 units oxytocin + 0.5 mg ergometrine) (Thilaganathan 1993), IM syntometrine (5 units oxytocin + 0.5 mg ergometrine) or IM 10 units oxytocin if the woman had raised blood pressure (Prendiville 1988; Rogers 1998), IM 10 units oxytocin for all women (Khan 1997), IV oxytocin 5 units (Jerbi 2007) and IV oxytocin 10 units (Jangsten 2011). The descriptions of the timing of administration of uteronic agent also varied and included “at the delivery of the anterior shoulder”, “as soon as possible after birth of anterior shoulder”, “immediately after the birth of the anterior shoulder” (which in practice probably equates to the same time), “immediately following birth”, “as soon as baby is born” (which is, in practice, very similar in timing to the preceding descriptions, perhaps 10 to 20 seconds later) and "within 2 minutes of birth".
All trials stated that the cord was clamped and cut either within 30 seconds or “immediately”, which in practice is likely to be approximately similar timing. Controlled cord traction was attempted once the uterus was contracted in all trials. Two studies included maternal effort as an option (Jangsten 2011; Rogers 1998), and one included fundal pressure (Jerbi 2007).
Protocols in the ‘expectant’ management groups
In all trials, no uterotonic was to be given routinely prior to delivery of placenta. However, in one trial, an IV infusion of oxytocin 10 units in 500 mL normal saline was given slowly to all women following delivery of the placenta (Khan 1997). In one trial, 2 mL of placebo (saline solution) was administered intravenously within two minutes (Jangsten 2011). Practice varied widely as to how many women did, in fact, receive a uterotonic, either prophylactically: 0% (Begley 1990), 2.5% (Rogers 1998), and 20% (Jangsten 2011; Prendiville 1988), and/or as a treatment 14% (Begley 1990), 21% (Rogers 1998), 30% (Prendiville 1988), and 38% (Jangsten 2011), with no information given in the other three trials.
In four trials, clinicians were asked to try not to cut or clamp the cord until after pulsation ceased (Begley 1990; Prendiville 1988; Rogers 1998; Thilaganathan 1993), although this was achieved in only 42% to 70% of participants; in three trials, the cord was to be clamped and cut after birth of the baby (Jangsten 2011; Jerbi 2007; Khan 1997). Maternal effort was to be used in five trials (Begley 1990; Jangsten 2011; Prendiville 1988; Rogers 1998; Thilaganathan 1993), with the option in some of gentle controlled cord traction once the placenta had separated (Begley 1990), or assisting the placenta out once it was felt in the vagina (Thilaganathan 1993). Maternal effort was used by 32% to 88% of participants. In one trial, controlled cord traction was used, with gentle fundal pressure (Jerbi 2007), and in another uterine massage was used after placental delivery (Jangsten 2011).
Given the differences in uterotonics used in the active groups and the wide variation in the proportion of women in expectant management groups who actually received a uterotonic, it was decided to use a random‐effects model due to the degree of clinical heterogeneity.
Excluded studies
We excluded nine studies (Abdel‐Aleem 2010; Deneux‐Tharaux 2013; Gulmezoglu 2012; Hoffman 2006; Kashanian 2010; Magann 2006; Muller 1996; Ramirez 2001; Vasegh 2005 (seeCharacteristics of excluded studies)). One study was only available as a conference abstract with no information on the number of women randomised to each group, and the authors of the previous version of the review had been unable to obtain further information from the study authors (Muller 1996). Although we were able to contact one of the authors, we obtained no further useful information. One study assessed the timing for manual removal of the placenta, so did not fit the criteria for inclusion (Magann 2006). We excluded the third study because of the high number of women excluded after randomisation (48%) (Kashanian 2010). The fourth study (Hoffman 2006) was excluded due to concerns regarding the number of women withdrawn, after randomisation, due to caesarean section. Only a conference abstract was available, but further information on methodology was obtained from the authors. We excluded the fifth study due to insufficient information on the numbers included in each of the three arms, and the method of management for the expectant arm (Ramirez 2001). Vasegh 2005 was excluded due to insufficient information in the published study and inability to elicit a response from the authors. Two trials that looked at active management with or without controlled cord traction were excluded as they were deemed more appropriate for inclusion in the Cochrane review on controlled cord traction (Deneux‐Tharaux 2013; Gulmezoglu 2012).
Risk of bias in included studies
Of the seven studies included, we assessed one as having low risk of bias across five of the seven aspects of the assessment (Begley 1990) and unclear on one. We considered three studies as having low risk of bias in the main aspects of sequence generation, allocation concealment and completeness of data collection (Begley 1990; Jangsten 2011; Rogers 1998), this being our criteria for overall quality for sensitivity analyses. We considered one study at high risk of bias for completeness of data collection, selective reporting, lack of blinding and other biases (Thilaganathan 1993) and assessed one study as unclear on four of the assessment criteria, although allocation concealment seemed acceptable (Khan 1997). One study was assessed as unclear for sequence generation and selective reporting bias, at high risk of bias for allocation concealment, lack of blinding and other biases, but acceptable for completeness of data (Jerbi 2007). SeeFigure 1.
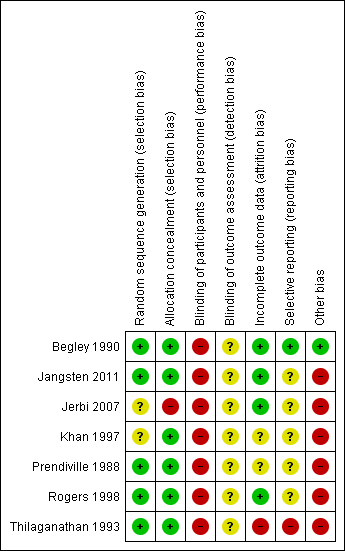
Methodological quality summary: review authors' judgements about each methodological quality item for each included study.
Allocation
Five studies used adequate sequence generation using random‐number tables or computer random‐number generators (Begley 1990; Jangsten 2011; Prendiville 1988; Rogers 1998; Thilaganathan 1993) and in two the method was unclear (Jerbi 2007; Khan 1997). Adequate allocation concealment by telephone or central randomisation or consecutively numbered, sealed opaque envelopes was used in six studies (Begley 1990; Jangsten 2011; Khan 1997; Prendiville 1988; Rogers 1998; Thilaganathan 1993), and in one study allocation was not concealed (Jerbi 2007).
Blinding
Blinding was not possible when assessing the management of third stage of labour, for either women or clinicians (Characteristics of included studies). The assessment of many outcomes, particularly blood loss, could, therefore, have been unconsciously affected by people's beliefs. Having chosen maternal Hb less than 9 g/dL as a hard outcome relating to blood loss at the protocol stage, we have now also included the mean postnatal Hb values to help in understanding the blood loss estimations. Haemoglobin assessment would usually be performed by a technician who would be blinded to the trial allocation.
In the Dublin trial (Begley 1990), and Swedish study (Jangsten 2011), blood loss was measured, but in all other studies it was estimated and therefore open to subjective inaccuracies, which should, however, have been the same across both groups; in addition, both blood loss estimation and measurement were open to bias. For certain outcomes such as Hb concentration, which could be measured by a blinded outcome assessor, we attempted to assess how such blinding had occurred. In practice, we found that almost all studies did not mention how such assessors were blinded.
Incomplete outcome data
Four trials presented complete outcome data (Begley 1990; Jangsten 2011; Jerbi 2007; Rogers 1998), with acceptable levels of attrition except for some follow‐up measures such as postnatal Hb levels. One trial was considered at high risk of bias for complete data in that it was not clear how many were randomised and an unknown number of women were withdrawn following randomisation, due to caesarean section, operative delivery and cervical tears (Thilaganathan 1993). One study had high levels of missing data for some outcomes, e.g. 19% of Hb results missing in the active arm and 18% in the physiological; 25% of antenatal and/or postnatal Hb results missing in the active arm and 26% in the physiological; the level of risk was thus considered unclear (Prendiville 1988). In the remaining study, it was also unclear how many data were missing (Khan 1997). In all three of these trials, the denominator used was the number given by trial authors as taking part in the study after withdrawals had been made.
Selective reporting
We assessed one trial as free of selective reporting bias (Begley 1990) and categorised five others as 'unclear' as the trial protocols were not viewed (Jangsten 2011; Jerbi 2007; Khan 1997; Prendiville 1988; Rogers 1998). We deemed one study to have used selective reporting as PPH rates were not presented (Thilaganathan 1993).
Other potential sources of bias
We judged one study as free of other apparent sources of bias (Begley 1990). In one of the remaining studies (Prendiville 1988), the trial included women at increased risk of PPH (high parity, all age groups, previous PPH, epidural, long labour, operative delivery), a problem with another study also (Khan 1997). Women at increased risk of PPH will have a higher blood loss, by definition, using expectant management; clinicians experiencing this may respond by anxiety in subsequent births, even of low‐risk women, which may result in higher intervention (mixed management) rates. In Prendiville 1988, 50% of the expectant management group received an oxytocic, a proportion of intervention incompatible with the philosophy of expectant management. In one study, although 11,000 women were available, of whom at least half would usually be considered potentially eligible, only 1802 were entered into the study (Jangsten 2011). The majority were excluded due to "excessive workload". This has the potential to have biased the study, as midwives would have had the choice of not asking the women to participate and may unconsciously have not offered participation to some women who they felt were not suitable for physiological management.
Midwives in all studies were more used to using active than expectant management, which is likely to have had an influence on results in the expectant arm. This influence may have been that they a) reverted to a type of active management, potentially reducing blood loss and narrowing the difference between trial arms in terms of blood loss outcomes or b) used mixed management, which, from the data, was more likely to increase blood loss or c) would have conducted a type of expectant management that was not ideal and resulted in increased blood loss in the expectant arm. In one study (Rogers 1998), a questionnaire administered to 92 of the 153 midwives prior to the trial commencement showed that 84% felt "very confident" of active management, whilst only 41% were "very confident" of expectant management. Similarly, Prendiville 1988 states that, before the trial commenced, the midwives were trained in the use of expectant management. Only six (13%), however, said that they were very confident in using expectant management before the trial started and 22 (46%) afterwards. In addition, of 49 midwives responding to a questionnaire regarding this study, 30 (61%) had never managed a third stage physiologically. Among the remaining 19, only one had practised physiological management as defined in the report (Harding 1989). In Begley 1990, the PPH rate in the expectant arm fell during the trial from 21% in the pilot study and 12% over the first four months, to 7% in the last six months, as midwives developed their skill (Begley 1990). No information on skill levels was provided in the other studies.
Finally, in one trial (Prendiville 1988), the protocol was changed after 425 births, but all births were included in the results, which may have affected the findings.
Effects of interventions
The review includes seven studies involving 8247 women. We used a random‐effects model for pooling data because of clinical heterogeneity seen in the included studies. In the forest plots, for six of the outcomes the "Favours expectant" label is on the left rather than the right. This is dictated by whether we are reporting negative (e.g. PPH) or positive (e.g. breastfeeding) outcomes.
01 Active versus expectant management of 3rd stage of labour ‐ all women (four studies, 4829 women)
This comparison included four studies (Begley 1990; Prendiville 1988; Rogers 1998; Thilaganathan 1993). Three studies included only women at low risk of bleeding (Begley 1990; Rogers 1998; Thilaganathan 1993) and one study included women irrespective of risk of bleeding (Prendiville 1988). We assessed two studies as being of high methodological quality (Begley 1990; Rogers 1998); one raised concerns regarding high risk of bias in terms of midwives' comfort with expectant management, and other possible biases (Prendiville 1988); and we considered one study to have high risk of bias in terms of incomplete outcome data and selective reporting bias (Thilaganathan 1993). We used random‐effects meta‐analyses due to the clinical heterogeneity involved. The random‐effects summary gives an average for 'active' methods versus 'expectant' methods, and it is important to note that the treatment effect found by comparing any two specific techniques may differ from this. For a number of outcomes, there was very little statistical heterogeneity found (Tau² = 0 and I² = 0%), so there appears to be a single common treatment effect for these outcomes.
Primary outcomes
Compared with expectant management, active management showed a statistically significant average reduction in:
-
severe primary PPH (≥ 1000 mL at time of birth) (average risk ratio (RR) 0.34, 95% confidence interval (CI) 0.14 to 0.87, three studies, 4636 women, random‐effects (Tau² = 0.38, Chi² P = 0.08, I² = 60%), Analysis 1.1);
-
maternal Hb less than 9 g/dL at 24 to 72 hours (average RR 0.50, 95% CI 0.30 to 0.83, two studies, 1572 women, random‐effects (Tau² = 0.02, Chi² P = 0.31, I² = 3%), Analysis 1.4).
None of the studies reported on the other primary maternal outcomes of very severe primary PPH (≥ 2500 mL) (except Begley 1990, who found no instances of such extreme blood loss in either group) or maternal mortality.
There was no statistically significant difference identified in:
-
admission to neonatal special care or intensive care unit (average RR 0.81, 95% CI 0.60 to 1.11, two studies, 3207 infants, random‐effects (Tau² = 0.00, Chi² P = 0.40, I² = 0%), Analysis 1.5);
-
neonatal jaundice requiring phototherapy or exchange transfusion (average RR 0.96, 95% CI 0.55 to 1.68, two studies, 3142 infants, random‐effects (Tau² = 0.11, Chi² P = 0.09, I² = 66%), Analysis 1.6).
None of the studies reported on the other primary neonatal outcome of neonatal polycythaemia treated with dilutional exchange transfusion.
It should be noted that the evidence presented on the primary outcomes selected is based on results of a small number of studies with relatively small numbers of participants. The lack of consistent quality of evidence for these outcomes should be borne in mind when considering the overall results (seesummary of findings Table for the main comparison).
Secondary outcomes
Compared with expectant management, active management showed a statistically significant average reduction in:
-
primary blood loss ≥ 500 mL (clinically estimated or measured at birth ) (average RR 0.34, 95% CI 0.27 to 0.44, three studies, 4636 women, random‐effects (Tau² = 0.02, Chi² P = 0.23, I² = 32%), Analysis 1.10);
-
mean maternal blood loss (average mean difference (MD) in mL ‐78.80, 95% CI ‐95.96 to ‐61.64, two studies, 2941 women, random‐effects (Tau² = 34.92, Chi² P = 0.26, I² = 22%), Analysis 1.13);
-
maternal blood transfusion (average RR 0.35, 95% CI 0.22 to 0.55, four studies, 4829 women, random‐effects (Tau² = 0.00, Chi² P = 0.46, I² = 0%), Analysis 1.16);
-
therapeutic uterotonics during the third stage and/or within the first 24 hours (average RR 0.19, 95% CI 0.15 to 0.23, four studies, 4829 women, random‐effects (Tau² = 0.00, Chi² P = 0.47, I² = 0%), Analysis 1.18);
-
mean birthweight (average mean difference (MD) in g ‐76.90, 95% CI ‐108.51 to ‐45.30, two studies, 3207 infants, random‐effects (Tau² = 0.00, Chi² P = 0.58, I² = 0%), Analysis 1.30).
Compared with expectant management, active management showed a statistically significant average increase in:
-
postnatal diastolic blood pressure > 90 mmHg up to discharge from labour ward (average RR 4.10, 95% CI 1.63 to 10.30, three studies, 4636 women, random‐effects (Tau² = 0.32, Chi² P = 0.14, I² = 49%), Analysis 1.21);
-
vomiting from birth of baby to discharge from labour ward (RR 2.47, 95% CI 1.36 to 4.48, three studies, 4636 women, random‐effects (Tau² = 0.14, Chi² P = 0.09, I² = 59%), Analysis 1.22);
-
administration of any analgesia from birth up to discharge from labour ward (RR 2.53, 95% CI 1.34 to 4.78, one study, 1429 women, Analysis 1.23);
-
afterpains (RR 2.53, 95% CI 1.34 to 4.78, one study, 1429 women, Analysis 1.28);
-
return to hospital as an in‐ or outpatient because of bleeding (outcome not pre‐specified) (average RR 2.21, 95% CI 1.29 to 3.79, two studies, 2941 women, random‐effects (Tau² = 0.00, Chi² P = 0.82, I² = 0%), Analysis 1.40);
-
postnatal maternal Hb (outcome not pre‐specified) (average MD 0.52, 95% CI 0.44 to 0.60, three studies, 4062 women, random‐effects (Tau² = 0.00, Chi² P = 0.66, I² = 0%), Analysis 1.41).
There was no statistically significant difference identified in:
-
mean length of the third stage in minutes (MD ‐0.30, 95% CI ‐1.87 to 1.27, one study, 1429 women, Analysis 1.19);
-
manual removal of placenta (average RR 1.78, 95% CI 0.57 to 5.56, four studies, 4829 women, random‐effects (Tau² = 0.82, Chi² P = 0.01, I² = 73%), Analysis 1.20);
-
secondary blood loss/any vaginal bleeding needing treatment (after 24 hours and before six weeks) (average RR 1.10, 95% CI 0.40 to 2.99, three studies, 4636 women, random‐effects (Tau² = 0.67, Chi² P = 0.0005, I² = 87%), Analysis 1.25);
-
surgical evacuation of retained products of conception (average RR 0.74, 95% CI 0.32 to 1.71, three studies, 4636 women, random‐effects (Tau² = 0.26, Chi² P = 0.15, I² = 47%), Analysis 1.27);
-
Apgar scores less than seven at five minutes (RR 1.00, 95% CI 0.38 to 2.66, one study, 1695 infants, Analysis 1.29).
-
exclusive breastfeeding at discharge (RR 1.01, 95% CI 0.96 to 1.07, one study, 1695 women, Analysis 1.38).
Authors of the included studies did not assess any of the review's other secondary outcomes.
02 Active versus expectant management of 3rd stage of labour ‐ women at low risk of bleeding (three studies, 3134 women)
This comparison included three studies (Begley 1990; Rogers 1998; Thilaganathan 1993). We considered two studies to be of high methodological quality (Begley 1990; Rogers 1998) and one study to have high risk of bias in terms of incomplete outcome data and selective reporting bias (Thilaganathan 1993). All meta‐analyses used random‐effects meta‐analyses due to the clinical heterogeneity involved. For a number of outcomes, there was very little heterogeneity found (Tau² = 0 and I² = 0%), so there appears to be a single common treatment effect for these outcomes.
Primary outcomes
There was no statistically significant average difference identified in:
-
severe primary PPH (≥ 1000 mL at time of birth) (average RR 0.31, 95% CI 0.05 to 2.17, two studies, 2941 women, random‐effects (Tau² = 1.46, Chi² P = 0.06, I² = 71%), Analysis 2.1);
-
maternal Hb < 9 g/dL (at 24 to 72 hours) (RR 0.17, 95% CI 0.02 to 1.47, one study, 193 women, Analysis 2.4).
None of the studies reported on the other primary outcomes of: very severe primary PPH (≥ 2500 mL) (except Begley 1990, who found no instances of such extreme blood loss in either group) or maternal mortality.
There was no statistically significant average difference identified in:
-
admission to neonatal special care or intensive care unit (RR 1.02, 95% CI 0.55 to 1.88, one study, 1512 women, Analysis 2.5);
-
neonatal jaundice requiring phototherapy or exchange transfusion (RR 1.31, 95% CI 0.78 to 2.18, one study, 1447 women, Analysis 2.6).
None of the studies reported on the other primary outcome of neonatal polycythaemia.
Secondary outcomes
Compared with expectant management, active management in women at low risk showed a statistically significant average reduction in:
-
primary blood loss ≥ 500 mL (clinically estimated or measured at time of birth) (average RR 0.33, 95% CI 0.20 to 0.56, two studies, 2941 women, random‐effects (Tau² = 0.10, Chi² P = 0.10, I² = 63%), Analysis 2.10);
-
mean maternal blood loss (mL) (average MD ‐78.80, 95% CI ‐95.96 to ‐61.64, two studies, 2941 women, random‐effects (Tau² = 34.93, Chi² P = 0.26, I² = 22%), Analysis 2.13);
-
maternal blood transfusions (average RR 0.30, 95% CI 0.10 to 0.88, three studies, 3134 women, random‐effects (Tau² = 0.14, Chi² P = 0.32, I² = 11%), Analysis 2.16);
-
therapeutic uterotonics during the third stage and/or within the first 24 hours (average RR 0.15, 95% CI 0.11 to 0.21, three studies, 3134 women, random‐effects (Tau² = 0.00, Chi² P = 0.98, I² = 0%), Analysis 2.18);
-
mean birthweight in g (MD ‐67.00, 95% CI ‐114.13 to ‐19.87, one study, 1512 women, Analysis 2.30).
Compared with expectant management, active management for women at low risk showed a statistically significant average increase in:
-
postnatal diastolic blood pressure > 90 mm Hg (average RR 7.00, 95% CI 2.99 to 16.43, two studies, 2941 women, random‐effects (Tau² = 0.00, Chi² P = 0.89, I² = 0%), Analysis 2.21);
-
administration of any analgesia between birth of the baby and discharge from labour ward (RR 2.53, 95% CI 1.34 to 4.78, one study, 1429 women, Analysis 2.23);
-
afterpains (RR 2.53, 95% CI 1.34 to 4.78, one study, 1429 women, Analysis 2.28);
-
return to hospital as an in‐ or outpatient because of bleeding (outcome not pre‐specified) (average RR 2.21, 95% CI 1.29 to 3.79, two studies, 2941 women, random‐effects (Tau² = 0.00, Chi² P = 0.82, I² = 0%), Analysis 2.40);
-
postnatal maternal mean Hb (outcome not pre‐specified) (average MD in g/dL 0.50, 95% CI 0.41 to 0.59, two studies, 2683 women, random‐effects (Tau² = 0.00, Chi² P = 1.00, I² = 0%), Analysis 2.41).
There was no statistically significant average difference identified in:
-
length of the third stage in minutes (MD ‐0.30, 95% CI ‐1.87 to 1.27, one study, 1429 women, Analysis 2.19);
-
manual removal of placenta (average RR 3.58, 95% CI 0.42 to 30.61, three studies, 3134 women, random‐effects (Tau² = 2.58, Chi² P = 0.02, I² = 75%), Analysis 2.20);
-
postnatal vomiting (average RR 5.63, 95% CI 0.69 to 46.08, two studies, 2941 women, random‐effects (Tau² = 1.60, Chi² P = 0.12, I² = 60%), Analysis 2.22);
-
Secondary blood loss/any vaginal bleeding needing treatment (after 24 hours and before six weeks) (average RR 1.78, 95% CI 0.69 to 4.60, two studies, 2941 women, random‐effects (Tau² = 0.39, Chi² P = 0.01, I² = 84%), Analysis 2.25);
-
surgical evacuation of retained products of conception (average RR 0.69, 95% CI 0.12 to 3.98, two studies, 2941 women, random‐effects (Tau² = 1.17, Chi² P = 0.06, I² = 72%), Analysis 2.27).
Authors of the included studies did not assess any of the review's other secondary outcomes.
03 Active versus mixed management of 3rd stage ‐ all women (early uterotonic, delayed cord clamping, controlled cord traction) (no studies)
There were no studies that assessed this comparison.
04 Active versus mixed management of 3rd stage ‐ all women (delayed uterotonic, delayed cord clamping, controlled cord traction) (no studies)
There were no studies that assessed this comparison.
05 Active versus mixed management of 3rd stage ‐ all women (delayed uterotonic, delayed cord clamping, no controlled cord traction) (no studies)
There were no studies that assessed this comparison.
06 Active management with prophylactic uterotonic given before birth versus active management with uterotonic given after birth ‐ all women (no studies)
There were no studies that assessed this comparison.
07 Mixed management ‐ all women (early uterotonic, delayed cord clamping, controlled cord traction) versus expectant management (no studies)
There were no studies that assessed this comparison.
08 Mixed management ‐ all women (delayed uterotonic, delayed cord clamping, controlled cord traction) versus expectant management (no studies)
There were no studies that assessed this comparison.
09 Mixed management ‐ all women (delayed uterotonic, delayed cord clamping, no controlled cord traction) versus expectant management (no studies)
There were no studies that assessed this comparison.
10 Active versus mixed management of 3rd stage of labour ‐ all women (immediate cord clamping, no controlled cord traction, uterotonic after placental delivery) (one study, 1657 women, comparison not pre‐specified)
This comparison included one study (Khan 1997).
Primary outcomes
Compared with mixed management, active management showed a statistically significant reduction in:
-
severe primary PPH (blood loss ≥ 1000 mL at time of birth) (RR 0.23, 95% CI 0.09 to 0.55, one study, 1648 women, Analysis 10.1).
The study did not report on the other primary outcomes of: very severe primary PPH (≥ 2500 mL); maternal Hb < 9 g/dL at 24 to 72 hours; maternal mortality, neonatal jaundice requiring phototherapy or exchange transfusion; or neonatal polycythaemia treated with dilutional exchange transfusion.
Secondary outcomes
Compared with mixed management, active management showed a statistically significant reduction in:
-
primary blood loss ≥ 500 mL (clinically estimated or measured at time of birth) (RR 0.53, 95% CI 0.38 to 0.74, one study, 1648 women, Analysis 10.10);
-
therapeutic uterotonics during the third stage and/or within the first 24 hours (RR 0.45, 95% CI 0.26 to 0.77, one study, 1648 women, Analysis 10.18);
-
length of the third stage in minutes (MD ‐10.00, 95% CI ‐10.24 to ‐9.76, one study, 1648 women, Analysis 10.19).
There was no statistically significant difference identified in:
-
maternal blood transfusions (RR 0.25, 95% CI 0.03 to 2.22, one study, 1648 women, Analysis 10.16);
-
clinical signs of severe blood loss (RR 0.25, 95% CI 0.05 to 1.17, one study, 1648 women, Analysis 10.17).
Authors of the included studies did not assess any of the review's other secondary outcomes.
11 Active versus mixed management of 3rd stage of labour ‐ all women (no routine uterotonic, immediate cord clamping, no controlled cord traction) (one study, 1631 women, comparison not pre‐specified)
This comparison included one study (Jangsten 2011). The study was judged to be at low risk of bias for sequence generation, allocation concealment and incomplete outcome data. It was unclear for selective reporting bias but considered at high risk of bias for other biases (seeCharacteristics of included studies).
Primary outcomes
Compared with mixed management, no statistically significant difference was identified in active management for:
-
severe primary PPH at time of birth (≥ 1000 mL) (RR 0.78, 95% CI 0.48 to 1.24, one study, 1621women, Analysis 11.1);
-
maternal Hb less than 9 g/dL at 24 to 72 hours (RR 1.23, 95% CI 0.75 to 2.01, Analysis 11.4).
The study did not report on the other primary outcomes of: very severe primary PPH (≥ 2500 mL); maternal mortality; neonatal jaundice requiring phototherapy or exchange transfusion; neonatal polycythaemia treated with dilutional exchange transfusion.
Secondary outcomes
Compared with mixed management, active management showed a statistically significant reduction in:
-
primary blood loss ≥ 500 mL at time of birth (clinically estimated or measured at birth) (RR 0.51, 95% CI 0.40 to 0.66, one study,1621 women, Analysis 11.10);
-
mean maternal blood loss at time of birth (MD in mL ‐94.00, 95% CI ‐126.57 to ‐61.43, one study, 1621 women, Analysis 11.13);
-
therapeutic uterotonics during the third stage and/or within the first 24 hours (RR 0.39, 95% CI 0.33 to 0.48, Analysis 11.18);
-
mean length of third stage in minutes (MD ‐1.60, 95% CI ‐3.08 to ‐0.12, Analysis 11.19);
-
severe primary PPH after delivery of placenta and up to two hours (clinically estimated or measured blood loss ≥ 1000 mL) (outcome not pre‐specified) (RR 0.54, 95% CI 0.39 to 0.74, one study, 1621 women, Analysis 11.43);
-
severe primary PPH at time of birth and up to two hours (clinically estimated or measured blood loss ≥ 1000 mL) (outcome not pre‐specified) (RR 0.60, 95% CI 0.47 to 0.78, one study,1621 women, Analysis 11.44);
-
mean maternal blood loss after delivery of the placenta and up to two hours (outcome not pre‐specified) (MD in mL ‐49.00, 95% CI ‐75.52 to ‐22.48, one study, 1621 women, Analysis 11.45).
Compared with mixed management, active management showed a statistically significant increase in:
-
postnatal maternal mean Hb (outcome not pre‐specified) (MD in g/dL 0.28, 95% CI 0.14 to 0.42, one study, 1631 women, Analysis 11.42).
There was no statistically significant difference identified in:
-
maternal blood transfusion (RR 0.79, 95% CI 0.43 to 1.46, Analysis 11.16);
-
manual removal of placenta (RR 1.25, 95% CI 0.71 to 2.21, Analysis 11.20);
-
mean birthweight (MD in g 15.00, 95% CI ‐28.88 to 58.88, Analysis 11.31).
The study did not assess any of the review's other secondary outcomes, including "Afterpains ‐ abdominal pain associated with the contracting uterus in the postpartum period". However, two similar, non‐prespecified outcomes were assessed (Jangsten 2011b) and showed a statistically significant difference:
-
afterpains at two hours after birth (RR ‐2.80, 95% CI ‐4.62 to ‐0.98, 1425 women, Analysis 11.28);
-
afterpains the day after birth (RR ‐3.00, 95% CI ‐5.33 to ‐0.67, 1336 women, Analysis 11.29).
12 Active versus mixed management of 3rd stage of labour ‐ all women (no routine uterotonic, immediate cord clamping, controlled cord traction) (one study, 130 women, comparison not pre‐specified)
This comparison included one study (Jerbi 2007).
Primary outcomes
Compared with mixed management, no statistically significant difference was identified in active management for:
-
maternal Hb less than 9 g/dL at 24 to 72 hours (RR 0.80, 95% CI 0.34 to 1.90, Analysis 12.4).
The study did not report on the other primary outcomes of: severe primary PPH (≥ 1000 mL time of birth); very severe primary PPH (≥ 2500 mL); maternal mortality; neonatal jaundice requiring phototherapy or exchange transfusion; neonatal polycythaemia treated with dilutional exchange transfusion.
Secondary outcomes
Compared with mixed management, active management showed a statistically significant reduction in:
-
mean length of the third stage in minutes (MD –8.12 95% CI ‐9.72 to ‐6.52, Analysis 12.19).
There was no statistically significant difference identified in:
-
manual removal of placenta (RR 1.00, 95% CI 0.06 to 15.65, Analysis 12.20).
The study did not assess any of the review's other secondary outcomes.
Sensitivity analysis
We undertook sensitivity analyses including only the four studies with adequate sequence generation, allocation concealment and complete outcome reporting (Begley 1990; Jangsten 2011; Prendiville 1988; Rogers 1998). There were no differences in the overall direction of the findings.
Discussion
This review includes seven trials conducted in hospital settings in five countries involving 8247 women. There were no maternal deaths, nor any very severe PPH (greater than 2500 mL) reported in any of the studies, and also no neonatal mortality reported. It should be noted that the random‐effects summaries presented are the average effects found for 'active' versus 'expectant' management. Thus, it may not necessarily be true that all methods of active management will have the reported size of advantage in terms of PPH, or other outcomes, over all methods of expectant management.
Summary of main results
Active versus expectant management of the third stage in women irrespective of their risk of bleeding
Active management in hospitals in high‐income countries led to a reduction in severe primary PPH equal to or greater than 1000 mL and maternal Hb less than 9 g/dL at 24 to 72 hours. Indices of maternal blood loss were also significantly improved; for example, mean Hb was higher by 0.5 g/dL in the active group. However, the average difference may not be clinically important, as routine blood donation reduces Hb levels by approximately 0.6 g/dL (Burnley 2006) without ill effects, and postnatal women undergo a diuresis postnatally that reverses the haemodilution of pregnancy, thus increasing their Hb levels within a few days after birth (Hytten 2001; Taylor 1981). The more clinically important effects are the reduction in severe PPH rate, need for transfusion and uterotonic therapy, which confirms its effectiveness in lessening the severe bleeding that can prove life‐threatening if left untreated.
However, active management resulted in a lower average birthweight for the baby (possibly due to decreased placental transfusion at birth arising from the early cord clamping component, Farrar 2009a), and an increase in the incidence of maternal postpartum diastolic blood pressure greater than 90 mmHg (possibly due to the use of ergometrine‐based uterotonics), afterpains, need for postpartum analgesia in the labour ward, and an increase in women having to return to hospital because of bleeding. Using data from only the good quality studies showed similar results.
The main findings may also be presented using the 'number needed to treat to harm'. There would be one fewer severe PPH for every 66 women who had active management (95% confidence interval (CI) 44 to 127) and one woman fewer with a postnatal Hb under 9 g/dL for every 28 women who had active management (95% CI 17 to 73). Conversely, there would be one more woman with a diastolic blood pressure greater than 90 mmHg for every 52 women who had active management (95% CI 38 to 83) and one more woman who had to return to hospital because of bleeding for every 65 women who had active management (95% CI 39 to 192).
Although this analysis considers women irrespective of risk of bleeding, the studies mainly included women at low risk of bleeding with just one out of the four studies specifically including women of any risk. There were no specific data on women considered to be at high risk of bleeding.
Overall, active management reduced the risk of severe bleeding, but it would be important to investigate if this benefit arose from the uterotonic component of the active management alone. The negative effects of active management appear, in the main, to be due either to 1) the administration of a specific uterotonic (e.g. hypertension due to ergometrine‐containing preparations and hypotension due to intravenous oxytocin boluses (Lewis 2007)), or 2) possibly to controlled cord traction leading to retained shreds of membrane or placenta, thus causing the increased incidence of return to hospital due to bleeding, or 3) early cord clamping leading to a 20% reduction in the baby's blood volume. Different uterotonics will have differing effects, and clinicians will need to assess the optimum one for use in their circumstances. Recent international guidelines have turned to intramuscular oxytocin as a uterotonic that provides effective prophylaxis but without the associated side effects (ICM‐FIGO 2003; NICE 2007; WHO 2012). The increased incidence of women in the active management group having to return to hospital due to bleeding is of concern, as such bleeding takes place away from immediate access to medical assistance. This would, again, be of greater significance for women in low‐income countries.
The reduction in the average birthweight of babies following active management is possibly due to a reduction in placental transfusion following early cord clamping (McDonald 2013; Rabe 2012; RCOG 2009). The evidence from the trials we identified is that the average volume of transfused blood was 77 mL (45 to 108 mL) based on differences in the birthweight between the groups. This estimate is consistent with historical data (Yao 1974), and also with more recent data (Farrar 2009a). Farrar’s small study (n = 26) weighing babies at birth on accurate scales to calculate placental transfusion showed that 79 mL (interquartile range 50 to 163 mL) of extra blood was transfused to babies following vaginal births and 84 mL (interquartile range 59 to 165 mL) following caesarean births. Placental transfusion for most of these babies was completed by about three minutes after birth, but transfusion continued for up to five minutes for some babies (Farrar 2009a). As all babies in this study breathed normally at birth, further studies are necessary to ascertain whether or not the cord remains pulsating for longer if the baby has not commenced respiration.
With expectant management, term infants receive about 80 mL more blood from placental transfusion than with active management, with its early cord clamping ‐ thus adding about 20% more to the infant's blood volume (Werner 2005). This may be associated with a lower incidence of anaemia in infancy (Cernadas 2006; Chaparro 2006; McDonald 2013; Van Rheenan 2007). It is possible that anaemia in early infancy may have adverse effects for the infant's longer‐term growth and development, particularly for infants born in low‐income countries. Although it is also plausible that placental transfusion with expectant management may increase the risk of neonatal jaundice requiring phototherapy (McDonald 2013), but there was no evidence for this in the two studies that assessed this outcome. Finally, it needs to be considered that in the context of the administration of a powerful uterotonic, early cord clamping may protect the baby by preventing a sudden increase of blood volume into the transitional circulation, that might disrupt physiological processes such as duct closure, lung fluid reabsorption and cerebral haemodynamic autoregulation. This may be particularly important to infants who are slow to breathe (Mercer 2008). This problem can be avoided by giving the uterotonic drug immediately following the deferred cord clamping. The included studies did not report on these specific neonatal adverse outcomes, but this review did not find evidence that admission rates to special care baby units (SCBU)/ neonatal intensive care units (NICU) were affected by the types of third‐stage management included (average risk ratio 0.81, 95% CI 0.60 to 1.11, two studies, 3207 babies).
In the three studies that documented both severe PPH (equal to or greater than 1000 mL) and number of blood transfusions (Begley 1990; Prendiville 1988; Rogers 1998), it is noted that a total of 78 out of the 4636 women had a severe PPH, whereas 94 received a blood transfusion, perhaps indicating an over‐use of this treatment in a healthy population, under‐estimation of blood loss, or undetected low antenatal haemoglobins in some women. Given that a woman’s body is well prepared for normal blood loss at birth by the haemodilution of pregnancy (Mims 2005), and that 600 mL to 750 mL of diluted blood is equivalent to a routine blood donation, it is possible that the impact of blood losses less than 750 mL are not severe in normal, healthy women, but this needs investigation. In addition, the decrease in plasma volume in the early days after birth increases postnatal Hb concentration in a reversal of haemodilution (Hytten 2001; Mims 2005; Taylor 1981).
Active versus expectant management of the third stage in women at low risk of bleeding
In hospitals in high‐income countries, we found no statistically significant difference in maternal primary PPH greater than 1000 mL, although the number of women was insufficient to assess this outcome with confidence (two studies, 2941 women) and further studies would be needed to study this association.
One small study (n = 193) did compare the number of women with Hb levels less than 9 g/dL postnatally (Thilaganathan 1993) but the high risk of bias identified means the findings cannot be relied upon. None of the studies assessed Apgar scores less than seven at five minutes. Other indices of maternal blood loss were still statistically significantly decreased with the use of active management in this population. Active management again resulted in a lower birthweight (possibly due to reduced placental transfusion), an increase in the incidence of postpartum diastolic blood pressure greater than 90 mmHg, afterpains, need for postpartum analgesia in the labour ward, and having to return to hospital as an in‐ or outpatient because of bleeding.
In this comparison, active management of the third stage of labour reduced blood loss at the time of birth (and concomitant treatments required) but increased hypertension, pain and discomfort and increased return to hospital due to postnatal bleeding following discharge to the community. In addition, it decreased the baby’s birthweight, possibly due to clamping the cord before pulsation ceased, with a possible loss of approximately 80 mL of blood. There was no statistically significant reduction or increase in severe PPH for women at low risk to bleeding.
Mixed managements around the timing of cord clamping in combination with the timing of uterotonic drug
There were no studies identified that looked at these aspects of third‐stage management.
Active versus mixed management of the third stage (immediate cord clamping, no controlled cord traction and uterotonic after placental delivery) in women irrespective of their risk of bleeding
The one study assessing this comparison was of uncertain quality (sequence generation was unclear) (Khan 1997). The results indicated that active management led to a reduction in severe primary PPH. The rate of blood loss greater than 500 mL, use of therapeutic uterotonics postpartum and length of the third stage were all decreased with the use of active management, with no statistically significant difference identified in the number of blood transfusions. However, these findings are uncertain due to the ambiguity around sequence generation and other aspects of quality used in the study (Figure 1).
Active versus mixed management of 3rd stage of labour ‐ all women (no routine uterotonic, immediate cord clamping, no controlled cord traction) (one study, 1631 women, comparison not pre‐specified)
The one study included was of good quality (Jangsten 2011). The results indicated that no statistically significant difference was identified between active and mixed management in severe primary PPH or in maternal Hb less than 9 g/dL at 24 to 72 hours. The rate of blood loss greater than 500 mL and the use of therapeutic uterotonics during the third stage were decreased with the use of active management, with no statistically significant difference identified in the number of maternal blood transfusions, mean length of the third stage, mean birthweight or rate of manual removal of placenta.
Active versus mixed management of 3rd stage of labour ‐ all women (no routine uterotonic, immediate cord clamping, controlled cord traction) (one study, 130 women, comparison not pre‐specified)
The one study included was of moderate quality (Jerbi 2007). The results indicated that no statistically significant difference was identified between active and mixed management in maternal Hb less than 9 g/dL at 24 to 72 hours. The mean length of the third stage was decreased with the use of active management, with no statistically significant difference identified in manual removal of placenta.
Overall completeness and applicability of evidence
Four trials compared active versus expectant management of the third stage of labour and three compared active versus mixed management. All were conducted in hospitals, six in high‐income countries, and one in a low‐income country (n = 130). Three trials involved women at low risk of bleeding and four included women irrespective of their risk of bleeding. Given these factors, the results of the meta‐analysis can only be applied to care given in high‐income countries. As only three trials (one of uncertain quality) compared active versus mixed management, and all mixed managements differed, firm conclusions cannot be drawn on any apparent differences between these two managements. Also, for many of the outcomes there is heterogeneity in the treatment effects, so there is no information as to the specific factors that might affect the difference between active and expectant management.
Quality of the evidence
We assessed the methodological quality of the included trials as ‘high quality’ in terms of sequence generation, allocation concealment and complete outcome data for three trials (Begley 1990; Jangsten 2011; Rogers 1998), and 'high quality' for sequence generation and allocation concealment for two trials (Prendiville 1988; Thilaganathan 1993) and ‘unclear’ for sequence generation for two trials (Jerbi 2007; Khan 1997). We undertook sensitivity analysis by trial quality to assess for any substantial difference in the main results. This made little difference to the overall findings except to indicate that there was no good quality evidence for the results of comparisons between active management and mixed management of the third stage.
In all studies, there is the problem of assessment of blood loss by clinicians where no blinding is possible. However, studies used other indices of blood loss such as postnatal Hb, which may have been assessed by technicians blinded to treatment allocation. For this reason, we included an outcome that had not been pre‐specified, mean postnatal Hb, in addition to comparing the number of women with Hb levels less than 9 g/dL at 24 to 48 hours, which not all studies had measured.
Adherence to trial protocols and, in particular, to the management proposed for the two study arms was mixed (Table 2). In the three high‐quality studies (Begley 1990; Jangsten 2011; Rogers 1998), the majority of women in the active management arm (93% to 100%) received a uterotonic as directed. In the expectant management arm, however, practice varied widely, with 86% receiving ‘no uterotonic’ in one study (Begley 1990), 76.5% in another (Rogers 1998), and 62% in the third (Jangsten 2011). Only 50% of women in the expectant management arm in one study (Prendiville 1988) received ‘no uterotonic’, with no information given in the other three trials. The protocol for the expectant arm of the Prendiville study (Prendiville 1988) did allow for administration of a uterotonic if necessary, as it stated “Try not to give a uterotonic”; however, the actual proportion that received the drug appears incompatible with a philosophy of expectant management. In addition, the fact that the administration of the same uterotonic that constitutes the main treatment in active management to half of the 'expectant' management group as well, does raise questions as to the usefulness of the findings. The resulting 'mixed' management may also increase levels of blood loss and other complications, as changing the trial protocol after the first 425 births to exclude participants when mixed management had to be used due to cutting the cord early because of nuchal cord, concerns about meconium or baby needing resuscitation, resulted in a decrease in PPH rate.
In addition, this study (Prendiville 1988) included women at increased risk of bleeding. The total numbers involved are not clear, but 84 (5%) had previous third‐stage problems, 212 (13%) had an epidural in labour, and 230 (14%) had assisted births. As these women are likely to have a higher blood loss when expectant management is used, clinicians experiencing this may respond by anxiety in subsequent births using expectant management, even for women at low risk of bleeding, and be more likely to give a uterotonic early; this may have increased the intervention or 'mixed management' rates in women allocated to expectant management in this study (30% received uterotonic for treatment, and 20% prophylactically), and would also have decreased the opportunity for those midwives to keep up their skill level in expectant management.
A second study, comparing active with mixed management, also included women at increased risk of bleeding (Jangsten 2011), with similar possible results as above. Seven per cent (131) had a caesarean section, 714 (40%) had an epidural in labour, and 148 (8%) had a ventouse birth.
The skill of the midwives in both forms of care in all studies is of interest. The midwives in Roger’s study (Rogers 1998) were said to be “similarly confident” in active and expectant management. However, the questionnaire administered to 92 of the 153 midwives prior to the trial commencement showed that, whereas 84% felt “very confident” of active management, only 41% were “very confident” of expectant management. Similarly, Prendiville 1988 states that, before the trial commenced, the researchers sought the advice of midwives in the UK who were “known to practise physiological management” and then used this advice to train the midwives. Only six (13%) of the midwives in this trial, however, said that they were very confident of physiological management before the trial started and 22 (46%) afterwards. Harding et al found that, of 49 midwives responding to a questionnaire regarding this study, 30 (61%) had never managed a third stage physiologically. Among the remaining 19, only one had practised physiological management as defined in the trial (Harding 1989). Those in Begley’s study (Begley 1990) were also more used to active management and the PPH rate in the expectant arm fell during the trial from 21% in the pilot study to 7% in the last six months, as they developed their skills (Begley 1990).
Midwives’ skill and the accurate measurement of blood loss obviously has an impact on documented blood loss in the third stage of labour. For example, the mean (estimated) blood loss in the active arm of one study (269 mL, standard deviation (SD) 246) (Rogers 1998) was actually greater than the mean (measured) blood loss in the expectant arm of another (235 mL, SD 224) (Begley 1990). This indicates that results of all these trials need to be examined in conjunction with local practice, to ascertain whether or not similar results will be found in different settings.
Finally, in one trial (Prendiville 1988), the protocol was changed after 425 births, but all births were included in the results, which may have affected the findings.
As previously noted, the evidence presented on the primary outcomes selected is based on results of a small number of studies with relatively small numbers of participants. The lack of consistent high quality of evidence for these outcomes should be borne in mind when considering the overall results (seesummary of findings Table for the main comparison).
Potential biases in the review process
All the authors of this review have an interest in third‐stage management, and each brings different views on the methods that might be used. C Begley conducted one of the trials included in the review, and is a member of a team who conducted a systematic review for the ICM on physiological management of the third stage of labour. G Gyte has written on the third stage and is a involved in a study on timing of cord clamping in preterm birth, and other members have written on third‐stage management. W McGuire is also involved in further studies on timing of cord clamping. A Weeks is involved in running clinical trials of the timing of cord clamping and misoprostol for third‐stage prophylaxis in low‐resource settings. However, the review authors’ views differed and, during the review process, discussion and consensus was necessary to reach a final conclusion acceptable to all. Although all humans bring potential biases to any endeavour, we did try to ensure that our eventual conclusion arose solely from the data. Feedback from an international audience will serve to improve the next review update.
Agreements and disagreements with other studies or reviews
Previous version of this review
Our assessment of the evidence differs from the previous authors of this review (Prendiville 2000) who concluded that active management was "superior" to expectant management. For the main comparison, we have no additional studies but we analysed one small trial (Khan 1997) in the category of "active compared with mixed management," and therefore did not include this in the main analysis. We have, however, used the recent methodology introduced for Cochrane reviews in 2008, which assesses risk of bias in the individual studies more carefully than in the past (Higgins 2011). We also chose to use a random‐effects model for analysis due to the clear variations in the specific forms of both active and expectant management used in the included studies (clinical heterogeneity). Our findings, therefore, differ for some outcomes because of this decision (particularly for the group of women at low risk of bleeding) but we have reported on Tau² and I², regardless of level of heterogeneity. We believe the evidence shows both benefits and harms for active management, and believe it is now critical to look at the advantages and disadvantages of the individual components of third‐stage management to see if the benefits can be achieved with fewer harms.
The previous authors of this review recommended active management of the third stage due to the benefit identified in terms of reduced incidence of severe bleeding. We agree that bleeding is a very important component when balancing the benefits and harms of active compared to expectant management of the third stage of labour. However, we consider that the number of harms caused by active management also deserve consideration. In particular, the increased rate of hypertension, increased numbers of mothers returning to hospital due to bleeding and the possible decrease in average blood volume of newborns reflected in the lower birthweight for babies where the mother has received active management of the third stage, are of concern. In the population of women at low risk to bleeding such harms are of more concern as there was no statistical evidence that severe bleeding was reduced by active management. Further studies would be needed to confirm if there is a difference or not. Our analysis of women at low risk of bleeding differs from the previous version of the review in that we excluded the Prendiville data (Prendiville 1988) as we considered there to be a high risk of bias because the randomisation was not stratified by high and low risk of bleeding and there were no specific data in the published study to enable us to use the data had we chosen to do so.
Other systematic reviews on active versus expectant management of the third stage
Active management in the included studies involved, in general, clamping and cutting the cord soon after the baby’s birth. A number of women in the expectant management groups also had their baby’s cord clamped and cut before pulsation had ceased. A recent Cochrane review has recommended that, in future, the umbilical cord should not be clamped and cut until after pulsation has ceased, regardless of the type of management used (McDonald 2013); if this change in practice is implemented it may negate the harms of active management due to early cord clamping. However, the optimum timing of the administration of the uterotonic still needs to be determined clearly.
Despite the evidence from the Cochrane review regarding timing of cord clamping (McDonald 2013), a survey of 1176 members of the Royal College of Obstetricians and Gynaecologists (RCOG) and 1445 members of the Royal College of Midwives (RCM) in the UK found that the majority (94% and 71%, respectively) 'always' or 'usually' use active management, and 73% and 40% clamp the cord within 20 seconds (Farrar 2009b). It would thus appear that there is considerable variation in practice and not all practitioners use the complete package of ‘active’ or ‘expectant’ management as described in these trials.
Guidelines issued by various policy‐making bodies promote different aspects of third‐stage management. The RCM provides information on the benefits and harms of both methods, drawing on the published literature, including the previous version of the Cochrane review. They recommend providing information for women and state that physiological management of the third stage can be seen as the logical ending to a normal labour (RCM 2008). The National Institute for Health and Clinical Excellence (NICE) contains recommendations on the management of the third stage of labour in their guideline on intrapartum care (NICE 2007). Using the previous Cochrane review and other published research evidence, NICE conclude that active management of the third stage is to be recommended, including the use of oxytocin (10 international units by intramuscular injection), early clamping and cutting of the cord and controlled cord traction. They recommend that women should be told that active management reduces the risk of maternal bleeding and shortens the third stage, but no mention is made of the need to inform them of the documented harms of active management. It is, however, recommended that women who request expectant management and are at low risk of PPH "should be supported in their choice" (NICE 2007 p 183). The World Health Organization (WHO) also bases its recommendations on the previous Cochrane review, promoting the offering of active management to all women, provided they are cared for by skilled attendants (WHO 2012). The International Confederation of Midwives states that "Every midwife is required to attend the birth of the placenta without the aid of uterotonics" and that knowledge of physiological management of the third stage is "a basic midwifery competency". It further recommends that "when a woman makes an active choice to experience a non‐interventionist placental birth, the midwife will ensure the woman and her family have all the information necessary on which to make the decision" (ICM 2008).
Two issues bear further discussion in relation to published work: the experience of midwives in using expectant management and the use of expectant management of the third stage when the first and second stages of labour have not been normal. The RCM defines a normal birth as one where a woman commences, continues and completes labour physiologically at term (RCM 2004 Part 4e). Anecdotally, midwives experienced in expectant management say that only women who have had a normal, physiological labour and birth should have expectant management of the third stage. It has also been suggested in the literature that women who require induction or augmentation of labour with oxytocin (Sheiner 2005), or misoprostol (Phillip 2004), are prone to higher blood loss postpartum. In three of the four studies included in this review, high percentages of women had received a uterotonic for induction or acceleration of labour, and in all of them expectant management was not the norm for the midwives involved. It was recommended at the time of the first Cochrane review on this topic that trials be conducted in areas where midwives were skilled at using expectant or physiological management. The Netherlands and New Zealand are two such places, and observational studies emanating from these countries are worth examining as their results indicate no increase in blood loss in conjunction with the use of expectant management.
In Holland, a descriptive study was conducted to determine the incidence and risk factors for PPH in 3464 nulliparous women giving birth vaginally. The women were stratified for high‐ and low‐risk factors for PPH, with 1416 stratified as low risk (41%) (Bais 2004). Approximately 50% of these women received prophylactic oxytocin and 50% did not, with no significant difference found in blood loss (Bais 2004). The New Zealand College of Midwives conducted a population‐based, retrospective cohort study, which reported on the management provided by midwives during the third stage of labour (NZCM 2009). The study included 33,752 women who experienced a physiologically normal labour and birth. Almost half of the women (48.1%) had expectant management in the third stage while 51.9% had an actively managed third stage. Women who had expectant management were more likely to have a blood loss of less than 500 mL (96.3%) than those who had active management (93.1%). Mean blood loss was 213.6 mL (95% CI 211.6 mL to 215.5 mL) for the expectant management group and 241.6 mL (95% CI 239.4 mL to 243.8 mL) for active management. Similar findings were seen in an Irish study comparing midwife‐led with consultant‐led care (Begley 2009; Begley 2011). Thirty per cent (n = 136) of the 446 women who received midwife‐led care throughout their pregnancy and birth, and received no epidurals or oxytocin in labour, had expectant management. None of these 136 women had a PPH, whereas the PPH rate for the women having active management was 1% (Begley 2009). Although these are observational data, there is an interesting link here between normal blood loss and expectant management of the third stage, when such management follows a physiologically normal first and second stage, and care is given by midwives skilled in the technique. This is an area that would benefit from further research.

Methodological quality summary: review authors' judgements about each methodological quality item for each included study.

Comparison 1 Active versus expectant management of 3rd stage of labour (all women), Outcome 1 Severe primary postpartum haemorrhage (PPH) at time of birth (clinically estimated or measured blood loss ≥ 1000 mL).

Comparison 1 Active versus expectant management of 3rd stage of labour (all women), Outcome 4 Maternal Hb < 9 g/dL 24‐72 hours postpartum.

Comparison 1 Active versus expectant management of 3rd stage of labour (all women), Outcome 5 Admission to neonatal special/intensive care.

Comparison 1 Active versus expectant management of 3rd stage of labour (all women), Outcome 6 Neonatal jaundice requiring phototherapy or exchange transfusion.

Comparison 1 Active versus expectant management of 3rd stage of labour (all women), Outcome 10 Primary blood loss ≥ 500 mL at time of birth (clinically estimated or measured).

Comparison 1 Active versus expectant management of 3rd stage of labour (all women), Outcome 13 Mean maternal blood loss (mL) at time of birth (clinically estimated or measured).
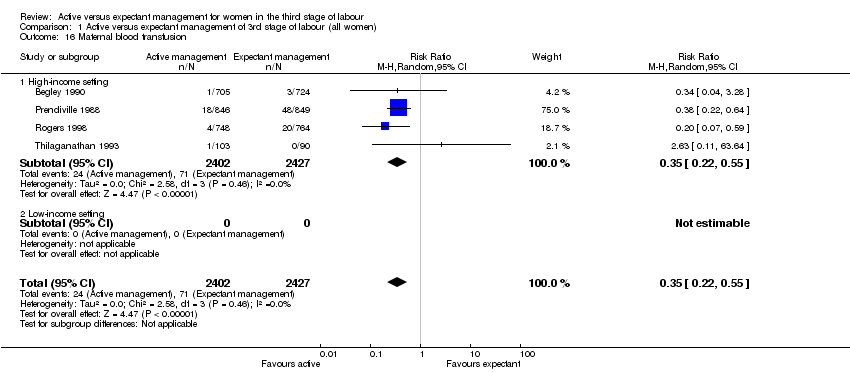
Comparison 1 Active versus expectant management of 3rd stage of labour (all women), Outcome 16 Maternal blood transfusion.
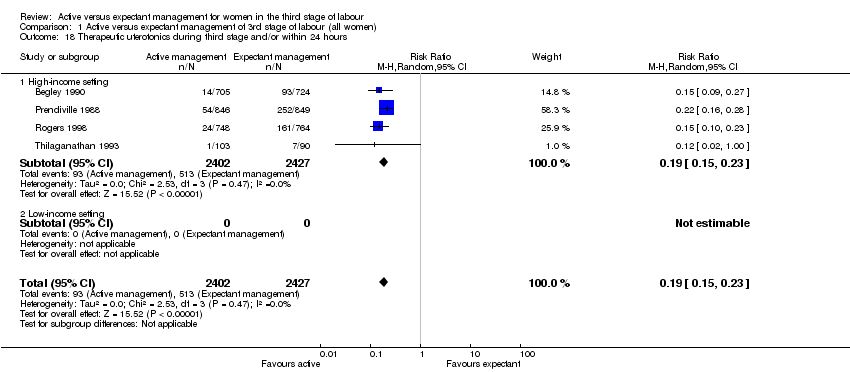
Comparison 1 Active versus expectant management of 3rd stage of labour (all women), Outcome 18 Therapeutic uterotonics during third stage and/or within 24 hours.

Comparison 1 Active versus expectant management of 3rd stage of labour (all women), Outcome 19 Mean length of third stage.

Comparison 1 Active versus expectant management of 3rd stage of labour (all women), Outcome 20 Manual removal of placenta as defined by authors.
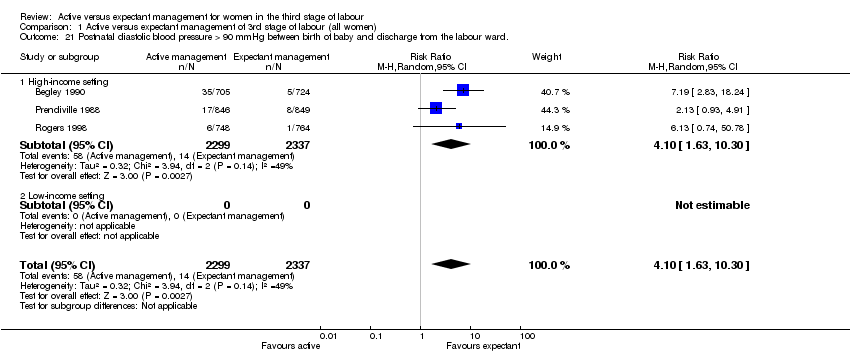
Comparison 1 Active versus expectant management of 3rd stage of labour (all women), Outcome 21 Postnatal diastolic blood pressure > 90 mmHg between birth of baby and discharge from the labour ward..
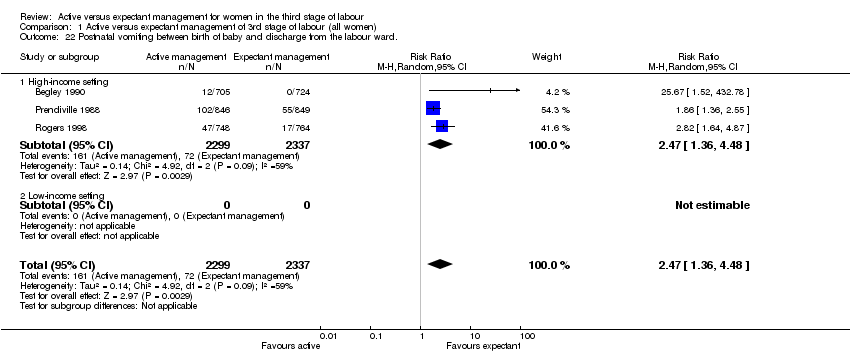
Comparison 1 Active versus expectant management of 3rd stage of labour (all women), Outcome 22 Postnatal vomiting between birth of baby and discharge from the labour ward..

Comparison 1 Active versus expectant management of 3rd stage of labour (all women), Outcome 23 Any analgesia between birth of the baby and discharge from labour ward.

Comparison 1 Active versus expectant management of 3rd stage of labour (all women), Outcome 25 Secondary blood loss/any vaginal bleeding needing treatment (after 24 hours and up to 6 weeks).

Comparison 1 Active versus expectant management of 3rd stage of labour (all women), Outcome 27 Surgical evacuation of retained products of conception.

Comparison 1 Active versus expectant management of 3rd stage of labour (all women), Outcome 28 Afterpains ‐ abdominal pain associated with the contracting uterus in the postpartum period..
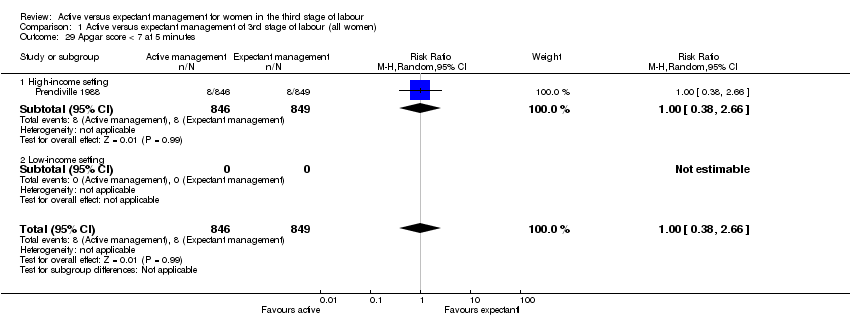
Comparison 1 Active versus expectant management of 3rd stage of labour (all women), Outcome 29 Apgar score < 7 at 5 minutes.

Comparison 1 Active versus expectant management of 3rd stage of labour (all women), Outcome 30 Birthweight.
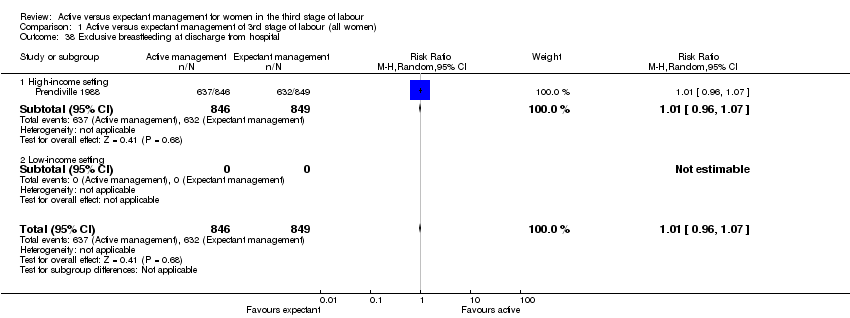
Comparison 1 Active versus expectant management of 3rd stage of labour (all women), Outcome 38 Exclusive breastfeeding at discharge from hospital.

Comparison 1 Active versus expectant management of 3rd stage of labour (all women), Outcome 40 Return to hospital as in‐ or outpatient because of bleeding (not pre‐specified).
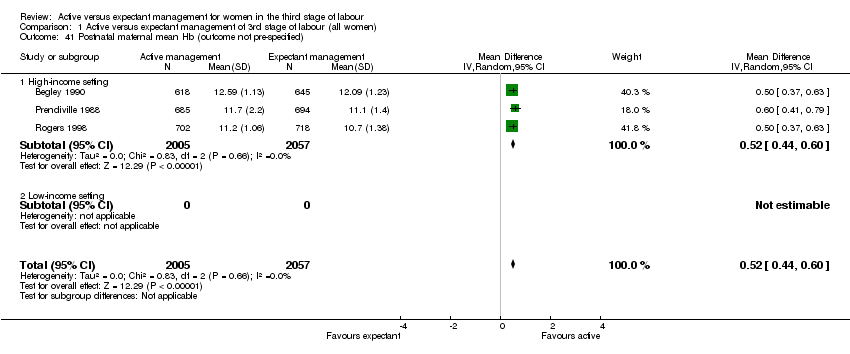
Comparison 1 Active versus expectant management of 3rd stage of labour (all women), Outcome 41 Postnatal maternal mean Hb (outcome not pre‐specified).
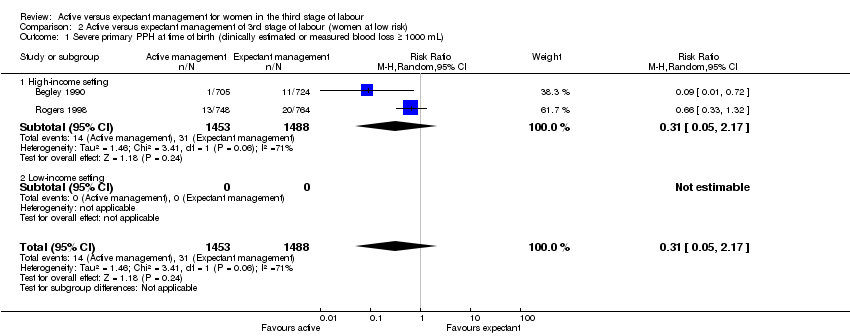
Comparison 2 Active versus expectant management of 3rd stage of labour (women at low risk), Outcome 1 Severe primary PPH at time of birth (clinically estimated or measured blood loss ≥ 1000 mL).

Comparison 2 Active versus expectant management of 3rd stage of labour (women at low risk), Outcome 4 Maternal Hb < 9 g/dL at 24‐72 hr.

Comparison 2 Active versus expectant management of 3rd stage of labour (women at low risk), Outcome 5 Admission to neonatal special/intensive care.

Comparison 2 Active versus expectant management of 3rd stage of labour (women at low risk), Outcome 6 Neonatal jaundice requiring phototherapy or exchange transfusion.

Comparison 2 Active versus expectant management of 3rd stage of labour (women at low risk), Outcome 10 Primary blood loss ≥ 500 mL at time of birth (clinically estimated or measured).

Comparison 2 Active versus expectant management of 3rd stage of labour (women at low risk), Outcome 13 Mean maternal blood loss (mL at the time of birth, clinically estimated or measured.

Comparison 2 Active versus expectant management of 3rd stage of labour (women at low risk), Outcome 16 Maternal blood transfusion.

Comparison 2 Active versus expectant management of 3rd stage of labour (women at low risk), Outcome 18 Therapeutic uterotonics during third stage and/or within 24 hours.
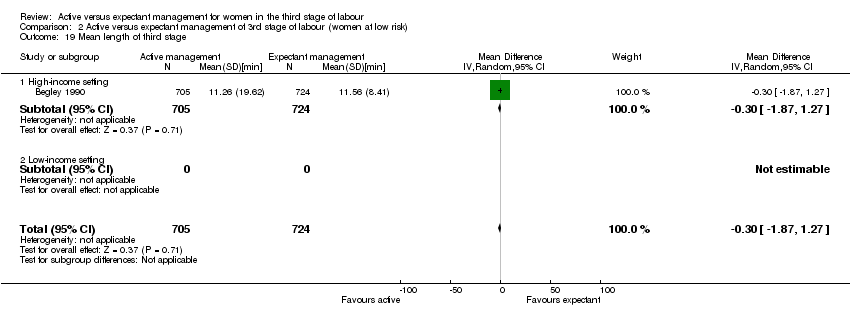
Comparison 2 Active versus expectant management of 3rd stage of labour (women at low risk), Outcome 19 Mean length of third stage.

Comparison 2 Active versus expectant management of 3rd stage of labour (women at low risk), Outcome 20 Manual removal of placenta as defined by authors.
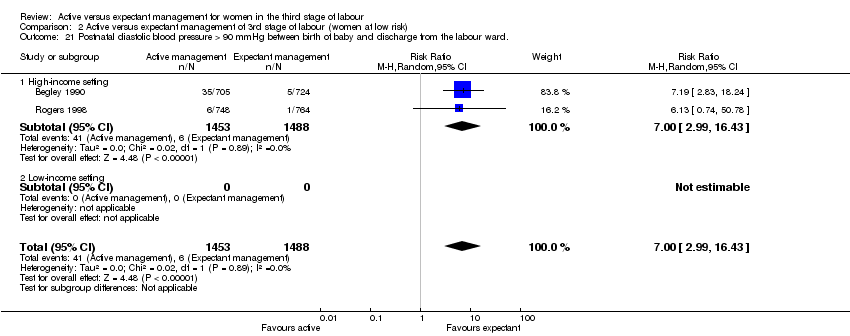
Comparison 2 Active versus expectant management of 3rd stage of labour (women at low risk), Outcome 21 Postnatal diastolic blood pressure > 90 mmHg between birth of baby and discharge from the labour ward..

Comparison 2 Active versus expectant management of 3rd stage of labour (women at low risk), Outcome 22 Postnatal vomiting between birth of baby and discharge from the labour ward..

Comparison 2 Active versus expectant management of 3rd stage of labour (women at low risk), Outcome 23 Any analgesia between birth of the baby and up to discharge from labour ward.

Comparison 2 Active versus expectant management of 3rd stage of labour (women at low risk), Outcome 25 Secondary blood loss/any vaginal bleeding needing treatment (after 24 hours and up to 6 weeks).

Comparison 2 Active versus expectant management of 3rd stage of labour (women at low risk), Outcome 27 Surgical evacuation of retained products of conception.

Comparison 2 Active versus expectant management of 3rd stage of labour (women at low risk), Outcome 28 Afterpains ‐ abdominal pain associated with the contracting uterus in the postpartum period..
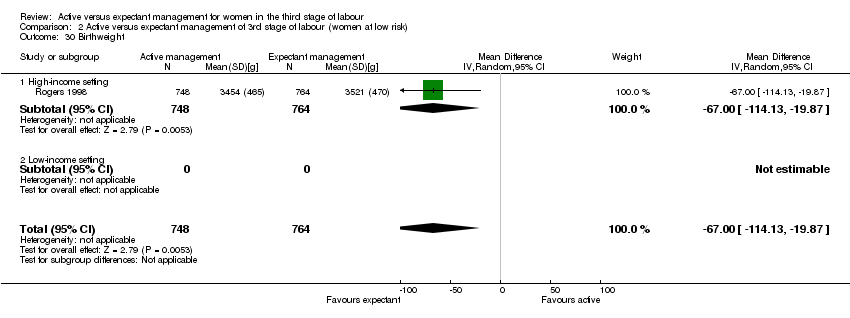
Comparison 2 Active versus expectant management of 3rd stage of labour (women at low risk), Outcome 30 Birthweight.
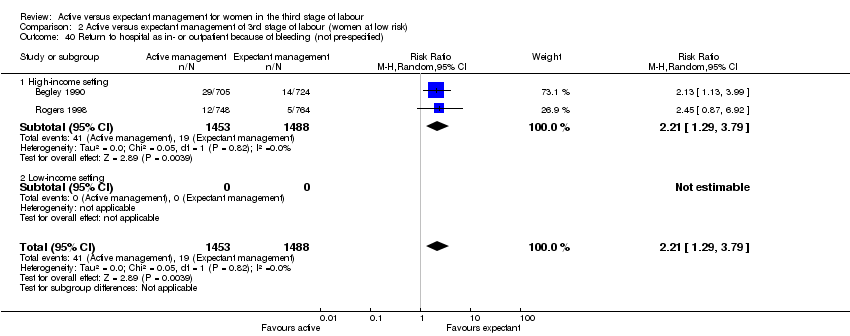
Comparison 2 Active versus expectant management of 3rd stage of labour (women at low risk), Outcome 40 Return to hospital as in‐ or outpatient because of bleeding (not pre‐specified).

Comparison 2 Active versus expectant management of 3rd stage of labour (women at low risk), Outcome 41 Postnatal maternal mean Hb (outcome not pre‐specified).

Comparison 10 Active versus mixed management (uterotonic after placental delivery, immediate cord clamping and no CCT) , Outcome 1 Severe primary PPH at time of birth (clinically estimated or measured blood loss ≥ 1000 mL).
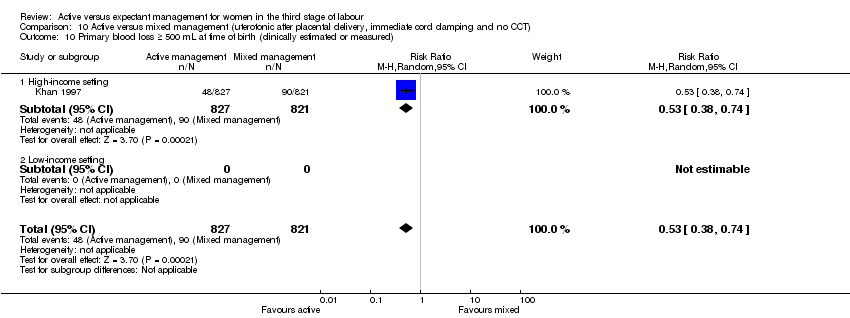
Comparison 10 Active versus mixed management (uterotonic after placental delivery, immediate cord clamping and no CCT) , Outcome 10 Primary blood loss ≥ 500 mL at time of birth (clinically estimated or measured).

Comparison 10 Active versus mixed management (uterotonic after placental delivery, immediate cord clamping and no CCT) , Outcome 16 Maternal blood transfusion.
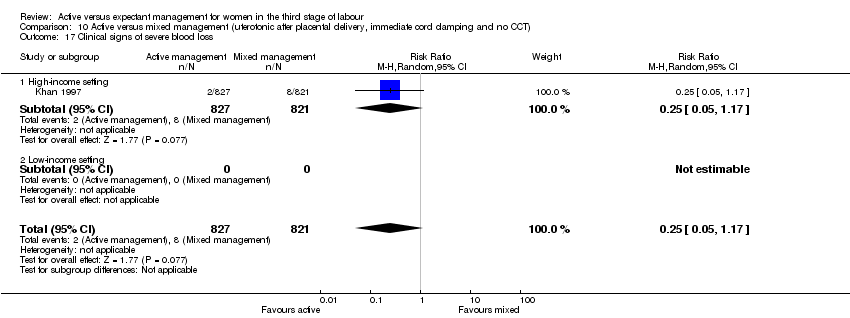
Comparison 10 Active versus mixed management (uterotonic after placental delivery, immediate cord clamping and no CCT) , Outcome 17 Clinical signs of severe blood loss.
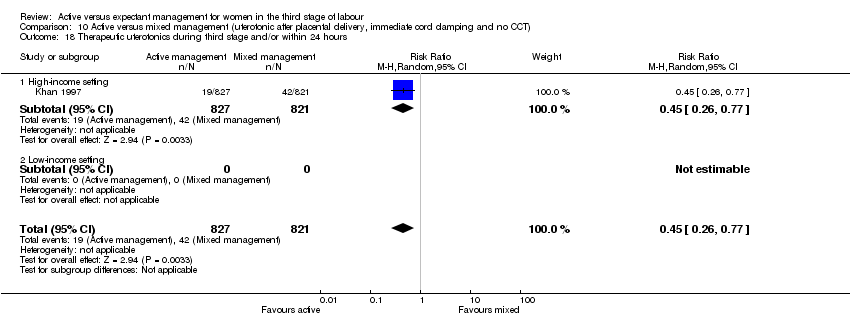
Comparison 10 Active versus mixed management (uterotonic after placental delivery, immediate cord clamping and no CCT) , Outcome 18 Therapeutic uterotonics during third stage and/or within 24 hours.

Comparison 10 Active versus mixed management (uterotonic after placental delivery, immediate cord clamping and no CCT) , Outcome 19 Mean length of third stage.

Comparison 11 Active versus mixed management (no routine uterotonic, early cord clamping, no CCT), Outcome 1 Severe primary PPH at time of birth (clinically estimated or measured blood loss ≥ 1000 mL).

Comparison 11 Active versus mixed management (no routine uterotonic, early cord clamping, no CCT), Outcome 4 Maternal Hb < 9 g/dL at 24‐72 hr.

Comparison 11 Active versus mixed management (no routine uterotonic, early cord clamping, no CCT), Outcome 10 Primary blood loss ≥ 500 mL at time of birth (clinically estimated or measured).

Comparison 11 Active versus mixed management (no routine uterotonic, early cord clamping, no CCT), Outcome 13 Mean maternal blood loss (mL) at time of birth (clinically estimated or measured).
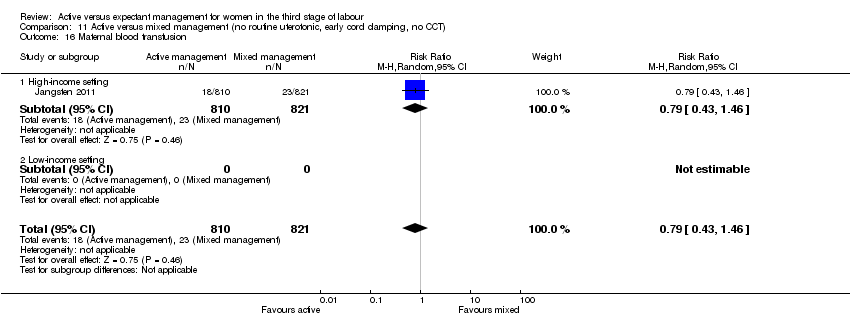
Comparison 11 Active versus mixed management (no routine uterotonic, early cord clamping, no CCT), Outcome 16 Maternal blood transfusion.

Comparison 11 Active versus mixed management (no routine uterotonic, early cord clamping, no CCT), Outcome 18 Therapeutic uterotonics during third stage and/or within 24 hours.

Comparison 11 Active versus mixed management (no routine uterotonic, early cord clamping, no CCT), Outcome 19 Mean length of third stage.

Comparison 11 Active versus mixed management (no routine uterotonic, early cord clamping, no CCT), Outcome 20 Manual removal of placenta as defined by authors.

Comparison 11 Active versus mixed management (no routine uterotonic, early cord clamping, no CCT), Outcome 28 Not prespecified: afterpains at 2 hours after birth (id 20458).

Comparison 11 Active versus mixed management (no routine uterotonic, early cord clamping, no CCT), Outcome 29 Not pre‐specified: afterpains the day after birth (id 20458).
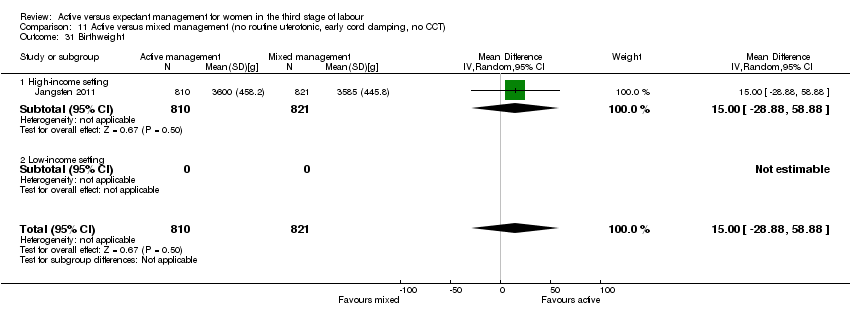
Comparison 11 Active versus mixed management (no routine uterotonic, early cord clamping, no CCT), Outcome 31 Birthweight.

Comparison 11 Active versus mixed management (no routine uterotonic, early cord clamping, no CCT), Outcome 42 Postnatal maternal mean Hb (outcome not pre‐specified).

Comparison 11 Active versus mixed management (no routine uterotonic, early cord clamping, no CCT), Outcome 43 Severe primary PPH after placental delivery and up to 2 hours (clinically estimated or measured blood loss ≥ 1000 mL) ‐ not pre‐specified.
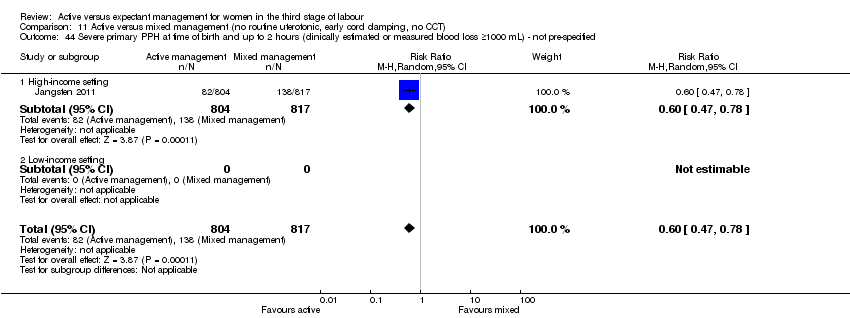
Comparison 11 Active versus mixed management (no routine uterotonic, early cord clamping, no CCT), Outcome 44 Severe primary PPH at time of birth and up to 2 hours (clinically estimated or measured blood loss ≥1000 mL) ‐ not pre‐specified.

Comparison 11 Active versus mixed management (no routine uterotonic, early cord clamping, no CCT), Outcome 45 Mean blood loss (mL) (clinically estimated or measured at birth and up to 2 hours (not pre‐specified).

Comparison 12 Active versus mixed management (no routine uterotonic, early cord clamping, CCT), Outcome 4 Maternal Hb < 9 g/dL at 24‐72 hr.

Comparison 12 Active versus mixed management (no routine uterotonic, early cord clamping, CCT), Outcome 19 Mean length of third stage.
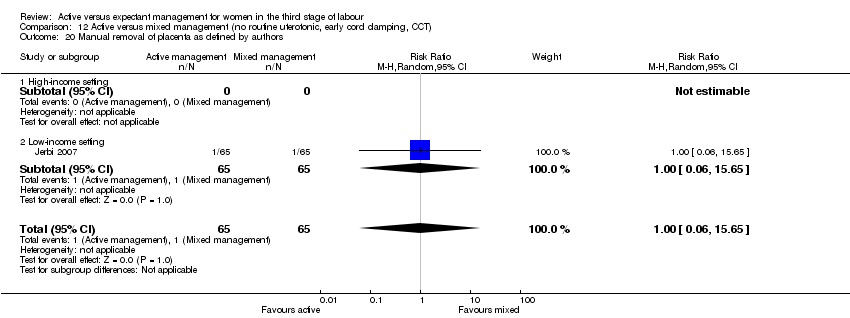
Comparison 12 Active versus mixed management (no routine uterotonic, early cord clamping, CCT), Outcome 20 Manual removal of placenta as defined by authors.
| Active versus expectant management of the third stage of labour (all women) | ||||||
| Population: all women who expected a vaginal birth at 24 weeks' gestation or later | ||||||
| Outcomes | Illustrative comparative risks* (95% CI) | Relative effect | No of Participants | Quality of the evidence | Comments | |
| Assumed risk | Corresponding risk | |||||
| Expectant management of the third stage of labour | Active management of the third stage of labour | |||||
| Severe primary postpartum haemorrhage (PPH) (clinically estimated or measured blood loss ≥ to 1000 mL at time of birth) | 24 per 1000 | 8 per 1000 | RR 0.34 | 4636 | ⊕⊝⊝⊝ | |
| Very severe primary PPH (clinically estimated or measured blood loss ≥ to 2500 mL at time of birth) | See comment | See comment | Not estimable | 0 | See comment | No data |
| Maternal mortality | See comment | See comment | Not estimable | 0 | See comment | No data |
| Maternal Hb < 9 g/dL 24 to 72 hours postpartum | 71 per 1000 | 36 per 1000 | RR 0.5 | 1572 | ⊕⊕⊝⊝ | |
| Admission to neonatal special/intensive care | 52 per 1000 | 42 per 1000 | RR 0.81 | 3207 | ⊕⊕⊝⊝ | |
| Neonatal jaundice requiring phototherapy or exchange transfusion | 49 per 1000 | 47 per 1000 | RR 0.96 | 3142 | ⊕⊝⊝⊝ | |
| Neonatal polycythaemia treated with dilutional exchange transfusion | See comment | See comment | Not estimable | 0 | See comment | No data |
| *The basis for the assumed risk (e.g. the median control group risk across studies) is provided in footnotes. The corresponding risk (and its 95% confidence interval) is based on the assumed risk in the comparison group and the relative effect of the intervention (and its 95% CI). | ||||||
| GRADE Working Group grades of evidence | ||||||
| 1Risk of bias: of the 3 trials providing data for this outcome, all 3 are at low risk of bias for sequence generation (selection bias), allocation concealment (selection bias) and for incomplete outcome data (attrition bias). 2 are at low risk of selective reporting (reporting bias) and 1 is unclear. 1 study is at high risk of other bias (see 'Risk of bias' tables). 2Risk of bias: of the 2 trials providing data for this outcome, both are at low risk of bias for sequence generation (selection bias) and allocation concealment (selection bias), 1 is at low risk of bias for incomplete outcome data (attrition bias) while the other is high‐risk. 1 is at high‐‐risk of selective reporting (reporting bias) and 1 is unclear. Both studies are at high risk of other bias (see 'Risk of bias' tables). 3Risk of bias: of the 2 trials providing data for this outcome, both are at low risk of bias for sequence generation (selection bias), allocation concealment (selection bias) and for incomplete outcome data (attrition bias). 1 is at low‐risk of selective reporting (reporting bias) and 1 is unclear. 1 study is at high risk of other bias and the other is at low risk of bias (see 'Risk of bias' tables). 4Risk of bias: Of the 2 trials providing data for this outcome, both are at low risk of bias for sequence generation (selection bias), allocation concealment (selection bias) and for incomplete outcome data (attrition bias). 1 is at low‐risk of selective reporting (reporting bias) and 1 is unclear. 1 study is at high risk of other bias and the other is at low risk of bias (see 'Risk of bias' tables). | ||||||
| Terms | Definitions used in this review | ||||||
| Expectant management of third stage of labour | 1. A prophylactic uterotonic agent is not administered; | ||||||
| Active management of third stage of labour | 1. The routine administration of a prophylactic uterotonic drug just before, with, or immediately after, the birth of the baby; | ||||||
| Mixed management of third stage of labour | A mixture of some of the components of both active and expectant management of third stage, but without exclusively containing all the components of either. There can be a number of different mixed third stage managements, for example: | ||||||
| Early prophylactic uterotonic | Prophylactic uterotonic drug administered just before, with, or immediately after, the birth of the infant. | ||||||
| Delayed prophylactic uterotonic | Prophylactic uterotonic drug administered after the cord pulsation has ceased. | ||||||
| Early cord clamping | The application of a clamp to the umbilical cord within 60 seconds of the birth of the infant (McDonald 2013). | ||||||
| Delayed cord clamping | The application of a clamp to the umbilical cord greater than 1 minute after birth or when cord pulsation has ceased (McDonald 2013). | ||||||
| Sarnat staging for hypoxic ischaemic encephalopathy (Sarnat 1976) | Stage 1 (mild): hyper‐alertness, hyper‐reflexia, dilated pupils, tachycardia, absence of seizures. Stage 2 (moderate): lethargy, hyper‐reflexia, miosis, bradycardia, seizures, hypotonia with weak suck and Moro reflexes. Stage 3 (severe): stupor, flaccidity, small to mid‐position pupils which react poorly to light, decreased stretch reflexes, hypothermia and absent Moro. | ||||||
| Active management protocol | Expectant management protocol | Active management used | Expectant management used | |
| (Bristol trial) | • IM syntometrine (5 units oxytocin + 0.5 mg ergometrine) (IM 10 units oxytocin if raised BP) Immediately after birth of anterior shoulder. • Clamp cord 30 seconds after birth. • CCT when uterus contracted. | • Try not to give oxytocic. • Try to leave cord attached to baby until placenta delivered. • Try not to use CCT or any manual interference with uterus at the fundus. • Encourage mother to adopt posture aiding delivery with gravity. • If placenta not delivered spontaneously wait, try putting baby to breast, and encourage maternal effort as above. | • Full active management (99%). • 99% cord clamped and cut before delivery of placenta. • 99% CCT. • 217 (26%) upright.
| • Full expectant management 403 (48%). • Full active management 168 (20%). • 278 (32%) had mixed management. • Cord left unclamped till pulsation ceased 48%. • Placenta delivered by maternal effort 60% and CCT 40%. • 416 (49%) upright. • 30% received uterotonic for treatment. |
| (Dublin trial) | • IV ergometrine 0.5 mg immediately following birth. • Try to clamp cord within 30 seconds. • When uterus contracted, attempt CCT. • Try not to give any special instructions re posture.
| • No oxytocic drug routinely. • Try to leave cord attached to baby until pulsation has ceased. • Placenta may be delivered by maternal effort or gentle controlled cord traction once separated. • Encourage mother to breastfeed. Help her to kneel/sit/squat. | • All given IV ergometrine before delivery of placenta. • 89% cord clamped and cut. • 93% CCT and 5% maternal effort. • 7% upright and 93% recumbent. | • 14% were given ergometrine for treatment, not prophylactically, 6 (0.83%) before placenta delivered. • Cord left unclamped till pulsation ceased 42%. • Placenta delivered by maternal effort 32% and gentle CCT 66%. • 11% upright. |
| (Hinchingbrooke trial) | •IM syntometrine (5 units oxytocin + 0.5 mg ergometrine) (IM 10 units oxytocin if raised blood pressure). • As soon as possible after birth of anterior shoulder (within 2 minutes of birth). • Immediate cord clamping and cutting. • CCT or maternal effort. • Women randomised to upright and recumbent in both arms. | • No uterotonic drug. • No cord clamping until after pulsation ceased. • Delivery of placenta within 1 hour by maternal effort. | • 699 (93.4%) had full active management. • 2 (0.3%) had fully expectant management. • 47 (6.2%) had mixed. • 95% given prophylactic uterotonic before delivery of placenta. • 93% cord clamped before pulsation ceased. • 46% CCT. • 44% upright (when placenta delivered). | • 488 (63.9%) had full expectant management. • 19 (2.5%) had fully active management. • 257 (33.6%) had mixed. • 21% received oxytocic for treatment, 2.5% prophylactically. • Cord left unclamped till pulsation ceased 70%. • Placenta delivered by CCT 12%. • 43% upright (when placenta delivered). |
| Thilaganathan 1993(Brighton trial) | • Syntometrine 1 mL (IM or IV, route not specified). • As soon as baby born. • Cord was “immediately clamped”. • Placenta delivered with CCT.
| • No oxytocic. • Cord not cut or clamped until after pulsation ceased (unless there were contraindications). • Deliver placenta by maternal effort after signs of separation. “when the placenta could be felt in the vagina, the midwife could then assist delivery of the placenta”. • Upright position encouraged. | • No information. | • No information. |
| (Abu Dhabi trial) | • IM oxytocin 10 units at delivery of anterior shoulder. • Immediate cord clamping and cutting. • CCT as soon as the uterus was contracted firmly ‐ repeated every 2‐3 minutes.
| • No oxytocic prior to delivery of placenta. • Cord clamped and cut after delivery. • No CCT. • No fundal massage. • Maternal expulsion after signs of separation. • IV infusion of oxytocin 10 units in 500 mL normal saline given slowly. | • No information. | • No information. |
| BP: blood pressure | ||||
| Outcome or subgroup title | No. of studies | No. of participants | Statistical method | Effect size |
| 1 Severe primary postpartum haemorrhage (PPH) at time of birth (clinically estimated or measured blood loss ≥ 1000 mL) Show forest plot | 3 | 4636 | Risk Ratio (M‐H, Random, 95% CI) | 0.34 [0.14, 0.87] |
| 1.1 High‐income setting | 3 | 4636 | Risk Ratio (M‐H, Random, 95% CI) | 0.34 [0.14, 0.87] |
| 1.2 Low‐income setting | 0 | 0 | Risk Ratio (M‐H, Random, 95% CI) | 0.0 [0.0, 0.0] |
| 2 Very severe primary PPH at time of birth (clinically estimated or measured blood loss ≥ 2500 mL) | 0 | 0 | Risk Ratio (M‐H, Random, 95% CI) | 0.0 [0.0, 0.0] |
| 2.1 High‐income setting | 0 | 0 | Risk Ratio (M‐H, Random, 95% CI) | 0.0 [0.0, 0.0] |
| 2.2 Low‐income setting | 0 | 0 | Risk Ratio (M‐H, Random, 95% CI) | 0.0 [0.0, 0.0] |
| 3 Maternal mortality | 0 | 0 | Risk Ratio (M‐H, Random, 95% CI) | 0.0 [0.0, 0.0] |
| 3.1 High‐income setting | 0 | 0 | Risk Ratio (M‐H, Random, 95% CI) | 0.0 [0.0, 0.0] |
| 3.2 Low‐income setting | 0 | 0 | Risk Ratio (M‐H, Random, 95% CI) | 0.0 [0.0, 0.0] |
| 4 Maternal Hb < 9 g/dL 24‐72 hours postpartum Show forest plot | 2 | 1572 | Risk Ratio (M‐H, Random, 95% CI) | 0.50 [0.30, 0.83] |
| 4.1 High‐income setting | 2 | 1572 | Risk Ratio (M‐H, Random, 95% CI) | 0.50 [0.30, 0.83] |
| 4.2 Low‐income setting | 0 | 0 | Risk Ratio (M‐H, Random, 95% CI) | 0.0 [0.0, 0.0] |
| 5 Admission to neonatal special/intensive care Show forest plot | 2 | 3207 | Risk Ratio (M‐H, Random, 95% CI) | 0.81 [0.60, 1.11] |
| 5.1 High‐income setting | 2 | 3207 | Risk Ratio (M‐H, Random, 95% CI) | 0.81 [0.60, 1.11] |
| 5.2 Low‐income setting | 0 | 0 | Risk Ratio (M‐H, Random, 95% CI) | 0.0 [0.0, 0.0] |
| 6 Neonatal jaundice requiring phototherapy or exchange transfusion Show forest plot | 2 | 3142 | Risk Ratio (M‐H, Random, 95% CI) | 0.96 [0.55, 1.68] |
| 6.1 High‐income setting | 2 | 3142 | Risk Ratio (M‐H, Random, 95% CI) | 0.96 [0.55, 1.68] |
| 6.2 Low‐income setting | 0 | 0 | Risk Ratio (M‐H, Random, 95% CI) | 0.0 [0.0, 0.0] |
| 7 Neonatal polycythaemia treated with dilutional exchange transfusion | 0 | 0 | Risk Ratio (M‐H, Random, 95% CI) | 0.0 [0.0, 0.0] |
| 7.1 High‐income setting | 0 | 0 | Risk Ratio (M‐H, Random, 95% CI) | 0.0 [0.0, 0.0] |
| 7.2 Low‐income setting | 0 | 0 | Risk Ratio (M‐H, Random, 95% CI) | 0.0 [0.0, 0.0] |
| 8 Severe primary PPH after placental delivery and up to 24 hours (clinically estimated or measured blood loss ≥ 1000 mL) | 0 | 0 | Risk Ratio (M‐H, Random, 95% CI) | 0.0 [0.0, 0.0] |
| 8.1 High‐income setting | 0 | 0 | Risk Ratio (M‐H, Random, 95% CI) | 0.0 [0.0, 0.0] |
| 8.2 Low‐income setting | 0 | 0 | Risk Ratio (M‐H, Random, 95% CI) | 0.0 [0.0, 0.0] |
| 9 Severe primary PPH at time of birth and up to 24 hours (clinically estimated or measured blood loss ≥ 1000 mL) | 0 | 0 | Risk Ratio (M‐H, Random, 95% CI) | 0.0 [0.0, 0.0] |
| 9.1 High‐income setting | 0 | 0 | Risk Ratio (M‐H, Random, 95% CI) | 0.0 [0.0, 0.0] |
| 9.2 Low‐income setting | 0 | 0 | Risk Ratio (M‐H, Random, 95% CI) | 0.0 [0.0, 0.0] |
| 10 Primary blood loss ≥ 500 mL at time of birth (clinically estimated or measured) Show forest plot | 3 | 4636 | Risk Ratio (M‐H, Random, 95% CI) | 0.34 [0.27, 0.44] |
| 10.1 High‐income setting | 3 | 4636 | Risk Ratio (M‐H, Random, 95% CI) | 0.34 [0.27, 0.44] |
| 10.2 Low‐income setting | 0 | 0 | Risk Ratio (M‐H, Random, 95% CI) | 0.0 [0.0, 0.0] |
| 11 Primary blood loss ≥ 500 mL after delivery of placenta and up to 24 hours (clinically estimated or measured) | 0 | 0 | Risk Ratio (M‐H, Random, 95% CI) | 0.0 [0.0, 0.0] |
| 11.1 High‐income setting | 0 | 0 | Risk Ratio (M‐H, Random, 95% CI) | 0.0 [0.0, 0.0] |
| 11.2 Low‐income setting | 0 | 0 | Risk Ratio (M‐H, Random, 95% CI) | 0.0 [0.0, 0.0] |
| 12 Primary blood loss ≥ 500 mL at time of birth and up to 24 hours (clinically estimated or measured) | 0 | 0 | Risk Ratio (M‐H, Random, 95% CI) | 0.0 [0.0, 0.0] |
| 12.1 High‐income setting | 0 | 0 | Risk Ratio (M‐H, Random, 95% CI) | 0.0 [0.0, 0.0] |
| 12.2 Low‐income setting | 0 | 0 | Risk Ratio (M‐H, Random, 95% CI) | 0.0 [0.0, 0.0] |
| 13 Mean maternal blood loss (mL) at time of birth (clinically estimated or measured) Show forest plot | 2 | 2941 | Mean Difference (IV, Random, 95% CI) | ‐78.80 [‐95.96, ‐61.64] |
| 13.1 High‐income setting | 2 | 2941 | Mean Difference (IV, Random, 95% CI) | ‐78.80 [‐95.96, ‐61.64] |
| 13.2 Low‐income setting | 0 | 0 | Mean Difference (IV, Random, 95% CI) | 0.0 [0.0, 0.0] |
| 14 Mean maternal blood loss (mL) after delivery of placenta and up to 24 hours (clinically estimated or measured) | 0 | 0 | Mean Difference (IV, Random, 95% CI) | 0.0 [0.0, 0.0] |
| 14.1 High‐income setting | 0 | 0 | Mean Difference (IV, Random, 95% CI) | 0.0 [0.0, 0.0] |
| 14.2 Low‐income setting | 0 | 0 | Mean Difference (IV, Random, 95% CI) | 0.0 [0.0, 0.0] |
| 15 Mean maternal blood loss (mL at time of birth and up to 24 hours (clinically estimated or measured) | 0 | 0 | Mean Difference (IV, Random, 95% CI) | 0.0 [0.0, 0.0] |
| 15.1 High‐income setting | 0 | 0 | Mean Difference (IV, Random, 95% CI) | 0.0 [0.0, 0.0] |
| 15.2 Low‐income setting | 0 | 0 | Mean Difference (IV, Random, 95% CI) | 0.0 [0.0, 0.0] |
| 16 Maternal blood transfusion Show forest plot | 4 | 4829 | Risk Ratio (M‐H, Random, 95% CI) | 0.35 [0.22, 0.55] |
| 16.1 High‐income setting | 4 | 4829 | Risk Ratio (M‐H, Random, 95% CI) | 0.35 [0.22, 0.55] |
| 16.2 Low‐income setting | 0 | 0 | Risk Ratio (M‐H, Random, 95% CI) | 0.0 [0.0, 0.0] |
| 17 Clinical signs of severe blood loss | 0 | 0 | Risk Ratio (M‐H, Random, 95% CI) | 0.0 [0.0, 0.0] |
| 17.1 High‐income setting | 0 | 0 | Risk Ratio (M‐H, Random, 95% CI) | 0.0 [0.0, 0.0] |
| 17.2 Low‐income setting | 0 | 0 | Risk Ratio (M‐H, Random, 95% CI) | 0.0 [0.0, 0.0] |
| 18 Therapeutic uterotonics during third stage and/or within 24 hours Show forest plot | 4 | 4829 | Risk Ratio (M‐H, Random, 95% CI) | 0.19 [0.15, 0.23] |
| 18.1 High‐income setting | 4 | 4829 | Risk Ratio (M‐H, Random, 95% CI) | 0.19 [0.15, 0.23] |
| 18.2 Low‐income setting | 0 | 0 | Risk Ratio (M‐H, Random, 95% CI) | 0.0 [0.0, 0.0] |
| 19 Mean length of third stage Show forest plot | 1 | 1429 | Mean Difference (IV, Random, 95% CI) | ‐0.30 [‐1.87, 1.27] |
| 19.1 High‐income setting | 1 | 1429 | Mean Difference (IV, Random, 95% CI) | ‐0.30 [‐1.87, 1.27] |
| 19.2 Low‐income setting | 0 | 0 | Mean Difference (IV, Random, 95% CI) | 0.0 [0.0, 0.0] |
| 20 Manual removal of placenta as defined by authors Show forest plot | 4 | 4829 | Risk Ratio (M‐H, Random, 95% CI) | 1.78 [0.57, 5.56] |
| 20.1 High‐income setting | 4 | 4829 | Risk Ratio (M‐H, Random, 95% CI) | 1.78 [0.57, 5.56] |
| 20.2 Low‐income setting | 0 | 0 | Risk Ratio (M‐H, Random, 95% CI) | 0.0 [0.0, 0.0] |
| 21 Postnatal diastolic blood pressure > 90 mmHg between birth of baby and discharge from the labour ward. Show forest plot | 3 | 4636 | Risk Ratio (M‐H, Random, 95% CI) | 4.10 [1.63, 10.30] |
| 21.1 High‐income setting | 3 | 4636 | Risk Ratio (M‐H, Random, 95% CI) | 4.10 [1.63, 10.30] |
| 21.2 Low‐income setting | 0 | 0 | Risk Ratio (M‐H, Random, 95% CI) | 0.0 [0.0, 0.0] |
| 22 Postnatal vomiting between birth of baby and discharge from the labour ward. Show forest plot | 3 | 4636 | Risk Ratio (M‐H, Random, 95% CI) | 2.47 [1.36, 4.48] |
| 22.1 High‐income setting | 3 | 4636 | Risk Ratio (M‐H, Random, 95% CI) | 2.47 [1.36, 4.48] |
| 22.2 Low‐income setting | 0 | 0 | Risk Ratio (M‐H, Random, 95% CI) | 0.0 [0.0, 0.0] |
| 23 Any analgesia between birth of the baby and discharge from labour ward Show forest plot | 1 | 1429 | Risk Ratio (M‐H, Random, 95% CI) | 2.53 [1.34, 4.78] |
| 23.1 High‐income setting | 1 | 1429 | Risk Ratio (M‐H, Random, 95% CI) | 2.53 [1.34, 4.78] |
| 23.2 Low‐income setting | 0 | 0 | Risk Ratio (M‐H, Random, 95% CI) | 0.0 [0.0, 0.0] |
| 24 Women's assessment of pain during third stage as reported by authors. | 0 | 0 | Risk Ratio (M‐H, Random, 95% CI) | 0.0 [0.0, 0.0] |
| 24.1 High‐income setting | 0 | 0 | Risk Ratio (M‐H, Random, 95% CI) | 0.0 [0.0, 0.0] |
| 24.2 Low‐income setting | 0 | 0 | Risk Ratio (M‐H, Random, 95% CI) | 0.0 [0.0, 0.0] |
| 25 Secondary blood loss/any vaginal bleeding needing treatment (after 24 hours and up to 6 weeks) Show forest plot | 3 | 4636 | Risk Ratio (M‐H, Random, 95% CI) | 1.10 [0.40, 2.99] |
| 25.1 High‐income setting | 3 | 4636 | Risk Ratio (M‐H, Random, 95% CI) | 1.10 [0.40, 2.99] |
| 25.2 Low‐income setting | 0 | 0 | Risk Ratio (M‐H, Random, 95% CI) | 0.0 [0.0, 0.0] |
| 26 Amount of lochia either estimated or measured after 24 hours and up to discharge from hospital. | 0 | 0 | Mean Difference (IV, Random, 95% CI) | 0.0 [0.0, 0.0] |
| 26.1 High‐income setting | 0 | 0 | Mean Difference (IV, Random, 95% CI) | 0.0 [0.0, 0.0] |
| 26.2 Low‐income setting | 0 | 0 | Mean Difference (IV, Random, 95% CI) | 0.0 [0.0, 0.0] |
| 27 Surgical evacuation of retained products of conception Show forest plot | 3 | 4636 | Risk Ratio (M‐H, Random, 95% CI) | 0.74 [0.32, 1.71] |
| 27.1 High‐income setting | 3 | 4636 | Risk Ratio (M‐H, Random, 95% CI) | 0.74 [0.32, 1.71] |
| 27.2 Low‐income setting | 0 | 0 | Risk Ratio (M‐H, Random, 95% CI) | 0.0 [0.0, 0.0] |
| 28 Afterpains ‐ abdominal pain associated with the contracting uterus in the postpartum period. Show forest plot | 1 | 1429 | Risk Ratio (M‐H, Random, 95% CI) | 2.53 [1.34, 4.78] |
| 28.1 High‐income setting | 1 | 1429 | Risk Ratio (M‐H, Random, 95% CI) | 2.53 [1.34, 4.78] |
| 28.2 Low‐income setting | 0 | 0 | Risk Ratio (M‐H, Random, 95% CI) | 0.0 [0.0, 0.0] |
| 29 Apgar score < 7 at 5 minutes Show forest plot | 1 | 1695 | Risk Ratio (M‐H, Random, 95% CI) | 1.00 [0.38, 2.66] |
| 29.1 High‐income setting | 1 | 1695 | Risk Ratio (M‐H, Random, 95% CI) | 1.00 [0.38, 2.66] |
| 29.2 Low‐income setting | 0 | 0 | Risk Ratio (M‐H, Random, 95% CI) | 0.0 [0.0, 0.0] |
| 30 Birthweight Show forest plot | 2 | 3207 | Mean Difference (IV, Random, 95% CI) | ‐76.90 [‐108.51, ‐45.30] |
| 30.1 High‐income setting | 2 | 3207 | Mean Difference (IV, Random, 95% CI) | ‐76.90 [‐108.51, ‐45.30] |
| 30.2 Low‐income setting | 0 | 0 | Mean Difference (IV, Random, 95% CI) | 0.0 [0.0, 0.0] |
| 31 Neonatal encephalopathy assessed using Sarnat staging (Sarnat 1976; Table 1). | 0 | 0 | Risk Ratio (M‐H, Random, 95% CI) | 0.0 [0.0, 0.0] |
| 31.1 High‐income setting | 0 | 0 | Risk Ratio (M‐H, Random, 95% CI) | 0.0 [0.0, 0.0] |
| 31.2 Low‐income setting | 0 | 0 | Risk Ratio (M‐H, Random, 95% CI) | 0.0 [0.0, 0.0] |
| 32 Neonatal mortality | 0 | 0 | Risk Ratio (M‐H, Random, 95% CI) | 0.0 [0.0, 0.0] |
| 32.1 High‐income setting | 0 | 0 | Risk Ratio (M‐H, Random, 95% CI) | 0.0 [0.0, 0.0] |
| 32.2 Low‐income setting | 0 | 0 | Risk Ratio (M‐H, Random, 95% CI) | 0.0 [0.0, 0.0] |
| 33 Intraventricular haemorrhage ‐ Papille grade III/IV ‐ (for infants born before 34 weeks' gestation only). | 0 | 0 | Risk Ratio (M‐H, Random, 95% CI) | 0.0 [0.0, 0.0] |
| 33.1 High‐income setting | 0 | 0 | Risk Ratio (M‐H, Random, 95% CI) | 0.0 [0.0, 0.0] |
| 33.2 Low‐income setting | 0 | 0 | Risk Ratio (M‐H, Random, 95% CI) | 0.0 [0.0, 0.0] |
| 34 Number of infants who received a red blood cell transfusion. | 0 | 0 | Risk Ratio (M‐H, Random, 95% CI) | 0.0 [0.0, 0.0] |
| 34.1 High‐income setting | 0 | 0 | Risk Ratio (M‐H, Random, 95% CI) | 0.0 [0.0, 0.0] |
| 34.2 Low‐income setting | 0 | 0 | Risk Ratio (M‐H, Random, 95% CI) | 0.0 [0.0, 0.0] |
| 35 Infant Hb level at 24 to 72 hours | 0 | 0 | Mean Difference (IV, Random, 95% CI) | 0.0 [0.0, 0.0] |
| 35.1 High‐income setting | 0 | 0 | Mean Difference (IV, Random, 95% CI) | 0.0 [0.0, 0.0] |
| 35.2 Low‐income setting | 0 | 0 | Mean Difference (IV, Random, 95% CI) | 0.0 [0.0, 0.0] |
| 36 Infant Hb level at 3‐6 months | 0 | 0 | Mean Difference (IV, Random, 95% CI) | 0.0 [0.0, 0.0] |
| 36.1 High‐income setting | 0 | 0 | Mean Difference (IV, Random, 95% CI) | 0.0 [0.0, 0.0] |
| 36.2 Low‐income setting | 0 | 0 | Mean Difference (IV, Random, 95% CI) | 0.0 [0.0, 0.0] |
| 37 Infant iron indices (ferritin) at 3 to 6 months. | 0 | 0 | Risk Ratio (M‐H, Random, 95% CI) | 0.0 [0.0, 0.0] |
| 37.1 High‐income setting | 0 | 0 | Risk Ratio (M‐H, Random, 95% CI) | 0.0 [0.0, 0.0] |
| 37.2 Low‐income setting | 0 | 0 | Risk Ratio (M‐H, Random, 95% CI) | 0.0 [0.0, 0.0] |
| 38 Exclusive breastfeeding at discharge from hospital Show forest plot | 1 | 1695 | Risk Ratio (M‐H, Random, 95% CI) | 1.01 [0.96, 1.07] |
| 38.1 High‐income setting | 1 | 1695 | Risk Ratio (M‐H, Random, 95% CI) | 1.01 [0.96, 1.07] |
| 38.2 Low‐income setting | 0 | 0 | Risk Ratio (M‐H, Random, 95% CI) | 0.0 [0.0, 0.0] |
| 39 Neurodevelopmental, cognitive or developmental outcomes assessed after age 18 months. | 0 | 0 | Risk Ratio (M‐H, Random, 95% CI) | 0.0 [0.0, 0.0] |
| 39.1 High‐income setting | 0 | 0 | Risk Ratio (M‐H, Random, 95% CI) | 0.0 [0.0, 0.0] |
| 39.2 Low‐income setting | 0 | 0 | Risk Ratio (M‐H, Random, 95% CI) | 0.0 [0.0, 0.0] |
| 40 Return to hospital as in‐ or outpatient because of bleeding (not pre‐specified) Show forest plot | 2 | 2941 | Risk Ratio (M‐H, Random, 95% CI) | 2.21 [1.29, 3.79] |
| 40.1 High‐income setting | 2 | 2941 | Risk Ratio (M‐H, Random, 95% CI) | 2.21 [1.29, 3.79] |
| 40.2 Low‐income setting | 0 | 0 | Risk Ratio (M‐H, Random, 95% CI) | 0.0 [0.0, 0.0] |
| 41 Postnatal maternal mean Hb (outcome not pre‐specified) Show forest plot | 3 | 4062 | Mean Difference (IV, Random, 95% CI) | 0.52 [0.44, 0.60] |
| 41.1 High‐income setting | 3 | 4062 | Mean Difference (IV, Random, 95% CI) | 0.52 [0.44, 0.60] |
| 41.2 Low‐income setting | 0 | 0 | Mean Difference (IV, Random, 95% CI) | 0.0 [0.0, 0.0] |
| Outcome or subgroup title | No. of studies | No. of participants | Statistical method | Effect size |
| 1 Severe primary PPH at time of birth (clinically estimated or measured blood loss ≥ 1000 mL) Show forest plot | 2 | 2941 | Risk Ratio (M‐H, Random, 95% CI) | 0.31 [0.05, 2.17] |
| 1.1 High‐income setting | 2 | 2941 | Risk Ratio (M‐H, Random, 95% CI) | 0.31 [0.05, 2.17] |
| 1.2 Low‐income setting | 0 | 0 | Risk Ratio (M‐H, Random, 95% CI) | 0.0 [0.0, 0.0] |
| 2 Very severe primary PPH at time of birth (clinically estimated or measured blood loss ≥ 2500 mL) | 0 | 0 | Risk Ratio (M‐H, Random, 95% CI) | 0.0 [0.0, 0.0] |
| 2.1 High‐income setting | 0 | 0 | Risk Ratio (M‐H, Random, 95% CI) | 0.0 [0.0, 0.0] |
| 2.2 Low‐income setting | 0 | 0 | Risk Ratio (M‐H, Random, 95% CI) | 0.0 [0.0, 0.0] |
| 3 Maternal mortality | 0 | 0 | Risk Ratio (M‐H, Random, 95% CI) | 0.0 [0.0, 0.0] |
| 3.1 High‐income setting | 0 | 0 | Risk Ratio (M‐H, Random, 95% CI) | 0.0 [0.0, 0.0] |
| 3.2 Low‐income setting | 0 | 0 | Risk Ratio (M‐H, Random, 95% CI) | 0.0 [0.0, 0.0] |
| 4 Maternal Hb < 9 g/dL at 24‐72 hr Show forest plot | 1 | 193 | Risk Ratio (M‐H, Random, 95% CI) | 0.17 [0.02, 1.47] |
| 4.1 High‐income setting | 1 | 193 | Risk Ratio (M‐H, Random, 95% CI) | 0.17 [0.02, 1.47] |
| 4.2 Low‐income setting | 0 | 0 | Risk Ratio (M‐H, Random, 95% CI) | 0.0 [0.0, 0.0] |
| 5 Admission to neonatal special/intensive care Show forest plot | 1 | 1512 | Risk Ratio (M‐H, Random, 95% CI) | 1.02 [0.55, 1.88] |
| 5.1 High‐income setting | 1 | 1512 | Risk Ratio (M‐H, Random, 95% CI) | 1.02 [0.55, 1.88] |
| 5.2 Low‐income setting | 0 | 0 | Risk Ratio (M‐H, Random, 95% CI) | 0.0 [0.0, 0.0] |
| 6 Neonatal jaundice requiring phototherapy or exchange transfusion Show forest plot | 1 | 1447 | Risk Ratio (M‐H, Random, 95% CI) | 1.31 [0.78, 2.18] |
| 6.1 High‐income setting | 1 | 1447 | Risk Ratio (M‐H, Random, 95% CI) | 1.31 [0.78, 2.18] |
| 6.2 Low‐income setting | 0 | 0 | Risk Ratio (M‐H, Random, 95% CI) | 0.0 [0.0, 0.0] |
| 7 Neonatal polycythaemia treated with dilutional exchange transfusion | 0 | 0 | Risk Ratio (M‐H, Random, 95% CI) | 0.0 [0.0, 0.0] |
| 7.1 High‐income setting | 0 | 0 | Risk Ratio (M‐H, Random, 95% CI) | 0.0 [0.0, 0.0] |
| 7.2 Low‐income setting | 0 | 0 | Risk Ratio (M‐H, Random, 95% CI) | 0.0 [0.0, 0.0] |
| 8 Severe primary PPH after placental delivery and up to 24 hours (clinically estimated or measured blood loss ≥ 1000 mL) | 0 | 0 | Risk Ratio (M‐H, Random, 95% CI) | 0.0 [0.0, 0.0] |
| 8.1 High‐income setting | 0 | 0 | Risk Ratio (M‐H, Random, 95% CI) | 0.0 [0.0, 0.0] |
| 8.2 Low‐income setting | 0 | 0 | Risk Ratio (M‐H, Random, 95% CI) | 0.0 [0.0, 0.0] |
| 9 Severe primary PPH at time of birth and up to 24 hours (clinically estimated or measured blood loss ≥ 1000 mL) | 0 | 0 | Risk Ratio (M‐H, Random, 95% CI) | 0.0 [0.0, 0.0] |
| 9.1 High‐income setting | 0 | 0 | Risk Ratio (M‐H, Random, 95% CI) | 0.0 [0.0, 0.0] |
| 9.2 Low‐income setting | 0 | 0 | Risk Ratio (M‐H, Random, 95% CI) | 0.0 [0.0, 0.0] |
| 10 Primary blood loss ≥ 500 mL at time of birth (clinically estimated or measured) Show forest plot | 2 | 2941 | Risk Ratio (M‐H, Random, 95% CI) | 0.33 [0.20, 0.56] |
| 10.1 High‐income setting | 2 | 2941 | Risk Ratio (M‐H, Random, 95% CI) | 0.33 [0.20, 0.56] |
| 10.2 Low‐income setting | 0 | 0 | Risk Ratio (M‐H, Random, 95% CI) | 0.0 [0.0, 0.0] |
| 11 Primary blood loss ≥ 500 mL after delivery of placenta and up to 24 hours (clinically estimated or measured) | 0 | 0 | Risk Ratio (M‐H, Random, 95% CI) | 0.0 [0.0, 0.0] |
| 11.1 High‐income setting | 0 | 0 | Risk Ratio (M‐H, Random, 95% CI) | 0.0 [0.0, 0.0] |
| 11.2 Low‐income setting | 0 | 0 | Risk Ratio (M‐H, Random, 95% CI) | 0.0 [0.0, 0.0] |
| 12 Primary blood loss ≥ 500 mL at time of birth and up to 24 hours (clinically estimated or measured) | 0 | 0 | Risk Ratio (M‐H, Random, 95% CI) | 0.0 [0.0, 0.0] |
| 12.1 High‐income setting | 0 | 0 | Risk Ratio (M‐H, Random, 95% CI) | 0.0 [0.0, 0.0] |
| 12.2 Low‐income setting | 0 | 0 | Risk Ratio (M‐H, Random, 95% CI) | 0.0 [0.0, 0.0] |
| 13 Mean maternal blood loss (mL at the time of birth, clinically estimated or measured Show forest plot | 2 | 2941 | Mean Difference (IV, Random, 95% CI) | ‐78.80 [‐95.96, ‐61.64] |
| 13.1 High‐income setting | 2 | 2941 | Mean Difference (IV, Random, 95% CI) | ‐78.80 [‐95.96, ‐61.64] |
| 13.2 Low‐income setting | 0 | 0 | Mean Difference (IV, Random, 95% CI) | 0.0 [0.0, 0.0] |
| 14 Mean maternal blood loss (mL) after delivery of placenta and up to 24 hours (clinically estimated or measured) | 0 | 0 | Mean Difference (IV, Random, 95% CI) | 0.0 [0.0, 0.0] |
| 14.1 High‐income setting | 0 | 0 | Mean Difference (IV, Random, 95% CI) | 0.0 [0.0, 0.0] |
| 14.2 Low‐income setting | 0 | 0 | Mean Difference (IV, Random, 95% CI) | 0.0 [0.0, 0.0] |
| 15 Mean maternal blood loss (mL) at time of birth and up to 24 hours (clinically estimated or measured) | 0 | 0 | Mean Difference (IV, Random, 95% CI) | 0.0 [0.0, 0.0] |
| 15.1 High‐income setting | 0 | 0 | Mean Difference (IV, Random, 95% CI) | 0.0 [0.0, 0.0] |
| 15.2 Low‐income setting | 0 | 0 | Mean Difference (IV, Random, 95% CI) | 0.0 [0.0, 0.0] |
| 16 Maternal blood transfusion Show forest plot | 3 | 3134 | Risk Ratio (M‐H, Random, 95% CI) | 0.30 [0.10, 0.88] |
| 16.1 High‐income setting | 3 | 3134 | Risk Ratio (M‐H, Random, 95% CI) | 0.30 [0.10, 0.88] |
| 16.2 Low‐income setting | 0 | 0 | Risk Ratio (M‐H, Random, 95% CI) | 0.0 [0.0, 0.0] |
| 17 Clinical signs of severe blood loss | 0 | 0 | Risk Ratio (M‐H, Random, 95% CI) | 0.0 [0.0, 0.0] |
| 17.1 High‐income setting | 0 | 0 | Risk Ratio (M‐H, Random, 95% CI) | 0.0 [0.0, 0.0] |
| 17.2 Low‐income setting | 0 | 0 | Risk Ratio (M‐H, Random, 95% CI) | 0.0 [0.0, 0.0] |
| 18 Therapeutic uterotonics during third stage and/or within 24 hours Show forest plot | 3 | 3134 | Risk Ratio (M‐H, Random, 95% CI) | 0.15 [0.11, 0.21] |
| 18.1 High‐income setting | 3 | 3134 | Risk Ratio (M‐H, Random, 95% CI) | 0.15 [0.11, 0.21] |
| 18.2 Low‐income setting | 0 | 0 | Risk Ratio (M‐H, Random, 95% CI) | 0.0 [0.0, 0.0] |
| 19 Mean length of third stage Show forest plot | 1 | 1429 | Mean Difference (IV, Random, 95% CI) | ‐0.30 [‐1.87, 1.27] |
| 19.1 High‐income setting | 1 | 1429 | Mean Difference (IV, Random, 95% CI) | ‐0.30 [‐1.87, 1.27] |
| 19.2 Low‐income setting | 0 | 0 | Mean Difference (IV, Random, 95% CI) | 0.0 [0.0, 0.0] |
| 20 Manual removal of placenta as defined by authors Show forest plot | 3 | 3134 | Risk Ratio (M‐H, Random, 95% CI) | 3.58 [0.42, 30.61] |
| 20.1 High‐income setting | 3 | 3134 | Risk Ratio (M‐H, Random, 95% CI) | 3.58 [0.42, 30.61] |
| 20.2 Low‐income setting | 0 | 0 | Risk Ratio (M‐H, Random, 95% CI) | 0.0 [0.0, 0.0] |
| 21 Postnatal diastolic blood pressure > 90 mmHg between birth of baby and discharge from the labour ward. Show forest plot | 2 | 2941 | Risk Ratio (M‐H, Random, 95% CI) | 7.00 [2.99, 16.43] |
| 21.1 High‐income setting | 2 | 2941 | Risk Ratio (M‐H, Random, 95% CI) | 7.00 [2.99, 16.43] |
| 21.2 Low‐income setting | 0 | 0 | Risk Ratio (M‐H, Random, 95% CI) | 0.0 [0.0, 0.0] |
| 22 Postnatal vomiting between birth of baby and discharge from the labour ward. Show forest plot | 2 | 2941 | Risk Ratio (M‐H, Random, 95% CI) | 5.63 [0.69, 46.08] |
| 22.1 High‐income setting | 2 | 2941 | Risk Ratio (M‐H, Random, 95% CI) | 5.63 [0.69, 46.08] |
| 22.2 Low‐income setting | 0 | 0 | Risk Ratio (M‐H, Random, 95% CI) | 0.0 [0.0, 0.0] |
| 23 Any analgesia between birth of the baby and up to discharge from labour ward Show forest plot | 1 | 1429 | Risk Ratio (M‐H, Random, 95% CI) | 2.53 [1.34, 4.78] |
| 23.1 High‐income setting | 1 | 1429 | Risk Ratio (M‐H, Random, 95% CI) | 2.53 [1.34, 4.78] |
| 23.2 Low‐income setting | 0 | 0 | Risk Ratio (M‐H, Random, 95% CI) | 0.0 [0.0, 0.0] |
| 24 Women's assessment of pain during third stage as reported by authors. | 0 | 0 | Risk Ratio (M‐H, Random, 95% CI) | 0.0 [0.0, 0.0] |
| 24.1 High‐income setting | 0 | 0 | Risk Ratio (M‐H, Random, 95% CI) | 0.0 [0.0, 0.0] |
| 24.2 Low‐income setting | 0 | 0 | Risk Ratio (M‐H, Random, 95% CI) | 0.0 [0.0, 0.0] |
| 25 Secondary blood loss/any vaginal bleeding needing treatment (after 24 hours and up to 6 weeks) Show forest plot | 2 | 2941 | Risk Ratio (M‐H, Random, 95% CI) | 1.78 [0.69, 4.60] |
| 25.1 High‐income setting | 2 | 2941 | Risk Ratio (M‐H, Random, 95% CI) | 1.78 [0.69, 4.60] |
| 25.2 Low‐income setting | 0 | 0 | Risk Ratio (M‐H, Random, 95% CI) | 0.0 [0.0, 0.0] |
| 26 Amount of lochia either estimated or measured after 24 hours and up to discharge from hospital. | 0 | 0 | Mean Difference (IV, Random, 95% CI) | 0.0 [0.0, 0.0] |
| 26.1 High‐income setting | 0 | 0 | Mean Difference (IV, Random, 95% CI) | 0.0 [0.0, 0.0] |
| 26.2 Low‐income setting | 0 | 0 | Mean Difference (IV, Random, 95% CI) | 0.0 [0.0, 0.0] |
| 27 Surgical evacuation of retained products of conception Show forest plot | 2 | 2941 | Risk Ratio (M‐H, Random, 95% CI) | 0.69 [0.12, 3.98] |
| 27.1 High‐income setting | 2 | 2941 | Risk Ratio (M‐H, Random, 95% CI) | 0.69 [0.12, 3.98] |
| 27.2 Low‐income setting | 0 | 0 | Risk Ratio (M‐H, Random, 95% CI) | 0.0 [0.0, 0.0] |
| 28 Afterpains ‐ abdominal pain associated with the contracting uterus in the postpartum period. Show forest plot | 1 | 1429 | Risk Ratio (M‐H, Random, 95% CI) | 2.53 [1.34, 4.78] |
| 28.1 High‐income setting | 1 | 1429 | Risk Ratio (M‐H, Random, 95% CI) | 2.53 [1.34, 4.78] |
| 28.2 Low‐income setting | 0 | 0 | Risk Ratio (M‐H, Random, 95% CI) | 0.0 [0.0, 0.0] |
| 29 Apgar score < 7 at 5 minutes | 0 | 0 | Risk Ratio (M‐H, Random, 95% CI) | 0.0 [0.0, 0.0] |
| 29.1 High‐income setting | 0 | 0 | Risk Ratio (M‐H, Random, 95% CI) | 0.0 [0.0, 0.0] |
| 29.2 Low‐income setting | 0 | 0 | Risk Ratio (M‐H, Random, 95% CI) | 0.0 [0.0, 0.0] |
| 30 Birthweight Show forest plot | 1 | 1512 | Mean Difference (IV, Random, 95% CI) | ‐67.0 [‐114.13, ‐19.87] |
| 30.1 High‐income setting | 1 | 1512 | Mean Difference (IV, Random, 95% CI) | ‐67.0 [‐114.13, ‐19.87] |
| 30.2 Low‐income setting | 0 | 0 | Mean Difference (IV, Random, 95% CI) | 0.0 [0.0, 0.0] |
| 31 Neonatal encephalopathy assessed using Sarnat staging (Sarnat 1976; Table 1). | 0 | 0 | Risk Ratio (M‐H, Random, 95% CI) | 0.0 [0.0, 0.0] |
| 31.1 High‐income setting | 0 | 0 | Risk Ratio (M‐H, Random, 95% CI) | 0.0 [0.0, 0.0] |
| 31.2 Low‐income setting | 0 | 0 | Risk Ratio (M‐H, Random, 95% CI) | 0.0 [0.0, 0.0] |
| 32 Neonatal mortality | 0 | 0 | Risk Ratio (M‐H, Random, 95% CI) | 0.0 [0.0, 0.0] |
| 32.1 High‐income setting | 0 | 0 | Risk Ratio (M‐H, Random, 95% CI) | 0.0 [0.0, 0.0] |
| 32.2 Low‐income setting | 0 | 0 | Risk Ratio (M‐H, Random, 95% CI) | 0.0 [0.0, 0.0] |
| 33 Intraventricular haemorrhage ‐ Papille grade III/IV ‐ (for infants born before 34 weeks' gestation only). | 0 | 0 | Risk Ratio (M‐H, Random, 95% CI) | 0.0 [0.0, 0.0] |
| 33.1 High‐income setting | 0 | 0 | Risk Ratio (M‐H, Random, 95% CI) | 0.0 [0.0, 0.0] |
| 33.2 Low‐income setting | 0 | 0 | Risk Ratio (M‐H, Random, 95% CI) | 0.0 [0.0, 0.0] |
| 34 Number of infants exposed to one or more red blood cell transfusions | 0 | 0 | Risk Ratio (M‐H, Random, 95% CI) | 0.0 [0.0, 0.0] |
| 34.1 High‐income setting | 0 | 0 | Risk Ratio (M‐H, Random, 95% CI) | 0.0 [0.0, 0.0] |
| 34.2 Low‐income setting | 0 | 0 | Risk Ratio (M‐H, Random, 95% CI) | 0.0 [0.0, 0.0] |
| 35 Infant Hb level at 24 to 72 hours | 0 | 0 | Mean Difference (IV, Random, 95% CI) | 0.0 [0.0, 0.0] |
| 35.1 High‐income setting | 0 | 0 | Mean Difference (IV, Random, 95% CI) | 0.0 [0.0, 0.0] |
| 35.2 Low‐income setting | 0 | 0 | Mean Difference (IV, Random, 95% CI) | 0.0 [0.0, 0.0] |
| 36 Infant Hb level at 3‐6 months | 0 | 0 | Mean Difference (IV, Random, 95% CI) | 0.0 [0.0, 0.0] |
| 36.1 High‐income setting | 0 | 0 | Mean Difference (IV, Random, 95% CI) | 0.0 [0.0, 0.0] |
| 36.2 Low‐income setting | 0 | 0 | Mean Difference (IV, Random, 95% CI) | 0.0 [0.0, 0.0] |
| 37 Infant iron indices (ferritin) at 3 to 6 months. | 0 | 0 | Risk Ratio (M‐H, Random, 95% CI) | 0.0 [0.0, 0.0] |
| 37.1 High‐income setting | 0 | 0 | Risk Ratio (M‐H, Random, 95% CI) | 0.0 [0.0, 0.0] |
| 37.2 Low‐income setting | 0 | 0 | Risk Ratio (M‐H, Random, 95% CI) | 0.0 [0.0, 0.0] |
| 38 Exclusive breastfeeding at discharge from hospital | 0 | 0 | Risk Ratio (M‐H, Random, 95% CI) | 0.0 [0.0, 0.0] |
| 38.1 High‐income setting | 0 | 0 | Risk Ratio (M‐H, Random, 95% CI) | 0.0 [0.0, 0.0] |
| 38.2 Low‐income setting | 0 | 0 | Risk Ratio (M‐H, Random, 95% CI) | 0.0 [0.0, 0.0] |
| 39 Neurodevelopmental, cognitive or developmental outcomes assessed after age 18 months. | 0 | 0 | Risk Ratio (M‐H, Random, 95% CI) | 0.0 [0.0, 0.0] |
| 39.1 High‐income setting | 0 | 0 | Risk Ratio (M‐H, Random, 95% CI) | 0.0 [0.0, 0.0] |
| 39.2 Low‐income setting | 0 | 0 | Risk Ratio (M‐H, Random, 95% CI) | 0.0 [0.0, 0.0] |
| 40 Return to hospital as in‐ or outpatient because of bleeding (not pre‐specified) Show forest plot | 2 | 2941 | Risk Ratio (M‐H, Random, 95% CI) | 2.21 [1.29, 3.79] |
| 40.1 High‐income setting | 2 | 2941 | Risk Ratio (M‐H, Random, 95% CI) | 2.21 [1.29, 3.79] |
| 40.2 Low‐income setting | 0 | 0 | Risk Ratio (M‐H, Random, 95% CI) | 0.0 [0.0, 0.0] |
| 41 Postnatal maternal mean Hb (outcome not pre‐specified) Show forest plot | 2 | 2683 | Mean Difference (IV, Random, 95% CI) | 0.5 [0.41, 0.59] |
| 41.1 High‐income setting | 2 | 2683 | Mean Difference (IV, Random, 95% CI) | 0.5 [0.41, 0.59] |
| 41.2 Low‐income setting | 0 | 0 | Mean Difference (IV, Random, 95% CI) | 0.0 [0.0, 0.0] |
| Outcome or subgroup title | No. of studies | No. of participants | Statistical method | Effect size |
| 1 Severe primary PPH at time of birth (clinically estimated or measured blood loss ≥ 1000 mL) | 0 | 0 | Risk Ratio (M‐H, Random, 95% CI) | 0.0 [0.0, 0.0] |
| 1.1 High‐income setting | 0 | 0 | Risk Ratio (M‐H, Random, 95% CI) | 0.0 [0.0, 0.0] |
| 1.2 Low‐income setting | 0 | 0 | Risk Ratio (M‐H, Random, 95% CI) | 0.0 [0.0, 0.0] |
| 2 Very severe primary PPH at time of birth (clinically estimated or measured blood loss ≥ 2500 mL) | 0 | 0 | Risk Ratio (M‐H, Random, 95% CI) | 0.0 [0.0, 0.0] |
| 2.1 High‐income setting | 0 | 0 | Risk Ratio (M‐H, Random, 95% CI) | 0.0 [0.0, 0.0] |
| 2.2 Low‐income setting | 0 | 0 | Risk Ratio (M‐H, Random, 95% CI) | 0.0 [0.0, 0.0] |
| 3 Maternal mortality | 0 | 0 | Risk Ratio (M‐H, Random, 95% CI) | 0.0 [0.0, 0.0] |
| 3.1 High‐income setting | 0 | 0 | Risk Ratio (M‐H, Random, 95% CI) | 0.0 [0.0, 0.0] |
| 3.2 Low‐income setting | 0 | 0 | Risk Ratio (M‐H, Random, 95% CI) | 0.0 [0.0, 0.0] |
| 4 Maternal Hb < 9 g/dL at 24‐72 hr | 0 | 0 | Risk Ratio (M‐H, Random, 95% CI) | 0.0 [0.0, 0.0] |
| 4.1 High‐income setting | 0 | 0 | Risk Ratio (M‐H, Random, 95% CI) | 0.0 [0.0, 0.0] |
| 4.2 Low‐income setting | 0 | 0 | Risk Ratio (M‐H, Random, 95% CI) | 0.0 [0.0, 0.0] |
| 5 Admission to neonatal special/intensive care | 0 | 0 | Risk Ratio (M‐H, Random, 95% CI) | 0.0 [0.0, 0.0] |
| 5.1 High‐income setting | 0 | 0 | Risk Ratio (M‐H, Random, 95% CI) | 0.0 [0.0, 0.0] |
| 5.2 Low‐income setting | 0 | 0 | Risk Ratio (M‐H, Random, 95% CI) | 0.0 [0.0, 0.0] |
| 6 Neonatal jaundice requiring phototherapy or exchange transfusion | 0 | 0 | Risk Ratio (M‐H, Random, 95% CI) | 0.0 [0.0, 0.0] |
| 6.1 High‐income setting | 0 | 0 | Risk Ratio (M‐H, Random, 95% CI) | 0.0 [0.0, 0.0] |
| 6.2 Low‐income setting | 0 | 0 | Risk Ratio (M‐H, Random, 95% CI) | 0.0 [0.0, 0.0] |
| 7 Neonatal polycythaemia treated with dilutional exchange transfusion | 0 | 0 | Risk Ratio (M‐H, Random, 95% CI) | 0.0 [0.0, 0.0] |
| 7.1 High‐income setting | 0 | 0 | Risk Ratio (M‐H, Random, 95% CI) | 0.0 [0.0, 0.0] |
| 7.2 Low‐income setting | 0 | 0 | Risk Ratio (M‐H, Random, 95% CI) | 0.0 [0.0, 0.0] |
| Outcome or subgroup title | No. of studies | No. of participants | Statistical method | Effect size |
| 1 Severe primary PPH at time of birth (clinically estimated or measured blood loss ≥ 1000 mL) Show forest plot | 1 | 1648 | Risk Ratio (M‐H, Random, 95% CI) | 0.23 [0.09, 0.55] |
| 1.1 High‐income setting | 1 | 1648 | Risk Ratio (M‐H, Random, 95% CI) | 0.23 [0.09, 0.55] |
| 1.2 Low‐income setting | 0 | 0 | Risk Ratio (M‐H, Random, 95% CI) | 0.0 [0.0, 0.0] |
| 2 Very severe primary PPH at time of birth (clinically estimated or measured blood loss ≥ 2500 mL) | 0 | 0 | Risk Ratio (M‐H, Random, 95% CI) | 0.0 [0.0, 0.0] |
| 2.1 High‐income setting | 0 | 0 | Risk Ratio (M‐H, Random, 95% CI) | 0.0 [0.0, 0.0] |
| 2.2 Low‐income setting | 0 | 0 | Risk Ratio (M‐H, Random, 95% CI) | 0.0 [0.0, 0.0] |
| 3 Maternal mortality | 0 | 0 | Risk Ratio (M‐H, Random, 95% CI) | 0.0 [0.0, 0.0] |
| 3.1 High‐income setting | 0 | 0 | Risk Ratio (M‐H, Random, 95% CI) | 0.0 [0.0, 0.0] |
| 3.2 Low‐income setting | 0 | 0 | Risk Ratio (M‐H, Random, 95% CI) | 0.0 [0.0, 0.0] |
| 4 Maternal Hb < 9 g/dL at 24‐72 hr | 0 | 0 | Risk Ratio (M‐H, Random, 95% CI) | 0.0 [0.0, 0.0] |
| 4.1 High‐income setting | 0 | 0 | Risk Ratio (M‐H, Random, 95% CI) | 0.0 [0.0, 0.0] |
| 4.2 Low‐income setting | 0 | 0 | Risk Ratio (M‐H, Random, 95% CI) | 0.0 [0.0, 0.0] |
| 5 Admission to neonatal special/intensive care | 0 | 0 | Risk Ratio (M‐H, Random, 95% CI) | 0.0 [0.0, 0.0] |
| 5.1 High‐income setting | 0 | 0 | Risk Ratio (M‐H, Random, 95% CI) | 0.0 [0.0, 0.0] |
| 5.2 Low‐income setting | 0 | 0 | Risk Ratio (M‐H, Random, 95% CI) | 0.0 [0.0, 0.0] |
| 6 Neonatal jaundice requiring phototherapy or exchange transfusion | 0 | 0 | Risk Ratio (M‐H, Random, 95% CI) | 0.0 [0.0, 0.0] |
| 6.1 High‐income setting | 0 | 0 | Risk Ratio (M‐H, Random, 95% CI) | 0.0 [0.0, 0.0] |
| 6.2 Low‐income setting | 0 | 0 | Risk Ratio (M‐H, Random, 95% CI) | 0.0 [0.0, 0.0] |
| 7 Neonatal polycythaemia treated with dilutional exchange transfusion | 0 | 0 | Risk Ratio (M‐H, Random, 95% CI) | 0.0 [0.0, 0.0] |
| 7.1 High‐income setting | 0 | 0 | Risk Ratio (M‐H, Random, 95% CI) | 0.0 [0.0, 0.0] |
| 7.2 Low‐income setting | 0 | 0 | Risk Ratio (M‐H, Random, 95% CI) | 0.0 [0.0, 0.0] |
| 8 Severe primary PPH after placental delivery and up to 24 hours (clinically estimated or measured blood loss ≥ 1000 mL) | 0 | 0 | Risk Ratio (M‐H, Random, 95% CI) | 0.0 [0.0, 0.0] |
| 8.1 High‐income setting | 0 | 0 | Risk Ratio (M‐H, Random, 95% CI) | 0.0 [0.0, 0.0] |
| 8.2 Low‐income setting | 0 | 0 | Risk Ratio (M‐H, Random, 95% CI) | 0.0 [0.0, 0.0] |
| 9 Severe primary PPH at time of birth and up to 24 hours (clinically estimated or measured blood loss ≥1000 mL) | 0 | 0 | Risk Ratio (M‐H, Random, 95% CI) | 0.0 [0.0, 0.0] |
| 9.1 High‐income setting | 0 | 0 | Risk Ratio (M‐H, Random, 95% CI) | 0.0 [0.0, 0.0] |
| 9.2 Low‐income setting | 0 | 0 | Risk Ratio (M‐H, Random, 95% CI) | 0.0 [0.0, 0.0] |
| 10 Primary blood loss ≥ 500 mL at time of birth (clinically estimated or measured) Show forest plot | 1 | 1648 | Risk Ratio (M‐H, Random, 95% CI) | 0.53 [0.38, 0.74] |
| 10.1 High‐income setting | 1 | 1648 | Risk Ratio (M‐H, Random, 95% CI) | 0.53 [0.38, 0.74] |
| 10.2 Low‐income setting | 0 | 0 | Risk Ratio (M‐H, Random, 95% CI) | 0.0 [0.0, 0.0] |
| 11 Primary blood loss ≥ 500 mL after delivery of placenta and up to 24 hours (clinically estimated or measured) | 0 | 0 | Risk Ratio (M‐H, Random, 95% CI) | 0.0 [0.0, 0.0] |
| 11.1 High‐income setting | 0 | 0 | Risk Ratio (M‐H, Random, 95% CI) | 0.0 [0.0, 0.0] |
| 11.2 Low‐income setting | 0 | 0 | Risk Ratio (M‐H, Random, 95% CI) | 0.0 [0.0, 0.0] |
| 12 Primary blood loss ≥ 500 mL at time of birth and up to 24 hours (clinically estimated or measured) | 0 | 0 | Risk Ratio (M‐H, Random, 95% CI) | 0.0 [0.0, 0.0] |
| 12.1 High‐income setting | 0 | 0 | Risk Ratio (M‐H, Random, 95% CI) | 0.0 [0.0, 0.0] |
| 12.2 Low‐income setting | 0 | 0 | Risk Ratio (M‐H, Random, 95% CI) | 0.0 [0.0, 0.0] |
| 13 Mean maternal blood loss (mL) at time of birth (clinically estimated or measured) | 0 | 0 | Mean Difference (IV, Random, 95% CI) | 0.0 [0.0, 0.0] |
| 13.1 High‐income setting | 0 | 0 | Mean Difference (IV, Random, 95% CI) | 0.0 [0.0, 0.0] |
| 13.2 Low‐income setting | 0 | 0 | Mean Difference (IV, Random, 95% CI) | 0.0 [0.0, 0.0] |
| 14 Mean maternal blood loss (mL) after delivery of placenta and up to 24 hours (clinically estimated or measured) | 0 | 0 | Mean Difference (IV, Random, 95% CI) | 0.0 [0.0, 0.0] |
| 14.1 High‐income setting | 0 | 0 | Mean Difference (IV, Random, 95% CI) | 0.0 [0.0, 0.0] |
| 14.2 Low‐income setting | 0 | 0 | Mean Difference (IV, Random, 95% CI) | 0.0 [0.0, 0.0] |
| 15 Mean maternal blood loss (mL) at time of birth and up to 24 hours (clinically estimated or measured) | 0 | 0 | Mean Difference (IV, Random, 95% CI) | 0.0 [0.0, 0.0] |
| 15.1 High‐income setting | 0 | 0 | Mean Difference (IV, Random, 95% CI) | 0.0 [0.0, 0.0] |
| 15.2 Low‐income setting | 0 | 0 | Mean Difference (IV, Random, 95% CI) | 0.0 [0.0, 0.0] |
| 16 Maternal blood transfusion Show forest plot | 1 | 1648 | Risk Ratio (M‐H, Random, 95% CI) | 0.25 [0.03, 2.22] |
| 16.1 High‐income setting | 1 | 1648 | Risk Ratio (M‐H, Random, 95% CI) | 0.25 [0.03, 2.22] |
| 16.2 Low‐income setting | 0 | 0 | Risk Ratio (M‐H, Random, 95% CI) | 0.0 [0.0, 0.0] |
| 17 Clinical signs of severe blood loss Show forest plot | 1 | 1648 | Risk Ratio (M‐H, Random, 95% CI) | 0.25 [0.05, 1.17] |
| 17.1 High‐income setting | 1 | 1648 | Risk Ratio (M‐H, Random, 95% CI) | 0.25 [0.05, 1.17] |
| 17.2 Low‐income setting | 0 | 0 | Risk Ratio (M‐H, Random, 95% CI) | 0.0 [0.0, 0.0] |
| 18 Therapeutic uterotonics during third stage and/or within 24 hours Show forest plot | 1 | 1648 | Risk Ratio (M‐H, Random, 95% CI) | 0.45 [0.26, 0.77] |
| 18.1 High‐income setting | 1 | 1648 | Risk Ratio (M‐H, Random, 95% CI) | 0.45 [0.26, 0.77] |
| 18.2 Low‐income setting | 0 | 0 | Risk Ratio (M‐H, Random, 95% CI) | 0.0 [0.0, 0.0] |
| 19 Mean length of third stage Show forest plot | 1 | 1648 | Mean Difference (IV, Random, 95% CI) | ‐10.0 [‐10.24, ‐9.76] |
| 19.1 High‐income setting | 1 | 1648 | Mean Difference (IV, Random, 95% CI) | ‐10.0 [‐10.24, ‐9.76] |
| 19.2 Low‐income setting | 0 | 0 | Mean Difference (IV, Random, 95% CI) | 0.0 [0.0, 0.0] |
| 20 Manual removal of placenta as defined by authors | 0 | 0 | Risk Ratio (M‐H, Random, 95% CI) | 0.0 [0.0, 0.0] |
| 20.1 High‐income setting | 0 | 0 | Risk Ratio (M‐H, Random, 95% CI) | 0.0 [0.0, 0.0] |
| 20.2 Low‐income setting | 0 | 0 | Risk Ratio (M‐H, Random, 95% CI) | 0.0 [0.0, 0.0] |
| 21 Postnatal diastolic blood pressure > 90 mmHg between birth of baby and discharge from the labour ward. | 0 | 0 | Risk Ratio (M‐H, Random, 95% CI) | 0.0 [0.0, 0.0] |
| 21.1 High‐income setting | 0 | 0 | Risk Ratio (M‐H, Random, 95% CI) | 0.0 [0.0, 0.0] |
| 21.2 Low‐income setting | 0 | 0 | Risk Ratio (M‐H, Random, 95% CI) | 0.0 [0.0, 0.0] |
| 22 Postnatal vomiting between birth of baby and discharge from the labour ward | 0 | 0 | Risk Ratio (M‐H, Random, 95% CI) | 0.0 [0.0, 0.0] |
| 22.1 High‐income setting | 0 | 0 | Risk Ratio (M‐H, Random, 95% CI) | 0.0 [0.0, 0.0] |
| 22.2 Low‐income setting | 0 | 0 | Risk Ratio (M‐H, Random, 95% CI) | 0.0 [0.0, 0.0] |
| 23 Any analgesia between birth of the baby and discharge from labour ward | 0 | 0 | Risk Ratio (M‐H, Random, 95% CI) | 0.0 [0.0, 0.0] |
| 23.1 High‐income setting | 0 | 0 | Risk Ratio (M‐H, Random, 95% CI) | 0.0 [0.0, 0.0] |
| 23.2 Low‐income setting | 0 | 0 | Risk Ratio (M‐H, Random, 95% CI) | 0.0 [0.0, 0.0] |
| 24 Women's assessment of pain during third stage as reported by authors | 0 | 0 | Risk Ratio (M‐H, Random, 95% CI) | 0.0 [0.0, 0.0] |
| 24.1 High‐income setting | 0 | 0 | Risk Ratio (M‐H, Random, 95% CI) | 0.0 [0.0, 0.0] |
| 24.2 Low‐income setting | 0 | 0 | Risk Ratio (M‐H, Random, 95% CI) | 0.0 [0.0, 0.0] |
| 25 Secondary blood loss/any vaginal bleeding needing treatment (after 24 hours and up to 6 weeks) | 0 | 0 | Risk Ratio (M‐H, Random, 95% CI) | 0.0 [0.0, 0.0] |
| 25.1 High‐income setting | 0 | 0 | Risk Ratio (M‐H, Random, 95% CI) | 0.0 [0.0, 0.0] |
| 25.2 Low‐income setting | 0 | 0 | Risk Ratio (M‐H, Random, 95% CI) | 0.0 [0.0, 0.0] |
| 26 Amount of lochia either estimated or measured after 24 hours and up to discharge from hospital | 0 | 0 | Mean Difference (IV, Random, 95% CI) | 0.0 [0.0, 0.0] |
| 26.1 High‐income setting | 0 | 0 | Mean Difference (IV, Random, 95% CI) | 0.0 [0.0, 0.0] |
| 26.2 Low‐income setting | 0 | 0 | Mean Difference (IV, Random, 95% CI) | 0.0 [0.0, 0.0] |
| 27 Surgical evacuation of retained products of conception | 0 | 0 | Risk Ratio (M‐H, Random, 95% CI) | 0.0 [0.0, 0.0] |
| 27.1 High‐income setting | 0 | 0 | Risk Ratio (M‐H, Random, 95% CI) | 0.0 [0.0, 0.0] |
| 27.2 Low‐income setting | 0 | 0 | Risk Ratio (M‐H, Random, 95% CI) | 0.0 [0.0, 0.0] |
| 28 Afterpains ‐ abdominal pain associated with the contracting uterus in the postpartum period | 0 | 0 | Risk Ratio (M‐H, Random, 95% CI) | 0.0 [0.0, 0.0] |
| 28.1 High‐income setting | 0 | 0 | Risk Ratio (M‐H, Random, 95% CI) | 0.0 [0.0, 0.0] |
| 28.2 Low‐income setting | 0 | 0 | Risk Ratio (M‐H, Random, 95% CI) | 0.0 [0.0, 0.0] |
| 29 Apgar score < 7 at 5 minutes | 0 | 0 | Risk Ratio (M‐H, Random, 95% CI) | 0.0 [0.0, 0.0] |
| 29.1 High‐income setting | 0 | 0 | Risk Ratio (M‐H, Random, 95% CI) | 0.0 [0.0, 0.0] |
| 29.2 Low‐income setting | 0 | 0 | Risk Ratio (M‐H, Random, 95% CI) | 0.0 [0.0, 0.0] |
| 30 Birthweight | 0 | 0 | Mean Difference (IV, Random, 95% CI) | 0.0 [0.0, 0.0] |
| 30.1 High‐income setting | 0 | 0 | Mean Difference (IV, Random, 95% CI) | 0.0 [0.0, 0.0] |
| 30.2 Low‐income setting | 0 | 0 | Mean Difference (IV, Random, 95% CI) | 0.0 [0.0, 0.0] |
| 31 Neonatal encephalopathy assessed using Sarnat staging (Sarnat 1976; Table 1) | 0 | 0 | Risk Ratio (M‐H, Random, 95% CI) | 0.0 [0.0, 0.0] |
| 31.1 High‐income setting | 0 | 0 | Risk Ratio (M‐H, Random, 95% CI) | 0.0 [0.0, 0.0] |
| 31.2 Low‐income setting | 0 | 0 | Risk Ratio (M‐H, Random, 95% CI) | 0.0 [0.0, 0.0] |
| 32 Neonatal mortality | 0 | 0 | Risk Ratio (M‐H, Random, 95% CI) | 0.0 [0.0, 0.0] |
| 32.1 High‐income setting | 0 | 0 | Risk Ratio (M‐H, Random, 95% CI) | 0.0 [0.0, 0.0] |
| 32.2 Low‐income setting | 0 | 0 | Risk Ratio (M‐H, Random, 95% CI) | 0.0 [0.0, 0.0] |
| 33 Intraventricular haemorrhage ‐ Papille grade III/IV ‐ (for infants born before 34 weeks' gestation only). | 0 | 0 | Risk Ratio (M‐H, Random, 95% CI) | 0.0 [0.0, 0.0] |
| 33.1 High‐income setting | 0 | 0 | Risk Ratio (M‐H, Random, 95% CI) | 0.0 [0.0, 0.0] |
| 33.2 Low‐income setting | 0 | 0 | Risk Ratio (M‐H, Random, 95% CI) | 0.0 [0.0, 0.0] |
| 34 Number of infants who received a red blood cell transfusion. | 0 | 0 | Risk Ratio (M‐H, Random, 95% CI) | 0.0 [0.0, 0.0] |
| 34.1 High‐income setting | 0 | 0 | Risk Ratio (M‐H, Random, 95% CI) | 0.0 [0.0, 0.0] |
| 34.2 Low‐income setting | 0 | 0 | Risk Ratio (M‐H, Random, 95% CI) | 0.0 [0.0, 0.0] |
| 35 Infant Hb level at 24 to 72 hours | 0 | 0 | Mean Difference (IV, Random, 95% CI) | 0.0 [0.0, 0.0] |
| 35.1 High‐income setting | 0 | 0 | Mean Difference (IV, Random, 95% CI) | 0.0 [0.0, 0.0] |
| 35.2 Low‐income setting | 0 | 0 | Mean Difference (IV, Random, 95% CI) | 0.0 [0.0, 0.0] |
| 36 Infant Hb level at 3‐6 months | 0 | 0 | Mean Difference (IV, Random, 95% CI) | 0.0 [0.0, 0.0] |
| 36.1 High‐income setting | 0 | 0 | Mean Difference (IV, Random, 95% CI) | 0.0 [0.0, 0.0] |
| 36.2 Low‐income setting | 0 | 0 | Mean Difference (IV, Random, 95% CI) | 0.0 [0.0, 0.0] |
| 37 Infant iron indices (ferritin) at 3 to 6 months. | 0 | 0 | Risk Ratio (M‐H, Random, 95% CI) | 0.0 [0.0, 0.0] |
| 37.1 High‐income setting | 0 | 0 | Risk Ratio (M‐H, Random, 95% CI) | 0.0 [0.0, 0.0] |
| 37.2 Low‐income setting | 0 | 0 | Risk Ratio (M‐H, Random, 95% CI) | 0.0 [0.0, 0.0] |
| 38 Exclusive breastfeeding at discharge from hospital | 0 | 0 | Risk Ratio (M‐H, Random, 95% CI) | 0.0 [0.0, 0.0] |
| 38.1 High‐income setting | 0 | 0 | Risk Ratio (M‐H, Random, 95% CI) | 0.0 [0.0, 0.0] |
| 38.2 Low‐income setting | 0 | 0 | Risk Ratio (M‐H, Random, 95% CI) | 0.0 [0.0, 0.0] |
| 39 Neurodevelopmental, cognitive or developmental outcomes assessed after age 18 months. | 0 | 0 | Risk Ratio (M‐H, Random, 95% CI) | 0.0 [0.0, 0.0] |
| 39.1 High‐income setting | 0 | 0 | Risk Ratio (M‐H, Random, 95% CI) | 0.0 [0.0, 0.0] |
| 39.2 Low‐income setting | 0 | 0 | Risk Ratio (M‐H, Random, 95% CI) | 0.0 [0.0, 0.0] |
| 40 Return to hospital as in‐ or outpatient because of bleeding (not pre‐specified) | 0 | 0 | Risk Ratio (M‐H, Random, 95% CI) | 0.0 [0.0, 0.0] |
| 40.1 High‐income setting | 0 | 0 | Risk Ratio (M‐H, Random, 95% CI) | 0.0 [0.0, 0.0] |
| 40.2 Low‐income setting | 0 | 0 | Risk Ratio (M‐H, Random, 95% CI) | 0.0 [0.0, 0.0] |
| 41 Postnatal maternal mean Hb (outcome not pre‐specified) | 0 | 0 | Mean Difference (IV, Random, 95% CI) | 0.0 [0.0, 0.0] |
| 41.1 High‐income setting | 0 | 0 | Mean Difference (IV, Random, 95% CI) | 0.0 [0.0, 0.0] |
| 41.2 Low‐income setting | 0 | 0 | Mean Difference (IV, Random, 95% CI) | 0.0 [0.0, 0.0] |
| Outcome or subgroup title | No. of studies | No. of participants | Statistical method | Effect size |
| 1 Severe primary PPH at time of birth (clinically estimated or measured blood loss ≥ 1000 mL) Show forest plot | 1 | 1621 | Risk Ratio (M‐H, Random, 95% CI) | 0.78 [0.48, 1.24] |
| 1.1 High‐income setting | 1 | 1621 | Risk Ratio (M‐H, Random, 95% CI) | 0.78 [0.48, 1.24] |
| 1.2 Low‐income setting | 0 | 0 | Risk Ratio (M‐H, Random, 95% CI) | 0.0 [0.0, 0.0] |
| 2 Very severe primary PPH at time of birth (clinically estimated or measured blood loss ≥ 2500 mL) | 0 | 0 | Risk Ratio (M‐H, Random, 95% CI) | 0.0 [0.0, 0.0] |
| 2.1 High‐income setting | 0 | 0 | Risk Ratio (M‐H, Random, 95% CI) | 0.0 [0.0, 0.0] |
| 2.2 Low‐income setting | 0 | 0 | Risk Ratio (M‐H, Random, 95% CI) | 0.0 [0.0, 0.0] |
| 3 Maternal mortality | 0 | 0 | Risk Ratio (M‐H, Random, 95% CI) | 0.0 [0.0, 0.0] |
| 3.1 High‐income setting | 0 | 0 | Risk Ratio (M‐H, Random, 95% CI) | 0.0 [0.0, 0.0] |
| 3.2 Low‐income setting | 0 | 0 | Risk Ratio (M‐H, Random, 95% CI) | 0.0 [0.0, 0.0] |
| 4 Maternal Hb < 9 g/dL at 24‐72 hr Show forest plot | 1 | 1631 | Risk Ratio (M‐H, Random, 95% CI) | 1.23 [0.75, 2.01] |
| 4.1 High‐income setting | 1 | 1631 | Risk Ratio (M‐H, Random, 95% CI) | 1.23 [0.75, 2.01] |
| 4.2 Low‐income setting | 0 | 0 | Risk Ratio (M‐H, Random, 95% CI) | 0.0 [0.0, 0.0] |
| 5 Admission to neonatal special/intensive care | 0 | 0 | Risk Ratio (M‐H, Random, 95% CI) | 0.0 [0.0, 0.0] |
| 5.1 High‐income setting | 0 | 0 | Risk Ratio (M‐H, Random, 95% CI) | 0.0 [0.0, 0.0] |
| 5.2 Low‐income setting | 0 | 0 | Risk Ratio (M‐H, Random, 95% CI) | 0.0 [0.0, 0.0] |
| 6 Neonatal jaundice requiring phototherapy or exchange transfusion | 0 | 0 | Risk Ratio (M‐H, Random, 95% CI) | 0.0 [0.0, 0.0] |
| 6.1 High‐income setting | 0 | 0 | Risk Ratio (M‐H, Random, 95% CI) | 0.0 [0.0, 0.0] |
| 6.2 Low‐income setting | 0 | 0 | Risk Ratio (M‐H, Random, 95% CI) | 0.0 [0.0, 0.0] |
| 7 Neonatal polycythaemia treated with dilutional exchange transfusion | 0 | 0 | Risk Ratio (M‐H, Random, 95% CI) | 0.0 [0.0, 0.0] |
| 7.1 High‐income setting | 0 | 0 | Risk Ratio (M‐H, Random, 95% CI) | 0.0 [0.0, 0.0] |
| 7.2 Low‐income setting | 0 | 0 | Risk Ratio (M‐H, Random, 95% CI) | 0.0 [0.0, 0.0] |
| 8 Severe primary PPH after placental delivery and up to 24 hours (clinically estimated or measured blood loss ≥ 1000 mL) | 0 | 0 | Risk Ratio (M‐H, Random, 95% CI) | 0.0 [0.0, 0.0] |
| 8.1 High‐income setting | 0 | 0 | Risk Ratio (M‐H, Random, 95% CI) | 0.0 [0.0, 0.0] |
| 8.2 Low‐income setting | 0 | 0 | Risk Ratio (M‐H, Random, 95% CI) | 0.0 [0.0, 0.0] |
| 9 Severe primary PPH at time of birth and up to 24 hours (clinically estimated or measured blood loss ≥1000 mL) | 0 | 0 | Risk Ratio (M‐H, Random, 95% CI) | 0.0 [0.0, 0.0] |
| 9.1 High‐income setting | 0 | 0 | Risk Ratio (M‐H, Random, 95% CI) | 0.0 [0.0, 0.0] |
| 9.2 Low‐income setting | 0 | 0 | Risk Ratio (M‐H, Random, 95% CI) | 0.0 [0.0, 0.0] |
| 10 Primary blood loss ≥ 500 mL at time of birth (clinically estimated or measured) Show forest plot | 1 | 1621 | Risk Ratio (M‐H, Random, 95% CI) | 0.51 [0.40, 0.66] |
| 10.1 High‐income setting | 1 | 1621 | Risk Ratio (M‐H, Random, 95% CI) | 0.51 [0.40, 0.66] |
| 10.2 Low‐income setting | 0 | 0 | Risk Ratio (M‐H, Random, 95% CI) | 0.0 [0.0, 0.0] |
| 11 Primary blood loss ≥ 500 mL after delivery of placenta and up to 24 hours (clinically estimated or measured) | 0 | 0 | Risk Ratio (M‐H, Random, 95% CI) | 0.0 [0.0, 0.0] |
| 11.1 High‐income setting | 0 | 0 | Risk Ratio (M‐H, Random, 95% CI) | 0.0 [0.0, 0.0] |
| 11.2 Low‐income setting | 0 | 0 | Risk Ratio (M‐H, Random, 95% CI) | 0.0 [0.0, 0.0] |
| 12 Primary blood loss ≥ 500 mL at time of birth and up to 24 hours (clinically estimated or measured) | 0 | 0 | Risk Ratio (M‐H, Random, 95% CI) | 0.0 [0.0, 0.0] |
| 12.1 High‐income setting | 0 | 0 | Risk Ratio (M‐H, Random, 95% CI) | 0.0 [0.0, 0.0] |
| 12.2 Low‐income setting | 0 | 0 | Risk Ratio (M‐H, Random, 95% CI) | 0.0 [0.0, 0.0] |
| 13 Mean maternal blood loss (mL) at time of birth (clinically estimated or measured) Show forest plot | 1 | 1621 | Mean Difference (IV, Random, 95% CI) | ‐94.0 [‐126.57, ‐61.43] |
| 13.1 High‐income setting | 1 | 1621 | Mean Difference (IV, Random, 95% CI) | ‐94.0 [‐126.57, ‐61.43] |
| 13.2 Low‐income setting | 0 | 0 | Mean Difference (IV, Random, 95% CI) | 0.0 [0.0, 0.0] |
| 14 Mean maternal blood loss (mL) after delivery of placenta and up to 24 hours (clinically estimated or measured) | 0 | 0 | Mean Difference (IV, Random, 95% CI) | 0.0 [0.0, 0.0] |
| 14.1 High‐income setting | 0 | 0 | Mean Difference (IV, Random, 95% CI) | 0.0 [0.0, 0.0] |
| 14.2 Low‐income setting | 0 | 0 | Mean Difference (IV, Random, 95% CI) | 0.0 [0.0, 0.0] |
| 15 Mean maternal blood loss (mL) at time of birth and up to 24 hours (clinically estimated or measured) | 0 | 0 | Mean Difference (IV, Random, 95% CI) | 0.0 [0.0, 0.0] |
| 15.1 High‐income setting | 0 | 0 | Mean Difference (IV, Random, 95% CI) | 0.0 [0.0, 0.0] |
| 15.2 Low‐income setting | 0 | 0 | Mean Difference (IV, Random, 95% CI) | 0.0 [0.0, 0.0] |
| 16 Maternal blood transfusion Show forest plot | 1 | 1631 | Risk Ratio (M‐H, Random, 95% CI) | 0.79 [0.43, 1.46] |
| 16.1 High‐income setting | 1 | 1631 | Risk Ratio (M‐H, Random, 95% CI) | 0.79 [0.43, 1.46] |
| 16.2 Low‐income setting | 0 | 0 | Risk Ratio (M‐H, Random, 95% CI) | 0.0 [0.0, 0.0] |
| 17 Clinical signs of severe blood loss | 0 | 0 | Risk Ratio (M‐H, Random, 95% CI) | 0.0 [0.0, 0.0] |
| 17.1 High‐income setting | 0 | 0 | Risk Ratio (M‐H, Random, 95% CI) | 0.0 [0.0, 0.0] |
| 17.2 Low‐income setting | 0 | 0 | Risk Ratio (M‐H, Random, 95% CI) | 0.0 [0.0, 0.0] |
| 18 Therapeutic uterotonics during third stage and/or within 24 hours Show forest plot | 1 | 1631 | Risk Ratio (M‐H, Random, 95% CI) | 0.39 [0.33, 0.48] |
| 18.1 High‐income setting | 1 | 1631 | Risk Ratio (M‐H, Random, 95% CI) | 0.39 [0.33, 0.48] |
| 18.2 Low‐income setting | 0 | 0 | Risk Ratio (M‐H, Random, 95% CI) | 0.0 [0.0, 0.0] |
| 19 Mean length of third stage Show forest plot | 1 | 1631 | Mean Difference (IV, Random, 95% CI) | ‐1.60 [‐3.08, ‐0.12] |
| 19.1 High‐income setting | 1 | 1631 | Mean Difference (IV, Random, 95% CI) | ‐1.60 [‐3.08, ‐0.12] |
| 19.2 Low‐income setting | 0 | 0 | Mean Difference (IV, Random, 95% CI) | 0.0 [0.0, 0.0] |
| 20 Manual removal of placenta as defined by authors Show forest plot | 1 | 1631 | Risk Ratio (M‐H, Random, 95% CI) | 1.25 [0.71, 2.21] |
| 20.1 High‐income setting | 1 | 1631 | Risk Ratio (M‐H, Random, 95% CI) | 1.25 [0.71, 2.21] |
| 20.2 Low‐income setting | 0 | 0 | Risk Ratio (M‐H, Random, 95% CI) | 0.0 [0.0, 0.0] |
| 21 Postnatal diastolic blood pressure > 90 mmHg between birth of baby and discharge from the labour ward. | 0 | 0 | Risk Ratio (M‐H, Random, 95% CI) | 0.0 [0.0, 0.0] |
| 21.1 High‐income setting | 0 | 0 | Risk Ratio (M‐H, Random, 95% CI) | 0.0 [0.0, 0.0] |
| 21.2 Low‐income setting | 0 | 0 | Risk Ratio (M‐H, Random, 95% CI) | 0.0 [0.0, 0.0] |
| 22 Postnatal vomiting between birth of baby and discharge from the labour ward | 0 | 0 | Risk Ratio (M‐H, Random, 95% CI) | 0.0 [0.0, 0.0] |
| 22.1 High‐income setting | 0 | 0 | Risk Ratio (M‐H, Random, 95% CI) | 0.0 [0.0, 0.0] |
| 22.2 Low‐income setting | 0 | 0 | Risk Ratio (M‐H, Random, 95% CI) | 0.0 [0.0, 0.0] |
| 23 Any analgesia between birth of the baby and discharge from labour ward | 0 | 0 | Risk Ratio (M‐H, Random, 95% CI) | 0.0 [0.0, 0.0] |
| 23.1 High‐income setting | 0 | 0 | Risk Ratio (M‐H, Random, 95% CI) | 0.0 [0.0, 0.0] |
| 23.2 Low‐income setting | 0 | 0 | Risk Ratio (M‐H, Random, 95% CI) | 0.0 [0.0, 0.0] |
| 24 Women's assessment of pain during third stage as reported by authors | 0 | 0 | Risk Ratio (M‐H, Random, 95% CI) | 0.0 [0.0, 0.0] |
| 24.1 High‐income setting | 0 | 0 | Risk Ratio (M‐H, Random, 95% CI) | 0.0 [0.0, 0.0] |
| 24.2 Low‐income setting | 0 | 0 | Risk Ratio (M‐H, Random, 95% CI) | 0.0 [0.0, 0.0] |
| 25 Secondary blood loss/any vaginal bleeding needing treatment (after 24 hours and up to 6 weeks) | 0 | 0 | Risk Ratio (M‐H, Random, 95% CI) | 0.0 [0.0, 0.0] |
| 25.1 High‐income setting | 0 | 0 | Risk Ratio (M‐H, Random, 95% CI) | 0.0 [0.0, 0.0] |
| 25.2 Low‐income setting | 0 | 0 | Risk Ratio (M‐H, Random, 95% CI) | 0.0 [0.0, 0.0] |
| 26 Amount of lochia either estimated or measured after 24 hours and up to discharge from hospital | 0 | 0 | Mean Difference (IV, Random, 95% CI) | 0.0 [0.0, 0.0] |
| 26.1 High‐income setting | 0 | 0 | Mean Difference (IV, Random, 95% CI) | 0.0 [0.0, 0.0] |
| 26.2 Low‐income setting | 0 | 0 | Mean Difference (IV, Random, 95% CI) | 0.0 [0.0, 0.0] |
| 27 Surgical evacuation of retained products of conception | 0 | 0 | Risk Ratio (M‐H, Random, 95% CI) | 0.0 [0.0, 0.0] |
| 27.1 High‐income setting | 0 | 0 | Risk Ratio (M‐H, Random, 95% CI) | 0.0 [0.0, 0.0] |
| 27.2 Low‐income setting | 0 | 0 | Risk Ratio (M‐H, Random, 95% CI) | 0.0 [0.0, 0.0] |
| 28 Not prespecified: afterpains at 2 hours after birth (id 20458) Show forest plot | 1 | 1425 | Mean Difference (IV, Fixed, 95% CI) | ‐2.80 [‐4.62, ‐0.98] |
| 28.1 High‐income setting | 1 | 1425 | Mean Difference (IV, Fixed, 95% CI) | ‐2.80 [‐4.62, ‐0.98] |
| 28.2 Low‐income setting | 0 | 0 | Mean Difference (IV, Fixed, 95% CI) | 0.0 [0.0, 0.0] |
| 29 Not pre‐specified: afterpains the day after birth (id 20458) Show forest plot | 1 | 1336 | Mean Difference (IV, Fixed, 95% CI) | ‐3.0 [‐5.33, ‐0.67] |
| 29.1 High‐income setting | 1 | 1336 | Mean Difference (IV, Fixed, 95% CI) | ‐3.0 [‐5.33, ‐0.67] |
| 29.2 Low‐income setting | 0 | 0 | Mean Difference (IV, Fixed, 95% CI) | 0.0 [0.0, 0.0] |
| 30 Apgar score < 7 at 5 minutes | 0 | 0 | Risk Ratio (M‐H, Random, 95% CI) | 0.0 [0.0, 0.0] |
| 30.1 High‐income setting | 0 | 0 | Risk Ratio (M‐H, Random, 95% CI) | 0.0 [0.0, 0.0] |
| 30.2 Low‐income setting | 0 | 0 | Risk Ratio (M‐H, Random, 95% CI) | 0.0 [0.0, 0.0] |
| 31 Birthweight Show forest plot | 1 | 1631 | Mean Difference (IV, Random, 95% CI) | 15.0 [‐28.88, 58.88] |
| 31.1 High‐income setting | 1 | 1631 | Mean Difference (IV, Random, 95% CI) | 15.0 [‐28.88, 58.88] |
| 31.2 Low‐income setting | 0 | 0 | Mean Difference (IV, Random, 95% CI) | 0.0 [0.0, 0.0] |
| 32 Neonatal encephalopathy assessed using Sarnat staging (Sarnat 1976; Table 1) | 0 | 0 | Risk Ratio (M‐H, Random, 95% CI) | 0.0 [0.0, 0.0] |
| 32.1 High‐income setting | 0 | 0 | Risk Ratio (M‐H, Random, 95% CI) | 0.0 [0.0, 0.0] |
| 32.2 Low‐income setting | 0 | 0 | Risk Ratio (M‐H, Random, 95% CI) | 0.0 [0.0, 0.0] |
| 33 Neonatal mortality | 0 | 0 | Risk Ratio (M‐H, Random, 95% CI) | 0.0 [0.0, 0.0] |
| 33.1 High‐income setting | 0 | 0 | Risk Ratio (M‐H, Random, 95% CI) | 0.0 [0.0, 0.0] |
| 33.2 Low‐income setting | 0 | 0 | Risk Ratio (M‐H, Random, 95% CI) | 0.0 [0.0, 0.0] |
| 34 Intraventricular haemorrhage ‐ Papille grade III/IV ‐ (for infants born before 34 weeks' gestation only). | 0 | 0 | Risk Ratio (M‐H, Random, 95% CI) | 0.0 [0.0, 0.0] |
| 34.1 High‐income setting | 0 | 0 | Risk Ratio (M‐H, Random, 95% CI) | 0.0 [0.0, 0.0] |
| 34.2 Low‐income setting | 0 | 0 | Risk Ratio (M‐H, Random, 95% CI) | 0.0 [0.0, 0.0] |
| 35 Number of infants who received a red blood cell transfusion. | 0 | 0 | Risk Ratio (M‐H, Random, 95% CI) | 0.0 [0.0, 0.0] |
| 35.1 High‐income setting | 0 | 0 | Risk Ratio (M‐H, Random, 95% CI) | 0.0 [0.0, 0.0] |
| 35.2 Low‐income setting | 0 | 0 | Risk Ratio (M‐H, Random, 95% CI) | 0.0 [0.0, 0.0] |
| 36 Infant Hb level at 24 to 72 hours | 0 | 0 | Mean Difference (IV, Random, 95% CI) | 0.0 [0.0, 0.0] |
| 36.1 High‐income setting | 0 | 0 | Mean Difference (IV, Random, 95% CI) | 0.0 [0.0, 0.0] |
| 36.2 Low‐income setting | 0 | 0 | Mean Difference (IV, Random, 95% CI) | 0.0 [0.0, 0.0] |
| 37 Infant Hb level at 3‐6 months | 0 | 0 | Mean Difference (IV, Random, 95% CI) | 0.0 [0.0, 0.0] |
| 37.1 High‐income setting | 0 | 0 | Mean Difference (IV, Random, 95% CI) | 0.0 [0.0, 0.0] |
| 37.2 Low‐income setting | 0 | 0 | Mean Difference (IV, Random, 95% CI) | 0.0 [0.0, 0.0] |
| 38 Infant iron indices (ferritin) at 3 to 6 months. | 0 | 0 | Risk Ratio (M‐H, Random, 95% CI) | 0.0 [0.0, 0.0] |
| 38.1 High‐income setting | 0 | 0 | Risk Ratio (M‐H, Random, 95% CI) | 0.0 [0.0, 0.0] |
| 38.2 Low‐income setting | 0 | 0 | Risk Ratio (M‐H, Random, 95% CI) | 0.0 [0.0, 0.0] |
| 39 Exclusive breastfeeding at discharge from hospital | 0 | 0 | Risk Ratio (M‐H, Random, 95% CI) | 0.0 [0.0, 0.0] |
| 39.1 High‐income setting | 0 | 0 | Risk Ratio (M‐H, Random, 95% CI) | 0.0 [0.0, 0.0] |
| 39.2 Low‐income setting | 0 | 0 | Risk Ratio (M‐H, Random, 95% CI) | 0.0 [0.0, 0.0] |
| 40 Neurodevelopmental, cognitive or developmental outcomes assessed after age 18 months. | 0 | 0 | Risk Ratio (M‐H, Random, 95% CI) | 0.0 [0.0, 0.0] |
| 40.1 High‐income setting | 0 | 0 | Risk Ratio (M‐H, Random, 95% CI) | 0.0 [0.0, 0.0] |
| 40.2 Low‐income setting | 0 | 0 | Risk Ratio (M‐H, Random, 95% CI) | 0.0 [0.0, 0.0] |
| 41 Return to hospital as in‐ or outpatient because of bleeding (not pre‐specified) | 0 | 0 | Risk Ratio (M‐H, Random, 95% CI) | 0.0 [0.0, 0.0] |
| 42 Postnatal maternal mean Hb (outcome not pre‐specified) Show forest plot | 1 | 1631 | Mean Difference (IV, Random, 95% CI) | 0.28 [0.14, 0.42] |
| 42.1 High‐income setting | 1 | 1631 | Mean Difference (IV, Random, 95% CI) | 0.28 [0.14, 0.42] |
| 42.2 Low‐income setting | 0 | 0 | Mean Difference (IV, Random, 95% CI) | 0.0 [0.0, 0.0] |
| 43 Severe primary PPH after placental delivery and up to 2 hours (clinically estimated or measured blood loss ≥ 1000 mL) ‐ not pre‐specified Show forest plot | 1 | 1621 | Risk Ratio (M‐H, Random, 95% CI) | 0.54 [0.39, 0.74] |
| 43.1 High‐income setting | 1 | 1621 | Risk Ratio (M‐H, Random, 95% CI) | 0.54 [0.39, 0.74] |
| 43.2 Low‐income setting | 0 | 0 | Risk Ratio (M‐H, Random, 95% CI) | 0.0 [0.0, 0.0] |
| 44 Severe primary PPH at time of birth and up to 2 hours (clinically estimated or measured blood loss ≥1000 mL) ‐ not pre‐specified Show forest plot | 1 | 1621 | Risk Ratio (M‐H, Random, 95% CI) | 0.60 [0.47, 0.78] |
| 44.1 High‐income setting | 1 | 1621 | Risk Ratio (M‐H, Random, 95% CI) | 0.60 [0.47, 0.78] |
| 44.2 Low‐income setting | 0 | 0 | Risk Ratio (M‐H, Random, 95% CI) | 0.0 [0.0, 0.0] |
| 45 Mean blood loss (mL) (clinically estimated or measured at birth and up to 2 hours (not pre‐specified) Show forest plot | 1 | 1621 | Mean Difference (IV, Random, 95% CI) | ‐49.0 [‐75.52, ‐22.48] |
| 45.1 High‐income setting | 1 | 1621 | Mean Difference (IV, Random, 95% CI) | ‐49.0 [‐75.52, ‐22.48] |
| 45.2 Low‐income setting | 0 | 0 | Mean Difference (IV, Random, 95% CI) | 0.0 [0.0, 0.0] |
| Outcome or subgroup title | No. of studies | No. of participants | Statistical method | Effect size |
| 1 Severe primary PPH at time of birth (clinically estimated or measured blood loss ≥ 1000 mL) | 0 | 0 | Risk Ratio (M‐H, Random, 95% CI) | 0.0 [0.0, 0.0] |
| 1.1 High‐income setting | 0 | 0 | Risk Ratio (M‐H, Random, 95% CI) | 0.0 [0.0, 0.0] |
| 1.2 Low‐income setting | 0 | 0 | Risk Ratio (M‐H, Random, 95% CI) | 0.0 [0.0, 0.0] |
| 2 Very severe primary PPH at time of birth (clinically estimated or measured blood loss ≥ 2500 mL) | 0 | 0 | Risk Ratio (M‐H, Random, 95% CI) | 0.0 [0.0, 0.0] |
| 2.1 High‐income setting | 0 | 0 | Risk Ratio (M‐H, Random, 95% CI) | 0.0 [0.0, 0.0] |
| 2.2 Low‐income setting | 0 | 0 | Risk Ratio (M‐H, Random, 95% CI) | 0.0 [0.0, 0.0] |
| 3 Maternal mortality | 0 | 0 | Risk Ratio (M‐H, Random, 95% CI) | 0.0 [0.0, 0.0] |
| 3.1 High‐income setting | 0 | 0 | Risk Ratio (M‐H, Random, 95% CI) | 0.0 [0.0, 0.0] |
| 3.2 Low‐income setting | 0 | 0 | Risk Ratio (M‐H, Random, 95% CI) | 0.0 [0.0, 0.0] |
| 4 Maternal Hb < 9 g/dL at 24‐72 hr Show forest plot | 1 | 130 | Risk Ratio (M‐H, Random, 95% CI) | 0.8 [0.34, 1.90] |
| 4.1 High‐income setting | 0 | 0 | Risk Ratio (M‐H, Random, 95% CI) | 0.0 [0.0, 0.0] |
| 4.2 Low‐income setting | 1 | 130 | Risk Ratio (M‐H, Random, 95% CI) | 0.8 [0.34, 1.90] |
| 5 Admission to neonatal special/intensive care | 0 | 0 | Risk Ratio (M‐H, Random, 95% CI) | 0.0 [0.0, 0.0] |
| 5.1 High‐income setting | 0 | 0 | Risk Ratio (M‐H, Random, 95% CI) | 0.0 [0.0, 0.0] |
| 5.2 Low‐income setting | 0 | 0 | Risk Ratio (M‐H, Random, 95% CI) | 0.0 [0.0, 0.0] |
| 6 Neonatal jaundice requiring phototherapy or exchange transfusion | 0 | 0 | Risk Ratio (M‐H, Random, 95% CI) | 0.0 [0.0, 0.0] |
| 6.1 High‐income setting | 0 | 0 | Risk Ratio (M‐H, Random, 95% CI) | 0.0 [0.0, 0.0] |
| 6.2 Low‐income setting | 0 | 0 | Risk Ratio (M‐H, Random, 95% CI) | 0.0 [0.0, 0.0] |
| 7 Neonatal polycythaemia treated with dilutional exchange transfusion | 0 | 0 | Risk Ratio (M‐H, Random, 95% CI) | 0.0 [0.0, 0.0] |
| 7.1 High‐income setting | 0 | 0 | Risk Ratio (M‐H, Random, 95% CI) | 0.0 [0.0, 0.0] |
| 7.2 Low‐income setting | 0 | 0 | Risk Ratio (M‐H, Random, 95% CI) | 0.0 [0.0, 0.0] |
| 8 Severe primary PPH after placental delivery and up to 24 hours (clinically estimated or measured blood loss ≥ 1000 mL) | 0 | 0 | Risk Ratio (M‐H, Random, 95% CI) | 0.0 [0.0, 0.0] |
| 8.1 High‐income setting | 0 | 0 | Risk Ratio (M‐H, Random, 95% CI) | 0.0 [0.0, 0.0] |
| 8.2 Low‐income setting | 0 | 0 | Risk Ratio (M‐H, Random, 95% CI) | 0.0 [0.0, 0.0] |
| 9 Severe primary PPH at time of birth and up to 24 hours (clinically estimated or measured blood loss ≥1000 mL) | 0 | 0 | Risk Ratio (M‐H, Random, 95% CI) | 0.0 [0.0, 0.0] |
| 9.1 High‐income setting | 0 | 0 | Risk Ratio (M‐H, Random, 95% CI) | 0.0 [0.0, 0.0] |
| 9.2 Low‐income setting | 0 | 0 | Risk Ratio (M‐H, Random, 95% CI) | 0.0 [0.0, 0.0] |
| 10 Primary blood loss ≥ 500 mL at time of birth (clinically estimated or measured) | 0 | 0 | Risk Ratio (M‐H, Random, 95% CI) | 0.0 [0.0, 0.0] |
| 10.1 High‐income setting | 0 | 0 | Risk Ratio (M‐H, Random, 95% CI) | 0.0 [0.0, 0.0] |
| 10.2 Low‐income setting | 0 | 0 | Risk Ratio (M‐H, Random, 95% CI) | 0.0 [0.0, 0.0] |
| 11 Primary blood loss ≥ 500 mL after delivery of placenta and up to 24 hours (clinically estimated or measured) | 0 | 0 | Risk Ratio (M‐H, Random, 95% CI) | 0.0 [0.0, 0.0] |
| 11.1 High‐income setting | 0 | 0 | Risk Ratio (M‐H, Random, 95% CI) | 0.0 [0.0, 0.0] |
| 11.2 Low‐income setting | 0 | 0 | Risk Ratio (M‐H, Random, 95% CI) | 0.0 [0.0, 0.0] |
| 12 Primary blood loss ≥ 500 mL at time of birth and up to 24 hours (clinically estimated or measured) | 0 | 0 | Risk Ratio (M‐H, Random, 95% CI) | 0.0 [0.0, 0.0] |
| 12.1 High‐income setting | 0 | 0 | Risk Ratio (M‐H, Random, 95% CI) | 0.0 [0.0, 0.0] |
| 12.2 Low‐income setting | 0 | 0 | Risk Ratio (M‐H, Random, 95% CI) | 0.0 [0.0, 0.0] |
| 13 Mean maternal blood loss (mL) at time of birth (clinically estimated or measured) | 0 | 0 | Mean Difference (IV, Random, 95% CI) | 0.0 [0.0, 0.0] |
| 13.1 High‐income setting | 0 | 0 | Mean Difference (IV, Random, 95% CI) | 0.0 [0.0, 0.0] |
| 13.2 Low‐income setting | 0 | 0 | Mean Difference (IV, Random, 95% CI) | 0.0 [0.0, 0.0] |
| 14 Mean maternal blood loss (mL) after delivery of placenta and up to 24 hours (clinically estimated or measured) | 0 | 0 | Mean Difference (IV, Random, 95% CI) | 0.0 [0.0, 0.0] |
| 14.1 High‐income setting | 0 | 0 | Mean Difference (IV, Random, 95% CI) | 0.0 [0.0, 0.0] |
| 14.2 Low‐income setting | 0 | 0 | Mean Difference (IV, Random, 95% CI) | 0.0 [0.0, 0.0] |
| 15 Mean maternal blood loss (mL) at time of birth and up to 24 hours (clinically estimated or measured) | 0 | 0 | Mean Difference (IV, Random, 95% CI) | 0.0 [0.0, 0.0] |
| 15.1 High‐income setting | 0 | 0 | Mean Difference (IV, Random, 95% CI) | 0.0 [0.0, 0.0] |
| 15.2 Low‐income setting | 0 | 0 | Mean Difference (IV, Random, 95% CI) | 0.0 [0.0, 0.0] |
| 16 Maternal blood transfusion | 0 | 0 | Risk Ratio (M‐H, Random, 95% CI) | 0.0 [0.0, 0.0] |
| 16.1 High‐income setting | 0 | 0 | Risk Ratio (M‐H, Random, 95% CI) | 0.0 [0.0, 0.0] |
| 16.2 Low‐income setting | 0 | 0 | Risk Ratio (M‐H, Random, 95% CI) | 0.0 [0.0, 0.0] |
| 17 Clinical signs of severe blood loss | 0 | 0 | Risk Ratio (M‐H, Random, 95% CI) | 0.0 [0.0, 0.0] |
| 17.1 High‐income setting | 0 | 0 | Risk Ratio (M‐H, Random, 95% CI) | 0.0 [0.0, 0.0] |
| 17.2 Low‐income setting | 0 | 0 | Risk Ratio (M‐H, Random, 95% CI) | 0.0 [0.0, 0.0] |
| 18 Therapeutic uterotonics during third stage and/or within 24 hours | 0 | 0 | Risk Ratio (M‐H, Random, 95% CI) | 0.0 [0.0, 0.0] |
| 18.1 High‐income setting | 0 | 0 | Risk Ratio (M‐H, Random, 95% CI) | 0.0 [0.0, 0.0] |
| 18.2 Low‐income setting | 0 | 0 | Risk Ratio (M‐H, Random, 95% CI) | 0.0 [0.0, 0.0] |
| 19 Mean length of third stage Show forest plot | 1 | 130 | Mean Difference (IV, Random, 95% CI) | ‐8.12 [‐9.72, ‐6.52] |
| 19.1 High‐income setting | 0 | 0 | Mean Difference (IV, Random, 95% CI) | 0.0 [0.0, 0.0] |
| 19.2 Low‐income setting | 1 | 130 | Mean Difference (IV, Random, 95% CI) | ‐8.12 [‐9.72, ‐6.52] |
| 20 Manual removal of placenta as defined by authors Show forest plot | 1 | 130 | Risk Ratio (M‐H, Random, 95% CI) | 1.0 [0.06, 15.65] |
| 20.1 High‐income setting | 0 | 0 | Risk Ratio (M‐H, Random, 95% CI) | 0.0 [0.0, 0.0] |
| 20.2 Low‐income setting | 1 | 130 | Risk Ratio (M‐H, Random, 95% CI) | 1.0 [0.06, 15.65] |
| 21 Postnatal diastolic blood pressure > 90 mmHg between birth of baby and discharge from the labour ward. | 0 | 0 | Risk Ratio (M‐H, Random, 95% CI) | 0.0 [0.0, 0.0] |
| 21.1 High‐income setting | 0 | 0 | Risk Ratio (M‐H, Random, 95% CI) | 0.0 [0.0, 0.0] |
| 21.2 Low‐income setting | 0 | 0 | Risk Ratio (M‐H, Random, 95% CI) | 0.0 [0.0, 0.0] |
| 22 Postnatal vomiting between birth of baby and discharge from the labour ward | 0 | 0 | Risk Ratio (M‐H, Random, 95% CI) | 0.0 [0.0, 0.0] |
| 22.1 High‐income setting | 0 | 0 | Risk Ratio (M‐H, Random, 95% CI) | 0.0 [0.0, 0.0] |
| 22.2 Low‐income setting | 0 | 0 | Risk Ratio (M‐H, Random, 95% CI) | 0.0 [0.0, 0.0] |
| 23 Any analgesia between birth of the baby and discharge from labour ward | 0 | 0 | Risk Ratio (M‐H, Random, 95% CI) | 0.0 [0.0, 0.0] |
| 23.1 High‐income setting | 0 | 0 | Risk Ratio (M‐H, Random, 95% CI) | 0.0 [0.0, 0.0] |
| 23.2 Low‐income setting | 0 | 0 | Risk Ratio (M‐H, Random, 95% CI) | 0.0 [0.0, 0.0] |
| 24 Women's assessment of pain during third stage as reported by authors | 0 | 0 | Risk Ratio (M‐H, Random, 95% CI) | 0.0 [0.0, 0.0] |
| 24.1 High‐income setting | 0 | 0 | Risk Ratio (M‐H, Random, 95% CI) | 0.0 [0.0, 0.0] |
| 24.2 Low‐income setting | 0 | 0 | Risk Ratio (M‐H, Random, 95% CI) | 0.0 [0.0, 0.0] |
| 25 Secondary blood loss/any vaginal bleeding needing treatment (after 24 hours and up to 6 weeks) | 0 | 0 | Risk Ratio (M‐H, Random, 95% CI) | 0.0 [0.0, 0.0] |
| 25.1 High‐income setting | 0 | 0 | Risk Ratio (M‐H, Random, 95% CI) | 0.0 [0.0, 0.0] |
| 25.2 Low‐income setting | 0 | 0 | Risk Ratio (M‐H, Random, 95% CI) | 0.0 [0.0, 0.0] |
| 26 Amount of lochia either estimated or measured after 24 hours and up to discharge from hospital | 0 | 0 | Mean Difference (IV, Random, 95% CI) | 0.0 [0.0, 0.0] |
| 26.1 High‐income setting | 0 | 0 | Mean Difference (IV, Random, 95% CI) | 0.0 [0.0, 0.0] |
| 26.2 Low‐income setting | 0 | 0 | Mean Difference (IV, Random, 95% CI) | 0.0 [0.0, 0.0] |
| 27 Surgical evacuation of retained products of conception | 0 | 0 | Risk Ratio (M‐H, Random, 95% CI) | 0.0 [0.0, 0.0] |
| 27.1 High‐income setting | 0 | 0 | Risk Ratio (M‐H, Random, 95% CI) | 0.0 [0.0, 0.0] |
| 27.2 Low‐income setting | 0 | 0 | Risk Ratio (M‐H, Random, 95% CI) | 0.0 [0.0, 0.0] |
| 28 Afterpains ‐ abdominal pain associated with the contracting uterus in the postpartum period | 0 | 0 | Risk Ratio (M‐H, Random, 95% CI) | 0.0 [0.0, 0.0] |
| 28.1 High‐income setting | 0 | 0 | Risk Ratio (M‐H, Random, 95% CI) | 0.0 [0.0, 0.0] |
| 28.2 Low‐income setting | 0 | 0 | Risk Ratio (M‐H, Random, 95% CI) | 0.0 [0.0, 0.0] |
| 29 Apgar score < 7 at 5 minutes | 0 | 0 | Risk Ratio (M‐H, Random, 95% CI) | 0.0 [0.0, 0.0] |
| 29.1 High‐income setting | 0 | 0 | Risk Ratio (M‐H, Random, 95% CI) | 0.0 [0.0, 0.0] |
| 29.2 Low‐income setting | 0 | 0 | Risk Ratio (M‐H, Random, 95% CI) | 0.0 [0.0, 0.0] |
| 30 Birthweight | 0 | 0 | Mean Difference (IV, Random, 95% CI) | 0.0 [0.0, 0.0] |
| 30.1 High‐income setting | 0 | 0 | Mean Difference (IV, Random, 95% CI) | 0.0 [0.0, 0.0] |
| 30.2 Low‐income setting | 0 | 0 | Mean Difference (IV, Random, 95% CI) | 0.0 [0.0, 0.0] |
| 31 Neonatal encephalopathy assessed using Sarnat staging (Sarnat 1976; Table 1) | 0 | 0 | Risk Ratio (M‐H, Random, 95% CI) | 0.0 [0.0, 0.0] |
| 31.1 High‐income setting | 0 | 0 | Risk Ratio (M‐H, Random, 95% CI) | 0.0 [0.0, 0.0] |
| 31.2 Low‐income setting | 0 | 0 | Risk Ratio (M‐H, Random, 95% CI) | 0.0 [0.0, 0.0] |
| 32 Neonatal mortality | 0 | 0 | Risk Ratio (M‐H, Random, 95% CI) | 0.0 [0.0, 0.0] |
| 32.1 High‐income setting | 0 | 0 | Risk Ratio (M‐H, Random, 95% CI) | 0.0 [0.0, 0.0] |
| 32.2 Low‐income setting | 0 | 0 | Risk Ratio (M‐H, Random, 95% CI) | 0.0 [0.0, 0.0] |
| 33 Intraventricular haemorrhage ‐ Papille grade III/IV ‐ (for infants born before 34 weeks' gestation only). | 0 | 0 | Risk Ratio (M‐H, Random, 95% CI) | 0.0 [0.0, 0.0] |
| 33.1 High‐income setting | 0 | 0 | Risk Ratio (M‐H, Random, 95% CI) | 0.0 [0.0, 0.0] |
| 33.2 Low‐income setting | 0 | 0 | Risk Ratio (M‐H, Random, 95% CI) | 0.0 [0.0, 0.0] |
| 34 Number of infants who received a red blood cell transfusion. | 0 | 0 | Risk Ratio (M‐H, Random, 95% CI) | 0.0 [0.0, 0.0] |
| 34.1 High‐income setting | 0 | 0 | Risk Ratio (M‐H, Random, 95% CI) | 0.0 [0.0, 0.0] |
| 34.2 Low‐income setting | 0 | 0 | Risk Ratio (M‐H, Random, 95% CI) | 0.0 [0.0, 0.0] |
| 35 Infant Hb level at 24 to 72 hours | 0 | 0 | Mean Difference (IV, Random, 95% CI) | 0.0 [0.0, 0.0] |
| 35.1 High‐income setting | 0 | 0 | Mean Difference (IV, Random, 95% CI) | 0.0 [0.0, 0.0] |
| 35.2 Low‐income setting | 0 | 0 | Mean Difference (IV, Random, 95% CI) | 0.0 [0.0, 0.0] |
| 36 Infant Hb level at 3‐6 months | 0 | 0 | Mean Difference (IV, Random, 95% CI) | 0.0 [0.0, 0.0] |
| 36.1 High‐income setting | 0 | 0 | Mean Difference (IV, Random, 95% CI) | 0.0 [0.0, 0.0] |
| 36.2 Low‐income setting | 0 | 0 | Mean Difference (IV, Random, 95% CI) | 0.0 [0.0, 0.0] |
| 37 Infant iron indices (ferritin) at 3 to 6 months. | 0 | 0 | Risk Ratio (M‐H, Random, 95% CI) | 0.0 [0.0, 0.0] |
| 37.1 High‐income setting | 0 | 0 | Risk Ratio (M‐H, Random, 95% CI) | 0.0 [0.0, 0.0] |
| 37.2 Low‐income setting | 0 | 0 | Risk Ratio (M‐H, Random, 95% CI) | 0.0 [0.0, 0.0] |
| 38 Exclusive breastfeeding at discharge from hospital | 0 | 0 | Risk Ratio (M‐H, Random, 95% CI) | 0.0 [0.0, 0.0] |
| 38.1 High‐income setting | 0 | 0 | Risk Ratio (M‐H, Random, 95% CI) | 0.0 [0.0, 0.0] |
| 38.2 Low‐income setting | 0 | 0 | Risk Ratio (M‐H, Random, 95% CI) | 0.0 [0.0, 0.0] |
| 39 Neurodevelopmental, cognitive or developmental outcomes assessed after age 18 months. | 0 | 0 | Risk Ratio (M‐H, Random, 95% CI) | 0.0 [0.0, 0.0] |
| 39.1 High‐income setting | 0 | 0 | Risk Ratio (M‐H, Random, 95% CI) | 0.0 [0.0, 0.0] |
| 39.2 Low‐income setting | 0 | 0 | Risk Ratio (M‐H, Random, 95% CI) | 0.0 [0.0, 0.0] |
| 40 Return to hospital as in‐ or outpatient because of bleeding (not pre‐specified) | 0 | 0 | Risk Ratio (M‐H, Random, 95% CI) | 0.0 [0.0, 0.0] |
| 40.1 High‐income setting | 0 | 0 | Risk Ratio (M‐H, Random, 95% CI) | 0.0 [0.0, 0.0] |
| 40.2 Low‐income setting | 0 | 0 | Risk Ratio (M‐H, Random, 95% CI) | 0.0 [0.0, 0.0] |
| 41 Postnatal maternal mean Hb (outcome not pre‐specified) | 0 | 0 | Mean Difference (IV, Random, 95% CI) | 0.0 [0.0, 0.0] |
| 41.1 High‐income setting | 0 | 0 | Mean Difference (IV, Random, 95% CI) | 0.0 [0.0, 0.0] |
| 41.2 Low‐income setting | 0 | 0 | Mean Difference (IV, Random, 95% CI) | 0.0 [0.0, 0.0] |