Antioxidantes para la subfertilidad masculina
Información
- DOI:
- https://doi.org/10.1002/14651858.CD007411.pub3Copiar DOI

- Base de datos:
-
- Cochrane Database of Systematic Reviews
- Versión publicada:
-
- 15 diciembre 2014see what's new
- Tipo:
-
- Intervention
- Etapa:
-
- Review
- Grupo Editorial Cochrane:
-
Grupo Cochrane de Ginecología y fertilidad
- Copyright:
-
- Copyright © 2015 The Cochrane Collaboration. Published by John Wiley & Sons, Ltd.
Cifras del artículo
Altmetric:
Citado por:
Autores
Contributions of authors
MGS: initiated, conceptualised and wrote the protocol; performed the searches, selected trials for inclusion, assessed quality, performed data extraction, entered data and wrote the final review and the update.
RMP: selected trials for inclusion in the 2014 update, assessed quality, entered text into tables of characteristics, performed data extraction and assisted with background text.
JB: co‐drafted the protocol; selected trials for inclusion, assessed quality and performed data extraction. JB also provided advice on the data analysis and helped with incorporating the editorial comments into the original review and commented on the updated version.
AY: co‐drafted the protocol and wrote the section concerning sperm DNA fragmentation for the background and provided technical advice on all versions.
MS: co‐drafted the protocol and provided technical advice on semen parameters, and commented on all versions.
RH: advised and supervised the protocol, review and update, helped select trials for inclusion and wrote the implications for practice and research of the original review and assisted with the abstract. Professor Hart also provided clinical expertise.
Sources of support
Internal sources
-
Cochrane Menstrual Disorders and Subfertility Group, Other.
External sources
-
None, Other.
Declarations of interest
None known
Acknowledgements
Cochrane Menstrual Disorders and Subfertility Group (MDSG). I would like to make special mention of the MDSG editors who were very thorough and helpful in editing this review.
Many thanks to the translators of the non‐English trials ‐ Ichiro Omori, Shaofu Li, Ivan Sola, Pawel Kanturski and Dr Peviandi. And for the update of this review we received help from the following translators; Shaofu Li, Farhad Shokraneh, Taixiang Wu, Juliane Reid, Roberto D'Amico, Vasily Vlassov, Liu Qin, Jianping Liu, Guoyan Yang, Gustavo Porfi, Valter Silva, Maíra Parra, Dr Tomoko Kumaga and Tan Wantao. A special thank‐you to Juliane Reid for putting us in touch with many of our translators.
Thanks also to Stephan Bontekoe who kindly helped with some of the text in the original review.
We acknowledge comments sent by Tina Kold Jensen, Niels Erik Skakkebaek, Niels Jørgensen, Martin Blomberg Jensen, Anders Juul, Peter Gøtzsche, Department of Growth and Reproduction, and The Nordic Cochrane Centre, Rigshospitalet, Denmark. Our formal response was published in December 2011 and the points made have been addressed.
Further information for the trials was received from:
Dr Nematollahi‐mahani (Azizollahi 2013),
Associate Professor Kelton Tremellen (Tremellen 2007).
Dr Mohan Kamath (Kamath 2014)
Dr S Peivandi (Peivandi 2010)
Dr E El Gindy (Elgindy 2008)
Dr M Sigman (Sigman 2006)
Professor Niewchlag (Rolf 1999)
Dr G Cavallini (Cavallini 2004)
Dr C Wang (Wang 1983)
Dr Martinez‐Soto (Martinez‐Soto 2010)
Dr G Morgante (Morgante 2010)
Dr A Nadjarzadeh (Nadjarzadeh 2011)
Dr MR Safarinejad (Safarinejad 2009; Safarinejad 2009a).
Version history
| Published | Title | Stage | Authors | Version |
| 2022 May 04 | Antioxidants for male subfertility | Review | Wiep Ligny, Roos M Smits, Rebecca Mackenzie-Proctor, Vanessa Jordan, Kathrin Fleischer, Jan Peter Bruin, Marian G Showell | |
| 2019 Mar 14 | Antioxidants for male subfertility | Review | Roos M Smits, Rebecca Mackenzie‐Proctor, Anusch Yazdani, Marcin T Stankiewicz, Vanessa Jordan, Marian G Showell | |
| 2014 Dec 15 | Antioxidants for male subfertility | Review | Marian G Showell, Rebecca Mackenzie‐Proctor, Julie Brown, Anusch Yazdani, Marcin T Stankiewicz, Roger J Hart | |
| 2011 Jan 19 | Antioxidants for male subfertility | Review | Marian G Showell, Julie Brown, Anusch Yazdani, Marcin T Stankiewicz, Roger J Hart | |
| 2008 Oct 08 | Antioxidants for male subfertility | Protocol | Marian G Showell, Julie Brown, Anusch Yazdani, Marcin T Stankiewicz, Roger J Hart | |
Differences between protocol and review
In the 2011 full review sperm outcomes of concentration and motility were added as these two sperm outcomes are thought to reflect the oxidative process. A study by El‐Taieb (El‐Taieb 2009) states that "increased ROS generation and reduced antioxidant capacity is negatively correlated with sperm concentration and motility in infertile men".
The comparisons 'antioxidant versus placebo' and 'antioxidants versus no treatment' were combined as the one comparison 'antioxidants versus control', and then it was stated in the sensitivity analysis whether exclusion of those that failed to use placebo would have altered the conclusions ‐ as per statistical advice in the editorial comments.
Subgrouping and sensitivity analysis were performed on the outcomes of live birth and pregnancy in order to assess the potential of overestimation of benefit and reporting bias.
Subgroup analysis was performed on trials that enrolled couples undergoing IVF or ICSI and a sensitivity analysis was performed on those studies enrolling men undergoing IUI.
A post hoc sensitivity analysis was conducted to examine the effect of excluding from the analysis those studies which reported remarkably low standard deviations as the review authors considered that these data were potentially erroneous.
In the 2014 update of the review 'pregnancy rate per couple' was redefined to be 'clinical pregnancy rate'. Stillbirth as an outcome was removed; this will be reported as an adverse outcome, as reported by the trials. The outcome 'level of sperm DNA damage after treatment' was reworded as 'level of sperm fragmentation'.
Keywords
MeSH
Medical Subject Headings (MeSH) Keywords
- Abortion, Spontaneous [epidemiology];
- Antioxidants [*therapeutic use];
- DNA Damage;
- DNA Fragmentation;
- Gastrointestinal Diseases [chemically induced];
- Infertility, Male [*drug therapy, etiology];
- Live Birth [epidemiology];
- Oxidative Stress [*drug effects];
- Pregnancy Rate;
- Randomized Controlled Trials as Topic;
- Sperm Count;
- Sperm Motility [drug effects];
- Spermatozoa [drug effects];
Medical Subject Headings Check Words
Female; Humans; Male; Pregnancy;
PICO
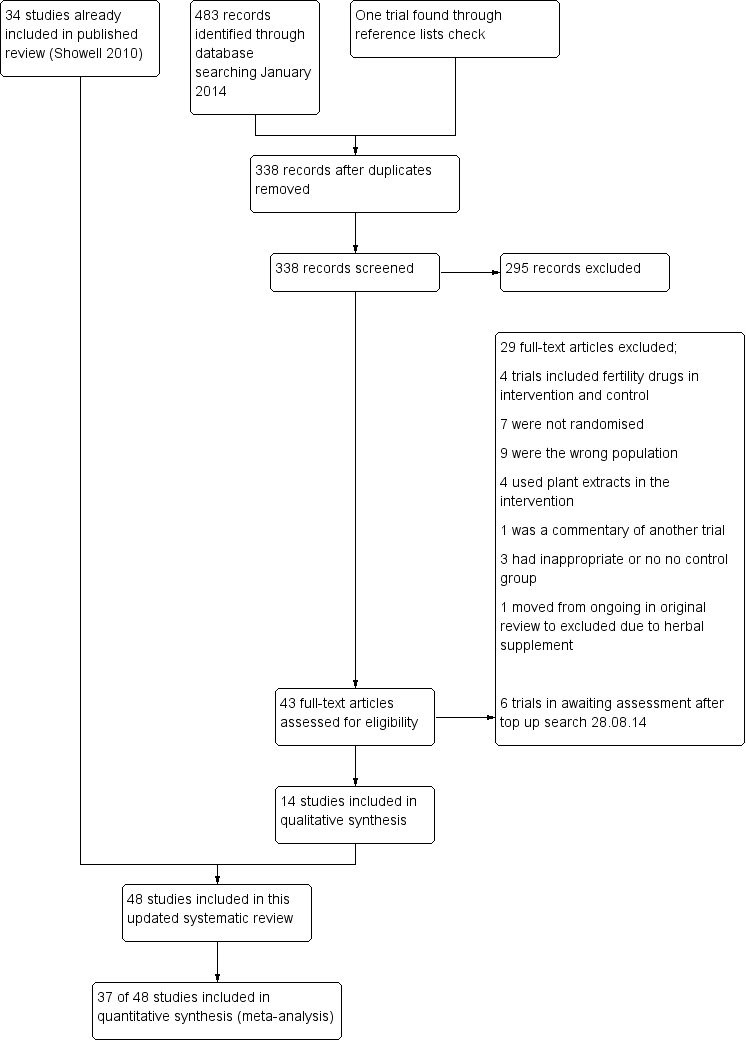
Study flow diagram.

Methodological quality graph: review authors' judgements about each methodological quality item presented as percentages across all included studies.

Methodological quality summary: review authors' judgements about each methodological quality item for each included study.
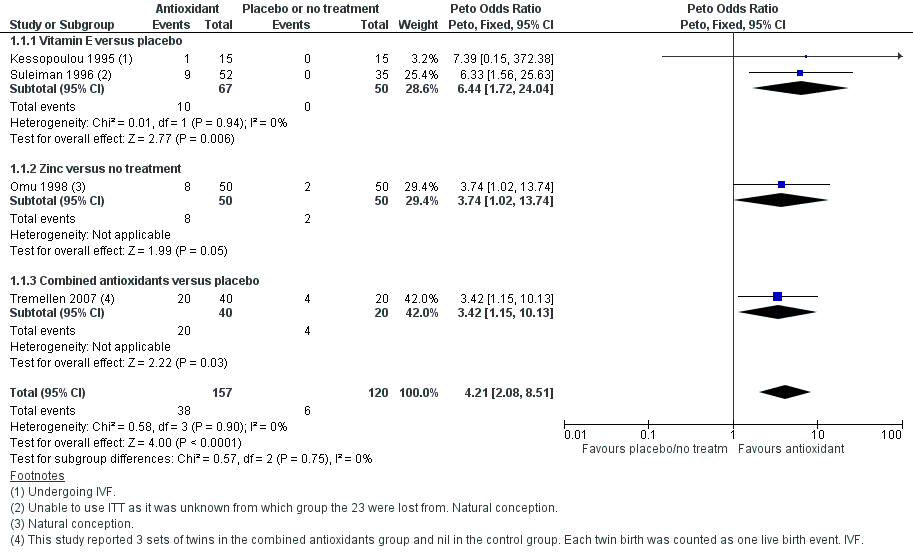
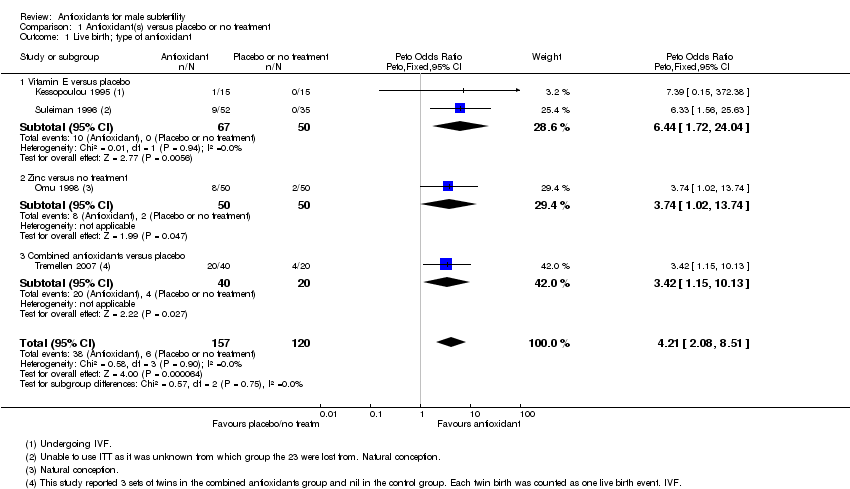
Forest plot of comparison: 1 Antioxidant(s) versus placebo or no treatment, outcome: 1.1 Live birth; type of antioxidant.
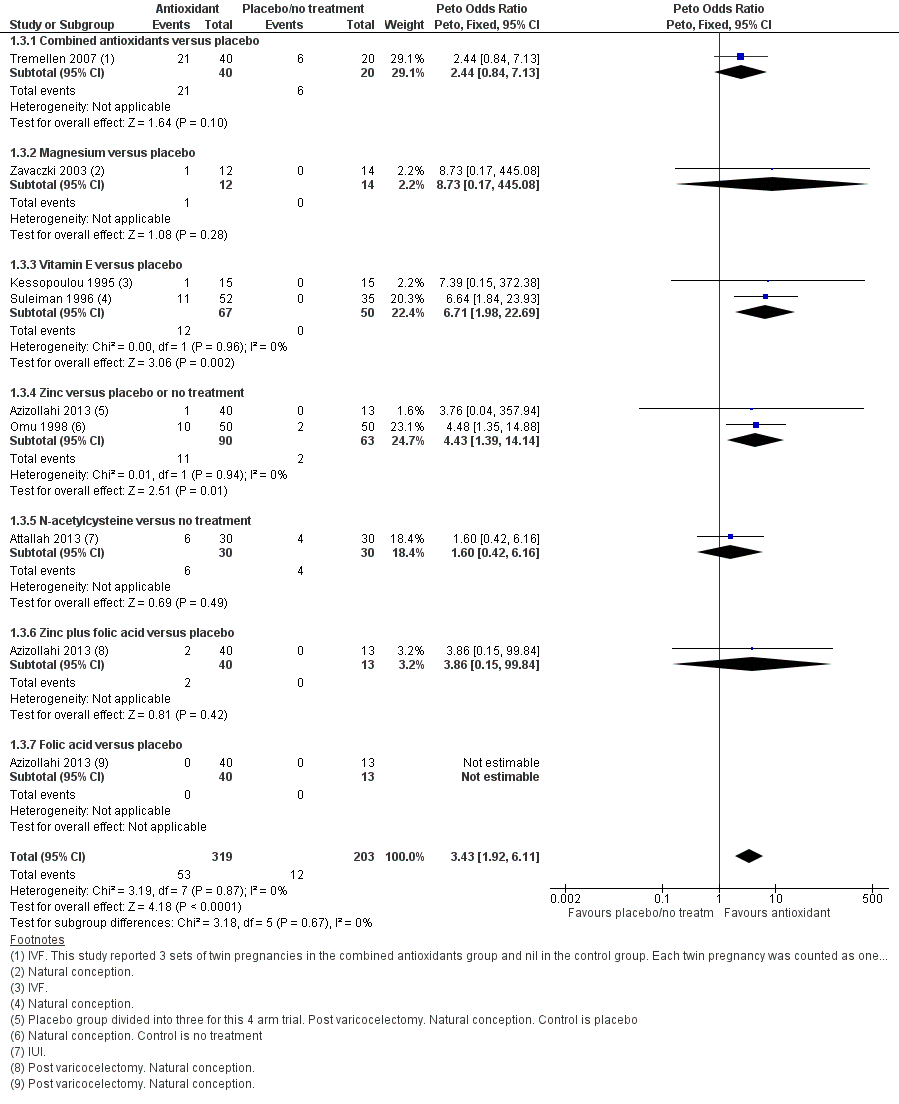
Forest plot of comparison: 1 Antioxidant(s) versus placebo or no treatment, outcome: 1.3 Clinical pregnancy; type of antioxidant.
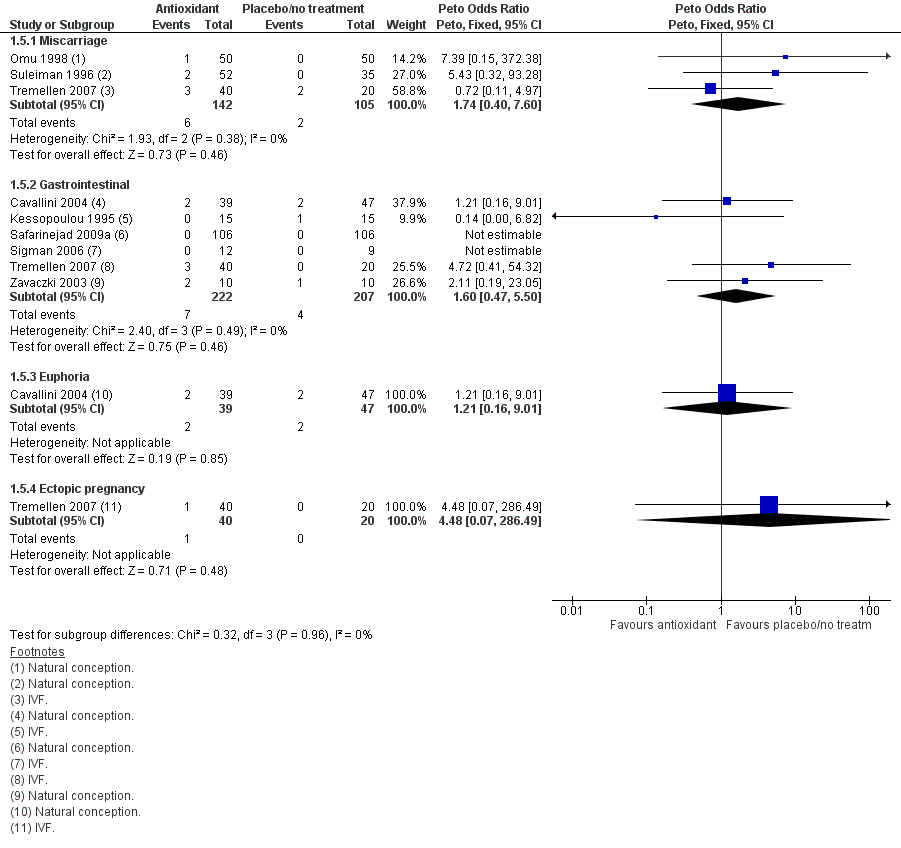
Forest plot of comparison: 1 Antioxidant(s) versus placebo or no treatment, outcome: 1.5 Adverse events.
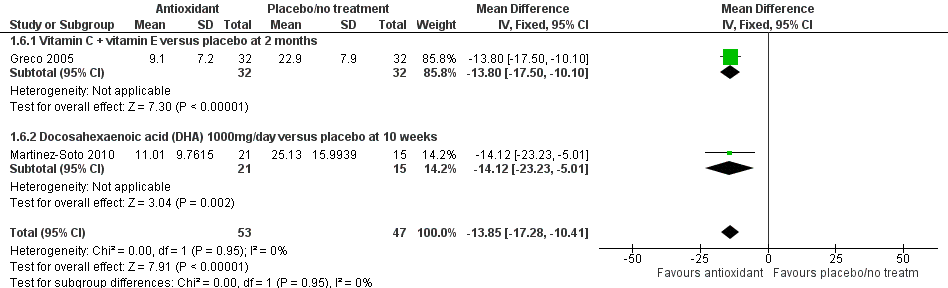
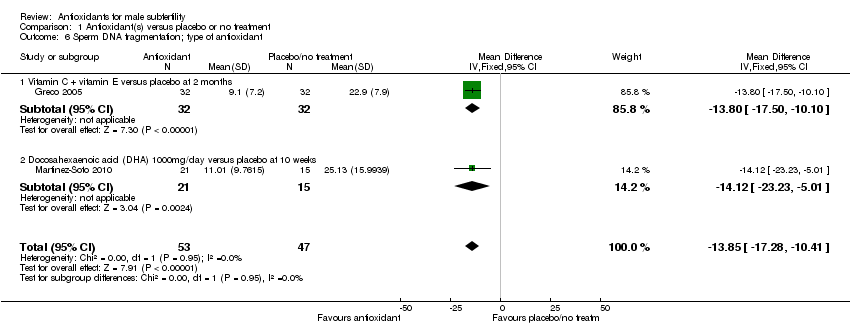
Forest plot of comparison: 1 Antioxidant(s) versus placebo or no treatment, outcome: 1.6 Sperm DNA fragmentation; type of antioxidant.
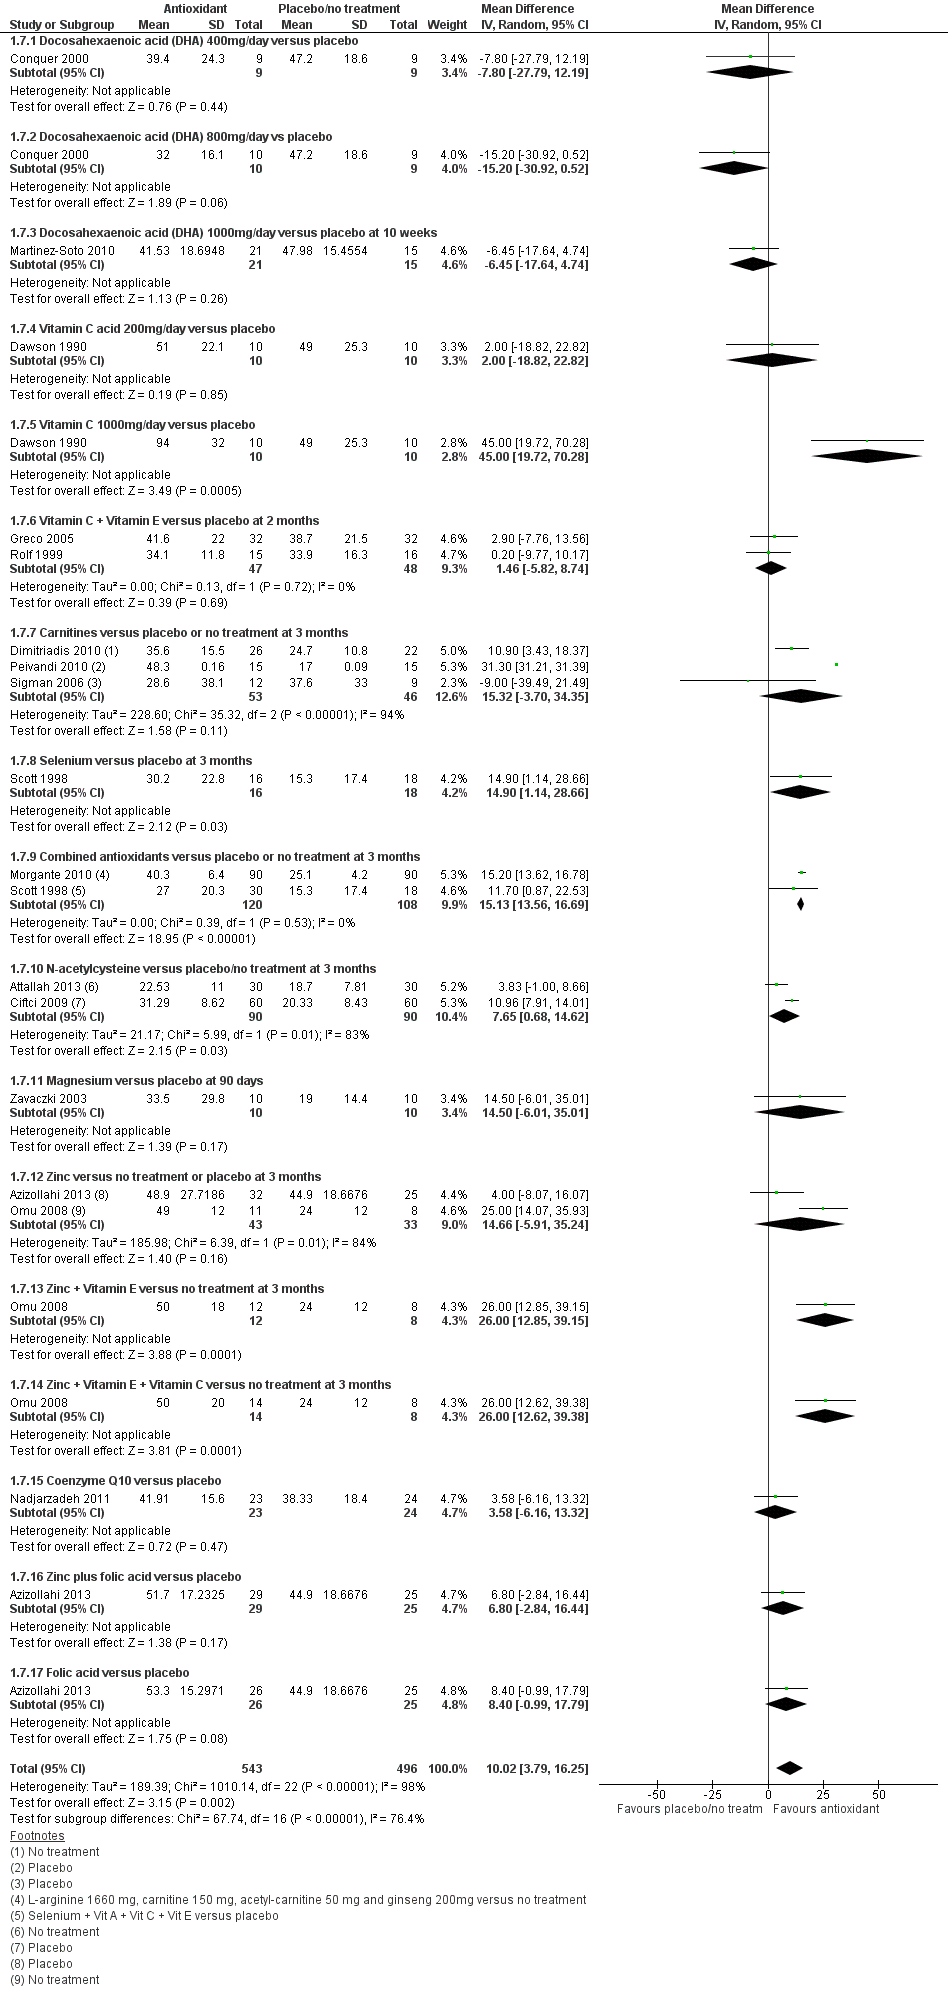
Forest plot of comparison: 1 Antioxidant(s) versus placebo or no treatment, outcome: 1.7 Total sperm motility at 3 months or less; type of antioxidant.

Forest plot of comparison: 1 Antioxidant(s) versus placebo or no treatment, outcome: 1.12 Total sperm motility over time.
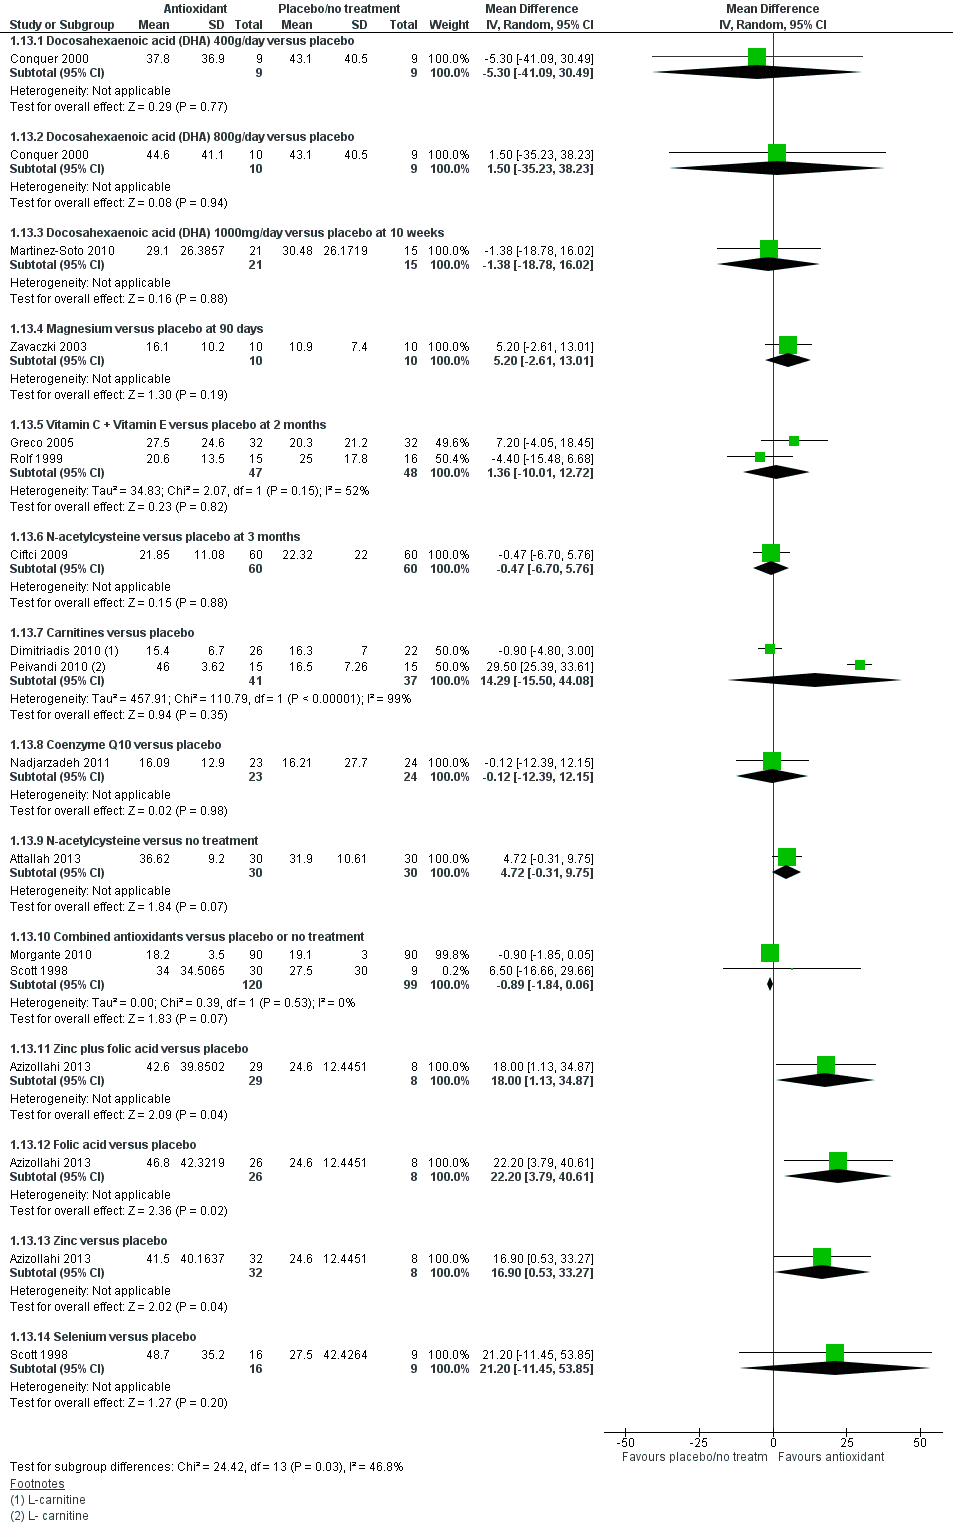
Forest plot of comparison: 1 Antioxidant(s) versus placebo or no treatment, outcome: 1.13 Sperm concentration at 3 months or less; type of antioxidant.

Forest plot of comparison: 1 Antioxidant(s) versus placebo or no treatment, outcome: 1.18 Sperm concentration over time.
Comparison 1 Antioxidant(s) versus placebo or no treatment, Outcome 1 Live birth; type of antioxidant.
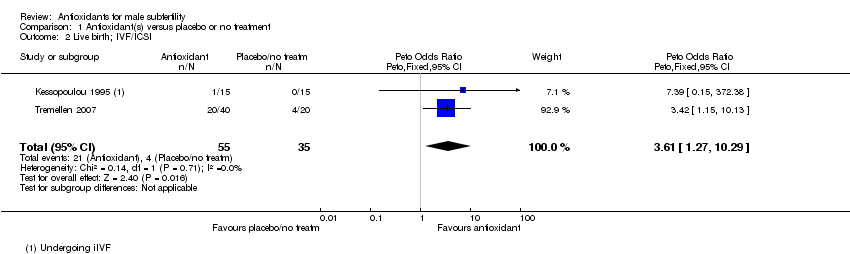
Comparison 1 Antioxidant(s) versus placebo or no treatment, Outcome 2 Live birth; IVF/ICSI.
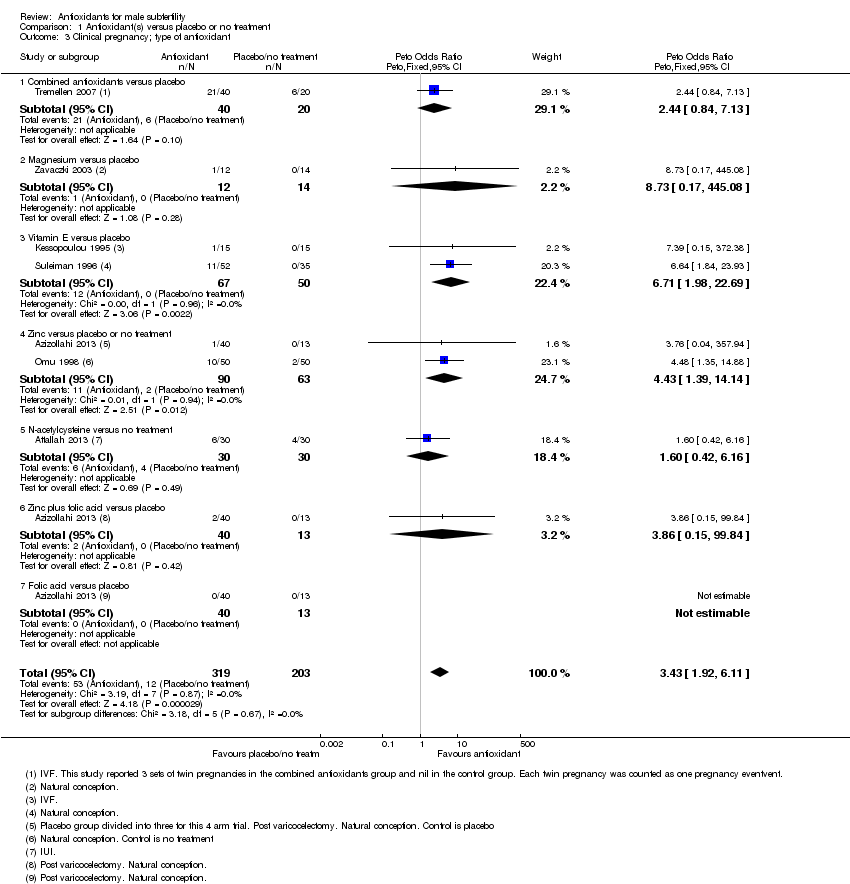
Comparison 1 Antioxidant(s) versus placebo or no treatment, Outcome 3 Clinical pregnancy; type of antioxidant.
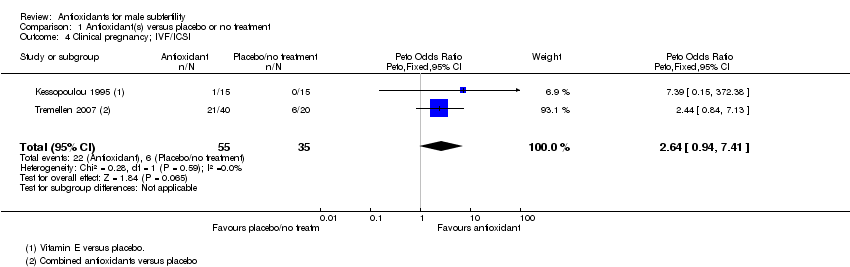
Comparison 1 Antioxidant(s) versus placebo or no treatment, Outcome 4 Clinical pregnancy; IVF/ICSI.
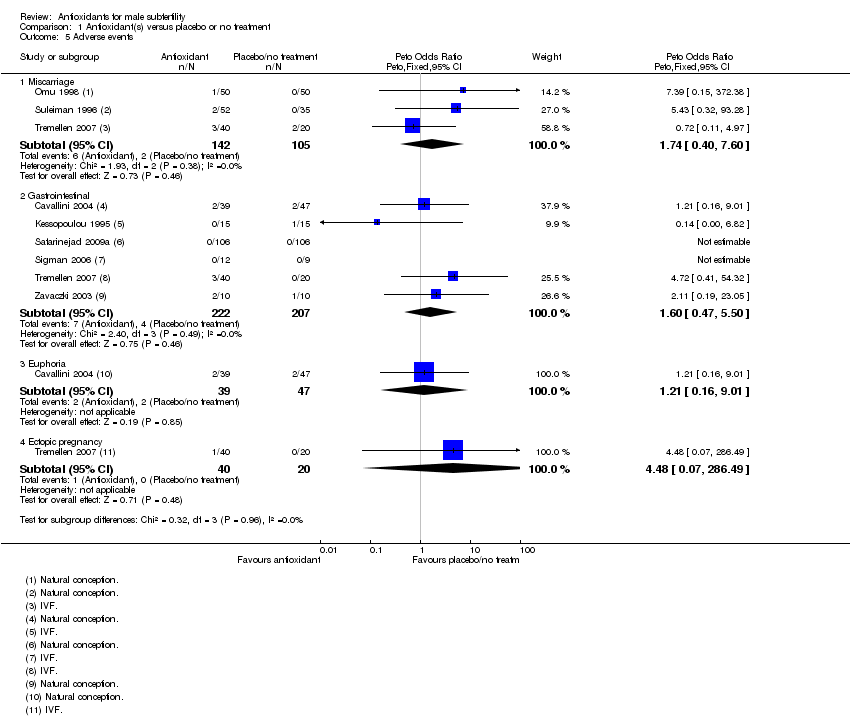
Comparison 1 Antioxidant(s) versus placebo or no treatment, Outcome 5 Adverse events.
Comparison 1 Antioxidant(s) versus placebo or no treatment, Outcome 6 Sperm DNA fragmentation; type of antioxidant.

Comparison 1 Antioxidant(s) versus placebo or no treatment, Outcome 7 Total sperm motility at 3 months or less; type of antioxidant.
| Study | Intervention | Control | P value |
| L‐carnitine + Acetyl‐carnitine versus placebo (median and interquartile range) | |||
| Cavallini 2004 | L‐carnitine + Acetyl‐carnitine Median=22.3 (n=39) Interquartile range =28.4‐15.2 | Placebo Median= 14.0 (n=47) Interquartile range=17.4‐5.1 | Not provided |
| Combined antioxidants versus no treatment | |||
| Galatioto 2008 | Combined antioxidants % of motile sperm =58% (n=20) | No treatment % of motile sperm =51% (n=22) | P=0.847 |
| Vitamin E versus placebo | |||
| Kessopoulou 1995 | Vitamin E Median=7 (n=15) min/max= ‐27‐34 | Placebo Median=7 (n=15) min/max= ‐33‐36 | Not provided |
| L‐carnitine versus placebo | |||
| Lenzi 2003 | L‐carnitine Mean=11(n=43) no sd given | Placebo Mean=8.8 (n=43) no sd given | P=.04 |
| Selenium + Zinc versus placebo | |||
| Sivkov 2011 | Selenium + Zinc Mean =38.3 (n=15) no sd given | Placebo Mean =38 (n=15) no sd given | Not provided |
Comparison 1 Antioxidant(s) versus placebo or no treatment, Outcome 8 Total sperm motility at 3 months or less (data not suitable for meta analysis).
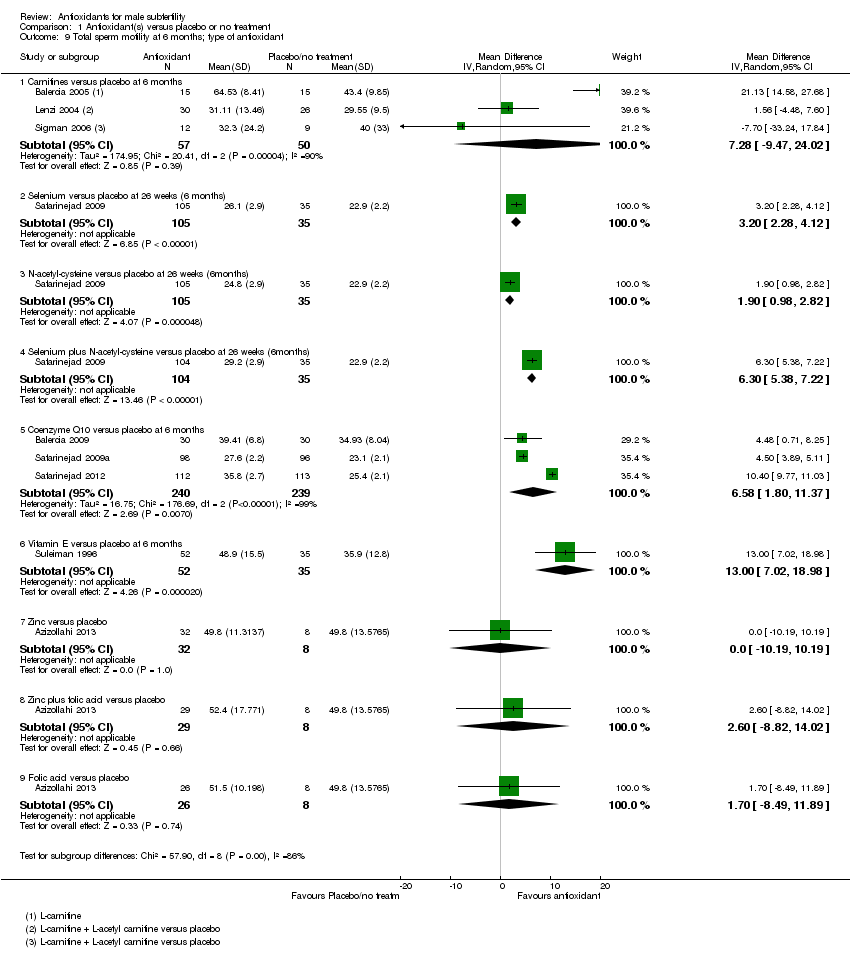
Comparison 1 Antioxidant(s) versus placebo or no treatment, Outcome 9 Total sperm motility at 6 months; type of antioxidant.
| Study | Intervention | Control | P value |
| L‐carnitine + Acetyl‐carnitine versus placebo (median and interquartile range) | |||
| Cavallini 2004 | L‐carnitine + acetyl‐carnitine Median=23.6 (n=39) Interquartile range=28.9‐16.0 | Placebo Median=13.2 (n=47) Interquartile range=18.6‐9.0 | Not provided |
| Folic acid versus placebo | |||
| Wong 2002 | Folic acid Median=35 (n=22) Range=5‐65 | Placebo Median=30 (n=25) Range=5‐80 | |
| Zinc versus placebo | |||
| Wong 2002 | Zinc Median=35 (n=23) Range=10‐65 | Placebo Median=30 (n=25) Range=5‐80 | |
| Zinc + folic acid versus placebo | |||
| Wong 2002 | Zinc + folic acid Median=35 (n=24) Range 5‐70 | Placebo Median=30 (n=25) Range=5‐80 | |
Comparison 1 Antioxidant(s) versus placebo or no treatment, Outcome 10 Total sperm motility at 6 months(data not suitable for meta analysis).
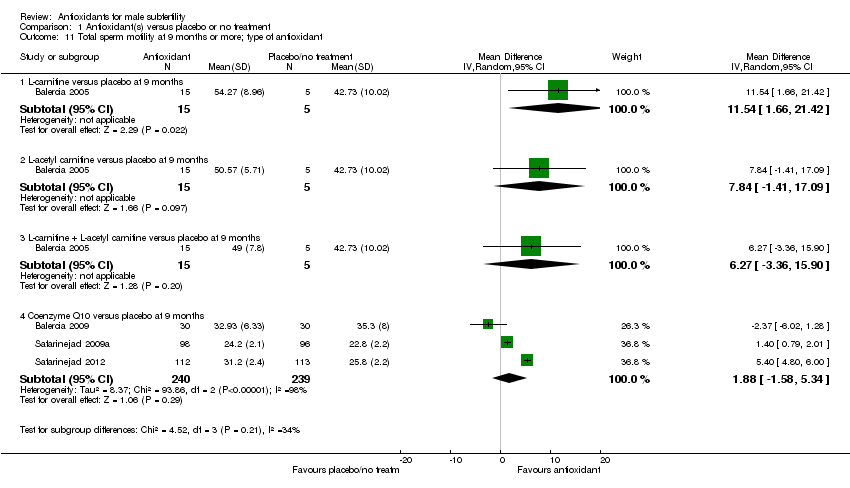
Comparison 1 Antioxidant(s) versus placebo or no treatment, Outcome 11 Total sperm motility at 9 months or more; type of antioxidant.
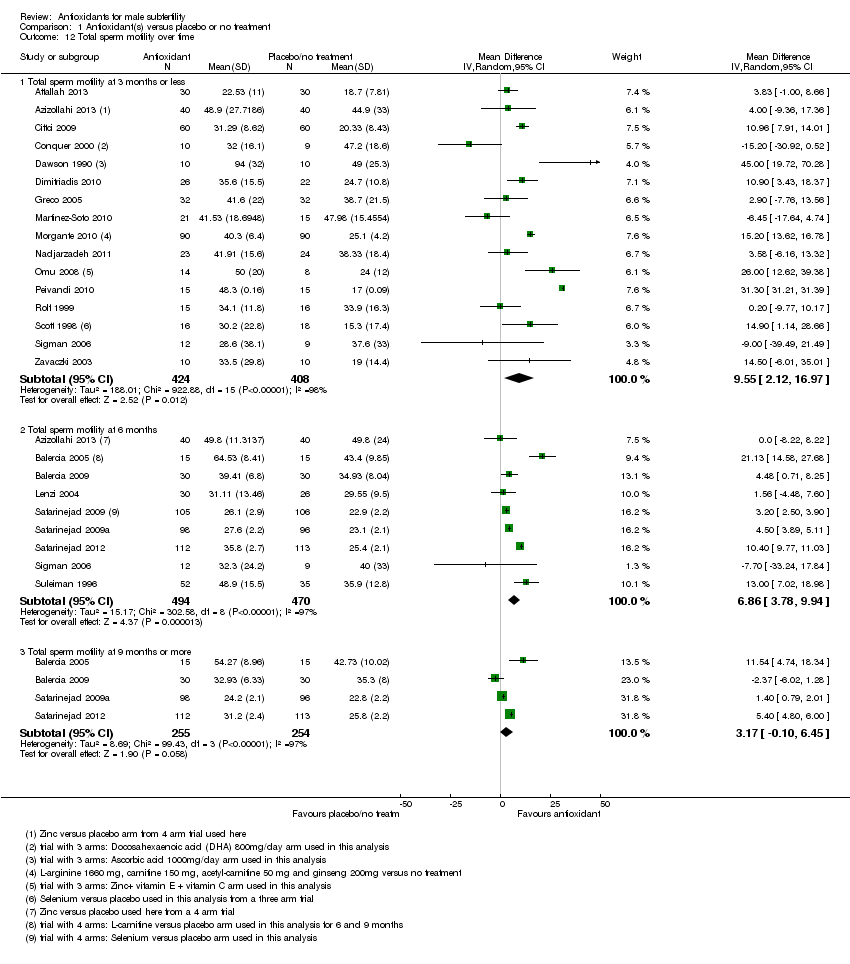
Comparison 1 Antioxidant(s) versus placebo or no treatment, Outcome 12 Total sperm motility over time.

Comparison 1 Antioxidant(s) versus placebo or no treatment, Outcome 13 Sperm concentration at 3 months or less; type of antioxidant.
| Study | Intervention | Control | P value |
| L‐carnitine + Acetyl‐carnitine versus placebo (median and interquartile range) | |||
| Cavallini 2004 | L‐carnitine + acetyl‐carnitine Median=20.9 (n=39) Interquartile range=25.6‐14.8 | Placebo Median=12.3 (n=47) Interquartile range=16.0‐9.1 | Not provided |
| Vitamin E versus placebo | |||
| Kessopoulou 1995 | Vitamin E Median= ‐15 (n=15) min/max= ‐58‐59 | Placebo Median=0 (n=15) min/max= ‐37‐160 | Not provided |
| L‐carnitine versus placebo | |||
| Lenzi 2003 | L‐carnitine Mean= 9 (1st phase data) (n=43) no sd given | Placebo Mean=5.3 (n=43) no sd given | P=0.03 |
Comparison 1 Antioxidant(s) versus placebo or no treatment, Outcome 14 Sperm concentration at 3 months or less (data not suitable for meta analysis).

Comparison 1 Antioxidant(s) versus placebo or no treatment, Outcome 15 Sperm concentration at 6 months; type of antioxidant.
| Study | Intervention | Control | P value |
| L‐carnitine + acetyl‐carnitine versus placebo | |||
| Cavallini 2004 | L‐carnitine + acetyl‐carniitne Median=20.6 (n=39) Interquartile range=24.9‐15.1 | Placebo Median=10.9 (n=47) Interquartile range=15.1‐9.0 | Not provided |
| Folic acid versus Placebo | |||
| Wong 2002 | Folic acid Median=14 (n=22) Range=0.9‐130 | Placebo Median=9 (n=25) Range=0.8‐80 | Not provided |
| Zinc versus Placebo | |||
| Wong 2002 | Zinc Median=16 (n= 23) Range=0.6‐80 | Placebo Median=9 (n= 25) Range=0.8‐80 | Not provided |
| Zinc + folic acid versus placebo | |||
| Wong 2002 | Zinc + folic acid Median= 12 (n=24) Range= 0.5‐180 | Placebo Median=9 (n= 25) Range=0.8‐80 | Not provided |
Comparison 1 Antioxidant(s) versus placebo or no treatment, Outcome 16 Sperm concentration at 6 months(data not suitable for meta analysis).
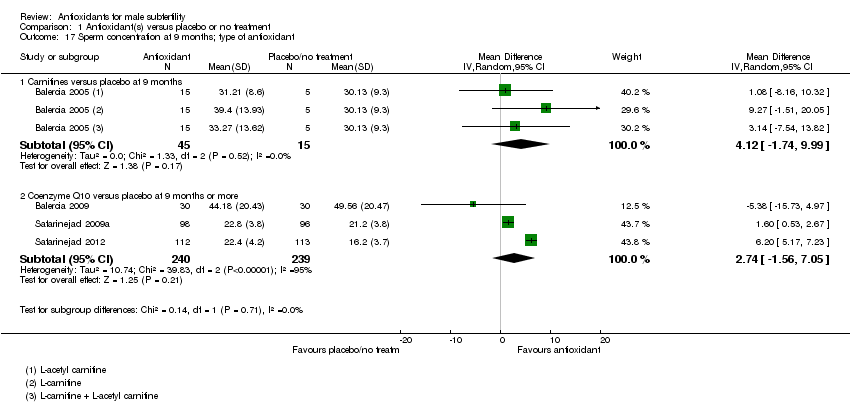
Comparison 1 Antioxidant(s) versus placebo or no treatment, Outcome 17 Sperm concentration at 9 months; type of antioxidant.
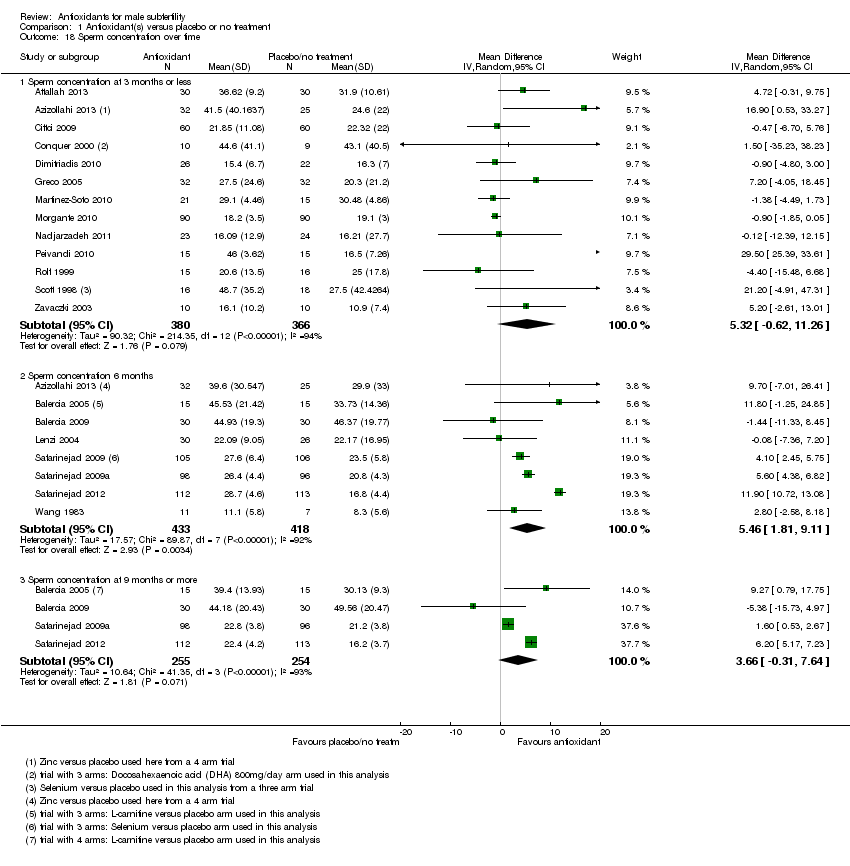
Comparison 1 Antioxidant(s) versus placebo or no treatment, Outcome 18 Sperm concentration over time.
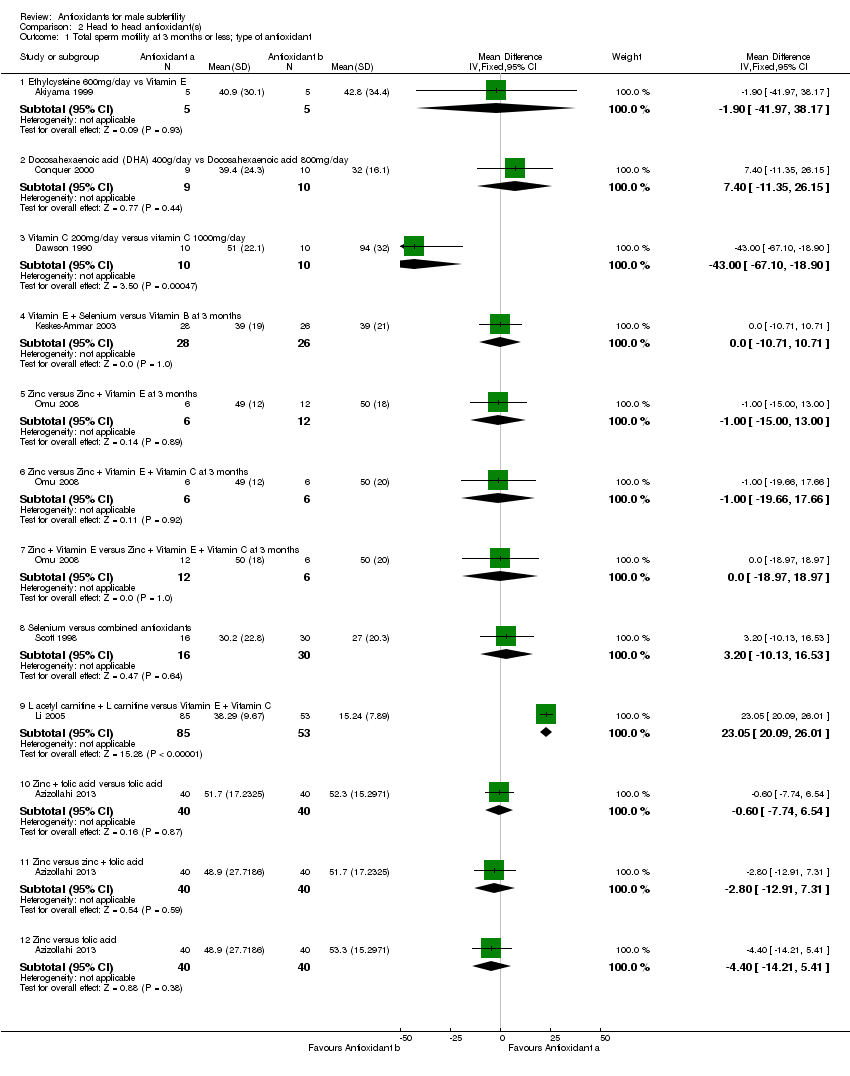
Comparison 2 Head to head antioxidant(s), Outcome 1 Total sperm motility at 3 months or less; type of antioxidant.
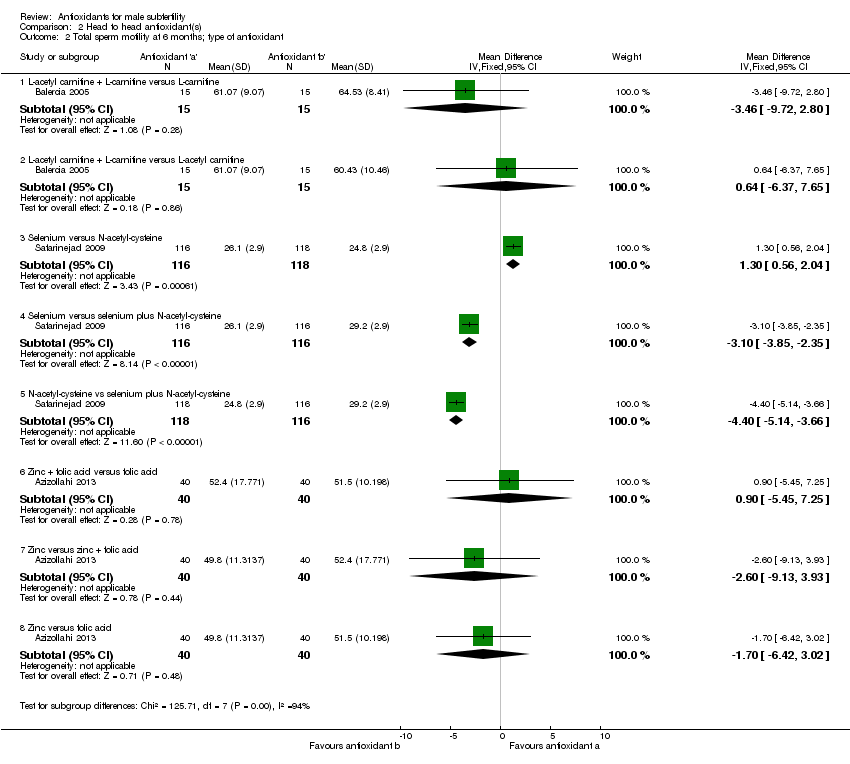
Comparison 2 Head to head antioxidant(s), Outcome 2 Total sperm motility at 6 months; type of antioxidant.
| Study | Antioxidant a | Antioxidant b | P value |
| Zinc versus Folic acid | |||
| Wong 2002 | Zinc Median=35 Range=10‐65 | Folic acid Median=35 Range=5‐65 | Not provided |
| Zinc versus Zinc + folic acid | |||
| Wong 2002 | Zinc Median=35 Range=10‐65 | Zinc + folic acid Median=35 Range=5‐70 | Not provided |
| Folic acid versus Zinc + folic acid | |||
| Wong 2002 | Folic acid Median=35 Range=5‐65 | Zinc + folic acid Median=35 Range=5‐70 | Not provided |
Comparison 2 Head to head antioxidant(s), Outcome 3 Total sperm motility at 6 months.

Comparison 2 Head to head antioxidant(s), Outcome 4 Total sperm motility at 9 months or more; type of antioxidant.
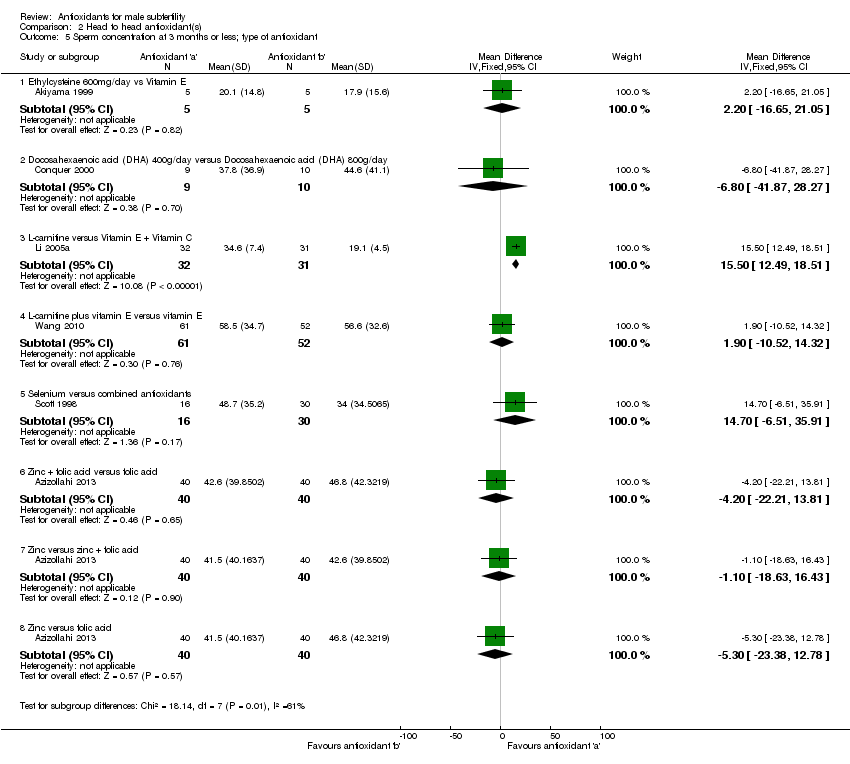
Comparison 2 Head to head antioxidant(s), Outcome 5 Sperm concentration at 3 months or less; type of antioxidant.

Comparison 2 Head to head antioxidant(s), Outcome 6 Sperm concentration at 6 months; type of antioxidant.
| Study | Antioxidant a | Antioxidant b | P value |
| Zinc versus Folic acid | |||
| Wong 2002 | Zinc Median=16 Range=0.6‐80 | Folic acid Median=14 Range=0.9‐130 | Not provided |
| Zinc versus Zinc + Folic acid | |||
| Wong 2002 | Zinc Median= 16 Range=0.6‐80 | Zinc + Folic acid Median=12 Range=0.5‐180 | Not provided |
| Folic acid versus Zinc + folic acid | |||
| Wong 2002 | Folic acid Folic acid Median=14 Range=0.9‐130 | Zinc + Folic acid Median=12 Range=0.5‐180 | Not provided |
Comparison 2 Head to head antioxidant(s), Outcome 7 Sperm concentration at 6 months.

Comparison 2 Head to head antioxidant(s), Outcome 8 Sperm concentration at 9 months or more; type of antioxidant.

Comparison 3 Pentoxifylline versus placebo or no treatment, Outcome 1 Total sperm motility at 3 months or less; pentoxifylline versus placebo or no treatment.
| Study | Antioxidant | Placebo | P value |
| Pentoxifylline versus placebo | |||
| Merino 1997 | Pentoxifylline Median=35.5 (n=25) Range=31.5‐39.5 | Placebo Median=33.5 (n=22) Range=28.5‐37.5 | P<0.01 |
Comparison 3 Pentoxifylline versus placebo or no treatment, Outcome 2 Total sperm motility at 3 months or less (data not suitable for meta analysis).
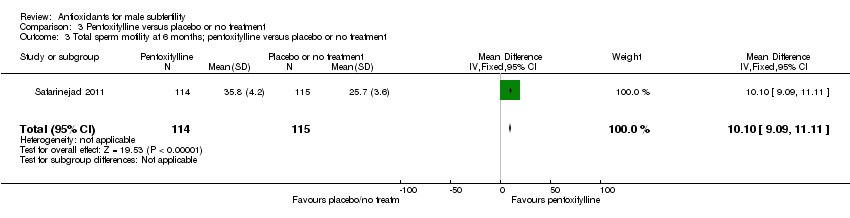
Comparison 3 Pentoxifylline versus placebo or no treatment, Outcome 3 Total sperm motility at 6 months; pentoxifylline versus placebo or no treatment.
| Study | Antioxidant | Control | P value |
| Pentoxifylline versus placebo | |||
| Merino 1997 | Pentoxifylline Median=42 (n=25) Range=38‐46 | Placebo Median=31.5 (22) Range=28‐35 | P<0.00001 |
Comparison 3 Pentoxifylline versus placebo or no treatment, Outcome 4 Total sperm motility at 6 months (data not suitable for meta analysis).

Comparison 3 Pentoxifylline versus placebo or no treatment, Outcome 5 Total sperm motility at 9 months; pentoxifylline versus placebo or no treatment.

Comparison 3 Pentoxifylline versus placebo or no treatment, Outcome 6 Total sperm motility over time.

Comparison 3 Pentoxifylline versus placebo or no treatment, Outcome 7 Sperm concentration at 3 months or less; pentoxifylline versus placebo or no treatment.

Comparison 3 Pentoxifylline versus placebo or no treatment, Outcome 8 Sperm concentration at 6 months; pentoxifylline versus placebo.
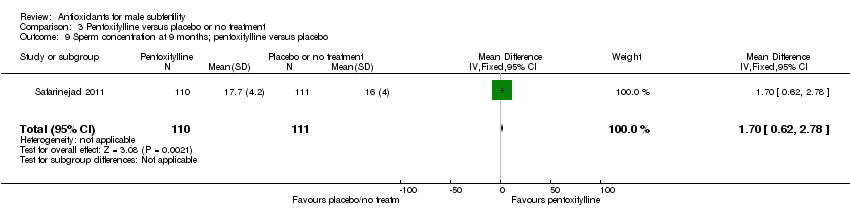
Comparison 3 Pentoxifylline versus placebo or no treatment, Outcome 9 Sperm concentration at 9 months; pentoxifylline versus placebo.
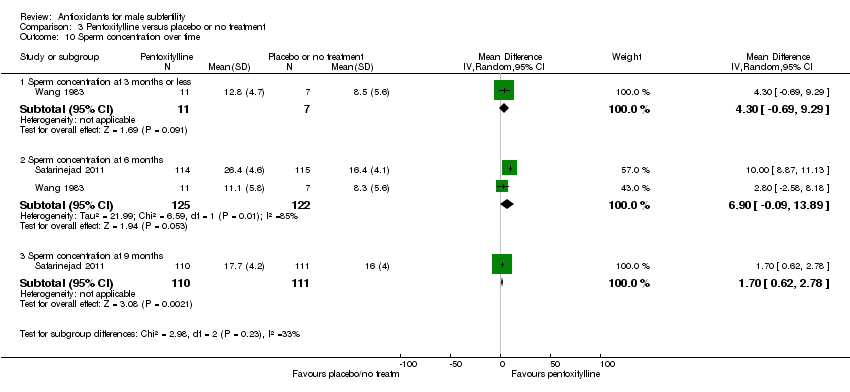
Comparison 3 Pentoxifylline versus placebo or no treatment, Outcome 10 Sperm concentration over time.

Comparison 3 Pentoxifylline versus placebo or no treatment, Outcome 11 Adverse events.
| Antioxidants versus placebo or no treatment for male subfertility | ||||||
| Patient or population: patients with male subfertility | ||||||
| Outcomes | Illustrative comparative risks* (95% CI) | Relative effect | No of Participants | Quality of the evidence | Comments | |
| Assumed risk | Corresponding risk | |||||
| Control | Antioxidants versus placebo or no treatment | |||||
| Live Birth per couple randomised | 50 per 1000 | 181 per 1000 | OR 4.21 | 277 | ⊕⊕⊝⊝ | |
| Clinical Pregnancy rate per couple randomised | 59 per 1000 | 177 per 1000 | OR 3.43 | 522 | ⊕⊕⊝⊝ | |
| Adverse event: Miscarriage rate per couple randomised | 19 per 1000 | 33 per 1000 | OR 1.74 | 247 | ⊕⊝⊝⊝ | |
| *The basis for the assumed risk (e.g. the median control group risk across studies) is provided in footnotes. The corresponding risk (and its 95% confidence interval) is based on the assumed risk in the comparison group and the relative effect of the intervention (and its 95% CI). | ||||||
| GRADE Working Group grades of evidence | ||||||
| 1 Inadequate explanations of methodology and large unexplained dropouts in one study | ||||||
| Undefined or biochemical pregnancy | Events Intervention | Total 1 | Events Control | Total 2 | Effect Estimate | CI | |
| Antioxidant(s) versus placebo or no treatment | |||||||
| Combined antioxidants | |||||||
| Galatioto 2008 | 1 | 20 | 0 | 22 | |||
| Arginine versus placebo | |||||||
| Pryor 1978 | 2 | 35 | 2 | 29 | 0.82 | 0.82 [0.11, 6.16] | |
| Carnitines versus placebo or no treatment | 25 | 154 | 3 | 145 | 5.33 | ||
| Sigman 2006 | 1 | 12 | 1 | 9 | 0.74 | 0.74 [0.04, 13.02] | |
| Peivandi 2010 | 3 | 15 | 0 | 15 | 8.57 | 8.57 [0.82, 89.45] | |
| Lenzi 2004 | 4 | 30 | 0 | 26 | 7.20 | 7.20 [0.95, 54.34] | |
| Lenzi 2003 | 6 | 43 | 0 | 43 | 8.37 | 8.37 [1.61, 43.58] | |
| Cavallini 2004 | 9 | 39 | 1 | 47 | 7.50 | 7.50 [2.01, 27.98] | |
| Balercia 2005 | 2 | 15 | 1 | 5 | 0.61 | 0.61 [0.04, 9.64] | |
| Coenzyme Q10 versus placebo | 6 | 136 | 3 | 136 | 2.16 | ||
| Safarinejad 2009a | 0 | 106 | 0 | 106 | 0 | Not estimable | |
| Balercia 2009 | 6 | 30 | 3 | 30 | 2.16 | 2.16 [0.53, 8.82] | |
| Pentoxifylline versus placebo | |||||||
| Wang 1983 | 0 | 11 | 0 | 7 | 0 | Not estimable | |
| Vitamin C plus vitamin E versus placebo | |||||||
| Rolf 1999 | 0 | 15 | 0 | 16 | 0 | Not estimable | |
| Head to head antioxidant(s) | CI Start | CI End | |||||
| L‐acetyl carnitine + L‐carnitine versus L‐acetyl carnitine | |||||||
| Balercia 2005 | 2 | 7 | 2 | 15 | 2.66 | 0.27 | 25.80 |
| L‐acetyl carnitine + L‐carnitine versus L‐carnitine | |||||||
| Balercia 2005 | 3 | 8 | 2 | 15 | 3.89 | 0.51 | 29.76 |
| L‐acetyl carnitine + L‐carnitine versus vitamin E + vitamin C | |||||||
| Li 2005 | 10 | 85 | 2 | 53 | 2.72 | 0.81 | 9.14 |
| L‐carnitine plus vitamin E versus vitamin E | |||||||
| Wang 2010 | 21 | 68 | 3 | 67 | 6.01 | 2.49 | 14.47 |
| Study ID | Population, design | Outcomes described in methods section | Outcomes reported on in results | In meta‐analysis Y or N | Results | Conclusions + = positive effect ‐ = negative or no effect |
| Infertile men ‐ high ROS levels N = 10 Crossover Head to head Japanese | Sperm parameters | Sperm parameters | Y | Sperm density and motility did not improve but "sperm function" increased and ROS levels decreased | + Ethylcysteine shown to be effective when compared to vitamin E for ROS associated infertility | |
| Idiopathic athenozospermia IUI N = 30 parallel, no treatment conference abstract | Chemical and clinical pregnancy sperm parameters | Clinical pregnancy Sperm parameters | Y | NAC increased sperm concentration and motility Clinical pregnancy was not significantly different between the groups | + NAC improves semen quality and improves pregnancy rates prior to IUI | |
| Men post‐varicocelectomy N = 160 4‐armed trial | Sperm parameters | Sperm parameters | Y sperm parameters reported but clinical pregnancy from correspondence with author ‐ men were asked at their last semen assessment session about pregnancy if yes ultrasound was used to confirm | Mild improvement in sperm parameters with the use of antioxidants | + Co‐administration of zinc and folic acid improved sperm parameters and increased varicocelectomy outcomes | |
| Infertile men or unexplained infertility N = 60 Placebo and head to head | Sperm parameters | Sperm parameters Spontaneous pregnancies 5 LC + LAC 2 LC 2 LAC 3 placebo | Y ‐ sperm N ‐ pregnancy | Improvement in motility in LAC group. 12 spontaneous pregnancies (unknown if biochemical or clinical) | + Long term carnitine is effective in increasing sperm motility | |
| Infertile and unexplained N = 60 | Sperm parameters | Sperm parameters Spontaneous pregnancies 6 Q10 3 placebo | Y ‐ sperm N ‐ pregnancy | Co enzyme Q10 increased sperm motility. 9 spontaneous pregnancies (unknown if biochemical or clinical) | + Q10 effective in improving sperm kinetic features in asthenospermia | |
| Severe idiopathic oligoasthenospermia conference abstract N = 42 | Sperm parameters | Sperm | N ‐ no data available | A significant improvement in morphology concentration, motility in the carnitine group No side effects | + Quality of semen is positively associated with fertilisation and implantation rates in assisted reproduction | |
| Idiopathic and varicocoele associated infertility N = 325 | Sperm parameters pregnancies side effects | Sperm parameters pregnancies at 6 months post‐treatment and assumed to be clinical | N Medians only given for sperm parameters in full paper Analysis 1.8 , .Analysis 1.10; Analysis 1.13; Analysis 1.14; Analysis 1.16. Means in conference abstract but no data given for placebo group and data for group 3 (carnitine + cinoxacin) versus group 2 (carnitines) unable to be used as 3 includes cinoxacin an antiinflammatory drug Y clinical pregnancy | Significant increase in sperm parameters for carnitines when compared to placebo. Carnitine groups had a significantly higher pregnancy rate than placebo group | + The antioxidant plus antiinflammatory group was more effective in improving sperm parameters and pregnancy than those of carnitines alone or placebo however carnitines alone were more effective than placebo | |
| Idiopathic infertility N = 120 | Sperm parameters | Sperm parameters | Y sperm parameters | NAC showed significant improvement in sperm parameters when compared with placebo | + Sperm parameters improved after the use of NAC | |
| Asthenozoospermic men N = 28 | Sperm parameters | Sperm parameters | Y sperm parameters (SEs converted to SDs) | DHA showed no effect on sperm motility or concentration | ± DHA supplementation increased DHA levels in the sperm but not motility or concentration | |
| Agglutination associated infertility N = 30 | Sperm parameters | Sperm parameters | Y sperm parameters (SEs converted to SDs) | The group receiving 1000 mg of AA showed more improvement in parameters than the 200mg group and the placebo | + | |
| Oligoasthenospermia N = 75 4 arm trial only 2 arms able to be used | Sperm parameters | Sperm parameters | Y sperm parameters | An improvement in sperm concentration with carnitine versus no treatment | + Enhancement of Leydig cell secretory function may increase sperm concentration and motility | |
| Asthenoszoospermic men N = 50 | Sperm parameters | sperm parameters ‐ sperm membrane and serum fatty acids | N outcomes not included in this review | Sperm parameters improved with DHA + vitamin E supplementation | + | |
| Oligospermia post‐embolisation of varicocoele N = 42 | Sperm parameters Pregnancy Adverse events | Sperm parameters Pregnancy Adverse events | N medians only given for sperm parameters Analysis 1.8 Y pregnancy at 12 months post‐treatment assumed to be clinical Adverse events | Significant difference in sperm count in combined antioxidant group but not in motility. One pregnancy in the NAC group No significant adverse effects | ± | |
| Male infertility ‐ high DNA fragmentation N = 64 | Sperm parameters | Sperm parameters | Y sperm parameters | No significant difference in concentration or motility however DNA fragmentation was significantly reduced in the vitamin C + E when compared to placebo | + A short oral treatment of VitC + E can reduce DNA fragmentation | |
| Men with high levels of ROS in semen N = 78 Head to head | Sperm parameters | Sperm parameters | Y sperm parameters | Treatment with Vit E and selenium increased sperm motility when compared to vitamin B | + | |
| Male infertility Crossover N = 30 | Sperm parameters | Sperm parameters Live birth Clinical pregnancy | N medians only given for sperm parameters Analysis 1.8; Analysis 1.14 Y Pregnancy | No differences in sperm outcomes were seen between the groups. 1 pregnancy in the vitamin E group and nil in the placebo (first phase data) | ‐ No difference in semen parameters | |
| Male patients with abnormal sperm count and motility 3‐armed trial N = 396 | Sperm parameters | Sperm parameters | N scales given | No statistical difference in sperm outcomes in vitamin B 12 groups or placebo | ‐ | |
| Male factor infertility N = 100 Crossover | Sperm parameters Pregnancy rates | Sperm parameters Pregnancy rates | N no SDs given for sperm parameters Analysis 1.8; Analysis 1.14 N no definition of pregnancy given see Table 1 | The patient groups showed no differences in sperm outcomes between therapy (carnitine) and placebo groups. Six pregnancies in the carnitine group and nil in the placebo (first phase) | + The pregnancies obtained during the carnitine therapy period could suggest that carnitines may also lead to improvement in sperm function and fertilisation | |
| Infertile males ‐ oligoasthenoteratozoospermia N = 60 | Sperm parameters Adverse events | Sperm parameters Pregnancy rates | Y sperm parameters N no definition of pregnancy given see analysis for biochemical pregnancy Table 1 N adverse events | Four participants taking carnitine induced a pregnancy in their partner and nil in the placebo | + | |
| Infertile males ‐ oligoasthenoteratozoospermia (150) Head to head | Sperm parameters Pregnancy rates Adverse events | Sperm parameters Pregnancy rates | Y sperm parameters N no definition of pregnancy given see analysis for biochemical pregnancy Table 1 | Y 10 pregnancies in the carnitine group and 2 in the vitamin E + C group | + Lcarnitine and acetyl carnitine more effective than vitamin E + vitamin C for pregnancy, sperm parameters and no evidence of adverse events | |
| Infertile males ‐ oligoasthenoteratozoospermia (80) Head to head | Sperm parameters | Sperm parameters | Y | + Staistical significance for carnitines over vitamin E + C | ||
| Infertile males Conference abstract Crossover (N = 100) | Sperm parameters | Sperm parameters | N no data | + Sperm parameters (concentration, motility) carnitines versus placebo | ||
| Infertile males (N = 50) Conference abstract + communication with author | Sperm parameters | Sperm parameters | Y | + DNA fragmentation | ||
| Idiopathic asthenospermia (N = 47) | Sperm parameters | N medians only given for sperm parameters Analysis 3.2; Analysis 3.4 | + | |||
| Idiopathic asthenospermia (N = 90) | Sperm parameters | Y | + Significant improvement in sperm motility in pentoxifylline versus no treatment | |||
| Idiopathic asthenospermia (N = 180) | Sperm parameters | Y | + Sexual satisfaction Significant improvement in sperm motility | |||
| Idiopathic oligoasthenospermia (N = 60) | Sperm parameters | Y | ‐ | |||
| Oligoasthenospermia head to head (N = 20) | Sperm parameters | N no data available | + Vitamin E + selenium associated with improved sperm motility when compared with vitamin B | |||
| Asthenospermia (N = 100) | Sperm parameters | Sperm parameters pregnancy and live birth | Y pregnancy and live birth only N sperm parameters not appropriate for review | + Pregnancy or live birth and sperm parameters | ||
| Asthenospermia (N = 100) | Sperm parameters | Y | + | |||
| Infertile men (N = 30) (crossover) | Sperm parameters | Y Y biochemical pregnancies Table 1 | + Sperm outcomes + biochemical pregnancies | |||
| Infertile men (N = 60) conference abstract | Sperm parameters | N | + Sperm concentration and motility with L‐carnitine and spermotrend | |||
| Oligozoospermia (N = 64) crossover | Sperm parameters Pregnancy rates | N bar graph of % patients showing an increase in motility and density Y pregnancy data included in biochemical analysis Table 1 | ‐ Arginine was no more effective than placebo for sperm parameters and biochemical pregnancy rates | |||
| Asthenospermia (N = 33) | Sperm parameters Pregnancy rates | Y | No adverse events or pregnancies in either group | ‐ No difference vitamin E + C versus placebo | ||
| Idiopathic oligozoospermia (N = 468) | Sperm parameters | Y | + N acetylcysteine, selenium | |||
| Idiopathic oligozoospermia (N = 212) | Sperm parameters | Y | + Coenzyme Q10 | |||
| Idiopathic infertility (N = 254) | Sperm parameters | Y | Adverse events, sperm concentration and motility | + Pentoxifylline | ||
| Idiopathic infertility (N=228) | Sperm parameters | Y | + Coenzyme Q10 | |||
| Reduced sperm motility (N = 69) | Sperm parameters Pregnancy | Y N due to pregnancy data pooled in the two intervention groups | + Sperm motility and pregnancy, combined antioxidants and selenium | |||
| Low sperm motility (N = 26) | Sperm parameters Pregnancy | Y | _ Carnitine | |||
| Subnormal spermatogenesis ‐ prostatitis (N = 30) Russian | Sperm parameters | N no sd given see Analysis 1.8 | + Selenium + zinc | |||
| Asthenospermia (N = 110) | Sperm parameters | Sperm parameters Pregnancy Live birth Miscarriage | Y Y Y Y | + Vit E | ||
| Male factor infertility (N = 60) | Pregnancy Side effects | Pregnancy Side effects | Y | + Menevit | ||
| Idiopathic oligozoospermia (N = 46) | Sperm parameters Pregnancy | Y no data on motility available | ‐ Pentoxifylline | |||
| Asthenospermia (N = 135) Chinese | Sperm parameters Pregnancy | Sperm parameters pregnancy | Y | + Sperm motility, pregnancy ‐ Sperm density and normal morphology | ||
| Subfertile males (N = 103) | Sperm parameters | N Medians only see Analysis 1.10;and Analysis 1.16 | + Folic acid + zinc | |||
| Men attending andrology clinic (N = 22) conference abstract | Sperm parameters including DNA fragmentation | N only before and after median data given | + DNA fragmentation but ‐ Other sperm parameters Combined antioxidants and fatty acids (DHA) | |||
| Idiopathic infertility (N = 20) | Sperm parameters Clinical pregnancy | Y | ‐ Magnesium |
| Outcome or subgroup title | No. of studies | No. of participants | Statistical method | Effect size |
| 1 Live birth; type of antioxidant Show forest plot | 4 | 277 | Peto Odds Ratio (Peto, Fixed, 95% CI) | 4.21 [2.08, 8.51] |
| 1.1 Vitamin E versus placebo | 2 | 117 | Peto Odds Ratio (Peto, Fixed, 95% CI) | 6.44 [1.72, 24.04] |
| 1.2 Zinc versus no treatment | 1 | 100 | Peto Odds Ratio (Peto, Fixed, 95% CI) | 3.74 [1.02, 13.74] |
| 1.3 Combined antioxidants versus placebo | 1 | 60 | Peto Odds Ratio (Peto, Fixed, 95% CI) | 3.42 [1.15, 10.13] |
| 2 Live birth; IVF/ICSI Show forest plot | 2 | 90 | Peto Odds Ratio (Peto, Fixed, 95% CI) | 3.61 [1.27, 10.29] |
| 3 Clinical pregnancy; type of antioxidant Show forest plot | 7 | 522 | Peto Odds Ratio (Peto, Fixed, 95% CI) | 3.43 [1.92, 6.11] |
| 3.1 Combined antioxidants versus placebo | 1 | 60 | Peto Odds Ratio (Peto, Fixed, 95% CI) | 2.44 [0.84, 7.13] |
| 3.2 Magnesium versus placebo | 1 | 26 | Peto Odds Ratio (Peto, Fixed, 95% CI) | 8.73 [0.17, 445.08] |
| 3.3 Vitamin E versus placebo | 2 | 117 | Peto Odds Ratio (Peto, Fixed, 95% CI) | 6.71 [1.98, 22.69] |
| 3.4 Zinc versus placebo or no treatment | 2 | 153 | Peto Odds Ratio (Peto, Fixed, 95% CI) | 4.43 [1.39, 14.14] |
| 3.5 N‐acetylcysteine versus no treatment | 1 | 60 | Peto Odds Ratio (Peto, Fixed, 95% CI) | 1.60 [0.42, 6.16] |
| 3.6 Zinc plus folic acid versus placebo | 1 | 53 | Peto Odds Ratio (Peto, Fixed, 95% CI) | 3.86 [0.15, 99.84] |
| 3.7 Folic acid versus placebo | 1 | 53 | Peto Odds Ratio (Peto, Fixed, 95% CI) | 0.0 [0.0, 0.0] |
| 4 Clinical pregnancy; IVF/ICSI Show forest plot | 2 | 90 | Peto Odds Ratio (Peto, Fixed, 95% CI) | 2.64 [0.94, 7.41] |
| 5 Adverse events Show forest plot | 8 | Peto Odds Ratio (Peto, Fixed, 95% CI) | Subtotals only | |
| 5.1 Miscarriage | 3 | 247 | Peto Odds Ratio (Peto, Fixed, 95% CI) | 1.74 [0.40, 7.60] |
| 5.2 Gastrointestinal | 6 | 429 | Peto Odds Ratio (Peto, Fixed, 95% CI) | 1.60 [0.47, 5.50] |
| 5.3 Euphoria | 1 | 86 | Peto Odds Ratio (Peto, Fixed, 95% CI) | 1.21 [0.16, 9.01] |
| 5.4 Ectopic pregnancy | 1 | 60 | Peto Odds Ratio (Peto, Fixed, 95% CI) | 4.48 [0.07, 286.49] |
| 6 Sperm DNA fragmentation; type of antioxidant Show forest plot | 2 | 100 | Mean Difference (IV, Fixed, 95% CI) | ‐13.85 [‐17.28, ‐10.41] |
| 6.1 Vitamin C + vitamin E versus placebo at 2 months | 1 | 64 | Mean Difference (IV, Fixed, 95% CI) | ‐13.80 [‐17.50, ‐10.10] |
| 6.2 Docosahexaenoic acid (DHA) 1000mg/day versus placebo at 10 weeks | 1 | 36 | Mean Difference (IV, Fixed, 95% CI) | ‐14.12 [‐23.23, ‐5.01] |
| 7 Total sperm motility at 3 months or less; type of antioxidant Show forest plot | 16 | 1039 | Mean Difference (IV, Random, 95% CI) | 10.02 [3.79, 16.25] |
| 7.1 Docosahexaenoic acid (DHA) 400mg/day versus placebo | 1 | 18 | Mean Difference (IV, Random, 95% CI) | ‐7.80 [‐27.79, 12.19] |
| 7.2 Docosahexaenoic acid (DHA) 800mg/day vs placebo | 1 | 19 | Mean Difference (IV, Random, 95% CI) | ‐15.20 [‐30.92, 0.52] |
| 7.3 Docosahexaenoic acid (DHA) 1000mg/day versus placebo at 10 weeks | 1 | 36 | Mean Difference (IV, Random, 95% CI) | ‐6.45 [‐17.64, 4.74] |
| 7.4 Vitamin C acid 200mg/day versus placebo | 1 | 20 | Mean Difference (IV, Random, 95% CI) | 2.0 [‐18.82, 22.82] |
| 7.5 Vitamin C 1000mg/day versus placebo | 1 | 20 | Mean Difference (IV, Random, 95% CI) | 45.0 [19.72, 70.28] |
| 7.6 Vitamin C + Vitamin E versus placebo at 2 months | 2 | 95 | Mean Difference (IV, Random, 95% CI) | 1.46 [‐5.82, 8.74] |
| 7.7 Carnitines versus placebo or no treatment at 3 months | 3 | 99 | Mean Difference (IV, Random, 95% CI) | 15.32 [‐3.70, 34.35] |
| 7.8 Selenium versus placebo at 3 months | 1 | 34 | Mean Difference (IV, Random, 95% CI) | 14.9 [1.14, 28.66] |
| 7.9 Combined antioxidants versus placebo or no treatment at 3 months | 2 | 228 | Mean Difference (IV, Random, 95% CI) | 15.13 [13.56, 16.69] |
| 7.10 N‐acetylcysteine versus placebo/no treatment at 3 months | 2 | 180 | Mean Difference (IV, Random, 95% CI) | 7.65 [0.68, 14.62] |
| 7.11 Magnesium versus placebo at 90 days | 1 | 20 | Mean Difference (IV, Random, 95% CI) | 14.5 [‐6.01, 35.01] |
| 7.12 Zinc versus no treatment or placebo at 3 months | 2 | 76 | Mean Difference (IV, Random, 95% CI) | 14.66 [‐5.91, 35.24] |
| 7.13 Zinc + Vitamin E versus no treatment at 3 months | 1 | 20 | Mean Difference (IV, Random, 95% CI) | 26.0 [12.85, 39.15] |
| 7.14 Zinc + Vitamin E + Vitamin C versus no treatment at 3 months | 1 | 22 | Mean Difference (IV, Random, 95% CI) | 26.0 [12.62, 39.38] |
| 7.15 Coenzyme Q10 versus placebo | 1 | 47 | Mean Difference (IV, Random, 95% CI) | 3.58 [‐6.16, 13.32] |
| 7.16 Zinc plus folic acid versus placebo | 1 | 54 | Mean Difference (IV, Random, 95% CI) | 6.80 [‐2.84, 16.44] |
| 7.17 Folic acid versus placebo | 1 | 51 | Mean Difference (IV, Random, 95% CI) | 8.40 [‐0.99, 17.79] |
| 8 Total sperm motility at 3 months or less (data not suitable for meta analysis) Show forest plot | Other data | No numeric data | ||
| 8.1 L‐carnitine + Acetyl‐carnitine versus placebo (median and interquartile range) | Other data | No numeric data | ||
| 8.2 Combined antioxidants versus no treatment | Other data | No numeric data | ||
| 8.3 Vitamin E versus placebo | Other data | No numeric data | ||
| 8.4 L‐carnitine versus placebo | Other data | No numeric data | ||
| 8.5 Selenium + Zinc versus placebo | Other data | No numeric data | ||
| 9 Total sperm motility at 6 months; type of antioxidant Show forest plot | 9 | Mean Difference (IV, Random, 95% CI) | Subtotals only | |
| 9.1 Carnitines versus placebo at 6 months | 3 | 107 | Mean Difference (IV, Random, 95% CI) | 7.28 [‐9.47, 24.02] |
| 9.2 Selenium versus placebo at 26 weeks (6 months) | 1 | 140 | Mean Difference (IV, Random, 95% CI) | 3.20 [2.28, 4.12] |
| 9.3 N‐acetyl‐cysteine versus placebo at 26 weeks (6months) | 1 | 140 | Mean Difference (IV, Random, 95% CI) | 1.90 [0.98, 2.82] |
| 9.4 Selenium plus N‐acetyl‐cysteine versus placebo at 26 weeks (6months) | 1 | 139 | Mean Difference (IV, Random, 95% CI) | 6.30 [5.38, 7.22] |
| 9.5 Coenzyme Q10 versus placebo at 6 months | 3 | 479 | Mean Difference (IV, Random, 95% CI) | 6.58 [1.80, 11.37] |
| 9.6 Vitamin E versus placebo at 6 months | 1 | 87 | Mean Difference (IV, Random, 95% CI) | 13.0 [7.02, 18.98] |
| 9.7 Zinc versus placebo | 1 | 40 | Mean Difference (IV, Random, 95% CI) | 0.0 [‐10.19, 10.19] |
| 9.8 Zinc plus folic acid versus placebo | 1 | 37 | Mean Difference (IV, Random, 95% CI) | 2.60 [‐8.82, 14.02] |
| 9.9 Folic acid versus placebo | 1 | 34 | Mean Difference (IV, Random, 95% CI) | 1.70 [‐8.49, 11.89] |
| 10 Total sperm motility at 6 months(data not suitable for meta analysis) Show forest plot | Other data | No numeric data | ||
| 10.1 L‐carnitine + Acetyl‐carnitine versus placebo (median and interquartile range) | Other data | No numeric data | ||
| 10.2 Folic acid versus placebo | Other data | No numeric data | ||
| 10.3 Zinc versus placebo | Other data | No numeric data | ||
| 10.4 Zinc + folic acid versus placebo | Other data | No numeric data | ||
| 11 Total sperm motility at 9 months or more; type of antioxidant Show forest plot | 4 | Mean Difference (IV, Random, 95% CI) | Subtotals only | |
| 11.1 L‐carnitine versus placebo at 9 months | 1 | 20 | Mean Difference (IV, Random, 95% CI) | 11.54 [1.66, 21.42] |
| 11.2 L‐acetyl carnitine versus placebo at 9 months | 1 | 20 | Mean Difference (IV, Random, 95% CI) | 7.84 [‐1.41, 17.09] |
| 11.3 L‐carnitine + L‐acetyl carnitine versus placebo at 9 months | 1 | 20 | Mean Difference (IV, Random, 95% CI) | 6.27 [‐3.36, 15.90] |
| 11.4 Coenzyme Q10 versus placebo at 9 months | 3 | 479 | Mean Difference (IV, Random, 95% CI) | 1.88 [‐1.58, 5.34] |
| 12 Total sperm motility over time Show forest plot | 23 | Mean Difference (IV, Random, 95% CI) | Subtotals only | |
| 12.1 Total sperm motility at 3 months or less | 16 | 832 | Mean Difference (IV, Random, 95% CI) | 9.55 [2.12, 16.97] |
| 12.2 Total sperm motility at 6 months | 9 | 964 | Mean Difference (IV, Random, 95% CI) | 6.86 [3.78, 9.94] |
| 12.3 Total sperm motility at 9 months or more | 4 | 509 | Mean Difference (IV, Random, 95% CI) | 3.17 [‐0.10, 6.45] |
| 13 Sperm concentration at 3 months or less; type of antioxidant Show forest plot | 13 | Mean Difference (IV, Random, 95% CI) | Subtotals only | |
| 13.1 Docosahexaenoic acid (DHA) 400g/day versus placebo | 1 | 18 | Mean Difference (IV, Random, 95% CI) | ‐5.30 [‐41.09, 30.49] |
| 13.2 Docosahexaenoic acid (DHA) 800g/day versus placebo | 1 | 19 | Mean Difference (IV, Random, 95% CI) | 1.50 [‐35.23, 38.23] |
| 13.3 Docosahexaenoic acid (DHA) 1000mg/day versus placebo at 10 weeks | 1 | 36 | Mean Difference (IV, Random, 95% CI) | ‐1.38 [‐18.78, 16.02] |
| 13.4 Magnesium versus placebo at 90 days | 1 | 20 | Mean Difference (IV, Random, 95% CI) | 5.20 [‐2.61, 13.01] |
| 13.5 Vitamin C + Vitamin E versus placebo at 2 months | 2 | 95 | Mean Difference (IV, Random, 95% CI) | 1.36 [‐10.01, 12.72] |
| 13.6 N‐acetylcysteine versus placebo at 3 months | 1 | 120 | Mean Difference (IV, Random, 95% CI) | ‐0.47 [‐6.70, 5.76] |
| 13.7 Carnitines versus placebo | 2 | 78 | Mean Difference (IV, Random, 95% CI) | 14.29 [‐15.50, 44.08] |
| 13.8 Coenzyme Q10 versus placebo | 1 | 47 | Mean Difference (IV, Random, 95% CI) | ‐0.12 [‐12.39, 12.15] |
| 13.9 N‐acetylcysteine versus no treatment | 1 | 60 | Mean Difference (IV, Random, 95% CI) | 4.72 [‐0.31, 9.75] |
| 13.10 Combined antioxidants versus placebo or no treatment | 2 | 219 | Mean Difference (IV, Random, 95% CI) | ‐0.89 [‐1.84, 0.06] |
| 13.11 Zinc plus folic acid versus placebo | 1 | 37 | Mean Difference (IV, Random, 95% CI) | 18.0 [1.13, 34.87] |
| 13.12 Folic acid versus placebo | 1 | 34 | Mean Difference (IV, Random, 95% CI) | 22.20 [3.79, 40.61] |
| 13.13 Zinc versus placebo | 1 | 40 | Mean Difference (IV, Random, 95% CI) | 16.9 [0.53, 33.27] |
| 13.14 Selenium versus placebo | 1 | 25 | Mean Difference (IV, Random, 95% CI) | 21.20 [‐11.45, 53.85] |
| 14 Sperm concentration at 3 months or less (data not suitable for meta analysis) Show forest plot | Other data | No numeric data | ||
| 14.1 L‐carnitine + Acetyl‐carnitine versus placebo (median and interquartile range) | Other data | No numeric data | ||
| 14.2 Vitamin E versus placebo | Other data | No numeric data | ||
| 14.3 L‐carnitine versus placebo | Other data | No numeric data | ||
| 15 Sperm concentration at 6 months; type of antioxidant Show forest plot | 7 | Mean Difference (IV, Random, 95% CI) | Subtotals only | |
| 15.1 Carnitines versus placebo at 6 months | 2 | 116 | Mean Difference (IV, Random, 95% CI) | 2.59 [‐3.11, 8.30] |
| 15.2 Selenium versus placebo at 26 weeks (6 months) | 1 | 140 | Mean Difference (IV, Random, 95% CI) | 4.10 [1.82, 6.38] |
| 15.3 N‐acetyl‐cysteine versus placebo at 26 weeks (6months) | 1 | 140 | Mean Difference (IV, Random, 95% CI) | 3.30 [1.13, 5.47] |
| 15.4 Selenium plus N‐acetyl‐cysteine versus placebo at 26 weeks (6months) | 1 | 139 | Mean Difference (IV, Random, 95% CI) | 8.60 [6.28, 10.92] |
| 15.5 Coenzyme Q10 versus placebo at 6 months | 3 | 479 | Mean Difference (IV, Random, 95% CI) | 6.88 [1.20, 12.56] |
| 15.6 Zinc plus folic acid versus placebo | 1 | 37 | Mean Difference (IV, Random, 95% CI) | 17.70 [‐1.88, 37.28] |
| 15.7 Folic acid versus placebo | 1 | 34 | Mean Difference (IV, Random, 95% CI) | 19.20 [4.74, 33.66] |
| 15.8 Zinc versus placebo | 1 | 40 | Mean Difference (IV, Random, 95% CI) | 9.70 [‐7.01, 26.41] |
| 16 Sperm concentration at 6 months(data not suitable for meta analysis) Show forest plot | Other data | No numeric data | ||
| 16.1 L‐carnitine + acetyl‐carnitine versus placebo | Other data | No numeric data | ||
| 16.2 Folic acid versus Placebo | Other data | No numeric data | ||
| 16.3 Zinc versus Placebo | Other data | No numeric data | ||
| 16.4 Zinc + folic acid versus placebo | Other data | No numeric data | ||
| 17 Sperm concentration at 9 months; type of antioxidant Show forest plot | 4 | Mean Difference (IV, Random, 95% CI) | Subtotals only | |
| 17.1 Carnitines versus placebo at 9 months | 1 | 60 | Mean Difference (IV, Random, 95% CI) | 4.12 [‐1.74, 9.99] |
| 17.2 Coenzyme Q10 versus placebo at 9 months or more | 3 | 479 | Mean Difference (IV, Random, 95% CI) | 2.74 [‐1.56, 7.05] |
| 18 Sperm concentration over time Show forest plot | 20 | Mean Difference (IV, Random, 95% CI) | Subtotals only | |
| 18.1 Sperm concentration at 3 months or less | 13 | 746 | Mean Difference (IV, Random, 95% CI) | 5.32 [‐0.62, 11.26] |
| 18.2 Sperm concentration 6 months | 8 | 851 | Mean Difference (IV, Random, 95% CI) | 5.46 [1.81, 9.11] |
| 18.3 Sperm concentration at 9 months or more | 4 | 509 | Mean Difference (IV, Random, 95% CI) | 3.66 [‐0.31, 7.64] |
| Outcome or subgroup title | No. of studies | No. of participants | Statistical method | Effect size |
| 1 Total sperm motility at 3 months or less; type of antioxidant Show forest plot | 8 | Mean Difference (IV, Fixed, 95% CI) | Subtotals only | |
| 1.1 Ethylcysteine 600mg/day vs Vitamin E | 1 | 10 | Mean Difference (IV, Fixed, 95% CI) | ‐1.90 [‐41.97, 38.17] |
| 1.2 Docosahexaenoic acid (DHA) 400g/day vs Docosahexaenoic acid 800mg/day | 1 | 19 | Mean Difference (IV, Fixed, 95% CI) | 7.40 [‐11.35, 26.15] |
| 1.3 Vitamin C 200mg/day versus vitamin C 1000mg/day | 1 | 20 | Mean Difference (IV, Fixed, 95% CI) | ‐43.0 [‐67.10, ‐18.90] |
| 1.4 Vitamin E + Selenium versus Vitamin B at 3 months | 1 | 54 | Mean Difference (IV, Fixed, 95% CI) | 0.0 [‐10.71, 10.71] |
| 1.5 Zinc versus Zinc + Vitamin E at 3 months | 1 | 18 | Mean Difference (IV, Fixed, 95% CI) | ‐1.0 [‐13.00, 13.00] |
| 1.6 Zinc versus Zinc + Vitamin E + Vitamin C at 3 months | 1 | 12 | Mean Difference (IV, Fixed, 95% CI) | ‐1.0 [‐19.66, 17.66] |
| 1.7 Zinc + Vitamin E versus Zinc + Vitamin E + Vitamin C at 3 months | 1 | 18 | Mean Difference (IV, Fixed, 95% CI) | 0.0 [‐18.97, 18.97] |
| 1.8 Selenium versus combined antioxidants | 1 | 46 | Mean Difference (IV, Fixed, 95% CI) | 3.20 [‐10.13, 16.53] |
| 1.9 L acetyl carnitine + L carnitine versus Vitamin E + Vitamin C | 1 | 138 | Mean Difference (IV, Fixed, 95% CI) | 23.05 [20.09, 26.01] |
| 1.10 Zinc + folic acid versus folic acid | 1 | 80 | Mean Difference (IV, Fixed, 95% CI) | ‐0.60 [‐7.74, 6.54] |
| 1.11 Zinc versus zinc + folic acid | 1 | 80 | Mean Difference (IV, Fixed, 95% CI) | ‐2.80 [‐12.91, 7.31] |
| 1.12 Zinc versus folic acid | 1 | 80 | Mean Difference (IV, Fixed, 95% CI) | ‐4.40 [‐14.21, 5.41] |
| 2 Total sperm motility at 6 months; type of antioxidant Show forest plot | 3 | Mean Difference (IV, Fixed, 95% CI) | Subtotals only | |
| 2.1 L‐acetyl carnitine + L‐carnitine versus L‐carnitine | 1 | 30 | Mean Difference (IV, Fixed, 95% CI) | ‐3.46 [‐9.72, 2.80] |
| 2.2 L‐acetyl carnitine + L‐carnitine versus L‐acetyl carnitine | 1 | 30 | Mean Difference (IV, Fixed, 95% CI) | 0.64 [‐6.37, 7.65] |
| 2.3 Selenium versus N‐acetyl‐cysteine | 1 | 234 | Mean Difference (IV, Fixed, 95% CI) | 1.30 [0.56, 2.04] |
| 2.4 Selenium versus selenium plus N‐acetyl‐cysteine | 1 | 232 | Mean Difference (IV, Fixed, 95% CI) | ‐3.10 [‐3.85, ‐2.35] |
| 2.5 N‐acetyl‐cysteine vs selenium plus N‐acetyl‐cysteine | 1 | 234 | Mean Difference (IV, Fixed, 95% CI) | ‐4.40 [‐5.14, ‐3.66] |
| 2.6 Zinc + folic acid versus folic acid | 1 | 80 | Mean Difference (IV, Fixed, 95% CI) | 0.90 [‐5.45, 7.25] |
| 2.7 Zinc versus zinc + folic acid | 1 | 80 | Mean Difference (IV, Fixed, 95% CI) | ‐2.60 [‐9.13, 3.93] |
| 2.8 Zinc versus folic acid | 1 | 80 | Mean Difference (IV, Fixed, 95% CI) | ‐1.70 [‐6.42, 3.02] |
| 3 Total sperm motility at 6 months Show forest plot | Other data | No numeric data | ||
| 3.1 Zinc versus Folic acid | Other data | No numeric data | ||
| 3.2 Zinc versus Zinc + folic acid | Other data | No numeric data | ||
| 3.3 Folic acid versus Zinc + folic acid | Other data | No numeric data | ||
| 4 Total sperm motility at 9 months or more; type of antioxidant Show forest plot | 1 | Mean Difference (IV, Fixed, 95% CI) | Subtotals only | |
| 4.1 L‐aceytl carnitine + L‐carnitine versus L‐carnitine | 1 | 30 | Mean Difference (IV, Fixed, 95% CI) | ‐5.27 [‐11.28, 0.74] |
| 4.2 L‐acetyl carnitine + L‐carnitine versus L‐acetyl carnitine | 1 | 30 | Mean Difference (IV, Fixed, 95% CI) | ‐1.57 [‐6.46, 3.32] |
| 5 Sperm concentration at 3 months or less; type of antioxidant Show forest plot | 6 | Mean Difference (IV, Fixed, 95% CI) | Subtotals only | |
| 5.1 Ethylcysteine 600mg/day vs Vitamin E | 1 | 10 | Mean Difference (IV, Fixed, 95% CI) | 2.20 [‐16.65, 21.05] |
| 5.2 Docosahexaenoic acid (DHA) 400g/day versus Docosahexaenoic acid (DHA) 800g/day | 1 | 19 | Mean Difference (IV, Fixed, 95% CI) | ‐6.80 [‐41.87, 28.27] |
| 5.3 L‐carnitine versus Vitamin E + Vitamin C | 1 | 63 | Mean Difference (IV, Fixed, 95% CI) | 15.5 [12.49, 18.51] |
| 5.4 L‐carnitine plus vitamin E versus vitamin E | 1 | 113 | Mean Difference (IV, Fixed, 95% CI) | 1.90 [‐10.52, 14.32] |
| 5.5 Selenium versus combined antioxidants | 1 | 46 | Mean Difference (IV, Fixed, 95% CI) | 14.70 [‐6.51, 35.91] |
| 5.6 Zinc + folic acid versus folic acid | 1 | 80 | Mean Difference (IV, Fixed, 95% CI) | ‐4.20 [‐22.21, 13.81] |
| 5.7 Zinc versus zinc + folic acid | 1 | 80 | Mean Difference (IV, Fixed, 95% CI) | ‐1.10 [‐18.63, 16.43] |
| 5.8 Zinc versus folic acid | 1 | 80 | Mean Difference (IV, Fixed, 95% CI) | ‐5.30 [‐23.38, 12.78] |
| 6 Sperm concentration at 6 months; type of antioxidant Show forest plot | 3 | Mean Difference (IV, Fixed, 95% CI) | Subtotals only | |
| 6.1 L‐aceytl carnitine +L‐carnitine versus L‐carnitine at 6 months | 1 | 30 | Mean Difference (IV, Fixed, 95% CI) | ‐8.13 [‐21.79, 5.53] |
| 6.2 L‐acetyl carnitine + L‐carnitine versus L‐acetyl carnitine at 6 months | 1 | 30 | Mean Difference (IV, Fixed, 95% CI) | ‐2.17 [‐15.26, 10.92] |
| 6.3 Selenium versus N‐acetyl‐cysteine at 26 weeks (6 months) | 1 | 234 | Mean Difference (IV, Fixed, 95% CI) | 0.80 [‐0.71, 2.31] |
| 6.4 Selenium versus selenium plus N‐acetyl‐cysteine at 26 weeks (6 months) | 1 | 232 | Mean Difference (IV, Fixed, 95% CI) | ‐4.5 [‐6.20, ‐2.80] |
| 6.5 N‐acetyl‐cysteine vs selenium plus N‐acetyl‐cysteine at 26 weeks | 1 | 234 | Mean Difference (IV, Fixed, 95% CI) | ‐5.30 [‐6.86, ‐3.74] |
| 6.6 Zinc + folic acid versus folic acid | 1 | 80 | Mean Difference (IV, Fixed, 95% CI) | ‐1.5 [‐15.06, 12.06] |
| 6.7 Zinc versus zinc + folic acid | 1 | 80 | Mean Difference (IV, Fixed, 95% CI) | ‐8.0 [‐23.69, 7.69] |
| 6.8 Zinc versus folic acid | 1 | 80 | Mean Difference (IV, Fixed, 95% CI) | ‐9.5 [‐20.31, 1.31] |
| 7 Sperm concentration at 6 months Show forest plot | Other data | No numeric data | ||
| 7.1 Zinc versus Folic acid | Other data | No numeric data | ||
| 7.2 Zinc versus Zinc + Folic acid | Other data | No numeric data | ||
| 7.3 Folic acid versus Zinc + folic acid | Other data | No numeric data | ||
| 8 Sperm concentration at 9 months or more; type of antioxidant Show forest plot | 1 | Mean Difference (IV, Fixed, 95% CI) | Subtotals only | |
| 8.1 L‐acetyl carnitine + L‐carnitine versus L‐carnitine at 9 months | 1 | 30 | Mean Difference (IV, Fixed, 95% CI) | ‐6.13 [‐15.99, 3.73] |
| 8.2 L‐acetyl carnitine + L‐carnitine versus L‐acetyl carnitine at 9 months | 1 | 30 | Mean Difference (IV, Fixed, 95% CI) | 2.06 [‐6.09, 10.21] |
| Outcome or subgroup title | No. of studies | No. of participants | Statistical method | Effect size |
| 1 Total sperm motility at 3 months or less; pentoxifylline versus placebo or no treatment Show forest plot | 1 | 90 | Mean Difference (IV, Fixed, 95% CI) | 12.77 [9.23, 16.31] |
| 2 Total sperm motility at 3 months or less (data not suitable for meta analysis) Show forest plot | Other data | No numeric data | ||
| 2.1 Pentoxifylline versus placebo | Other data | No numeric data | ||
| 3 Total sperm motility at 6 months; pentoxifylline versus placebo or no treatment Show forest plot | 1 | 229 | Mean Difference (IV, Fixed, 95% CI) | 10.10 [9.09, 11.11] |
| 4 Total sperm motility at 6 months (data not suitable for meta analysis) Show forest plot | Other data | No numeric data | ||
| 4.1 Pentoxifylline versus placebo | Other data | No numeric data | ||
| 5 Total sperm motility at 9 months; pentoxifylline versus placebo or no treatment Show forest plot | 1 | 221 | Mean Difference (IV, Random, 95% CI) | 3.10 [1.93, 4.27] |
| 6 Total sperm motility over time Show forest plot | 2 | Mean Difference (IV, Fixed, 95% CI) | Subtotals only | |
| 6.1 Total sperm motility at 3 months or less | 1 | 90 | Mean Difference (IV, Fixed, 95% CI) | 12.77 [9.23, 16.31] |
| 6.2 Total sperm motility at 6 months | 1 | 229 | Mean Difference (IV, Fixed, 95% CI) | 10.10 [9.09, 11.11] |
| 6.3 Total sperm motility at 9 months or more | 1 | 221 | Mean Difference (IV, Fixed, 95% CI) | 3.10 [1.93, 4.27] |
| 7 Sperm concentration at 3 months or less; pentoxifylline versus placebo or no treatment Show forest plot | 1 | 18 | Mean Difference (IV, Fixed, 95% CI) | 4.30 [‐0.69, 9.29] |
| 8 Sperm concentration at 6 months; pentoxifylline versus placebo Show forest plot | 2 | Mean Difference (IV, Random, 95% CI) | Subtotals only | |
| 9 Sperm concentration at 9 months; pentoxifylline versus placebo Show forest plot | 1 | 221 | Mean Difference (IV, Fixed, 95% CI) | 1.70 [0.62, 2.78] |
| 10 Sperm concentration over time Show forest plot | 2 | Mean Difference (IV, Random, 95% CI) | Subtotals only | |
| 10.1 Sperm concentration at 3 months or less | 1 | 18 | Mean Difference (IV, Random, 95% CI) | 4.30 [‐0.69, 9.29] |
| 10.2 Sperm concentration at 6 months | 2 | 247 | Mean Difference (IV, Random, 95% CI) | 6.90 [‐0.09, 13.89] |
| 10.3 Sperm concentration at 9 months | 1 | 221 | Mean Difference (IV, Random, 95% CI) | 1.70 [0.62, 2.78] |
| 11 Adverse events Show forest plot | 1 | Peto Odds Ratio (Peto, Fixed, 95% CI) | Subtotals only | |
| 11.1 Vomiting | 1 | 254 | Peto Odds Ratio (Peto, Fixed, 95% CI) | 4.98 [1.32, 18.81] |
| 11.2 Dyspepsia | 1 | 254 | Peto Odds Ratio (Peto, Fixed, 95% CI) | 4.68 [1.15, 19.07] |
| 11.3 Headache | 1 | 254 | Peto Odds Ratio (Peto, Fixed, 95% CI) | 2.41 [0.54, 10.78] |
| 11.4 Diarrhoea | 1 | 254 | Peto Odds Ratio (Peto, Fixed, 95% CI) | 7.63 [1.30, 44.67] |
| 11.5 Tremor | 1 | 254 | Peto Odds Ratio (Peto, Fixed, 95% CI) | 7.45 [0.46, 119.73] |
| 11.6 Dizziness | 1 | 254 | Peto Odds Ratio (Peto, Fixed, 95% CI) | 7.45 [0.46, 119.73] |
| 11.7 Vertigo | 1 | 254 | Peto Odds Ratio (Peto, Fixed, 95% CI) | 1.96 [0.20, 18.99] |