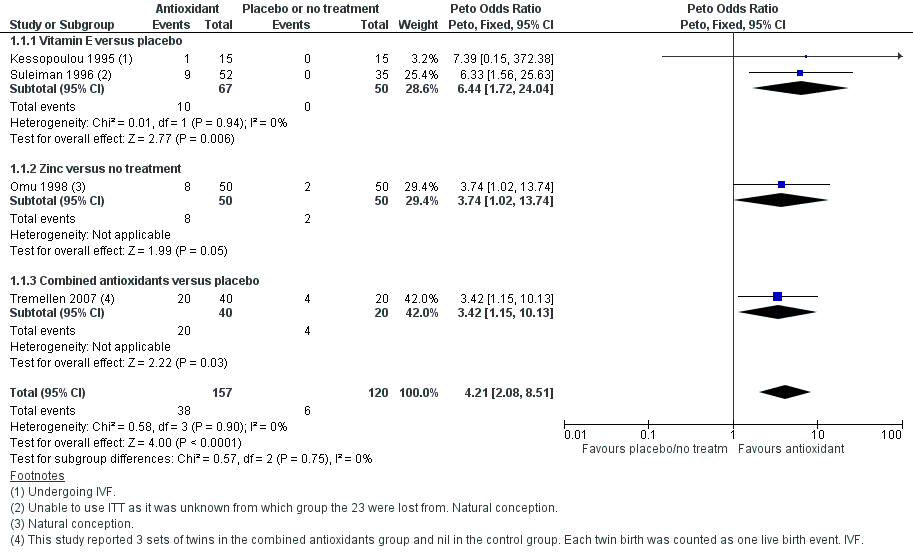
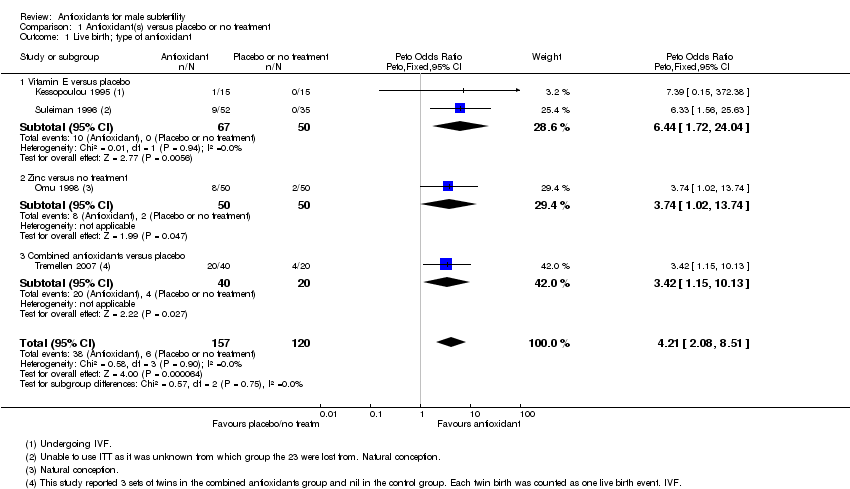
| 1 Live birth; type of antioxidant Show forest plot | 4 | 277 | Peto Odds Ratio (Peto, Fixed, 95% CI) | 4.21 [2.08, 8.51] |
|
| 1.1 Vitamin E versus placebo | 2 | 117 | Peto Odds Ratio (Peto, Fixed, 95% CI) | 6.44 [1.72, 24.04] |
| 1.2 Zinc versus no treatment | 1 | 100 | Peto Odds Ratio (Peto, Fixed, 95% CI) | 3.74 [1.02, 13.74] |
| 1.3 Combined antioxidants versus placebo | 1 | 60 | Peto Odds Ratio (Peto, Fixed, 95% CI) | 3.42 [1.15, 10.13] |
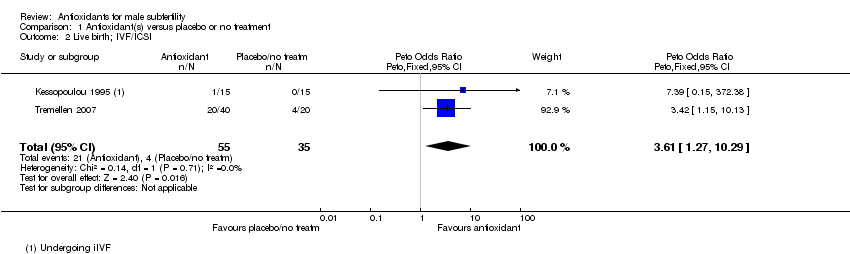
| 2 Live birth; IVF/ICSI Show forest plot | 2 | 90 | Peto Odds Ratio (Peto, Fixed, 95% CI) | 3.61 [1.27, 10.29] |
|
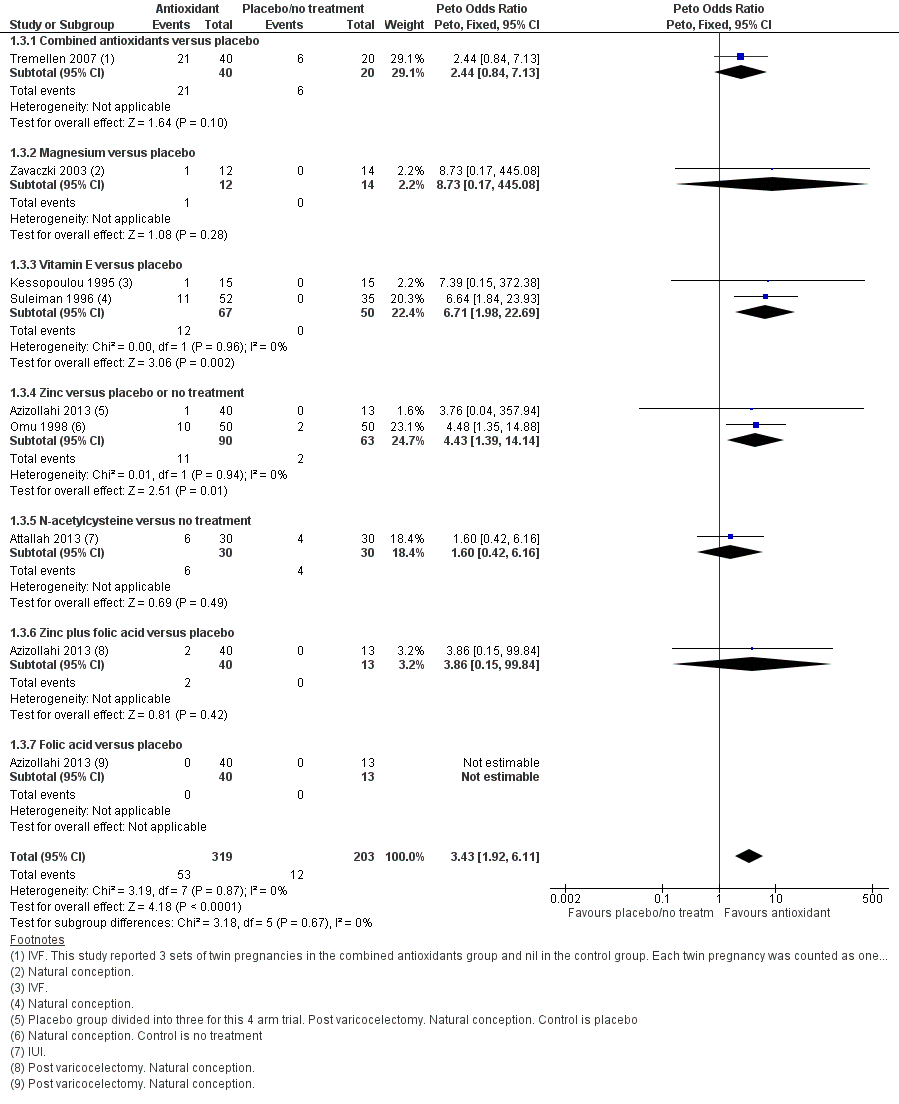
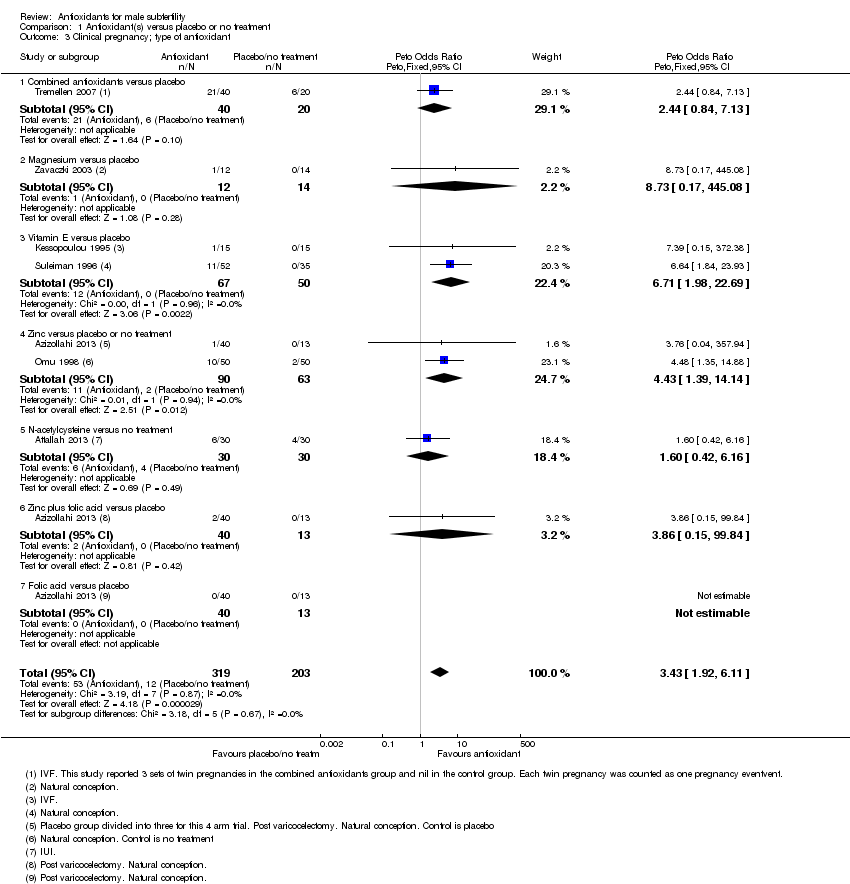
| 3 Clinical pregnancy; type of antioxidant Show forest plot | 7 | 522 | Peto Odds Ratio (Peto, Fixed, 95% CI) | 3.43 [1.92, 6.11] |
|
| 3.1 Combined antioxidants versus placebo | 1 | 60 | Peto Odds Ratio (Peto, Fixed, 95% CI) | 2.44 [0.84, 7.13] |
| 3.2 Magnesium versus placebo | 1 | 26 | Peto Odds Ratio (Peto, Fixed, 95% CI) | 8.73 [0.17, 445.08] |
| 3.3 Vitamin E versus placebo | 2 | 117 | Peto Odds Ratio (Peto, Fixed, 95% CI) | 6.71 [1.98, 22.69] |
| 3.4 Zinc versus placebo or no treatment | 2 | 153 | Peto Odds Ratio (Peto, Fixed, 95% CI) | 4.43 [1.39, 14.14] |
| 3.5 N‐acetylcysteine versus no treatment | 1 | 60 | Peto Odds Ratio (Peto, Fixed, 95% CI) | 1.60 [0.42, 6.16] |
| 3.6 Zinc plus folic acid versus placebo | 1 | 53 | Peto Odds Ratio (Peto, Fixed, 95% CI) | 3.86 [0.15, 99.84] |
| 3.7 Folic acid versus placebo | 1 | 53 | Peto Odds Ratio (Peto, Fixed, 95% CI) | 0.0 [0.0, 0.0] |
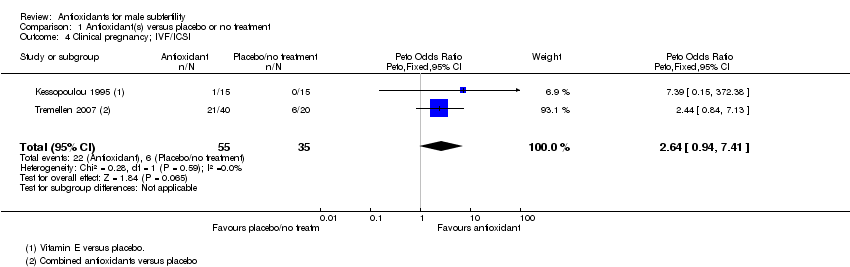
| 4 Clinical pregnancy; IVF/ICSI Show forest plot | 2 | 90 | Peto Odds Ratio (Peto, Fixed, 95% CI) | 2.64 [0.94, 7.41] |
|
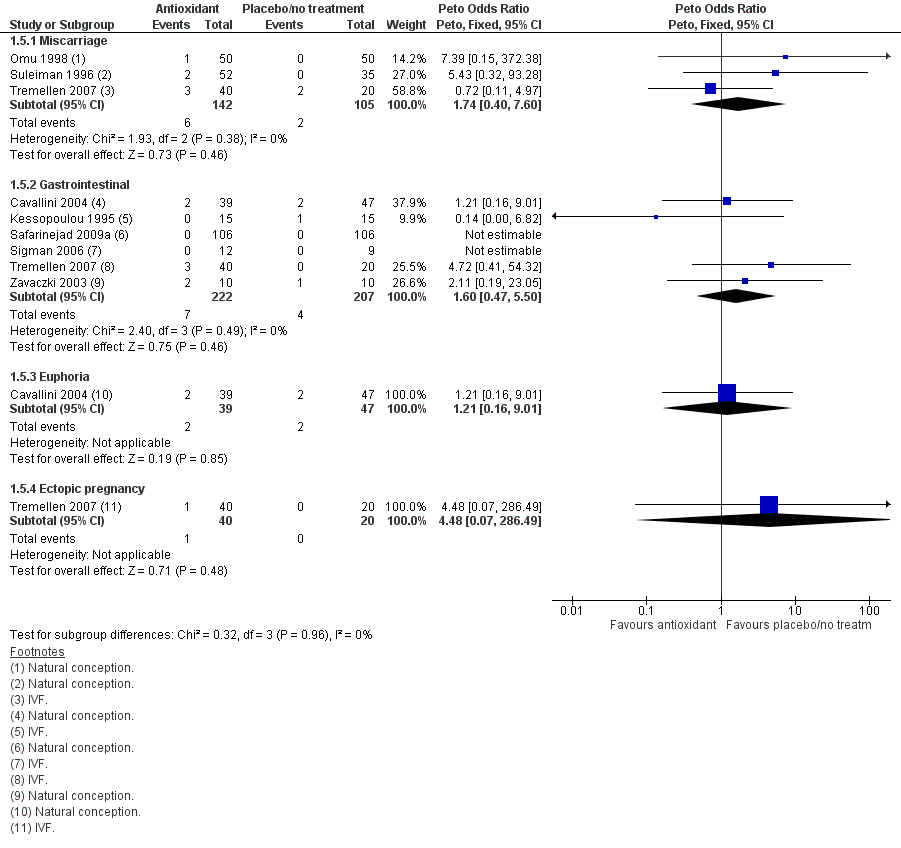
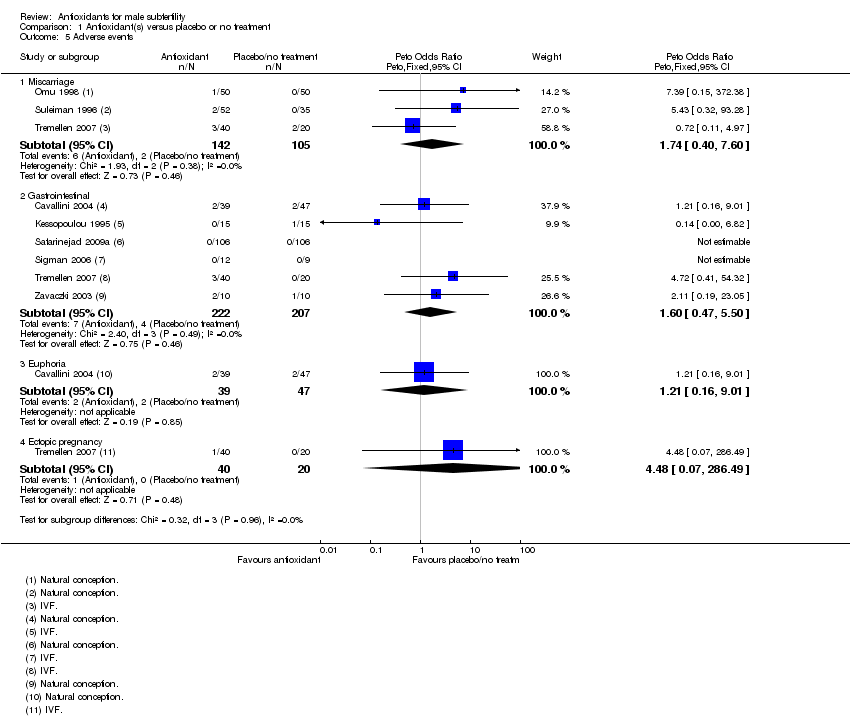
| 5 Adverse events Show forest plot | 8 | | Peto Odds Ratio (Peto, Fixed, 95% CI) | Subtotals only |
|
| 5.1 Miscarriage | 3 | 247 | Peto Odds Ratio (Peto, Fixed, 95% CI) | 1.74 [0.40, 7.60] |
| 5.2 Gastrointestinal | 6 | 429 | Peto Odds Ratio (Peto, Fixed, 95% CI) | 1.60 [0.47, 5.50] |
| 5.3 Euphoria | 1 | 86 | Peto Odds Ratio (Peto, Fixed, 95% CI) | 1.21 [0.16, 9.01] |
| 5.4 Ectopic pregnancy | 1 | 60 | Peto Odds Ratio (Peto, Fixed, 95% CI) | 4.48 [0.07, 286.49] |
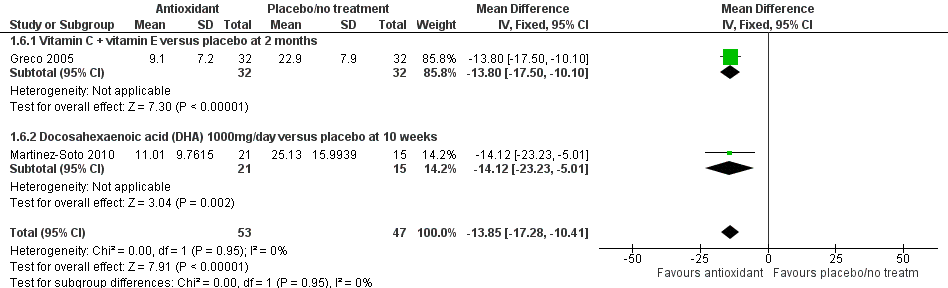
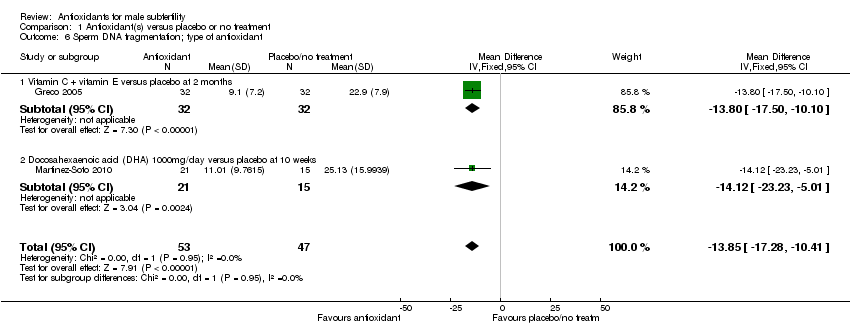
| 6 Sperm DNA fragmentation; type of antioxidant Show forest plot | 2 | 100 | Mean Difference (IV, Fixed, 95% CI) | ‐13.85 [‐17.28, ‐10.41] |
|
| 6.1 Vitamin C + vitamin E versus placebo at 2 months | 1 | 64 | Mean Difference (IV, Fixed, 95% CI) | ‐13.80 [‐17.50, ‐10.10] |
| 6.2 Docosahexaenoic acid (DHA) 1000mg/day versus placebo at 10 weeks | 1 | 36 | Mean Difference (IV, Fixed, 95% CI) | ‐14.12 [‐23.23, ‐5.01] |
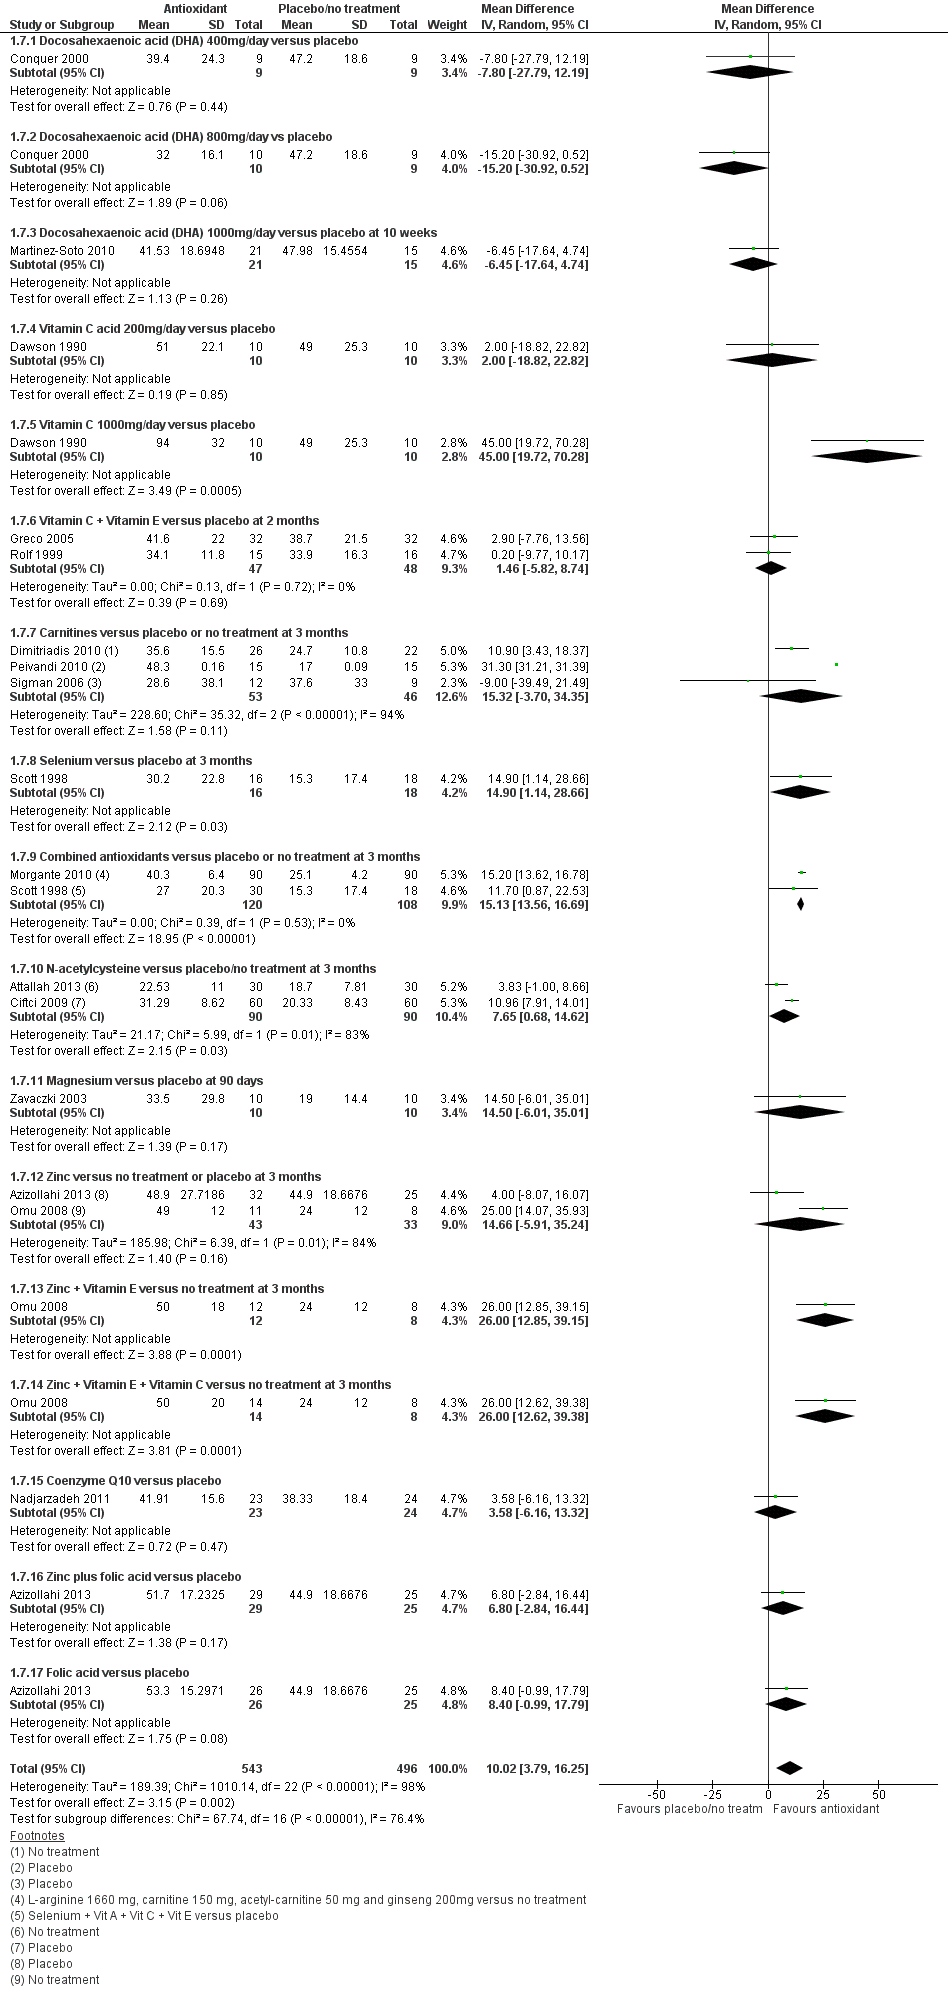
| 7 Total sperm motility at 3 months or less; type of antioxidant Show forest plot | 16 | 1039 | Mean Difference (IV, Random, 95% CI) | 10.02 [3.79, 16.25] |
|
| 7.1 Docosahexaenoic acid (DHA) 400mg/day versus placebo | 1 | 18 | Mean Difference (IV, Random, 95% CI) | ‐7.80 [‐27.79, 12.19] |
| 7.2 Docosahexaenoic acid (DHA) 800mg/day vs placebo | 1 | 19 | Mean Difference (IV, Random, 95% CI) | ‐15.20 [‐30.92, 0.52] |
| 7.3 Docosahexaenoic acid (DHA) 1000mg/day versus placebo at 10 weeks | 1 | 36 | Mean Difference (IV, Random, 95% CI) | ‐6.45 [‐17.64, 4.74] |
| 7.4 Vitamin C acid 200mg/day versus placebo | 1 | 20 | Mean Difference (IV, Random, 95% CI) | 2.0 [‐18.82, 22.82] |
| 7.5 Vitamin C 1000mg/day versus placebo | 1 | 20 | Mean Difference (IV, Random, 95% CI) | 45.0 [19.72, 70.28] |
| 7.6 Vitamin C + Vitamin E versus placebo at 2 months | 2 | 95 | Mean Difference (IV, Random, 95% CI) | 1.46 [‐5.82, 8.74] |
| 7.7 Carnitines versus placebo or no treatment at 3 months | 3 | 99 | Mean Difference (IV, Random, 95% CI) | 15.32 [‐3.70, 34.35] |
| 7.8 Selenium versus placebo at 3 months | 1 | 34 | Mean Difference (IV, Random, 95% CI) | 14.9 [1.14, 28.66] |
| 7.9 Combined antioxidants versus placebo or no treatment at 3 months | 2 | 228 | Mean Difference (IV, Random, 95% CI) | 15.13 [13.56, 16.69] |
| 7.10 N‐acetylcysteine versus placebo/no treatment at 3 months | 2 | 180 | Mean Difference (IV, Random, 95% CI) | 7.65 [0.68, 14.62] |
| 7.11 Magnesium versus placebo at 90 days | 1 | 20 | Mean Difference (IV, Random, 95% CI) | 14.5 [‐6.01, 35.01] |
| 7.12 Zinc versus no treatment or placebo at 3 months | 2 | 76 | Mean Difference (IV, Random, 95% CI) | 14.66 [‐5.91, 35.24] |
| 7.13 Zinc + Vitamin E versus no treatment at 3 months | 1 | 20 | Mean Difference (IV, Random, 95% CI) | 26.0 [12.85, 39.15] |
| 7.14 Zinc + Vitamin E + Vitamin C versus no treatment at 3 months | 1 | 22 | Mean Difference (IV, Random, 95% CI) | 26.0 [12.62, 39.38] |
| 7.15 Coenzyme Q10 versus placebo | 1 | 47 | Mean Difference (IV, Random, 95% CI) | 3.58 [‐6.16, 13.32] |
| 7.16 Zinc plus folic acid versus placebo | 1 | 54 | Mean Difference (IV, Random, 95% CI) | 6.80 [‐2.84, 16.44] |
| 7.17 Folic acid versus placebo | 1 | 51 | Mean Difference (IV, Random, 95% CI) | 8.40 [‐0.99, 17.79] |
| 8 Total sperm motility at 3 months or less (data not suitable for meta analysis) Show forest plot | | | Other data | No numeric data |
|
| 8.1 L‐carnitine + Acetyl‐carnitine versus placebo (median and interquartile range) | | | Other data | No numeric data |
| 8.2 Combined antioxidants versus no treatment | | | Other data | No numeric data |
| 8.3 Vitamin E versus placebo | | | Other data | No numeric data |
| 8.4 L‐carnitine versus placebo | | | Other data | No numeric data |
| 8.5 Selenium + Zinc versus placebo | | | Other data | No numeric data |
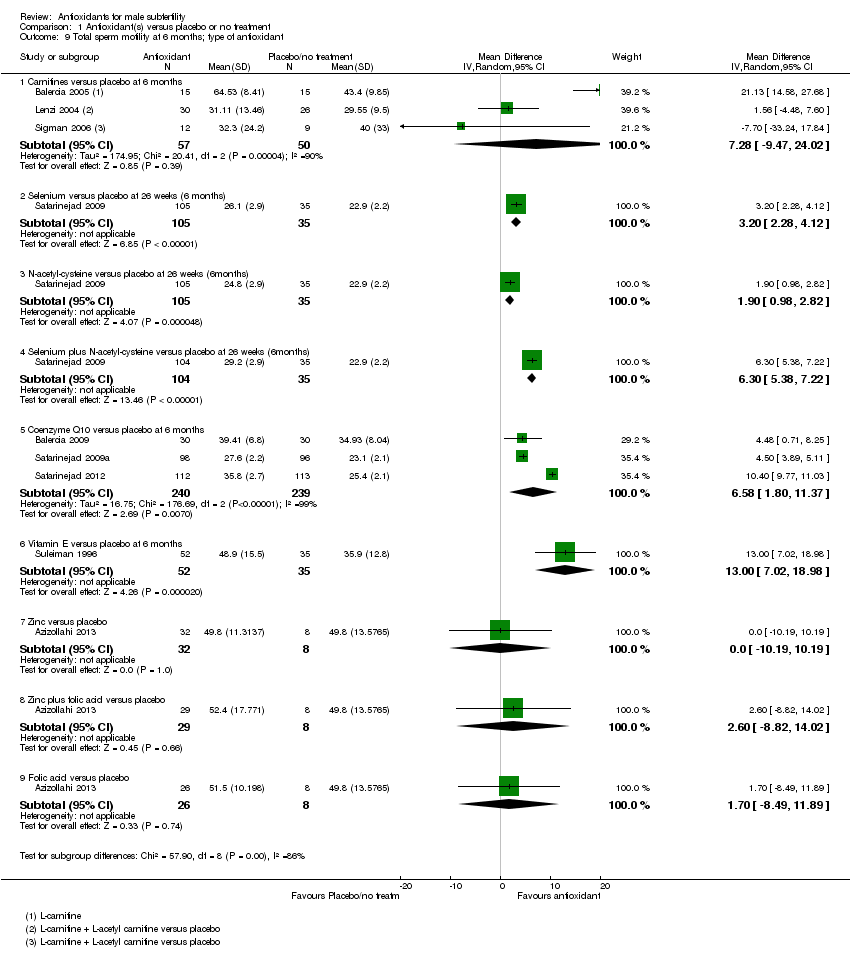
| 9 Total sperm motility at 6 months; type of antioxidant Show forest plot | 9 | | Mean Difference (IV, Random, 95% CI) | Subtotals only |
|
| 9.1 Carnitines versus placebo at 6 months | 3 | 107 | Mean Difference (IV, Random, 95% CI) | 7.28 [‐9.47, 24.02] |
| 9.2 Selenium versus placebo at 26 weeks (6 months) | 1 | 140 | Mean Difference (IV, Random, 95% CI) | 3.20 [2.28, 4.12] |
| 9.3 N‐acetyl‐cysteine versus placebo at 26 weeks (6months) | 1 | 140 | Mean Difference (IV, Random, 95% CI) | 1.90 [0.98, 2.82] |
| 9.4 Selenium plus N‐acetyl‐cysteine versus placebo at 26 weeks (6months) | 1 | 139 | Mean Difference (IV, Random, 95% CI) | 6.30 [5.38, 7.22] |
| 9.5 Coenzyme Q10 versus placebo at 6 months | 3 | 479 | Mean Difference (IV, Random, 95% CI) | 6.58 [1.80, 11.37] |
| 9.6 Vitamin E versus placebo at 6 months | 1 | 87 | Mean Difference (IV, Random, 95% CI) | 13.0 [7.02, 18.98] |
| 9.7 Zinc versus placebo | 1 | 40 | Mean Difference (IV, Random, 95% CI) | 0.0 [‐10.19, 10.19] |
| 9.8 Zinc plus folic acid versus placebo | 1 | 37 | Mean Difference (IV, Random, 95% CI) | 2.60 [‐8.82, 14.02] |
| 9.9 Folic acid versus placebo | 1 | 34 | Mean Difference (IV, Random, 95% CI) | 1.70 [‐8.49, 11.89] |
| 10 Total sperm motility at 6 months(data not suitable for meta analysis) Show forest plot | | | Other data | No numeric data |
|
| 10.1 L‐carnitine + Acetyl‐carnitine versus placebo (median and interquartile range) | | | Other data | No numeric data |
| 10.2 Folic acid versus placebo | | | Other data | No numeric data |
| 10.3 Zinc versus placebo | | | Other data | No numeric data |
| 10.4 Zinc + folic acid versus placebo | | | Other data | No numeric data |
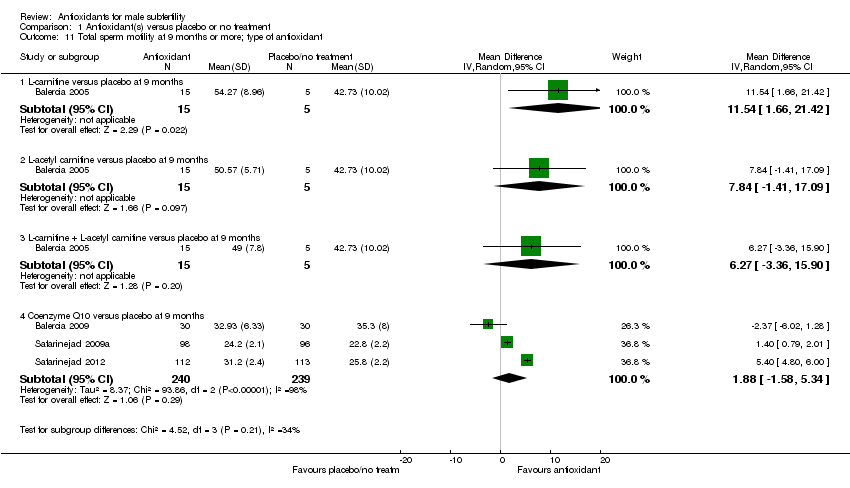
| 11 Total sperm motility at 9 months or more; type of antioxidant Show forest plot | 4 | | Mean Difference (IV, Random, 95% CI) | Subtotals only |
|
| 11.1 L‐carnitine versus placebo at 9 months | 1 | 20 | Mean Difference (IV, Random, 95% CI) | 11.54 [1.66, 21.42] |
| 11.2 L‐acetyl carnitine versus placebo at 9 months | 1 | 20 | Mean Difference (IV, Random, 95% CI) | 7.84 [‐1.41, 17.09] |
| 11.3 L‐carnitine + L‐acetyl carnitine versus placebo at 9 months | 1 | 20 | Mean Difference (IV, Random, 95% CI) | 6.27 [‐3.36, 15.90] |
| 11.4 Coenzyme Q10 versus placebo at 9 months | 3 | 479 | Mean Difference (IV, Random, 95% CI) | 1.88 [‐1.58, 5.34] |
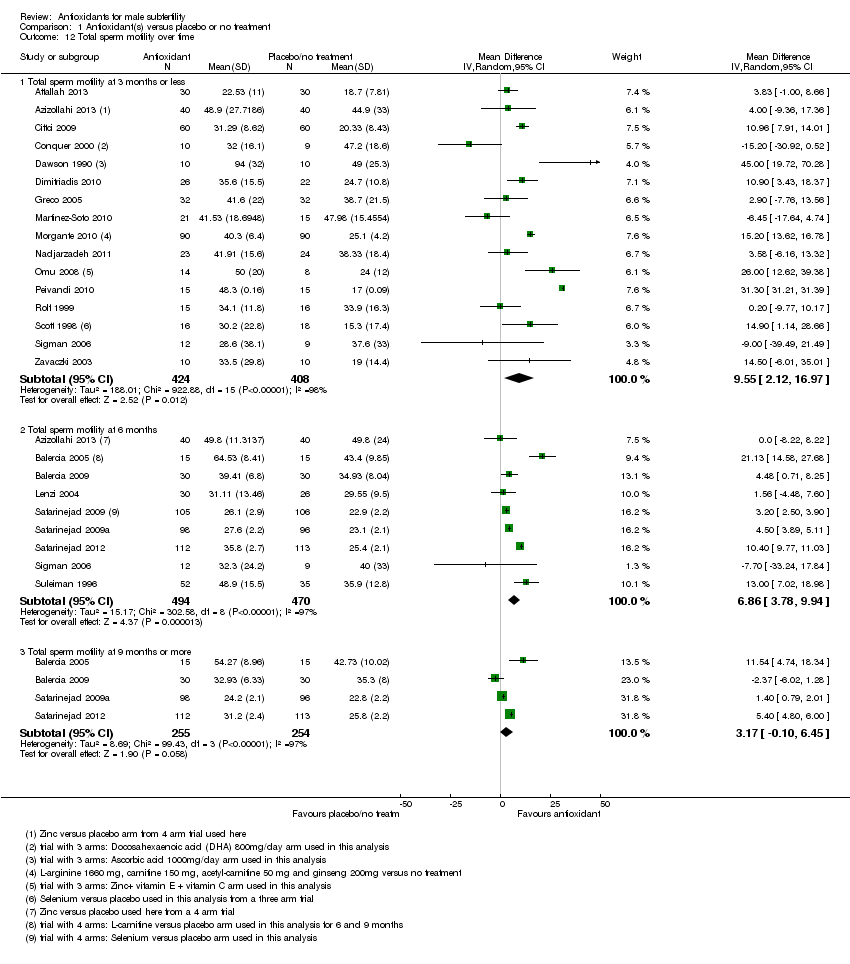
| 12 Total sperm motility over time Show forest plot | 23 | | Mean Difference (IV, Random, 95% CI) | Subtotals only |
|
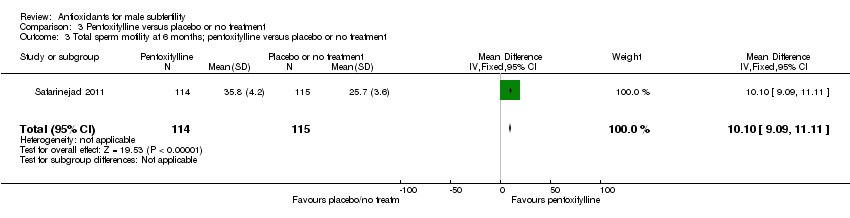
| 12.1 Total sperm motility at 3 months or less | 16 | 832 | Mean Difference (IV, Random, 95% CI) | 9.55 [2.12, 16.97] |
| 12.2 Total sperm motility at 6 months | 9 | 964 | Mean Difference (IV, Random, 95% CI) | 6.86 [3.78, 9.94] |
| 12.3 Total sperm motility at 9 months or more | 4 | 509 | Mean Difference (IV, Random, 95% CI) | 3.17 [‐0.10, 6.45] |
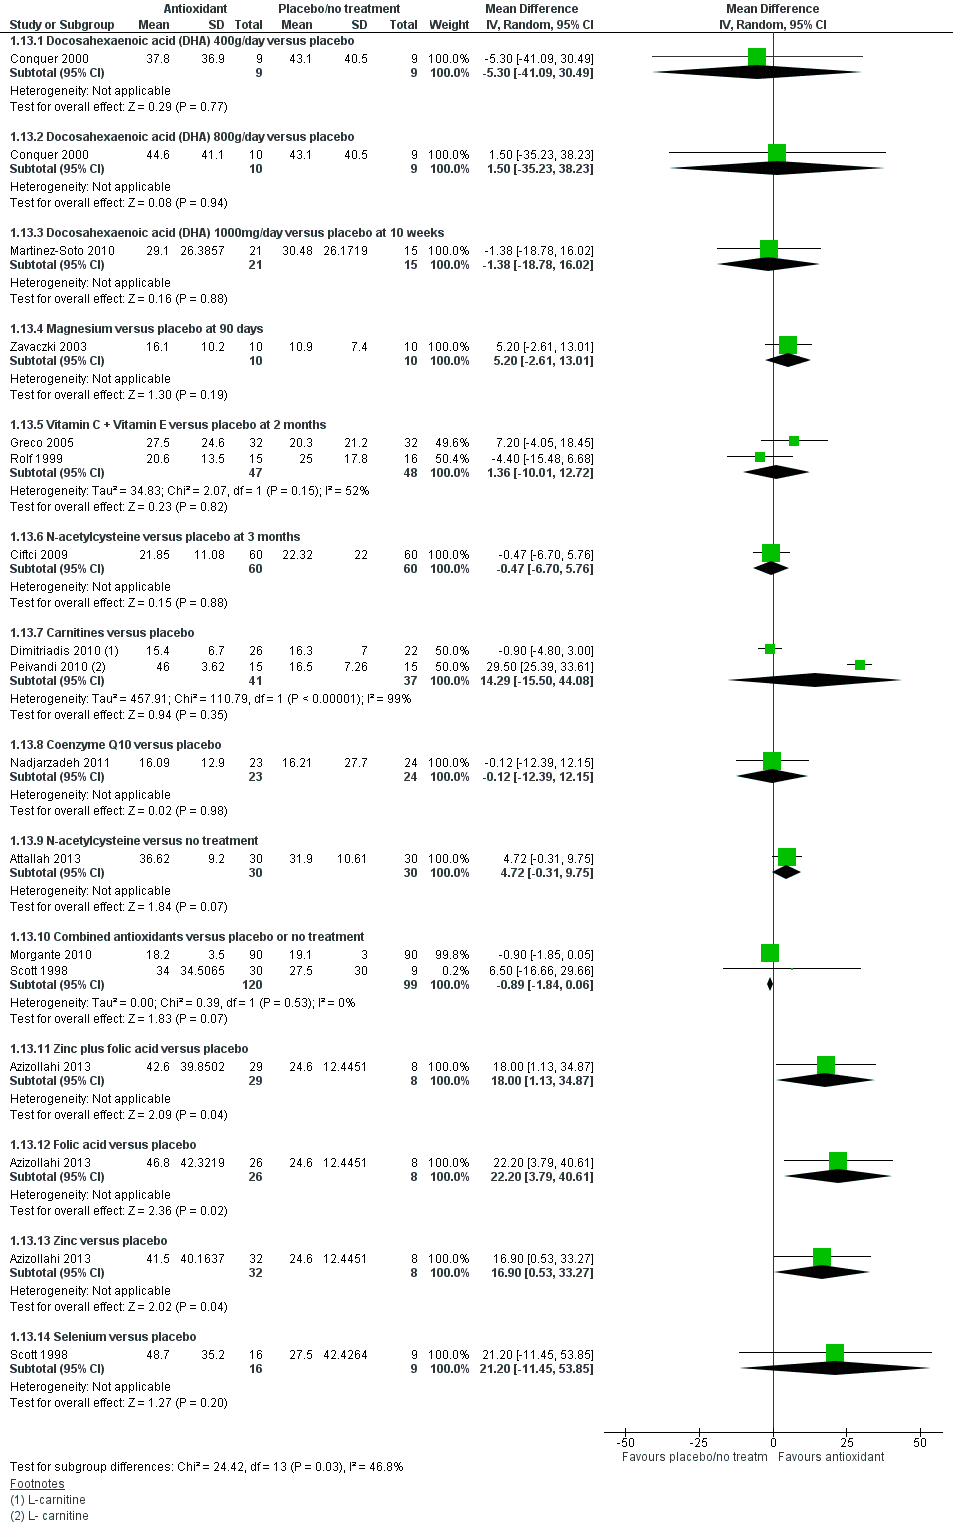
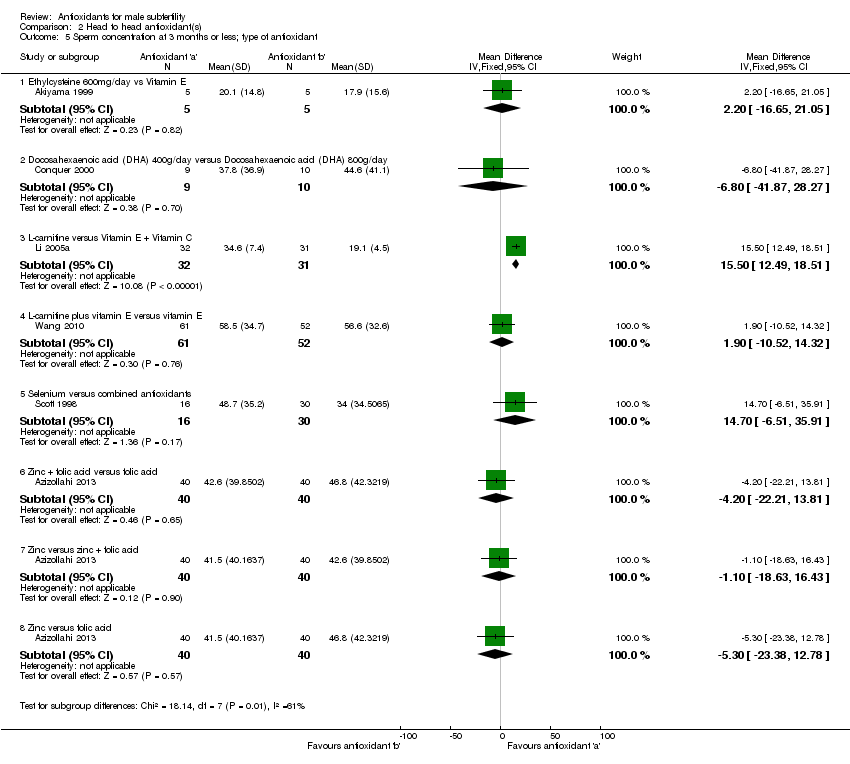
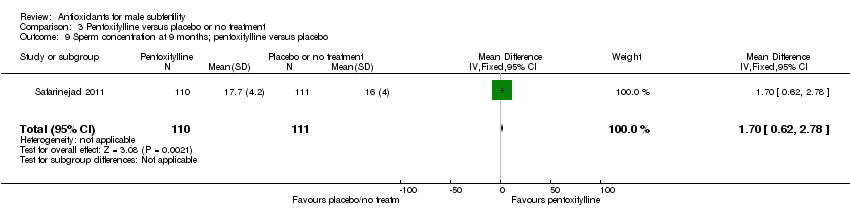
| 13 Sperm concentration at 3 months or less; type of antioxidant Show forest plot | 13 | | Mean Difference (IV, Random, 95% CI) | Subtotals only |
|
| 13.1 Docosahexaenoic acid (DHA) 400g/day versus placebo | 1 | 18 | Mean Difference (IV, Random, 95% CI) | ‐5.30 [‐41.09, 30.49] |
| 13.2 Docosahexaenoic acid (DHA) 800g/day versus placebo | 1 | 19 | Mean Difference (IV, Random, 95% CI) | 1.50 [‐35.23, 38.23] |
| 13.3 Docosahexaenoic acid (DHA) 1000mg/day versus placebo at 10 weeks | 1 | 36 | Mean Difference (IV, Random, 95% CI) | ‐1.38 [‐18.78, 16.02] |
| 13.4 Magnesium versus placebo at 90 days | 1 | 20 | Mean Difference (IV, Random, 95% CI) | 5.20 [‐2.61, 13.01] |
| 13.5 Vitamin C + Vitamin E versus placebo at 2 months | 2 | 95 | Mean Difference (IV, Random, 95% CI) | 1.36 [‐10.01, 12.72] |
| 13.6 N‐acetylcysteine versus placebo at 3 months | 1 | 120 | Mean Difference (IV, Random, 95% CI) | ‐0.47 [‐6.70, 5.76] |
| 13.7 Carnitines versus placebo | 2 | 78 | Mean Difference (IV, Random, 95% CI) | 14.29 [‐15.50, 44.08] |
| 13.8 Coenzyme Q10 versus placebo | 1 | 47 | Mean Difference (IV, Random, 95% CI) | ‐0.12 [‐12.39, 12.15] |
| 13.9 N‐acetylcysteine versus no treatment | 1 | 60 | Mean Difference (IV, Random, 95% CI) | 4.72 [‐0.31, 9.75] |
| 13.10 Combined antioxidants versus placebo or no treatment | 2 | 219 | Mean Difference (IV, Random, 95% CI) | ‐0.89 [‐1.84, 0.06] |
| 13.11 Zinc plus folic acid versus placebo | 1 | 37 | Mean Difference (IV, Random, 95% CI) | 18.0 [1.13, 34.87] |
| 13.12 Folic acid versus placebo | 1 | 34 | Mean Difference (IV, Random, 95% CI) | 22.20 [3.79, 40.61] |
| 13.13 Zinc versus placebo | 1 | 40 | Mean Difference (IV, Random, 95% CI) | 16.9 [0.53, 33.27] |
| 13.14 Selenium versus placebo | 1 | 25 | Mean Difference (IV, Random, 95% CI) | 21.20 [‐11.45, 53.85] |
| 14 Sperm concentration at 3 months or less (data not suitable for meta analysis) Show forest plot | | | Other data | No numeric data |
|
| 14.1 L‐carnitine + Acetyl‐carnitine versus placebo (median and interquartile range) | | | Other data | No numeric data |
| 14.2 Vitamin E versus placebo | | | Other data | No numeric data |
| 14.3 L‐carnitine versus placebo | | | Other data | No numeric data |
| 15 Sperm concentration at 6 months; type of antioxidant Show forest plot | 7 | | Mean Difference (IV, Random, 95% CI) | Subtotals only |
|
| 15.1 Carnitines versus placebo at 6 months | 2 | 116 | Mean Difference (IV, Random, 95% CI) | 2.59 [‐3.11, 8.30] |
| 15.2 Selenium versus placebo at 26 weeks (6 months) | 1 | 140 | Mean Difference (IV, Random, 95% CI) | 4.10 [1.82, 6.38] |
| 15.3 N‐acetyl‐cysteine versus placebo at 26 weeks (6months) | 1 | 140 | Mean Difference (IV, Random, 95% CI) | 3.30 [1.13, 5.47] |
| 15.4 Selenium plus N‐acetyl‐cysteine versus placebo at 26 weeks (6months) | 1 | 139 | Mean Difference (IV, Random, 95% CI) | 8.60 [6.28, 10.92] |
| 15.5 Coenzyme Q10 versus placebo at 6 months | 3 | 479 | Mean Difference (IV, Random, 95% CI) | 6.88 [1.20, 12.56] |
| 15.6 Zinc plus folic acid versus placebo | 1 | 37 | Mean Difference (IV, Random, 95% CI) | 17.70 [‐1.88, 37.28] |
| 15.7 Folic acid versus placebo | 1 | 34 | Mean Difference (IV, Random, 95% CI) | 19.20 [4.74, 33.66] |
| 15.8 Zinc versus placebo | 1 | 40 | Mean Difference (IV, Random, 95% CI) | 9.70 [‐7.01, 26.41] |
| 16 Sperm concentration at 6 months(data not suitable for meta analysis) Show forest plot | | | Other data | No numeric data |
|
| 16.1 L‐carnitine + acetyl‐carnitine versus placebo | | | Other data | No numeric data |
| 16.2 Folic acid versus Placebo | | | Other data | No numeric data |
| 16.3 Zinc versus Placebo | | | Other data | No numeric data |
| 16.4 Zinc + folic acid versus placebo | | | Other data | No numeric data |
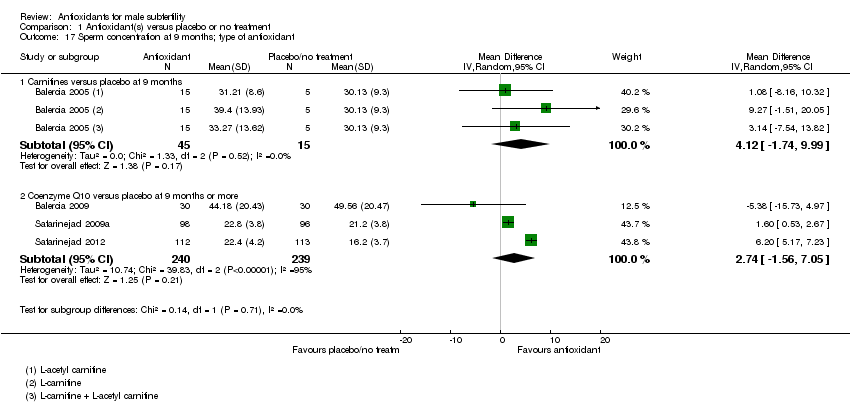
| 17 Sperm concentration at 9 months; type of antioxidant Show forest plot | 4 | | Mean Difference (IV, Random, 95% CI) | Subtotals only |
|
| 17.1 Carnitines versus placebo at 9 months | 1 | 60 | Mean Difference (IV, Random, 95% CI) | 4.12 [‐1.74, 9.99] |
| 17.2 Coenzyme Q10 versus placebo at 9 months or more | 3 | 479 | Mean Difference (IV, Random, 95% CI) | 2.74 [‐1.56, 7.05] |
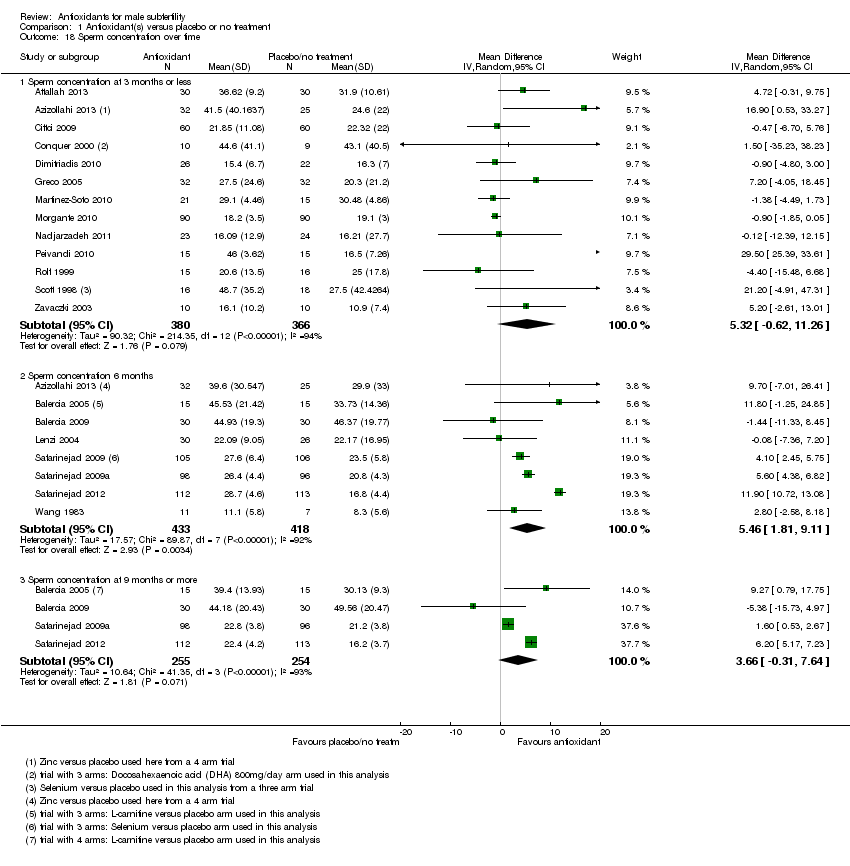
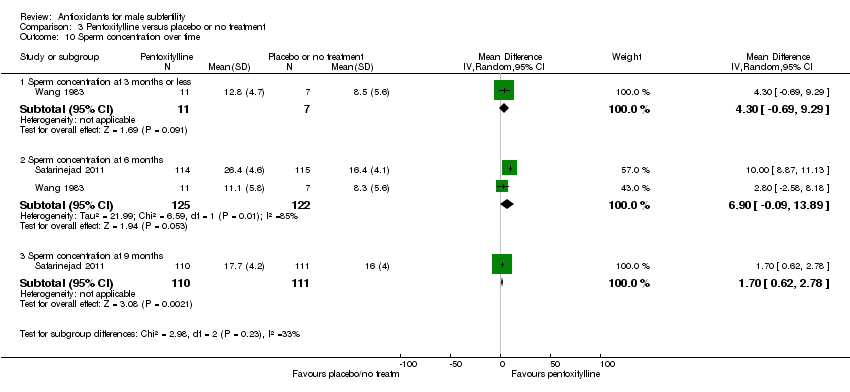
| 18 Sperm concentration over time Show forest plot | 20 | | Mean Difference (IV, Random, 95% CI) | Subtotals only |
|
| 18.1 Sperm concentration at 3 months or less | 13 | 746 | Mean Difference (IV, Random, 95% CI) | 5.32 [‐0.62, 11.26] |
| 18.2 Sperm concentration 6 months | 8 | 851 | Mean Difference (IV, Random, 95% CI) | 5.46 [1.81, 9.11] |
| 18.3 Sperm concentration at 9 months or more | 4 | 509 | Mean Difference (IV, Random, 95% CI) | 3.66 [‐0.31, 7.64] |