| 1 Mortality Show forest plot | 8 | | Risk Ratio (M‐H, Fixed, 95% CI) | Subtotals only |
|
| 1.1 Low CVP versus control | 3 | 177 | Risk Ratio (M‐H, Fixed, 95% CI) | 0.36 [0.02, 8.43] |
| 1.2 Autologous blood donation versus control | 1 | 79 | Risk Ratio (M‐H, Fixed, 95% CI) | 0.0 [0.0, 0.0] |
| 1.3 Haemodilution versus control | 2 | 150 | Risk Ratio (M‐H, Fixed, 95% CI) | 0.35 [0.04, 3.32] |
| 1.4 Haemodilution with controlled hypotension versus control | 1 | 20 | Risk Ratio (M‐H, Fixed, 95% CI) | 0.0 [0.0, 0.0] |
| 1.5 Haemodilution with bovine haemoglobin (HBOC‐201) versus haemodilution with hydroxy ethyl starch (HES) | 1 | 12 | Risk Ratio (M‐H, Fixed, 95% CI) | 3.0 [0.15, 61.74] |
| 1.6 Hypoventilation versus control | 1 | 79 | Risk Ratio (M‐H, Fixed, 95% CI) | 0.0 [0.0, 0.0] |
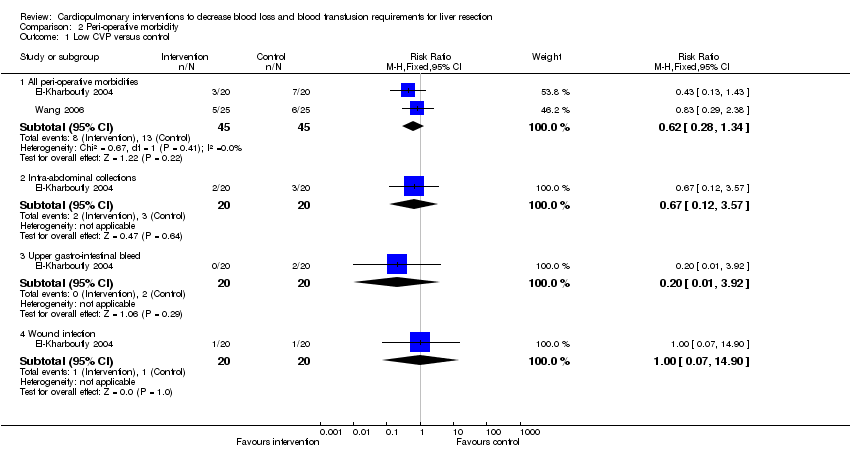
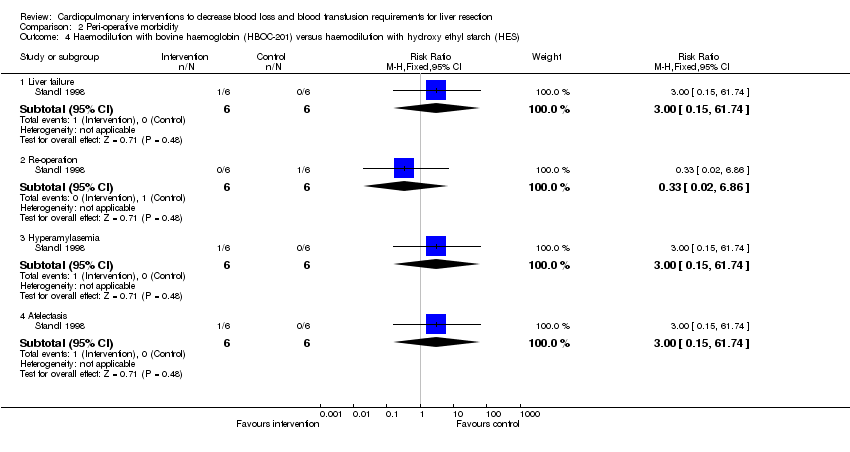
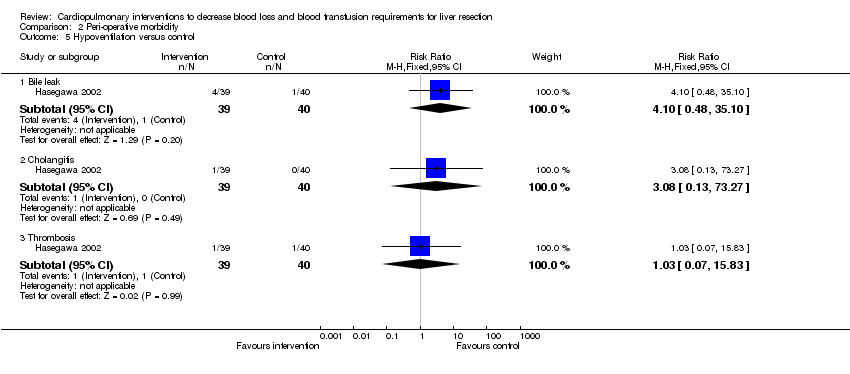
| 2 Peri‐operative morbidity | | | Other data | No numeric data |
| 2.1 See analysis 2 | | | Other data | No numeric data |
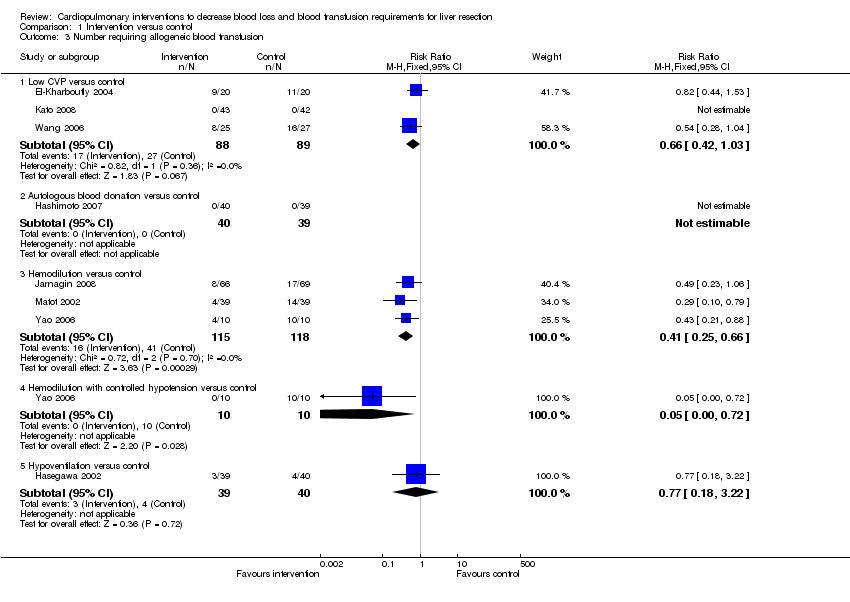
| 3 Number requiring allogeneic blood transfusion Show forest plot | 8 | | Risk Ratio (M‐H, Fixed, 95% CI) | Subtotals only |
|
| 3.1 Low CVP versus control | 3 | 177 | Risk Ratio (M‐H, Fixed, 95% CI) | 0.66 [0.42, 1.03] |
| 3.2 Autologous blood donation versus control | 1 | 79 | Risk Ratio (M‐H, Fixed, 95% CI) | 0.0 [0.0, 0.0] |
| 3.3 Hemodilution versus control | 3 | 233 | Risk Ratio (M‐H, Fixed, 95% CI) | 0.41 [0.25, 0.66] |
| 3.4 Hemodilution with controlled hypotension versus control | 1 | 20 | Risk Ratio (M‐H, Fixed, 95% CI) | 0.05 [0.00, 0.72] |
| 3.5 Hypoventilation versus control | 1 | 79 | Risk Ratio (M‐H, Fixed, 95% CI) | 0.77 [0.18, 3.22] |
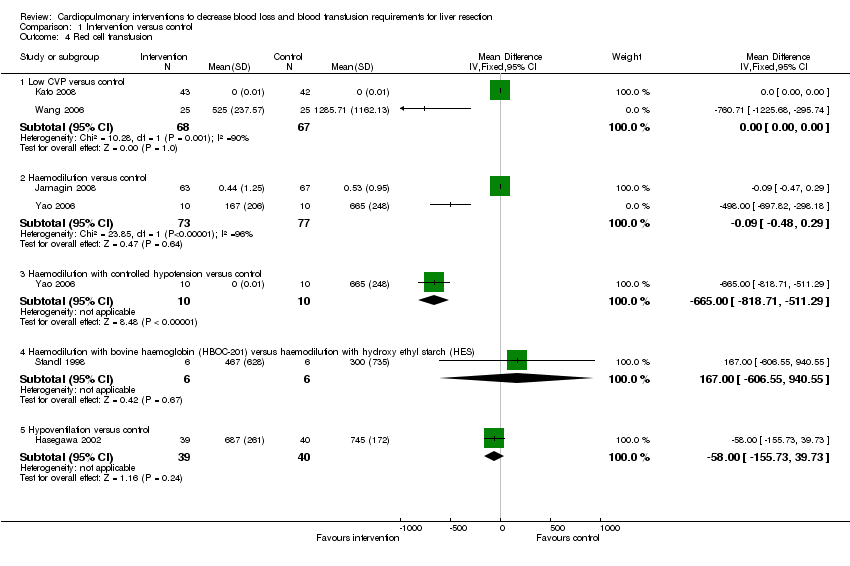
| 4 Red cell transfusion Show forest plot | 6 | | Mean Difference (IV, Fixed, 95% CI) | Subtotals only |
|
| 4.1 Low CVP versus control | 2 | 135 | Mean Difference (IV, Fixed, 95% CI) | ‐0.00 [‐0.00, 0.00] |
| 4.2 Haemodilution versus control | 2 | 150 | Mean Difference (IV, Fixed, 95% CI) | ‐0.09 [‐0.48, 0.29] |
| 4.3 Haemodilution with controlled hypotension versus control | 1 | 20 | Mean Difference (IV, Fixed, 95% CI) | ‐665.0 [‐818.71, ‐511.29] |
| 4.4 Haemodilution with bovine haemoglobin (HBOC‐201) versus haemodilution with hydroxy ethyl starch (HES) | 1 | 12 | Mean Difference (IV, Fixed, 95% CI) | 167.0 [‐606.55, 940.55] |
| 4.5 Hypoventilation versus control | 1 | 79 | Mean Difference (IV, Fixed, 95% CI) | ‐56.00 [‐155.73, 39.73] |
| 5 Fresh frozen plasma Show forest plot | 1 | | Std. Mean Difference (IV, Fixed, 95% CI) | Subtotals only |
|
| 5.1 Low CVP versus control | 1 | 50 | Std. Mean Difference (IV, Fixed, 95% CI) | ‐1.22 [‐1.83, ‐0.62] |
| 6 Operating time (minutes) Show forest plot | 5 | | Mean Difference (IV, Fixed, 95% CI) | Subtotals only |
|
| 6.1 Low CVP versus control | 2 | 90 | Mean Difference (IV, Fixed, 95% CI) | ‐24.69 [‐44.28, ‐5.09] |
| 6.2 Hemodilution versus control | 2 | 208 | Mean Difference (IV, Fixed, 95% CI) | ‐28.86 [‐57.37, ‐0.35] |
| 6.3 Hemodilution with bovine haemoglobin (HBOC‐201) versus hemodilution with hydroxy ethyl starch (HES) | 1 | 12 | Mean Difference (IV, Fixed, 95% CI) | 23.0 [‐83.60, 129.60] |
| 7 Hospital stay (days) Show forest plot | 4 | | Mean Difference (IV, Fixed, 95% CI) | Subtotals only |
|
| 7.1 Low CVP versus control | 2 | 135 | Mean Difference (IV, Fixed, 95% CI) | ‐4.53 [‐7.38, ‐1.68] |
| 7.2 Hemodilution versus control | 1 | 130 | Mean Difference (IV, Fixed, 95% CI) | 0.0 [‐2.66, 2.66] |
| 7.3 Haemodilution with bovine haemoglobin (HBOC‐201) versus hemodilution with hydroxy ethyl starch (HES) | 1 | 12 | Mean Difference (IV, Fixed, 95% CI) | 2.30 [‐7.52, 12.12] |
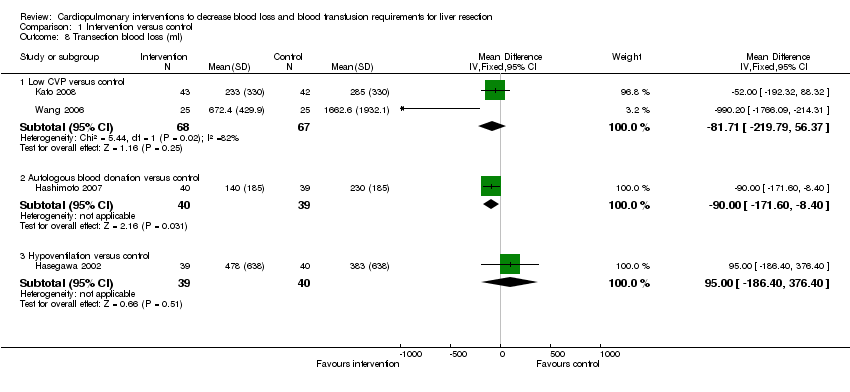
| 8 Transection blood loss (ml) Show forest plot | 4 | | Mean Difference (IV, Fixed, 95% CI) | Subtotals only |
|
| 8.1 Low CVP versus control | 2 | 135 | Mean Difference (IV, Fixed, 95% CI) | ‐81.71 [‐219.79, 56.37] |
| 8.2 Autologous blood donation versus control | 1 | 79 | Mean Difference (IV, Fixed, 95% CI) | ‐90.0 [‐171.60, ‐8.40] |
| 8.3 Hypoventilation versus control | 1 | 79 | Mean Difference (IV, Fixed, 95% CI) | 95.0 [‐186.40, 376.40] |
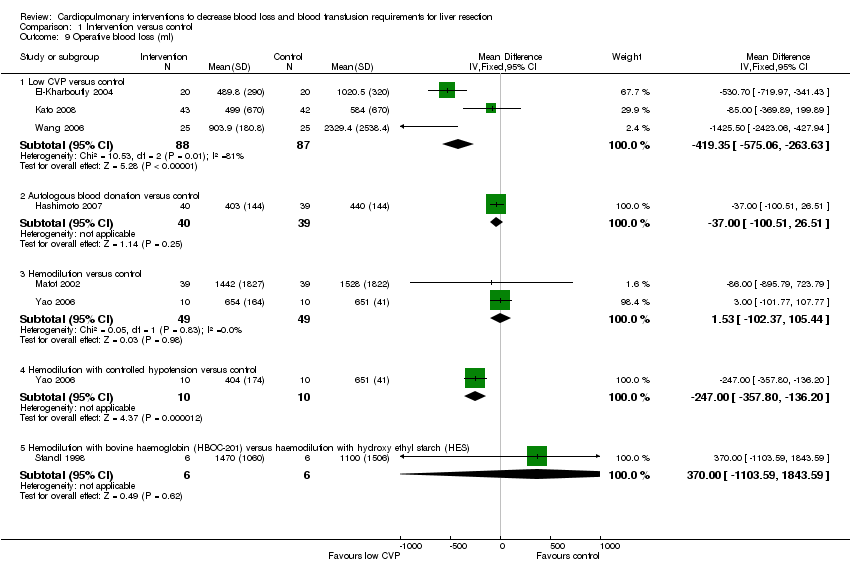
| 9 Operative blood loss (ml) Show forest plot | 7 | | Mean Difference (IV, Fixed, 95% CI) | Subtotals only |
|
| 9.1 Low CVP versus control | 3 | 175 | Mean Difference (IV, Fixed, 95% CI) | ‐419.35 [‐575.06, ‐263.63] |
| 9.2 Autologous blood donation versus control | 1 | 79 | Mean Difference (IV, Fixed, 95% CI) | ‐37.0 [‐100.51, 26.51] |
| 9.3 Hemodilution versus control | 2 | 98 | Mean Difference (IV, Fixed, 95% CI) | 1.53 [‐102.37, 105.44] |
| 9.4 Hemodilution with controlled hypotension versus control | 1 | 20 | Mean Difference (IV, Fixed, 95% CI) | ‐245.00 [‐357.80, ‐136.20] |
| 9.5 Hemodilution with bovine haemoglobin (HBOC‐201) versus haemodilution with hydroxy ethyl starch (HES) | 1 | 12 | Mean Difference (IV, Fixed, 95% CI) | 370.0 [‐1103.59, 1843.59] |
| 10 Bilirubin (micromol/litre) | | | Other data | No numeric data |
| 10.1 See analysis 3 | | | Other data | No numeric data |
| 11 Prothrombin activity | | | Other data | No numeric data |
| 11.1 See analysis 4 | | | Other data | No numeric data |
| 12 AST (IU/L) | | | Other data | No numeric data |
| 12.1 See analysis 5 | | | Other data | No numeric data |
| 13 ALT (IU/L) | | | Other data | No numeric data |
| 13.1 See analysis 6 | | | Other data | No numeric data |