Contenido relacionado
Revisiones y protocolos relacionados
Joanna Tieu, Andrew J McPhee, Caroline A Crowther, Philippa Middleton, Emily Shepherd | 3 agosto 2017
Jodie M Dodd, Therese Dowswell, Caroline A Crowther | 6 noviembre 2015
Shanshan Han, Caroline A Crowther, Philippa Middleton | 18 enero 2012
Kelvin H Tan, Antoinette Sabapathy | 12 septiembre 2012
Karaponi AM Okesene-Gafa, Abigail E Moore, Vanessa Jordan, Lesley McCowan, Caroline A Crowther | 24 junio 2020
Melissa Whitworth, Siobhan Quenby, Ruth O Cockerill, Therese Dowswell | 7 septiembre 2011
Lelia Duley, Shireen Meher, Kylie E Hunter, Anna Lene Seidler, Lisa M Askie | 30 octubre 2019
Zohra S Lassi, Rehana A Salam, Batool A Haider, Zulfiqar A Bhutta | 28 marzo 2013
Ujvala Rao, Bradley de Vries, Glynis P Ross, Adrienne Gordon | 3 septiembre 2019
Bianca Carducci, Emily C Keats, Zulfiqar A Bhutta | 16 marzo 2021
Respuestas clínicas Cochrane
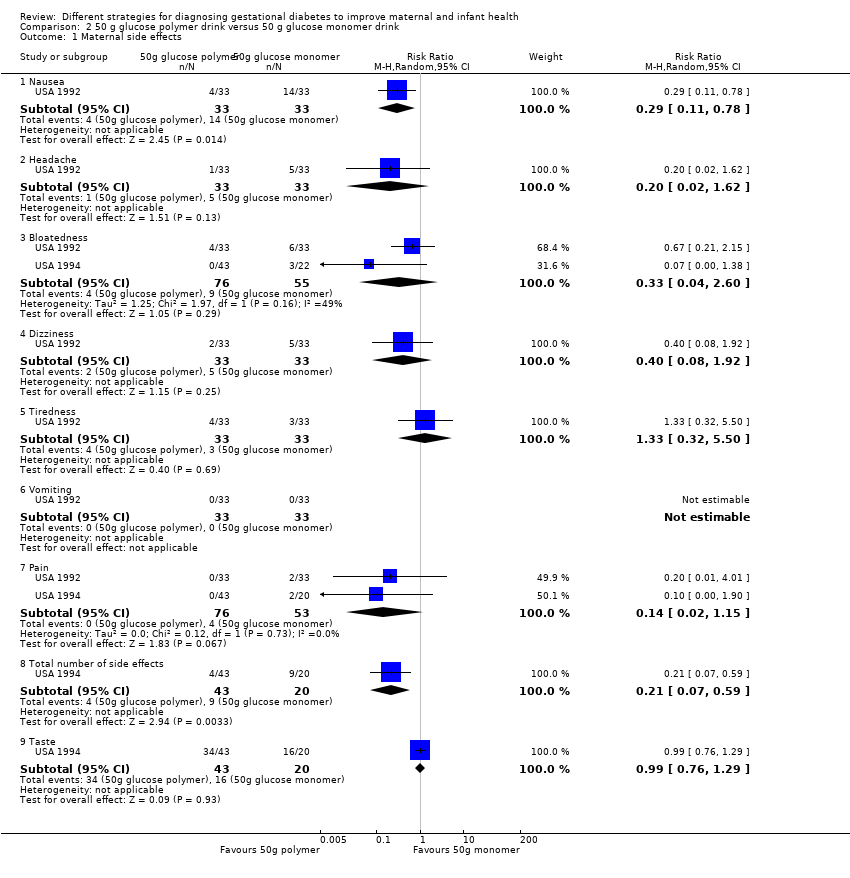
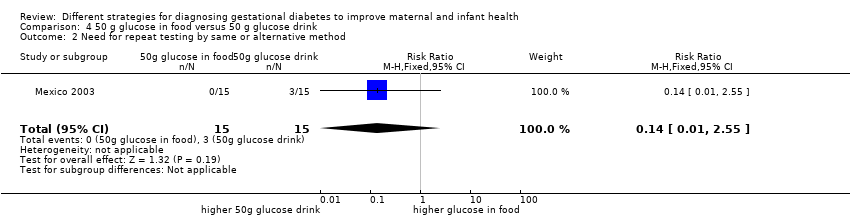
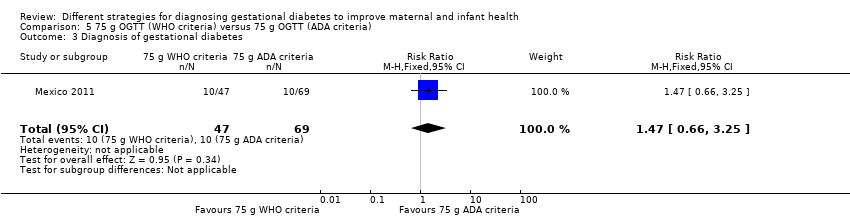
How do different strategies for diagnosing gestational diabetes affect maternal and infant outcomes?
Sera Tort, Karen Pettersen | 15 noviembre 2017