Diferentes estrategias para el diagnóstico de la diabetes gestacional para mejorar la salud materna e infantil
Referencias
Referencias de los estudios incluidos en esta revisión
Referencias de los estudios excluidos de esta revisión
Referencias de los estudios en espera de evaluación
Referencias de los estudios en curso
Referencias adicionales
Referencias de otras versiones publicadas de esta revisión
Characteristics of studies
Characteristics of included studies [ordered by study ID]
| Methods | 'Randomly assigned'; no further information was given. No losses to follow‐up were reported. | |
| Participants | 30 women at 24 to 28 weeks' gestation, defined as 'high risk'; no further information was reported regarding criteria for being high‐risk or criteria for GDM diagnosis. Settings: Hospital, Mexico. | |
| Interventions | Experimental: 15 women; diet of carbohydrates, proteins and fats including 50 g of glucose. Control: 15 women; 50 g of glucose in solution. | |
| Outcomes | Women: side effects (nausea, sickness, migraine, diarrhoea), screen positive 1‐hour serum glucose > 140 mg/dL. Babies: none reported. | |
| Notes | Women with serum glucose above 140 mg/dL were offered further testing. Study dates: not reported. Funding sources: not reported; declarations of interest: not reported. | |
| Risk of bias | ||
| Bias | Authors' judgement | Support for judgement |
| Random sequence generation (selection bias) | Unclear risk | 'Randomly assigned' is stated in the abstract. No further information is given in the main text. |
| Allocation concealment (selection bias) | Unclear risk | Concealment of allocation was not reported. |
| Incomplete outcome data (attrition bias) | Low risk | No losses to follow‐up were reported. |
| Selective reporting (reporting bias) | Low risk | Prespecified outcomes of side effects and serum glucose > 140 mg/dL at 1 hour were reported. |
| Other bias | Unclear risk | No table of participants' baseline characteristics was provided to permit judgement of the effectiveness of randomisation. |
| Blinding of participants and personnel (performance bias) | High risk | Blinding of participants and personnel was not reported. Reporting of side effects may be influenced by knowledge of treatment. |
| Blinding of outcome assessment (detection bias) | Unclear risk | Blinding of outcome assessment was not reported. Unclear risk because reporting of side effects may have been influenced by knowledge of treatment, but the outcome of serum glucose > 140 mg/dL would not have been influenced. |
| Methods | 'Randomised by a computer programme'; no other information was given (see notes below and risk of bias table). | |
| Participants | 386 women at 12 to 28 weeks' gestation were attending for care at the National Institute of Perinatology Isidro Espinosa de los Reyes, Mexico, 116 of whom were included in this review. Settings: National Institute of Perinatology Isidro Espinosa de los Reyes, Mexico. | |
| Interventions | 75 g OGTT WHO 1999 criteria, 75 g OGTT ADA 2010 criteria and 100 g OGTT O'Sullivan 1973 criteria. | |
| Outcomes | GDM diagnosis, stillbirth, macrosomia, threat of preterm birth, caesarean and instrumental birth, pregnancy‐induced hypertension, preterm rupture of membranes, oligohydramnios, polyhydramnios. | |
| Notes | Non‐randomised participants included in the group were allocated 100 g OGTT with ADA criteria; therefore this group was not included in any analysis. Study dates: 1 June 2006 to 1 September 2006. Funding sources: not reported; declarations of interest: not reported. | |
| Risk of bias | ||
| Bias | Authors' judgement | Support for judgement |
| Random sequence generation (selection bias) | Unclear risk | 'Randomised by a computer programme'; no other information was given. |
| Allocation concealment (selection bias) | Unclear risk | Concealment of allocation was not reported. |
| Incomplete outcome data (attrition bias) | High risk | 7/54 (13%) participants allocated 75 g OGTT were unable to complete and were not followed up and included in the analysis. |
| Selective reporting (reporting bias) | Low risk | All prespecified outcomes seem to have been reported. |
| Other bias | High risk | The numbers for this trial are unclear. It appears that women > 28 weeks who were not screened or randomly assigned were included in the 100 g OGTT group. Inclusion of non‐randomised participants in 1 of the groups; uneven numbers in the remaining groups, possibly due to the fact that study authors failed to use an intention‐to‐treat design (see notes above regarding loss of participants due to lack of completion of the test); possible 'double' counting of participants in the screened tables; and lack of clarity surrounding the study design suggest that extreme caution should be exercised when results from this trial are interpreted. 35 twin pregnancies were included; however group allocation was not reported, so they may or may not be included in the comparison groups described in this review. We have used data from 2 groups including 116 randomly assigned women. |
| Blinding of participants and personnel (performance bias) | Unclear risk | Blinding of personnel and participants is not reported but is possible because the tests consisted of glucose drinks and could have appeared to be identical. Blood glucose levels, birthweight and ruptured membranes would not have been affected by knowledge of treatment groups, but outcomes such as caesarean birth may have been affected. |
| Blinding of outcome assessment (detection bias) | Unclear risk | Blinding of outcome assessors was not reported. |
| Methods | 'Randomised into two groups'; no further information was given. No losses to follow‐up were reported. | |
| Participants | 100 women at 28 weeks' gestation without pre‐existing diabetes were given a 100 g non‐fasting OGTT. NDDG 1979 criteria were used to diagnose GDM. Settings: prenatal clinics, National Women's Hospital, Mexico. | |
| Interventions | Experimental: 52 women; 100 g glucose polymer screening test was given before a 100 g OGTT glucose polymer tolerance test was given. Control: 48 women; 100 g glucose screening test was given before a 100 g GTT was given. | |
| Outcomes | Women: 1‐, 2‐ and 3‐hour blood glucose at GTT. Babies: gestation at birth, mean birthweight. | |
| Notes | Mean birthweight was reported: 3427 g (SD 566) for polymer screening group vs 3280 g (SD 739) for glucose screening group. Report includes a case series of a further 178 women not included in this review who received a 100 g glucose polymer screening test followed by a 100 g GTT using glucose polymer. Study dates: not reported. Funding sources: not reported; declarations of interest: not reported. | |
| Risk of bias | ||
| Bias | Authors' judgement | Support for judgement |
| Random sequence generation (selection bias) | Unclear risk | 'Randomised'; no further information was reported. |
| Allocation concealment (selection bias) | Unclear risk | Concealment of allocation was not reported. |
| Incomplete outcome data (attrition bias) | Low risk | No women were lost to follow‐up. |
| Selective reporting (reporting bias) | Low risk | Specified outcomes have been reported. |
| Other bias | Low risk | No significant group differences in baseline characteristics were noted. |
| Blinding of participants and personnel (performance bias) | Low risk | Blinding of personnel and participants was not reported but was possible because the tests consisted of glucose drinks and could have appeared to be identical outcomes of plasma glucose value and of birthweight would not have been affected by knowledge of treatment groups. |
| Blinding of outcome assessment (detection bias) | Low risk | Blinding of outcome assessors was not stated. Outcomes of plasma glucose value and birthweight would not have been affected by knowledge of treatment groups. |
| Methods | 'Randomly selected'; no further information was given. 45 women (15%) were lost to follow‐up. | |
| Participants | 293 consecutive women at ≥ 28 weeks' gestation. Excluded: women with diabetes, women taking drugs that might influence glucose tolerance. Settings: Antenatal clinic, Lagos University Teaching Hospital, Nigeria. | |
| Interventions | Experimental: 138 women, 75 g OGTT, WHO 1980 criteria. Control: 110 women, 100 g OGTT, NDDG 1979 criteria. In both groups women fasted for 8 hours before they were given the GTT. | |
| Outcomes | Women: GDM, 1‐, 2‐ and 3‐hour blood glucose. Babies: macrosomia. | |
| Notes | 2 women could not tolerate the glucose drink because of vomiting and contractions. For the 75 g GTT, GDM was diagnosed using WHO criteria. For the 100 g GTT, GDM was diagnosed using National Diabetes Data Group criteria. Attempts to contact study authors for clarification of outcomes were unsuccessful. Study dates: November 1997 to July 1999. Funding sources: not reported; declarations of interest: not reported. | |
| Risk of bias | ||
| Bias | Authors' judgement | Support for judgement |
| Random sequence generation (selection bias) | Unclear risk | 'Randomly selected'; no further information was given. |
| Allocation concealment (selection bias) | Unclear risk | Allocation concealment was not reported. |
| Incomplete outcome data (attrition bias) | High risk | 293 were recruited but only 248 completed; 45 were lost (15%). In Table 2 study authors report data for only 25 of 138 women for the 3‐hour glucose level in the 75 g group; no data for this outcome are missing for the 100 g group. |
| Selective reporting (reporting bias) | Low risk | Specified outcomes of blood glucose values and macrosomia were reported. |
| Other bias | Low risk | No significant group differences in baseline characteristics were reported. |
| Blinding of participants and personnel (performance bias) | Low risk | Blinding of participants and personnel was not reported but was possible, as both tests were glucose drinks and could have appeared to be identical. Outcomes would not have been affected by knowledge of treatment groups. |
| Blinding of outcome assessment (detection bias) | Low risk | Blinding of outcome assessors was not reported. Outcomes of blood glucose values and birthweight would not have been affected by knowledge of treatment groups. |
| Methods | Prospective, non‐blind, parallel‐group randomised controlled trial. Block randomisation used. | |
| Participants | 736 pregnant women between 11 and 14 weeks of gestation. Settings: Antenatal outpatient clinic, Ankara, Turkey. | |
| Interventions | Fasting plasma glucose obtained from all women at recruitment (8 to 14 weeks). Randomisation and intervention at 11 to 14 weeks. Experimental intervention 1: 377 women, 2‐step method: 50 g GCT ± 100 g GTT. Experimental intervention 2: 349 women, 1‐step method: 75 g GTT. All women not lost to follow‐up, withdrawn or diagnosed with GDM received the allocated intervention again at 24 to 28 weeks' gestation. | |
| Outcomes | GDM diagnosis. | |
| Notes | Study dates: 31 December 2010 to 31 December 2011. Funding sources: not reported; declarations of interest: “The authors report no conflicts of interest”. | |
| Risk of bias | ||
| Bias | Authors' judgement | Support for judgement |
| Random sequence generation (selection bias) | Low risk | Block randomisation with blocks of 4 to ensure each group consisted of an equal number of participants. Blocks were chosen randomly using computer generated random numbers. |
| Allocation concealment (selection bias) | Unclear risk | Unclear if allocation was concealed. Women in same block may have pre‐empted which group they would be in. |
| Incomplete outcome data (attrition bias) | Low risk | 7 and 4 women in the 2 and 1‐step groups respectively who experienced fetal loss before 24 to 28 weeks were withdrawn. 132 and 107 women in the 2‐ and 1‐step groups respectively were lost to follow‐up (before 24 to 28 weeks). However we only include the outcome rates reported prior to losses to follow‐up. |
| Selective reporting (reporting bias) | Low risk | Protocol not available, however the aim to evaluate the performance of screening tests for GDM is clearly stated. |
| Other bias | High risk | Baseline characteristics reported only for those not lost to follow up or withdrawn (60% of recruited population). |
| Blinding of participants and personnel (performance bias) | Unclear risk | Because the tests are clearly different the women and those administering the tests can not be blinded to the intervention allocation, however as the only relevant outcome reported (GDM diagnosis) is a biochemical assessment it is not possible for this to be influenced. |
| Blinding of outcome assessment (detection bias) | Unclear risk | Not reported. |
| Methods | Consecutive numbers were obtained from a random number table. No losses to follow‐up were reported, although 10 women did not complete the questionnaire on side effects. O'Sullivan 1964 criteria were used to diagnose GDM. | |
| Participants | 76 Native Alaskan women at 24 to 28 weeks' gestation without a history of diabetes. Settings: Ketchikan Native Health Clinic and Mt. Edgecumbe Hospital, Alaska, USA. | |
| Interventions | Experimental: 35 women; 50 g glucose polymer drink. Control: 41 women; 50 g glucose monomer drink. | |
| Outcomes | Women: mean 1 hour venous plasma glucose, side effects. Babies: none reported. | |
| Notes | Study dates: January 1988 to May 1990. Funding sources: grant from the Diabetes Research and Education Foundation, Bridgewater, NJ; declarations of interest: not reported. | |
| Risk of bias | ||
| Bias | Authors' judgement | Support for judgement |
| Random sequence generation (selection bias) | Low risk | Consecutive numbers from a random number table. |
| Allocation concealment (selection bias) | Unclear risk | Allocation concealment was not reported, although study was described as "double blind". |
| Incomplete outcome data (attrition bias) | Low risk | No losses to follow‐up were reported, although 10 women did not complete the questionnaire on side effects. |
| Selective reporting (reporting bias) | Low risk | Specified outcomes of side effects and plasma glucose values were reported. |
| Other bias | Unclear risk | No table of participants' baseline characteristics was provided to permit judgement of the effectiveness of randomisation. |
| Blinding of participants and personnel (performance bias) | Unclear risk | Study was described as double blind, which is possible as test drinks may have appeared identical. Outcomes of side effects could have been affected by knowledge of treatment groups, but the plasma glucose value would not have been affected. |
| Blinding of outcome assessment (detection bias) | Low risk | Study was described as double blind. Side effects were self‐reported on a questionnaire and thus were not subject to assessor bias. Plasma glucose values would not have been affected by lack of blinding on the part of assessors. |
| Methods | 'Prospectively enrolled and randomly assigned'; no further information was given. 3‐arm comparison trial. | |
| Participants | 124 women having GDM screening at 24 to 28 weeks' gestation or women at high risk at initial antenatal visit; partial initial outcome data reported following screening of 122 women O'Sullivan 1964 criteria were used to diagnose GDM. Settings: Medical Education Clinics, Saint Luke's Hospital, Kansas City, Missouri, USA. | |
| Interventions | Experimental group 1: 40 women, 50 g glucose polymer. Experimental group 2: 39 women, candy bars as a screening test. Control: 43 women, 50 g standard d‐glucose. In all groups the intervention was non‐fasting, regardless of when the last meal was eaten. Serum glucose at 1 hour, then 100 g oral GTT within 1 week, 16 were unable to complete the GTT; 5 because of vomiting and 11 for logistical or laboratory reasons. | |
| Outcomes | Women: serum glucose at 1 hour ≥ 7.5 mmol/L, rating for taste and adverse symptoms (including pain, bloating, dizziness and nausea). Babies: none reported. | |
| Notes | 5 women required nursing assistance to complete the GTT. Control group data were divided (to prevent double counting) and were compared with data from the 2 experimental groups. Study dates: not reported. Funding sources: research grant from St Luke’s Foundation; declarations of interest: not reported. | |
| Risk of bias | ||
| Bias | Authors' judgement | Support for judgement |
| Random sequence generation (selection bias) | Unclear risk | 'Randomly assigned'; no further information was given. |
| Allocation concealment (selection bias) | Unclear risk | Concealment of allocation was not reported. |
| Incomplete outcome data (attrition bias) | High risk | 16/124 (13%) did not have a GTT (5 because of vomiting, 11 for 'logistical' reasons or because of incomplete laboratory data). 14/108 (13%) women did not complete the post‐test questionnaire. |
| Selective reporting (reporting bias) | Low risk | Specified outcomes of serum glucose at 1 hour and questionnaire for taste and symptoms were reported. |
| Other bias | High risk | Differences in group characteristics were significant for age and parity (younger and lower parity women received candy bars). |
| Blinding of participants and personnel (performance bias) | High risk | Blinding was not reported, but treatments were visibly different (candy bar vs solution). Reporting of side effects could have been affected by knowledge of treatment groups, but serum glucose value would not have been affected. |
| Blinding of outcome assessment (detection bias) | Unclear risk | Blinding was not reported. Symptoms were self‐reported on a questionnaire and were not subject to assessor bias. Plasma glucose values would not have been affected by lack of blinding on the part of assessors. |
ADA: American Diabetes Association
d‐glucose: glucose monomer
GDM: gestational diabetes mellitus
GTT: glucose tolerance test
OGTT: oral glucose tolerance test
SD: standard deviation
vs: versus
WHO: World Health Organization
Characteristics of excluded studies [ordered by study ID]
| Study | Reason for exclusion |
| Not a randomised trial; cross‐over design and comparison of different ways of measuring blood glucose. Participants: 500 women having an OGTT, usually at 24 to 28 weeks' gestation, but some earlier and a few later or postpartum. | |
| Cross‐over study of response to different glucose loads in those with a diagnosis of GDM and those without. Participants: 60 women, 30 with GDM and willing to undergo a second GTT and 30 healthy pregnant women. Interventions: 75 g OGTT vs 100 g OGTT. | |
| Wrong intervention: routine screening of all women vs selective screening for clinical indications of GDM. Participants: 2401 low‐risk women randomly assigned to screening, or screening only if a clinical indication arose during pregnancy. Interventions: routine screening with 50 g OGTT vs screening with 100 g OGTT only if indicated. Outcome: macrosomia rate. | |
| Outcomes reported as percentage rates. Participants: 5489 women. Interventions: 50 g OGTT and 100 g OGTT vs 50 g OGTT and 75 g OGTT vs 75 g OGTT. Canada 2010 subset of Canada 2005. Outcomes: economic evaluation of 1‐step and 2‐step screening and diagnostic approaches, no evaluation of maternal and infant outcomes. Participants: 1594 women. Intervention: as above. | |
| Not a randomised trial; women 'randomly selected' for a 50 g OGTT. Participants: 220 women in the third trimester. Interventions: comparison of capillary vs venous blood samples. | |
| Not a randomised trial. Participants: 622 women at 28 to 32 weeks. Interventions: 50 g OGTT if results > 7.78 mmol/L, then 75 g OGTT. | |
| Cross‐over trial; no clinical outcomes reported. Participants: 34 women at around 30 weeks' gestation, unselected. Interventions: low‐ vs high‐carbohydrate diet before OGTT. | |
| Not a randomised trial: 2 groups matched for key characteristics. No clinical outcomes reported. Participants: 47 women undergoing 100 g OGTT at 24 to 28 weeks. Interventions: fingertip vs forearm blood sample. | |
| Cross‐over trial; participants randomly assigned to the order in which they were given 50 g and 75 g OGTT. Participants: 50 women at 28 to 32 weeks' gestation. Interventions: 50 g OGTT and 75 g OGTT. | |
| Cross‐over trial. Participants: 141 women at 24 to 28 weeks' gestation if low risk. Interventions: breakfast containing 50 g simple glucose vs 50 g glucose challenge. | |
| Cross‐over trial. Participants: 138 women. Intervention: 50 g OGTT vs breakfast (includes 50 g sugar or jam). | |
| Wrong intervention. Universal screening vs selective screening. Participants: 3742 women at booking visit. Interventions: universal vs selective screening for GDM. | |
| Trial comparing identification of gestational diabetes using OGTT in primary and secondary care settings. | |
| Cross‐over trial; 2 studies reported in the same paper. Participants: 26 women; consecutive referrals for carbohydrate tolerance testing because of risk factors for GDM. Interventions: 50 g OGTT vs 50 g glucose polymer tolerance test. | |
| Cross‐over trial; 2 studies reported in the same paper. Participants: 20 women; consecutive referrals for carbohydrate tolerance testing because of features suggestive of GDM. Interventions: 50 g glucose polymer vs 50 g glucose. | |
| Cross‐over trial. Participants: 56 women in the third trimester. Interventions: 50 g OGTT vs 75 g OGTT. | |
| Not a randomised trial. Participants: 709 women. Interventions: 50 g OGTT and 75 g OGTT within a week, then 100 g if 50 g OGTT blood sugar ≥ 7.8 within a week of the 75 g OGTT. | |
| Cross‐over trial. Participants: 42 women with a positive 50 g glucose challenge test at 14 to 36 weeks. Interventions: 75 g OGTT vs 100 g OGTT. | |
| Participants known to have normal glucose tolerance. Participants: 41 women with normal 100 g OGTT and 25 women with normal 75 g OGTT. Interventions: 75 g vs 100 g OGTT ‐ postload blood glucose levels. | |
| Cross‐over trial. Participants: 100 women at 24 to 28 weeks. Interventions: meal and 50 g oral glucose as screening for GDM. | |
| Quasi‐randomised study using alternate allocations. Also, cross‐over design and 42% lost to follow‐up. Participants: 114 women ≤ 24 weeks' gestation. Interventions: 50 g vs 100 g OGTT. | |
| Quasi‐randomised study using alternate allocations and a cross‐over design. Participants: 37 women at 10 to 38 weeks' gestation. Interventions: 50 g OGTT if result ≥ 135 mg/dL, then 3‐day diet of > 150 g/d of CHO, then > 1 week of normal diet before 50 g OGTT or > 1 week of normal diet plus 3‐day diet of > 150 g/d of CHO before 50 g OGTT. | |
| Cross‐over trial; published as abstract only. Participants: 45 women with an abnormal glucose challenge screening test. Interventions: '3‐hour standard' OGTT vs intravenous GTT. | |
| Cross‐over trial. Participants: 26 low‐risk women at 28 to 32 weeks' gestation. Interventions: non‐fasting OGTT vs fasting OGTT. | |
| Not a randomised trial. Case series in which all women were given both tests. Participants: 32 women at 26 to 36 weeks' gestation. Interventions: 75 g OGTT vs 100 g OGTT. | |
| Not a randomised trial, cross‐over design. Participants: 32 women at 26 to 36 weeks' gestation. Interventions: 100 g then 75 g OGTT. | |
| Outcomes data reported by whether or not the women had GDM, not by allocated group. Participants: 80 women with a positive 50 g glucose challenge test. Interventions: 75 g OGTT vs 50 g OGTT. | |
| Cross‐over trial. Participants: 160 women at 24 to 28 weeks' gestation. Interventions: 30 jelly beans vs 50 g glucose drink. | |
| Participants were women with a diagnosis of gestational diabetes. | |
| Brieft abstract only. Participants: women with increased BMI (> 25) at 16 weeks' gestation. Intervention: early testing of glucose intolerance and provision of an intervention to reduce the risk of GDM (prevention intervention). |
BMI: body mass index
CHO: carbohydrate
GDM: gestational diabetes mellitus
GTT: glucose tolerance test
OGTT: oral glucose tolerance test
vs: versus
Characteristics of studies awaiting assessment [ordered by study ID]
| Methods | Randomised parallel control trial (no details given). |
| Participants | Women at high risk of diabetes ‐ increased BMI, relative with diabetes, polycystic ovarian syndrome, history of GDM (not clear if history of GDM was in current or previous pregnancy). |
| Interventions | Early screening then diet control vs advanced screening them insulin (not clear what advanced screening is). |
| Outcomes | Glycated haemoglobin (HbA1C) Oral glucose tolerance C‐peptide Low density lipoprotein Triglycerides Insulin Homeostatic model assessment insulin resistance Mean glucose value Body mass index Post prandial glucose estimation Systolic blood pressure Diastolic blood pressure Apgar score at 5 minutes |
| Notes | Awaiting assessment pending further publications or information from the authors. |
GDM: gestational diabetes mellitus
vs: versus
Characteristics of ongoing studies [ordered by study ID]
| Trial name or title | Not known. Interim analysis of ongoing trial. |
| Methods | Described as 'randomly allocated'. No further details given (conference abstract only). |
| Participants | Pregnant women offered universal testing for GDM. |
| Interventions | Non‐fasting 50 g glucose challenge test vs fasting 75 g OGTT. |
| Outcomes | Number diagnosed with GDM Change in HbA1c (mmol/mol) Rise in HbA1c > 10% |
| Starting date | 2014. |
| Contact information | T Ahern, Diabetes Centre, Midlands Regional Hospital, Mullingar, Co Westmeath. |
| Notes |
| Trial name or title | USA 2013. |
| Methods | Randomised trial. |
| Participants | 1160 obese (BMI ≥ 30) pregnant women. |
| Interventions | Routine (OGTT at 24 to 28 weeks) vs early (OGTT at 14 to 18 weeks with repeat testing at 24 to 28 weeks for negative women) testing to identify gestational diabetes. |
| Outcomes | Composite perinatal outcome (macrosomia > 4 kg, gestational hypertension, pre‐eclampsia, shoulder dystocia, hyperbilirubinaemia, neonatal hypoglycaemia < 40 mg/dL), macrosomia > 4 kg, primary caesarean, pregnancy‐induced hypertension (gestational hypertension, pre‐eclampsia), shoulder dystocia, hyperbilirubinaemia, neonatal hypoglycaemia < 40 mg/dL, preterm birth < 37 weeks' gestation. |
| Starting date | June 2013. |
| Contact information | [email protected] University of Alabama at Birmingham, USA. |
| Notes |
| Trial name or title | Not known. |
| Methods | Randomised double blind trial. |
| Participants | All pregnant women who did not have a diagnosis of diabetes. Following a 1 hour 50 g glucose challenge test at between 24 to 28 weeks' gestation. Women with results < 20 mg/dL randomised to 1 of 2 groups. |
| Interventions | Fasting 2 hour 75 g OGTT and the IADPSG criteria vs fasting 3 hour 100 g OGTT and diagnosed with Carpenter Coustan criteria. |
| Outcomes | Large for gestational age infant Caesarean delivery Maternal composite morbidity ‐ maternal pre‐eclampsia, 3rd or 4th degree vaginal lacerations, postpartum haemorrhage |
| Starting date | 2014. |
| Contact information | Esa Davis: [email protected] |
| Notes | Estimated primary completion date: December 2018. |
BMI: body mass index
GDM: gestational diabetes mellitus
IADPSG: International Association of Diabetes and Pregnancy Study Group
OGTT: oral glucose tolerance test
vs: versus
Data and analyses
| Outcome or subgroup title | No. of studies | No. of participants | Statistical method | Effect size |
| 1 Diagnosis of gestational diabetes Show forest plot | 1 | 248 | Risk Ratio (M‐H, Fixed, 95% CI) | 2.55 [0.96, 6.75] |
| Analysis 1.1  Comparison 1 75 g OGTT versus 100 g OGTT, Outcome 1 Diagnosis of gestational diabetes. | ||||
| 2 Plasma glucose (mmol/L) Show forest plot | 1 | Mean Difference (IV, Fixed, 95% CI) | Subtotals only | |
| Analysis 1.2  Comparison 1 75 g OGTT versus 100 g OGTT, Outcome 2 Plasma glucose (mmol/L). | ||||
| 2.1 At 1 hour | 1 | 248 | Mean Difference (IV, Fixed, 95% CI) | ‐0.11 [‐0.44, 0.22] |
| 2.2 At 2 hours | 1 | 248 | Mean Difference (IV, Fixed, 95% CI) | ‐0.31 [‐0.64, 0.02] |
| 2.3 At 3 hours | 1 | 248 | Mean Difference (IV, Fixed, 95% CI) | ‐1.08 [‐1.47, ‐0.69] |
| Outcome or subgroup title | No. of studies | No. of participants | Statistical method | Effect size |
| 1 Maternal side effects Show forest plot | 2 | Risk Ratio (M‐H, Random, 95% CI) | Subtotals only | |
| Analysis 2.1 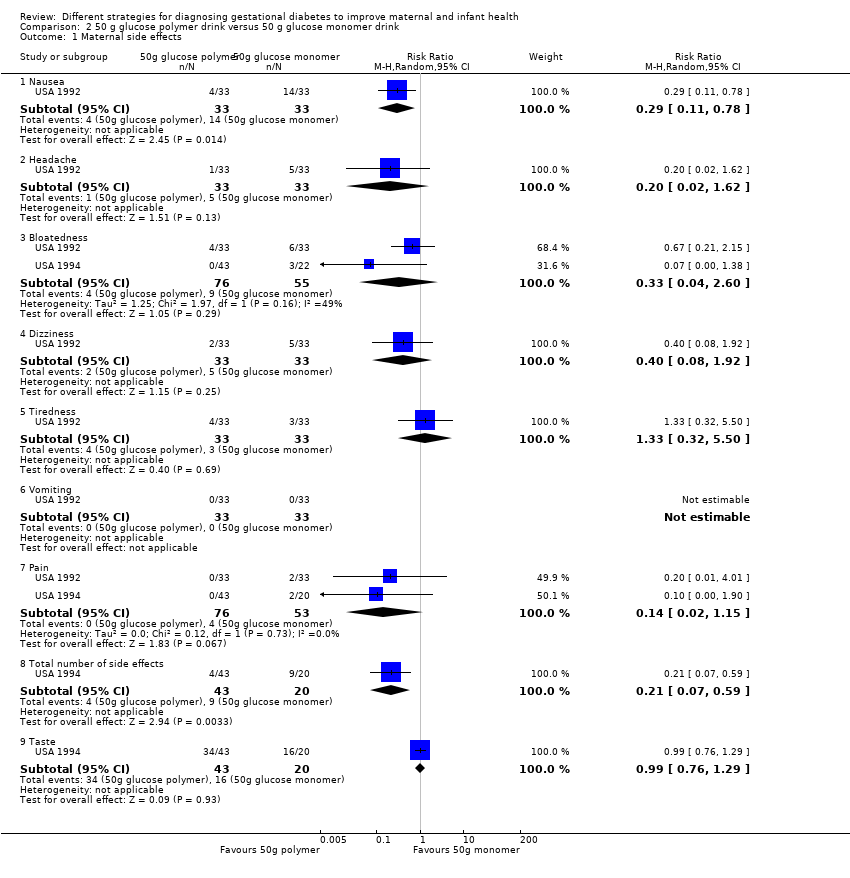 Comparison 2 50 g glucose polymer drink versus 50 g glucose monomer drink, Outcome 1 Maternal side effects. | ||||
| 1.1 Nausea | 1 | 66 | Risk Ratio (M‐H, Random, 95% CI) | 0.29 [0.11, 0.78] |
| 1.2 Headache | 1 | 66 | Risk Ratio (M‐H, Random, 95% CI) | 0.2 [0.02, 1.62] |
| 1.3 Bloatedness | 2 | 131 | Risk Ratio (M‐H, Random, 95% CI) | 0.33 [0.04, 2.60] |
| 1.4 Dizziness | 1 | 66 | Risk Ratio (M‐H, Random, 95% CI) | 0.4 [0.08, 1.92] |
| 1.5 Tiredness | 1 | 66 | Risk Ratio (M‐H, Random, 95% CI) | 1.33 [0.32, 5.50] |
| 1.6 Vomiting | 1 | 66 | Risk Ratio (M‐H, Random, 95% CI) | 0.0 [0.0, 0.0] |
| 1.7 Pain | 2 | 129 | Risk Ratio (M‐H, Random, 95% CI) | 0.14 [0.02, 1.15] |
| 1.8 Total number of side effects | 1 | 63 | Risk Ratio (M‐H, Random, 95% CI) | 0.21 [0.07, 0.59] |
| 1.9 Taste | 1 | 63 | Risk Ratio (M‐H, Random, 95% CI) | 0.99 [0.76, 1.29] |
| 2 Plasma glucose (mmol/L) Show forest plot | 3 | Mean Difference (IV, Random, 95% CI) | Subtotals only | |
| Analysis 2.2 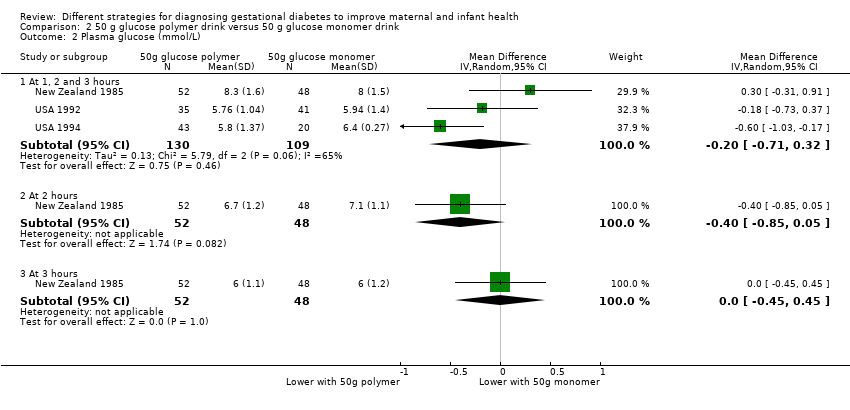 Comparison 2 50 g glucose polymer drink versus 50 g glucose monomer drink, Outcome 2 Plasma glucose (mmol/L). | ||||
| 2.1 At 1, 2 and 3 hours | 3 | 239 | Mean Difference (IV, Random, 95% CI) | ‐0.20 [‐0.71, 0.32] |
| 2.2 At 2 hours | 1 | 100 | Mean Difference (IV, Random, 95% CI) | ‐0.40 [‐0.85, 0.05] |
| 2.3 At 3 hours | 1 | 100 | Mean Difference (IV, Random, 95% CI) | 0.0 [‐0.45, 0.45] |
| 3 Gestational age at birth (weeks) Show forest plot | 1 | 100 | Mean Difference (IV, Fixed, 95% CI) | ‐0.80 [‐1.69, 0.09] |
| Analysis 2.3 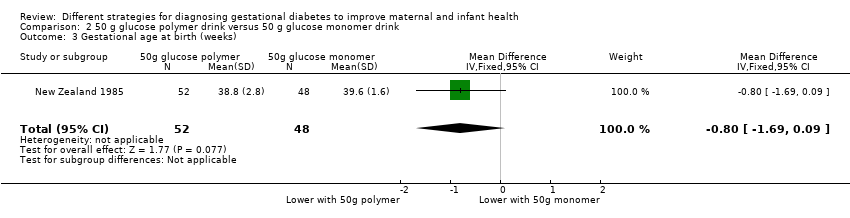 Comparison 2 50 g glucose polymer drink versus 50 g glucose monomer drink, Outcome 3 Gestational age at birth (weeks). | ||||
| Outcome or subgroup title | No. of studies | No. of participants | Statistical method | Effect size |
| 1 Maternal side effects Show forest plot | 1 | Risk Ratio (M‐H, Fixed, 95% CI) | Subtotals only | |
| Analysis 3.1  Comparison 3 Candy bar versus 50 g glucose monomer drink, Outcome 1 Maternal side effects. | ||||
| 1.1 Pain | 1 | 58 | Risk Ratio (M‐H, Fixed, 95% CI) | 0.17 [0.01, 3.91] |
| 1.2 Bloatedness | 1 | 60 | Risk Ratio (M‐H, Fixed, 95% CI) | 1.08 [0.21, 5.40] |
| 1.3 Total side effects | 1 | 58 | Risk Ratio (M‐H, Fixed, 95% CI) | 1.03 [0.58, 1.82] |
| 1.4 Taste | 1 | 59 | Risk Ratio (M‐H, Fixed, 95% CI) | 0.60 [0.42, 0.86] |
| 2 1‐hour serum glucose level (mmol/L) Show forest plot | 1 | 59 | Mean Difference (IV, Fixed, 95% CI) | ‐1.0 [‐1.13, ‐0.87] |
| Analysis 3.2 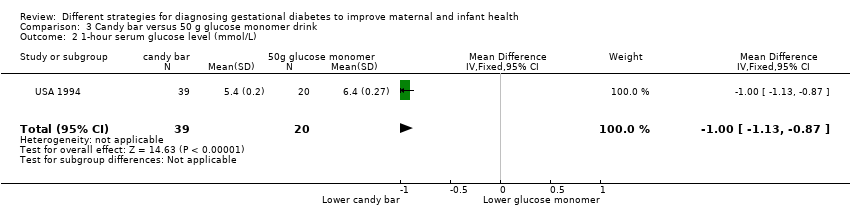 Comparison 3 Candy bar versus 50 g glucose monomer drink, Outcome 2 1‐hour serum glucose level (mmol/L). | ||||
| Outcome or subgroup title | No. of studies | No. of participants | Statistical method | Effect size |
| 1 Maternal side effects Show forest plot | 1 | 30 | Risk Ratio (M‐H, Fixed, 95% CI) | 0.08 [0.01, 0.56] |
| Analysis 4.1  Comparison 4 50 g glucose in food versus 50 g glucose drink, Outcome 1 Maternal side effects. | ||||
| 2 Need for repeat testing by same or alternative method Show forest plot | 1 | 30 | Risk Ratio (M‐H, Fixed, 95% CI) | 0.14 [0.01, 2.55] |
| Analysis 4.2 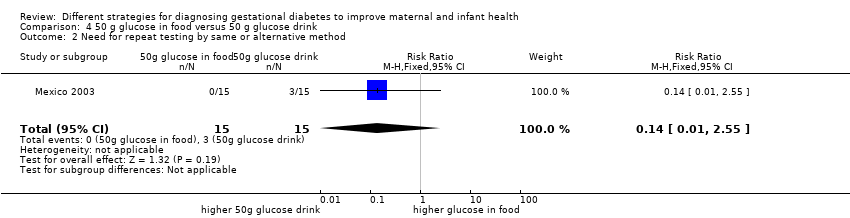 Comparison 4 50 g glucose in food versus 50 g glucose drink, Outcome 2 Need for repeat testing by same or alternative method. | ||||
| Outcome or subgroup title | No. of studies | No. of participants | Statistical method | Effect size |
| 1 Caesarean section Show forest plot | 1 | 116 | Risk Ratio (M‐H, Fixed, 95% CI) | 1.07 [0.85, 1.35] |
| Analysis 5.1 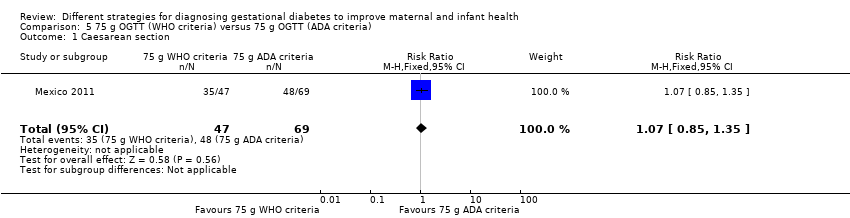 Comparison 5 75 g OGTT (WHO criteria) versus 75 g OGTT (ADA criteria), Outcome 1 Caesarean section. | ||||
| 2 Instrumental delivery Show forest plot | 1 | 116 | Risk Ratio (M‐H, Fixed, 95% CI) | 0.21 [0.01, 3.94] |
| Analysis 5.2  Comparison 5 75 g OGTT (WHO criteria) versus 75 g OGTT (ADA criteria), Outcome 2 Instrumental delivery. | ||||
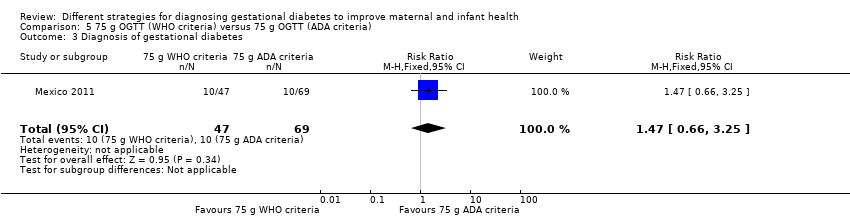
| 3 Diagnosis of gestational diabetes Show forest plot | 1 | 116 | Risk Ratio (M‐H, Fixed, 95% CI) | 1.47 [0.66, 3.25] |
| Analysis 5.3  Comparison 5 75 g OGTT (WHO criteria) versus 75 g OGTT (ADA criteria), Outcome 3 Diagnosis of gestational diabetes. | ||||
| 4 Macrosomia Show forest plot | 1 | 116 | Risk Ratio (M‐H, Fixed, 95% CI) | 0.73 [0.19, 2.79] |
| Analysis 5.4  Comparison 5 75 g OGTT (WHO criteria) versus 75 g OGTT (ADA criteria), Outcome 4 Macrosomia. | ||||
| 5 Stillbirth Show forest plot | 1 | 116 | Risk Ratio (M‐H, Fixed, 95% CI) | 0.49 [0.02, 11.68] |
| Analysis 5.5  Comparison 5 75 g OGTT (WHO criteria) versus 75 g OGTT (ADA criteria), Outcome 5 Stillbirth. | ||||
| Outcome or subgroup title | No. of studies | No. of participants | Statistical method | Effect size |
| 1 Diagnosis of gestational diabetes Show forest plot | 1 | 726 | Risk Ratio (M‐H, Random, 95% CI) | 0.51 [0.28, 0.95] |
| Analysis 6.1 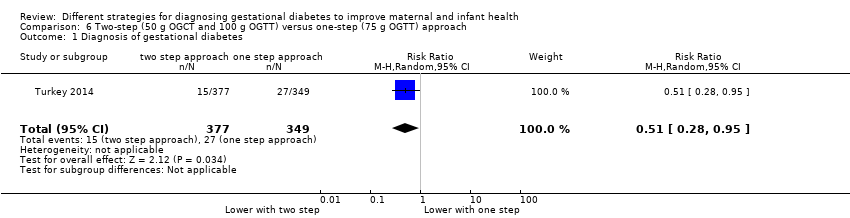 Comparison 6 Two‐step (50 g OGCT and 100 g OGTT) versus one‐step (75 g OGTT) approach, Outcome 1 Diagnosis of gestational diabetes. | ||||

Study flow diagram.

Risk of bias graph: review authors' judgements about each risk of bias item presented as percentages across all included studies.

Risk of bias summary: review authors' judgements about each risk of bias item for each included study.

Comparison 1 75 g OGTT versus 100 g OGTT, Outcome 1 Diagnosis of gestational diabetes.

Comparison 1 75 g OGTT versus 100 g OGTT, Outcome 2 Plasma glucose (mmol/L).

Comparison 2 50 g glucose polymer drink versus 50 g glucose monomer drink, Outcome 1 Maternal side effects.

Comparison 2 50 g glucose polymer drink versus 50 g glucose monomer drink, Outcome 2 Plasma glucose (mmol/L).

Comparison 2 50 g glucose polymer drink versus 50 g glucose monomer drink, Outcome 3 Gestational age at birth (weeks).

Comparison 3 Candy bar versus 50 g glucose monomer drink, Outcome 1 Maternal side effects.

Comparison 3 Candy bar versus 50 g glucose monomer drink, Outcome 2 1‐hour serum glucose level (mmol/L).

Comparison 4 50 g glucose in food versus 50 g glucose drink, Outcome 1 Maternal side effects.

Comparison 4 50 g glucose in food versus 50 g glucose drink, Outcome 2 Need for repeat testing by same or alternative method.

Comparison 5 75 g OGTT (WHO criteria) versus 75 g OGTT (ADA criteria), Outcome 1 Caesarean section.

Comparison 5 75 g OGTT (WHO criteria) versus 75 g OGTT (ADA criteria), Outcome 2 Instrumental delivery.
Comparison 5 75 g OGTT (WHO criteria) versus 75 g OGTT (ADA criteria), Outcome 3 Diagnosis of gestational diabetes.

Comparison 5 75 g OGTT (WHO criteria) versus 75 g OGTT (ADA criteria), Outcome 4 Macrosomia.

Comparison 5 75 g OGTT (WHO criteria) versus 75 g OGTT (ADA criteria), Outcome 5 Stillbirth.

Comparison 6 Two‐step (50 g OGCT and 100 g OGTT) versus one‐step (75 g OGTT) approach, Outcome 1 Diagnosis of gestational diabetes.
| 75 g oral glucose tolerance test (OGTT) versus 100 g OGTT for diagnosing gestational diabetes mellitus (GDM) to improve maternal and infant health | ||||||
| Patient or population: pregnant women at low or high risk of gestational diabetes Comparison: 100 g OGTT | ||||||
| Outcomes | Illustrative comparative risks* (95% CI) | Relative effect | Number of participants | Quality of the evidence | Comments | |
| Assumed risk | Corresponding risk | |||||
| 100 g OGTT | 75 g OGTT | |||||
| Diagnosis of gestational diabetes | Study population | RR 2.55 | 248 | ⊕⊝⊝⊝ | Women who received the 75 g OGTT test were 2.55 times more likely to test positive for gestational diabetes. | |
| 45 per 1000 | 116 per 1000 | |||||
| Caesarean section | See comment | See comment | Not estimable | 0 | See comment | None of the included studies reported this outcome. |
| Macrosomia > 4.5 kg or as defined in trial | See comment | See comment | Not estimable | 0 | See comment | None of the included studies reported this outcome. |
| Long‐term type 2 diabetes maternal | See comment | See comment | Not estimable | 0 | See comment | None of the included studies reported this outcome. |
| Long‐term type 2 diabetes infant | See comment | See comment | Not estimable | 0 | See comment | None of the included studies reported this outcome. |
| Economic costs | See comment | See comment | Not estimable | 0 | See comment | None of the included studies reported this outcome. |
| *The basis for the assumed risk (e.g. median control group risk across studies) is the risk. The corresponding risk (and its 95% confidence interval) is based on the assumed risk in the comparison group and the relative effect of the intervention (and its 95% CI). | ||||||
| GRADE Working Group grades of evidence. | ||||||
| aOne study with design limitations (‐1). | ||||||
| Time | Plasma |
| Fasting glucose (≥) | 5.1 mmol/L |
| 1‐hour glucose (≥) | 10.0 mmol/L |
| 2‐hour glucose (≥) | 8.5 mmol/L |
| IADPSG cutoff levels for diagnosis of gestational diabetes for plasma glucose; gestational diabetes is diagnosed if any one value equals or exceeds any other value (Metzger 2010). World Health Organization (WHO) published revised guidance in 2013 recommended IADPSG cutoff levels for the diagnosis of gestational diabetes (WHO 2013). | |
| Time | Whole blood venous | Whole blood capillary | Plasma venous | Plasma capillary |
| Fasting glucose (≥) | 6.1 mmol/L | 6.1 mmol/L | 7.0 mmol/L | 7.0 mmol/L |
| 2‐hour glucose | 6.7 mmol/L | 7.8 mmol/L | 7.8 mmol/L | 8.9 mmol/L |
| Cutoff levels for diagnosis of gestational diabetes for whole blood and plasma glucose. Diabetes is diagnosed if fasting plasma glucose level is > 7.0 mmol/L, or if 2‐hour level is > 11.1 mmol/L (WHO 1999). | ||||
| Time | |||
| Fasting glucose (≥) | 5.0 mmol/L | 5.8 mmol/L | 5.3 mmol/L |
| 1‐hour glucose (≥) | 9.1 mmol/L | 10.0 mmol/L | 10.0 mmol/L |
| 2‐hour glucose (≥) | 8.0 mmol/L | 9.1 mmol/L | 8.6 mmol/L |
| 3‐hour glucose (≥) | 6.9 mmol/L | 8.0 mmol/L | 7.8 mmol/L |
| Gestational diabetes is diagnosed when two or more measurements in a single column exceed stated cutoff levels. aO'Sullivan 1964: cutoff levels for diagnosis of gestational diabetes for whole blood. bNDDG 1997: cutoff for diagnosis of gestational diabetes for plasma glucose. cCarpenter 1982: cutoff for diagnosis of gestational diabetes for plasma glucose. | |||
| Outcome or subgroup title | No. of studies | No. of participants | Statistical method | Effect size |
| 1 Diagnosis of gestational diabetes Show forest plot | 1 | 248 | Risk Ratio (M‐H, Fixed, 95% CI) | 2.55 [0.96, 6.75] |
| 2 Plasma glucose (mmol/L) Show forest plot | 1 | Mean Difference (IV, Fixed, 95% CI) | Subtotals only | |
| 2.1 At 1 hour | 1 | 248 | Mean Difference (IV, Fixed, 95% CI) | ‐0.11 [‐0.44, 0.22] |
| 2.2 At 2 hours | 1 | 248 | Mean Difference (IV, Fixed, 95% CI) | ‐0.31 [‐0.64, 0.02] |
| 2.3 At 3 hours | 1 | 248 | Mean Difference (IV, Fixed, 95% CI) | ‐1.08 [‐1.47, ‐0.69] |
| Outcome or subgroup title | No. of studies | No. of participants | Statistical method | Effect size |
| 1 Maternal side effects Show forest plot | 2 | Risk Ratio (M‐H, Random, 95% CI) | Subtotals only | |
| 1.1 Nausea | 1 | 66 | Risk Ratio (M‐H, Random, 95% CI) | 0.29 [0.11, 0.78] |
| 1.2 Headache | 1 | 66 | Risk Ratio (M‐H, Random, 95% CI) | 0.2 [0.02, 1.62] |
| 1.3 Bloatedness | 2 | 131 | Risk Ratio (M‐H, Random, 95% CI) | 0.33 [0.04, 2.60] |
| 1.4 Dizziness | 1 | 66 | Risk Ratio (M‐H, Random, 95% CI) | 0.4 [0.08, 1.92] |
| 1.5 Tiredness | 1 | 66 | Risk Ratio (M‐H, Random, 95% CI) | 1.33 [0.32, 5.50] |
| 1.6 Vomiting | 1 | 66 | Risk Ratio (M‐H, Random, 95% CI) | 0.0 [0.0, 0.0] |
| 1.7 Pain | 2 | 129 | Risk Ratio (M‐H, Random, 95% CI) | 0.14 [0.02, 1.15] |
| 1.8 Total number of side effects | 1 | 63 | Risk Ratio (M‐H, Random, 95% CI) | 0.21 [0.07, 0.59] |
| 1.9 Taste | 1 | 63 | Risk Ratio (M‐H, Random, 95% CI) | 0.99 [0.76, 1.29] |
| 2 Plasma glucose (mmol/L) Show forest plot | 3 | Mean Difference (IV, Random, 95% CI) | Subtotals only | |
| 2.1 At 1, 2 and 3 hours | 3 | 239 | Mean Difference (IV, Random, 95% CI) | ‐0.20 [‐0.71, 0.32] |
| 2.2 At 2 hours | 1 | 100 | Mean Difference (IV, Random, 95% CI) | ‐0.40 [‐0.85, 0.05] |
| 2.3 At 3 hours | 1 | 100 | Mean Difference (IV, Random, 95% CI) | 0.0 [‐0.45, 0.45] |
| 3 Gestational age at birth (weeks) Show forest plot | 1 | 100 | Mean Difference (IV, Fixed, 95% CI) | ‐0.80 [‐1.69, 0.09] |
| Outcome or subgroup title | No. of studies | No. of participants | Statistical method | Effect size |
| 1 Maternal side effects Show forest plot | 1 | Risk Ratio (M‐H, Fixed, 95% CI) | Subtotals only | |
| 1.1 Pain | 1 | 58 | Risk Ratio (M‐H, Fixed, 95% CI) | 0.17 [0.01, 3.91] |
| 1.2 Bloatedness | 1 | 60 | Risk Ratio (M‐H, Fixed, 95% CI) | 1.08 [0.21, 5.40] |
| 1.3 Total side effects | 1 | 58 | Risk Ratio (M‐H, Fixed, 95% CI) | 1.03 [0.58, 1.82] |
| 1.4 Taste | 1 | 59 | Risk Ratio (M‐H, Fixed, 95% CI) | 0.60 [0.42, 0.86] |
| 2 1‐hour serum glucose level (mmol/L) Show forest plot | 1 | 59 | Mean Difference (IV, Fixed, 95% CI) | ‐1.0 [‐1.13, ‐0.87] |
| Outcome or subgroup title | No. of studies | No. of participants | Statistical method | Effect size |
| 1 Maternal side effects Show forest plot | 1 | 30 | Risk Ratio (M‐H, Fixed, 95% CI) | 0.08 [0.01, 0.56] |
| 2 Need for repeat testing by same or alternative method Show forest plot | 1 | 30 | Risk Ratio (M‐H, Fixed, 95% CI) | 0.14 [0.01, 2.55] |
| Outcome or subgroup title | No. of studies | No. of participants | Statistical method | Effect size |
| 1 Caesarean section Show forest plot | 1 | 116 | Risk Ratio (M‐H, Fixed, 95% CI) | 1.07 [0.85, 1.35] |
| 2 Instrumental delivery Show forest plot | 1 | 116 | Risk Ratio (M‐H, Fixed, 95% CI) | 0.21 [0.01, 3.94] |
| 3 Diagnosis of gestational diabetes Show forest plot | 1 | 116 | Risk Ratio (M‐H, Fixed, 95% CI) | 1.47 [0.66, 3.25] |
| 4 Macrosomia Show forest plot | 1 | 116 | Risk Ratio (M‐H, Fixed, 95% CI) | 0.73 [0.19, 2.79] |
| 5 Stillbirth Show forest plot | 1 | 116 | Risk Ratio (M‐H, Fixed, 95% CI) | 0.49 [0.02, 11.68] |
| Outcome or subgroup title | No. of studies | No. of participants | Statistical method | Effect size |
| 1 Diagnosis of gestational diabetes Show forest plot | 1 | 726 | Risk Ratio (M‐H, Random, 95% CI) | 0.51 [0.28, 0.95] |