Diferentes estrategias para el diagnóstico de la diabetes gestacional para mejorar la salud materna e infantil
Información
- DOI:
- https://doi.org/10.1002/14651858.CD007122.pub4Copiar DOI

- Base de datos:
-
- Cochrane Database of Systematic Reviews
- Versión publicada:
-
- 23 agosto 2017see what's new
- Tipo:
-
- Intervention
- Etapa:
-
- Review
- Grupo Editorial Cochrane:
-
Grupo Cochrane de Embarazo y parto
- Copyright:
-
- Copyright © 2017 The Cochrane Collaboration. Published by John Wiley & Sons, Ltd.
Cifras del artículo
Altmetric:
Citado por:
Autores
Contributions of authors
Three review authors were involved in planning and development of the review (Diane Farrar, Leila Duley and Debbie Lawlor). Diane Farrar and Lelia Duley analysed the studies and extracted data for the original review. All review authors analysed the studies included in the updates. Diane Farrar and Therese Dowswell extracted data. Therese Dowswell generated the 'Summary of findings' table with comments from all remaining review authors. Diane Farrar drafted the review, incorporating comments from Lelia Duley, Therese Dowswell and Debbie Lawlor.
Sources of support
Internal sources
-
Medical Research Council Integrative Epidemiology Unit, The University of Bristol, UK.
External sources
-
National Institute for Health Research Post‐doctoral Fellowship Award, UK.
-
National Institute for Health Research (NIHR), UKNIHR Cochrane Programme Grant Project: 13/89/05 – Pregnancy and childbirth systematic reviews to support clinical guidelines, UK.
Declarations of interest
Diane Farrar: none known.
Lelia Duley: I hold an NIHR Programme Grant for Applied Research addressing care at preterm birth.
Therese Dowswell: I am paid via my institution by the UK NHS to work on a range of Cochrane Reviews. In the last 36 months I have received funding from the WHO to work on other Cochrane Reviews. The Funders have no influence on the content or conclusions of the reviews I work on.
Debbie Lawlor: none known.
Acknowledgements
Thank you to Sabina Abbas for transcribing Weiss (Austria 1994) from German to English, and thank you to Ana Duarte for translating Dueñas (Mexico 2011) from Portuguese to English.
Nancy Medley was an author on the previous 2015 update. Her work was financially supported by the UNDP/UNFPA/UNICEF/WHO/World Bank Special Programme of Research, Development and Research Training in Human Reproduction (HRP), Department of Reproductive Health and Research (RHR), World Health Organization. The named review authors alone are responsible for the views expressed in this publication.
This project was supported by the National Institute for Health Research, via Cochrane Programme Grant funding to Cochrane Pregnancy and Childbirth. The views and opinions expressed therein are those of the authors and do not necessarily reflect those of the Systematic Reviews Programme, NIHR, NHS or the Department of Health.
Therese Dowswell is supported by the NIHR Cochrane Programme Grant Project: 13/89/05 – Pregnancy and childbirth systematic reviews to support clinical guidelines.
Version history
| Published | Title | Stage | Authors | Version |
| 2017 Aug 23 | Different strategies for diagnosing gestational diabetes to improve maternal and infant health | Review | Diane Farrar, Lelia Duley, Therese Dowswell, Debbie A Lawlor | |
| 2015 Jan 21 | Different strategies for diagnosing gestational diabetes to improve maternal and infant health | Review | Diane Farrar, Lelia Duley, Nancy Medley, Debbie A Lawlor | |
| 2011 Oct 05 | Different strategies for diagnosing gestational diabetes to improve maternal and infant health | Review | Diane Farrar, Lelia Duley, Debbie A Lawlor | |
| 2008 Apr 23 | Alternative strategies for diagnosing gestational diabetes mellitus to improve maternal and infant health | Protocol | Diane Farrar, Lelia Duley, Debbie A Lawlor | |
Differences between protocol and review
*A number of the primary and secondary maternal and infant outcome measures are based on the core outcomes for Cochrane gestational diabetes reviews reached by consensus between the review authors of reviews for treatment of GDM. A number of these were added as secondary outcomes for this update and are labelled as non‐prespecified in the following list.
Maternal
-
Perineal trauma (non‐prespecified outcome).*
-
Placental abruption (non‐prespecified outcome).*
-
Weight gain during pregnancy (non‐prespecified outcome).*
-
Breastfeeding (e.g. at discharge, six weeks postpartum) (non‐prespecified outcome).*
Neonatal
-
Apgar score (less than seven at five minutes) (non‐prespecified outcome).*
-
Birthweight and z‐score (non‐prespecified outcome).*
-
Ponderal index (non‐prespecified outcome).*
-
Measures of adiposity (non‐prespecified outcome).*
-
Shoulder dystocia (non‐prespecified outcome).*
-
Bone fracture (non‐prespecified outcome).*
-
Nerve palsy (non‐prespecified outcome).*
-
Relavent biomarkers, e.g. cord C‐peptide, cord insulin (non‐prespecified outcome).*
The outcome plasma glucose was not originally specified in the protocol but was added in the first version of this review.
Methods have been updated to current Cochrane Pregnancy and Childbirth Group standard text, and a 'Summary of findings' table has been incorporated.
Keywords
MeSH
Medical Subject Headings (MeSH) Keywords
Medical Subject Headings Check Words
Female; Humans; Infant, Newborn; Pregnancy;
PICO

Study flow diagram.

Risk of bias graph: review authors' judgements about each risk of bias item presented as percentages across all included studies.

Risk of bias summary: review authors' judgements about each risk of bias item for each included study.

Comparison 1 75 g OGTT versus 100 g OGTT, Outcome 1 Diagnosis of gestational diabetes.

Comparison 1 75 g OGTT versus 100 g OGTT, Outcome 2 Plasma glucose (mmol/L).
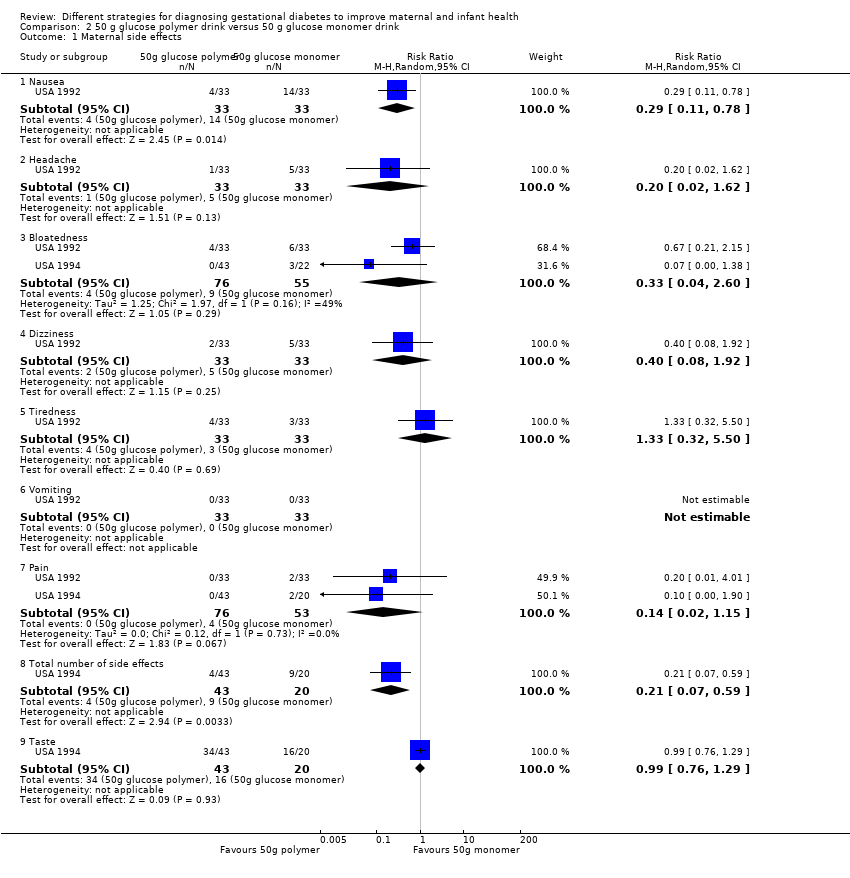
Comparison 2 50 g glucose polymer drink versus 50 g glucose monomer drink, Outcome 1 Maternal side effects.

Comparison 2 50 g glucose polymer drink versus 50 g glucose monomer drink, Outcome 2 Plasma glucose (mmol/L).

Comparison 2 50 g glucose polymer drink versus 50 g glucose monomer drink, Outcome 3 Gestational age at birth (weeks).

Comparison 3 Candy bar versus 50 g glucose monomer drink, Outcome 1 Maternal side effects.

Comparison 3 Candy bar versus 50 g glucose monomer drink, Outcome 2 1‐hour serum glucose level (mmol/L).

Comparison 4 50 g glucose in food versus 50 g glucose drink, Outcome 1 Maternal side effects.
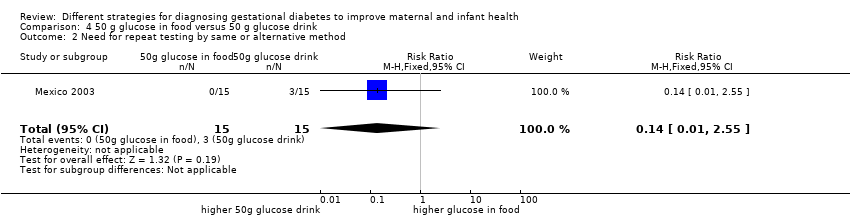
Comparison 4 50 g glucose in food versus 50 g glucose drink, Outcome 2 Need for repeat testing by same or alternative method.

Comparison 5 75 g OGTT (WHO criteria) versus 75 g OGTT (ADA criteria), Outcome 1 Caesarean section.

Comparison 5 75 g OGTT (WHO criteria) versus 75 g OGTT (ADA criteria), Outcome 2 Instrumental delivery.
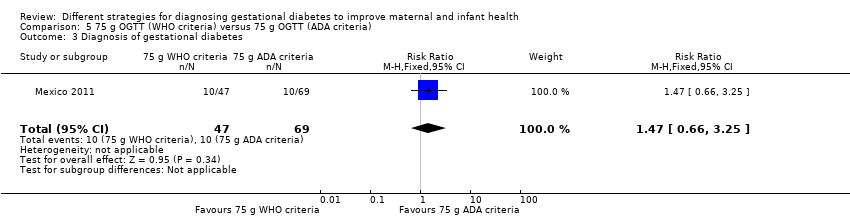
Comparison 5 75 g OGTT (WHO criteria) versus 75 g OGTT (ADA criteria), Outcome 3 Diagnosis of gestational diabetes.

Comparison 5 75 g OGTT (WHO criteria) versus 75 g OGTT (ADA criteria), Outcome 4 Macrosomia.

Comparison 5 75 g OGTT (WHO criteria) versus 75 g OGTT (ADA criteria), Outcome 5 Stillbirth.

Comparison 6 Two‐step (50 g OGCT and 100 g OGTT) versus one‐step (75 g OGTT) approach, Outcome 1 Diagnosis of gestational diabetes.
| 75 g oral glucose tolerance test (OGTT) versus 100 g OGTT for diagnosing gestational diabetes mellitus (GDM) to improve maternal and infant health | ||||||
| Patient or population: pregnant women at low or high risk of gestational diabetes Comparison: 100 g OGTT | ||||||
| Outcomes | Illustrative comparative risks* (95% CI) | Relative effect | Number of participants | Quality of the evidence | Comments | |
| Assumed risk | Corresponding risk | |||||
| 100 g OGTT | 75 g OGTT | |||||
| Diagnosis of gestational diabetes | Study population | RR 2.55 | 248 | ⊕⊝⊝⊝ | Women who received the 75 g OGTT test were 2.55 times more likely to test positive for gestational diabetes. | |
| 45 per 1000 | 116 per 1000 | |||||
| Caesarean section | See comment | See comment | Not estimable | 0 | See comment | None of the included studies reported this outcome. |
| Macrosomia > 4.5 kg or as defined in trial | See comment | See comment | Not estimable | 0 | See comment | None of the included studies reported this outcome. |
| Long‐term type 2 diabetes maternal | See comment | See comment | Not estimable | 0 | See comment | None of the included studies reported this outcome. |
| Long‐term type 2 diabetes infant | See comment | See comment | Not estimable | 0 | See comment | None of the included studies reported this outcome. |
| Economic costs | See comment | See comment | Not estimable | 0 | See comment | None of the included studies reported this outcome. |
| *The basis for the assumed risk (e.g. median control group risk across studies) is the risk. The corresponding risk (and its 95% confidence interval) is based on the assumed risk in the comparison group and the relative effect of the intervention (and its 95% CI). | ||||||
| GRADE Working Group grades of evidence. | ||||||
| aOne study with design limitations (‐1). | ||||||
| Time | Plasma |
| Fasting glucose (≥) | 5.1 mmol/L |
| 1‐hour glucose (≥) | 10.0 mmol/L |
| 2‐hour glucose (≥) | 8.5 mmol/L |
| IADPSG cutoff levels for diagnosis of gestational diabetes for plasma glucose; gestational diabetes is diagnosed if any one value equals or exceeds any other value (Metzger 2010). World Health Organization (WHO) published revised guidance in 2013 recommended IADPSG cutoff levels for the diagnosis of gestational diabetes (WHO 2013). | |
| Time | Whole blood venous | Whole blood capillary | Plasma venous | Plasma capillary |
| Fasting glucose (≥) | 6.1 mmol/L | 6.1 mmol/L | 7.0 mmol/L | 7.0 mmol/L |
| 2‐hour glucose | 6.7 mmol/L | 7.8 mmol/L | 7.8 mmol/L | 8.9 mmol/L |
| Cutoff levels for diagnosis of gestational diabetes for whole blood and plasma glucose. Diabetes is diagnosed if fasting plasma glucose level is > 7.0 mmol/L, or if 2‐hour level is > 11.1 mmol/L (WHO 1999). | ||||
| Time | |||
| Fasting glucose (≥) | 5.0 mmol/L | 5.8 mmol/L | 5.3 mmol/L |
| 1‐hour glucose (≥) | 9.1 mmol/L | 10.0 mmol/L | 10.0 mmol/L |
| 2‐hour glucose (≥) | 8.0 mmol/L | 9.1 mmol/L | 8.6 mmol/L |
| 3‐hour glucose (≥) | 6.9 mmol/L | 8.0 mmol/L | 7.8 mmol/L |
| Gestational diabetes is diagnosed when two or more measurements in a single column exceed stated cutoff levels. aO'Sullivan 1964: cutoff levels for diagnosis of gestational diabetes for whole blood. bNDDG 1997: cutoff for diagnosis of gestational diabetes for plasma glucose. cCarpenter 1982: cutoff for diagnosis of gestational diabetes for plasma glucose. | |||
| Outcome or subgroup title | No. of studies | No. of participants | Statistical method | Effect size |
| 1 Diagnosis of gestational diabetes Show forest plot | 1 | 248 | Risk Ratio (M‐H, Fixed, 95% CI) | 2.55 [0.96, 6.75] |
| 2 Plasma glucose (mmol/L) Show forest plot | 1 | Mean Difference (IV, Fixed, 95% CI) | Subtotals only | |
| 2.1 At 1 hour | 1 | 248 | Mean Difference (IV, Fixed, 95% CI) | ‐0.11 [‐0.44, 0.22] |
| 2.2 At 2 hours | 1 | 248 | Mean Difference (IV, Fixed, 95% CI) | ‐0.31 [‐0.64, 0.02] |
| 2.3 At 3 hours | 1 | 248 | Mean Difference (IV, Fixed, 95% CI) | ‐1.08 [‐1.47, ‐0.69] |
| Outcome or subgroup title | No. of studies | No. of participants | Statistical method | Effect size |
| 1 Maternal side effects Show forest plot | 2 | Risk Ratio (M‐H, Random, 95% CI) | Subtotals only | |
| 1.1 Nausea | 1 | 66 | Risk Ratio (M‐H, Random, 95% CI) | 0.29 [0.11, 0.78] |
| 1.2 Headache | 1 | 66 | Risk Ratio (M‐H, Random, 95% CI) | 0.2 [0.02, 1.62] |
| 1.3 Bloatedness | 2 | 131 | Risk Ratio (M‐H, Random, 95% CI) | 0.33 [0.04, 2.60] |
| 1.4 Dizziness | 1 | 66 | Risk Ratio (M‐H, Random, 95% CI) | 0.4 [0.08, 1.92] |
| 1.5 Tiredness | 1 | 66 | Risk Ratio (M‐H, Random, 95% CI) | 1.33 [0.32, 5.50] |
| 1.6 Vomiting | 1 | 66 | Risk Ratio (M‐H, Random, 95% CI) | 0.0 [0.0, 0.0] |
| 1.7 Pain | 2 | 129 | Risk Ratio (M‐H, Random, 95% CI) | 0.14 [0.02, 1.15] |
| 1.8 Total number of side effects | 1 | 63 | Risk Ratio (M‐H, Random, 95% CI) | 0.21 [0.07, 0.59] |
| 1.9 Taste | 1 | 63 | Risk Ratio (M‐H, Random, 95% CI) | 0.99 [0.76, 1.29] |
| 2 Plasma glucose (mmol/L) Show forest plot | 3 | Mean Difference (IV, Random, 95% CI) | Subtotals only | |
| 2.1 At 1, 2 and 3 hours | 3 | 239 | Mean Difference (IV, Random, 95% CI) | ‐0.20 [‐0.71, 0.32] |
| 2.2 At 2 hours | 1 | 100 | Mean Difference (IV, Random, 95% CI) | ‐0.40 [‐0.85, 0.05] |
| 2.3 At 3 hours | 1 | 100 | Mean Difference (IV, Random, 95% CI) | 0.0 [‐0.45, 0.45] |
| 3 Gestational age at birth (weeks) Show forest plot | 1 | 100 | Mean Difference (IV, Fixed, 95% CI) | ‐0.80 [‐1.69, 0.09] |
| Outcome or subgroup title | No. of studies | No. of participants | Statistical method | Effect size |
| 1 Maternal side effects Show forest plot | 1 | Risk Ratio (M‐H, Fixed, 95% CI) | Subtotals only | |
| 1.1 Pain | 1 | 58 | Risk Ratio (M‐H, Fixed, 95% CI) | 0.17 [0.01, 3.91] |
| 1.2 Bloatedness | 1 | 60 | Risk Ratio (M‐H, Fixed, 95% CI) | 1.08 [0.21, 5.40] |
| 1.3 Total side effects | 1 | 58 | Risk Ratio (M‐H, Fixed, 95% CI) | 1.03 [0.58, 1.82] |
| 1.4 Taste | 1 | 59 | Risk Ratio (M‐H, Fixed, 95% CI) | 0.60 [0.42, 0.86] |
| 2 1‐hour serum glucose level (mmol/L) Show forest plot | 1 | 59 | Mean Difference (IV, Fixed, 95% CI) | ‐1.0 [‐1.13, ‐0.87] |
| Outcome or subgroup title | No. of studies | No. of participants | Statistical method | Effect size |
| 1 Maternal side effects Show forest plot | 1 | 30 | Risk Ratio (M‐H, Fixed, 95% CI) | 0.08 [0.01, 0.56] |
| 2 Need for repeat testing by same or alternative method Show forest plot | 1 | 30 | Risk Ratio (M‐H, Fixed, 95% CI) | 0.14 [0.01, 2.55] |
| Outcome or subgroup title | No. of studies | No. of participants | Statistical method | Effect size |
| 1 Caesarean section Show forest plot | 1 | 116 | Risk Ratio (M‐H, Fixed, 95% CI) | 1.07 [0.85, 1.35] |
| 2 Instrumental delivery Show forest plot | 1 | 116 | Risk Ratio (M‐H, Fixed, 95% CI) | 0.21 [0.01, 3.94] |
| 3 Diagnosis of gestational diabetes Show forest plot | 1 | 116 | Risk Ratio (M‐H, Fixed, 95% CI) | 1.47 [0.66, 3.25] |
| 4 Macrosomia Show forest plot | 1 | 116 | Risk Ratio (M‐H, Fixed, 95% CI) | 0.73 [0.19, 2.79] |
| 5 Stillbirth Show forest plot | 1 | 116 | Risk Ratio (M‐H, Fixed, 95% CI) | 0.49 [0.02, 11.68] |
| Outcome or subgroup title | No. of studies | No. of participants | Statistical method | Effect size |
| 1 Diagnosis of gestational diabetes Show forest plot | 1 | 726 | Risk Ratio (M‐H, Random, 95% CI) | 0.51 [0.28, 0.95] |