Quimioterapia sola versus quimioterapia más radioterapia para pacientes adultos con linfoma de Hodgkin en estadio inicial
Resumen
Antecedentes
La modalidad de tratamiento combinado, compuesta de quimioterapia seguida de radioterapia localizada, es el tratamiento estándar para los pacientes con linfoma de Hodgkin (LH) en estadio inicial. Sin embargo, debido a los efectos adversos a largo plazo como las neoplasias malignas secundarias, recientemente se ha cuestionado la función de la radioterapia, y algunos grupos de estudio apoyan la quimioterapia sola para esta indicación.
Objetivos
Evaluar los efectos de la quimioterapia sola en comparación con quimioterapia más radioterapia en pacientes adultos con LH en estadio inicial.
Métodos de búsqueda
Para la versión original de esta revisión, se hicieron búsquedas de ensayos controlados aleatorios (ECA) en MEDLINE, Embase y CENTRAL, así como en actas de congresos (American Society of Hematology, American Society of Clinical Oncology, International Symposium of Hodgkin Lymphoma), desde enero 1980 hasta noviembre 2010 que comparaban quimioterapia sola versus regímenes de quimioterapia más radioterapia. Para la revisión actualizada, se hicieron búsquedas en MEDLINE, CENTRAL y en actas de congresos hasta diciembre 2016.
Criterios de selección
Se incluyeron los ECA que compararon quimioterapia sola con quimioterapia más radioterapia en pacientes con LH en estadio inicial. Se excluyeron los ensayos con más del 20% de los pacientes en estadio avanzado. Como el valor de la radioterapia agregada a la quimioterapia todavía no está claro, también se comparó con más ciclos de quimioterapia en el brazo control. En esta revisión actualizada también se incluyó una segunda comparación que evaluó los ensayos con diferentes números de ciclos de quimioterapia entre los brazos de intervención y control, a partir de la suposición de que se utilizó el mismo régimen de quimioterapia en ambos brazos. Se excluyeron los ensayos que sólo evaluaron niños, por lo que en esta revisión actualizada solamente se incluyeron los ensayos que reclutaron pacientes adultos.
Obtención y análisis de los datos
Dos autores de la revisión, de forma independiente, extrajeron los datos y evaluaron la calidad de los ensayos . Se contactó con los autores de los estudios para obtener la información faltante. Como medidas de efecto se utilizaron los cocientes de riesgos instantáneos (CRI) para la supervivencia general (SG) y la supervivencia libre de progresión (SLP) y los cocientes de riesgos (CR) para las tasas de respuesta. Como no todos los ensayos informaron la SLP según las definiciones de la presente revisión, todos los resultados similares (p.ej. supervivencia libre de eventos) se evaluaron como SLP/control del tumor.
Resultados principales
La búsqueda obtuvo 5518 referencias potencialmente relevantes. De éstas, se incluyeron siete ECA en los análisis con 2564 pacientes. En contraste con la primera versión de esta revisión con cinco ensayos, se excluyeron los ensayos que aleatorizaban niños. Como resultado, se excluyó un ensayo de los análisis anteriores y se identificaron tres nuevos ensayos.
Cinco ensayos con 1388 pacientes compararon la combinación de quimioterapia sola y quimioterapia más radioterapia, con el mismo número de ciclos de quimioterapia en ambos brazos. El agregado de radioterapia a la quimioterapia probablemente tiene poca o ninguna diferencia en la SG (CRI 0,48; intervalo de confianza [IC] del 95%: 0,22 a 1,06; p = 0,07, evidencia de calidad moderada); sin embargo, dos ensayos incluidos tuvieron un posible alto riesgo de otros sesgos debido a que un número elevado de pacientes no recibió la radioterapia planificada. Después de excluir estos ensayos en un análisis de sensibilidad, los resultados mostraron que la combinación de quimioterapia y radioterapia mejoró la SG en comparación con la quimioterapia sola (CRI 0,31; IC del 95%: 0,19 a 0,52; p < 0,00001, evidencia de calidad moderada). A diferencia de la quimioterapia sola, la administración de quimioterapia y radioterapia mejoró la SLP (CRI 0,42; IC del 95%: 0,25 a 0,72; P = 0,001; evidencia de calidad moderada). Con respecto a la mortalidad relacionada con infección (CR 0,33; IC del 95%: 0,01 a 8,06; P = 0,5; evidencia de baja calidad, la mortalidad relacionada con un segundo cáncer (CR 0,53; IC del 95%: 0,07 a 4,29; P = 0,55; evidencia de baja calidad) y la mortalidad relacionada con enfermedades cardíacas (CR 2,94; IC del 95%: 0,31 a 27,55; P = 0,35;evidencia de baja calidad), no hay evidencia de una diferencia entre la administración de quimioterapia sola y quimioterapia más radioterapia. Para la tasa de respuesta completa (TRC) (CR 1,08; IC del 95%: 0,93 a 1,25; P = 0,33; evidencia de baja calidad), tampoco hay evidencia de diferencias entre los grupos de tratamiento.
Dos ensayos con 1176 pacientes compararon la combinación de quimioterapia sola y quimioterapia más radioterapia con diferentes números de ciclos de quimioterapia en ambos brazos. La SG sólo se informa en un ensayo; la administración de quimioterapia sola (más ciclos de quimioterapia) puede mejorar la SG en comparación con quimioterapia más radioterapia (CRI 2,12; IC del 95%: 1,03 a 4,37; P = 0,04; evidencia de baja calidad). Este ensayo también tuvo un posible alto riesgo de otros sesgos debido a que un número elevado de pacientes no recibió el tratamiento planificado. No hay evidencia de diferencias entre la quimioterapia sola y la quimioterapia más radioterapia con respecto a la SLP (CRI 0,42; IC del 95%: 0,14 a 1,24; P = 0,12; evidencia de baja calidad). Después de excluir el ensayo con pacientes que no recibieron el tratamiento planificado en un análisis de sensibilidad, los resultados mostraron que la combinación de quimioterapia y radioterapia mejoró la SLP en comparación con quimioterapia sola (CRI 0,24; IC del 95%: 0,070 a 0,88; p = 0,03 según un ensayo). Para la mortalidad relacionada con infección (CR 6,90; IC del 95%: 0,36 a 132,34; P = 0,2; evidencia de baja calidad, la mortalidad relacionada con un segundo cáncer (CR 2,22; IC del 95%: 0,7 a 7,03; P = 0,18; evidencia de baja calidad) y la mortalidad relacionada con enfermedades cardíacas (CR 0,99; IC del 95%: 0,14 a 6,90; P = 0,99; evidencia de baja calidad), no hay evidencia de diferencias entre la administración de quimioterapia sola y de quimioterapia más radioterapia. No se informó la TRC.
Conclusiones de los autores
Esta revisión sistemática comparó los efectos de la quimioterapia sola y la quimioterapia más radioterapia en pacientes adultos con LH en estadio inicial.
Para la comparación con los mismos números de ciclos de quimioterapia en ambos brazos se encontró evidencia de calidad moderada de que la SLP es superior en los pacientes que reciben quimioterapia más radioterapia en comparación con los que reciben quimioterapia sola. El agregado de radioterapia a la quimioterapia probablemente tiene poca o ninguna diferencia en cuanto a la SG. El análisis de sensibilidad sin los ensayos con posible alto riesgo de otros sesgos mostró que la quimioterapia más radioterapia mejora la SG en comparación con la quimioterapia sola.
Para la comparación con diferentes números de ciclos de quimioterapia entre los brazos no hubo una posible implicación en la SG y la SLP debido a la baja calidad de la evidencia para los resultados.
PICO
Resumen en términos sencillos
Tratamiento del linfoma de Hodgkin en estadio inicial
Antecedentes
El linfoma de Hodgkin (LH) es una neoplasia del sistema linfático. Puede presentarse en niños y adultos, pero es más frecuente durante la tercera década de la vida. Es una de las modalidades de cáncer más curable. Hay cuatro estadios del LH; los estadios I y II se consideran como LH en estadio inicial y los estadios III y IV como estadio avanzado. El linfoma de Hodgkin en estadio inicial se puede subclasificar en estadio inicial favorable e inicial desfavorable si se tienen en cuenta factores como la presencia o ausencia de neoplasia maligna de gran masa tumoral y la presencia o ausencia de síntomas B, como fiebre o sudoración nocturna. Las opciones de tratamiento son la quimioterapia, la radioterapia o ambas. La radioterapia puede causar más efectos secundarios tardíos relacionados con el tratamiento que la quimioterapia, incluidas las neoplasias malignas secundarias; lo anterior se aplica al menos a los grandes campos de tratamiento utilizados en el pasado. Sin embargo, con los campos de tratamiento modernos muy limitados, los riesgos de efectos secundarios a largo plazo causados por la radioterapia se han reducido de forma significativa.
Pregunta de la revisión
Esta revisión sistemática compara la supervivencia general (SG) y la supervivencia libre de progresión (SLP) en pacientes adultos con LH en estadio inicial después de recibir quimioterapia sola o quimioterapia más radioterapia.
Características de los estudios
Se realizaron búsquedas en bases de datos médicas importantes, como el Registro Cochrane Central de Ensayos Controlados (Cochrane Central Register of Controlled Trials). Dos autores de la revisión, de forma independiente, examinaron, resumieron y analizaron los resultados. Esto llevó a la inclusión de siete ensayos controlados aleatorios con 2564 pacientes.
La evidencia se actualizó hasta diciembre de 2016.
Resultados clave
Para la comparación de quimioterapia sola y quimioterapia más radioterapia con el mismo número de ciclos de quimioterapia en ambos brazos, esta revisión sistemática no encontró evidencia de diferencias con respecto a la SG entre las intervenciones; sin embargo, dos ensayos incluidos tuvieron posible alto riesgo de otros sesgos debido a que un número elevado de pacientes no recibió radioterapia según lo previsto. Después de excluir estos ensayos en un análisis adicional, la SG fue superior en los pacientes adultos que recibieron quimioterapia más radioterapia en comparación con los que recibieron quimioterapia sola. La SLP fue también superior en los pacientes adultos que recibieron quimioterapia más radioterapia. La mayoría de los ensayos informaron los eventos adversos (EA), pero de diferentes maneras. Debido a que los datos comparables no fueron suficientes la revisión se centró en los eventos adversos considerados de interés particular. Para la mortalidad relacionada con infección, la mortalidad relacionada con un segundo cáncer y la mortalidad relacionada con enfermedades cardíacas, no hubo evidencia de diferencias entre los grupos de tratamiento. Para la tasa de respuesta completa (TRC) tampoco hubo evidencia de diferencias entre los grupos de tratamiento.
Para la comparación de quimioterapia sola y quimioterapia más radioterapia con diferentes números de ciclos de quimioterapia en los brazos, la SG sólo se informó en un ensayo. La administración de quimioterapia sola puede mejorar la SG en comparación con quimioterapia más radioterapia. No hubo evidencia de diferencias entre los grupos de tratamiento con respecto a la SLP. Después de excluir un ensayo con pacientes que no recibieron el tratamiento planificado, los resultados indicaron que la quimioterapia más la radioterapia mejoró la SLP. Para la mortalidad relacionada con infección, la mortalidad relacionada con un segundo cáncer y la mortalidad relacionada con enfermedades cardíacas, no hubo evidencia de diferencias entre los grupos de tratamiento. No se informó la TR.
Calidad de la evidencia
Para el mismo número de ciclos de quimioterapia en ambos brazos, la calidad de la evidencia para la SG y SLP se consideró moderada, y para los EA y la TRC se consideró baja.
Para diferentes números de ciclos de quimioterapia en los brazos, la calidad de la evidencia para la SG, la SLP y los EA se consideró baja.
Conclusión
Esta revisión sistemática comparó los efectos de la quimioterapia sola y la quimioterapia más radioterapia en pacientes adultos con LH en estadio inicial.
Para la comparación con los mismos números de ciclos de quimioterapia en ambos brazos se encontró evidencia de calidad moderada de que la SLP es superior en los pacientes que reciben quimioterapia más radioterapia en comparación con los que reciben quimioterapia rola. El agregado de radioterapia a la quimioterapia probablemente tiene poca o ninguna diferencia en la SG. Un análisis adicional sin los ensayos con posible alto riesgo de otros esos mostró que la quimioterapia más la radioterapia mejora la SG (en ambos análisis la evidencia fue de calidad moderada).
Para la comparación de quimioterapia sola y quimioterapia más radioterapia con diferentes números de ciclos de quimioterapia entre los brazos no hubo posibles implicaciones en la SG y la SLP debido a la baja calidad de la evidencia para los resultados.
Authors' conclusions
Summary of findings
| Same number of chemotherapy cycles in both arms | ||||||
| Chemotherapy alone versus chemotherapy plus radiotherapy for adults with early stage Hodgkin lymphoma. | ||||||
| Outcomes | № of participants | Quality of the evidence | Relative effect | Anticipated absolute effects* (95% CI) | Comment | |
| Risk with chemotherapy only | Risk with chemotherapy plus radiotherapy | |||||
| Mortality (calculated instead of overall survival) Follow‐up : 5 years The low‐ mortality rate was taken from the EORTC‐GELA H9‐F trial, the high‐ mortality rate was taken from the Mexico B2H031trial | 1388 | ⊕⊕⊕⊝ | HR 0.48 | Low risk to die | ||
| 30 per 1000 | 15 per 1000 | Number of people who will die | ||||
| High risk to die | ||||||
| 150 per 1000 | 75 per 1000 | |||||
| Mortality sensitivity analysis (calculated instead of overall survival) ‐ without UK NCRI Rapid trial and MSKCC trial #90‐44due to high risk of other bias Follow‐up : 5 years The low‐ mortality rate was taken from the EORTC‐GELA H9‐F trial, the high‐ mortality rate was taken from the Mexico B2H031trial | 816 | ⊕⊕⊕⊝ | HR 0.31 | Low risk to die | ||
| 30 per 1000 | 9 per 1000 | Number of people who will die | ||||
| High risk to die | ||||||
| 150 per 1000 | 49 per 1000 | |||||
| Relapse, progression or death (calculated instead of PFS) Follow‐up : 5 years | 1351 | ⊕⊕⊕⊝ | HR 0.42 | Low risk of progress, relapse or death | ||
| 100 per 1000 | 43 per 1000 | Number of people who will have a progress, relapse or die | ||||
| High risk of progress, relapse or death | ||||||
| 300 per 1000 | 139 per 1000 | |||||
| Infection‐ related mortality | 152 | ⊕⊕⊝⊝ | RR 0.33 | Study population | ||
| 13 per 1000 | 4 per 1000 | |||||
| Second cancer‐ related mortality | 1199 | ⊕⊕⊝⊝ | RR 0.53 | Study population | ||
| 9 per 1,000 | 5 per 1000 | |||||
| Cardiac disease‐ related mortality | 457 | ⊕⊕⊝⊝ | RR 2.94 | Low risk | ||
| 1 per 1,000 | 3 per 1000 | |||||
| Complete response rate | 376 | ⊕⊕⊝⊝ | RR 1.08 | Study population | ||
| 839 per 1,000 | 906 per 1000 | |||||
| *The risk in the intervention group (and its 95% confidence interval) is based on the assumed risk in the comparison group and the relative effect of the intervention (and its 95% CI). | ||||||
| GRADE Working Group grades of evidence | ||||||
| 1 Substantial heterogeneity, downgraded by 1 point for inconsistency 2 Sensitivity analysis, excluding two trials with potential high risk of other bias. Downgraded by 1 point for imprecision due to low number of included patients and events 3 Definition of PFS varied across trials, downgraded by 1 point for inconsistency 4 Very small number of events, downgraded by 2 points for imprecision 5Statistical heterogeneity (I ² = 67%), downgraded by 1 point for inconsistency 6 Low number of events, downgraded by 1 point for imprecision | ||||||
| Different numbers of chemotherapy cycles in both arms | ||||||
| Chemotherapy alone versus chemotherapy plus radiotherapy for adults with early stage Hodgkin lymphoma | ||||||
| Outcomes | № of participants | Quality of the evidence | Relative effect | Anticipated absolute effects* (95% CI) | Comment | |
| Risk with chemotherapy only | Risk with chemotherapy plus radiotherapy | |||||
| Mortality (calculated instead of overall survival) Follow‐up : 5 years The low‐ mortality rate was taken from the EORTC‐GELA H9‐F trial, the high‐ mortality rate was taken from the Mexico B2H031trial | 276 | ⊕⊕⊝⊝ | HR 2.12 | Low risk to die | ||
| 30 per 1000 | 63 per 1000 | Number of people who will die | ||||
| High risk to die | ||||||
| 150 per 1000 | 291 per 1000 | |||||
| Relapse, progression or death (calculated instead of PFS) Follow‐up : 5 years | 1176 | ⊕⊕⊝⊝ | HR 0.42 | Low risk of progress, death | ||
| 100 per 1000 | 43 per 1000 | Number of people who will have a progress, relapse or die | ||||
| High risk of progress, death | ||||||
| 300 per 1000 | 139 per 1000 | |||||
| Relapse, progression or death (calculated instead of PFS) sensitivity analysis ‐ without HD6trial due to high risk of other bias Follow‐up : 5 years | 900 2 (RCTs) | ⊕⊕⊕⊝ | HR 0.24 | Low risk of progress, death | ||
| 100 per 1000 | 25 per 1000 (7 to 88) | Number of people who will have a progress, relapse or die | ||||
| High risk of progress, death | ||||||
| 300 per 1000 | 82 per 1000 (25 to 269) | |||||
| Infection‐ related mortality | 276 | ⊕⊕⊝⊝ | RR 6.90 | Low risk | ||
| 1 per 1000 | 7 per 1000 | |||||
| Second cancer‐ related mortality | 276 | ⊕⊕⊝⊝ | RR 2.22 | Study population | ||
| 29 per 1000 | 65 per 1000 | |||||
| Cardiac disease‐ related mortality | 276 | ⊕⊕⊝⊝ | RR 0.99 | Study population | ||
| 15 per 1000 | 14 per 1000 | |||||
| Complete response rate | not reported | |||||
| *The risk in the intervention group (and its 95% confidence interval) is based on the assumed risk in the comparison group and the relative effect of the intervention (and its 95% CI). | ||||||
| GRADE Working Group grades of evidence | ||||||
| 1 Very low number of events, downgraded by 2 points for imprecision 2 Serious heterogeneity (I² = 84%), downgraded by 2 points for inconsistency | ||||||
Background
Description of the condition
Hodgkin lymphoma (HL) is one of the most common malignancies in young adults (Swerdlow 2003; Thomas 2002). It is a malignancy of the lymph nodes and lymphatic system with possible involvement of other organs. The disease is rare with an annual incidence of approximately two to three per 100,000 in most western countries (DeVita 1997; Diehl 2005; Mauch 1999; Parkin 2005), and occurs mostly in young people, the incidence being greatest in the third decade of life (Mueller 1999). Factors associated with HL include family history, viral exposures, and immune suppression (Glaser 1996). HL is one of the most curable form of cancer worldwide, the cure rates are up to 90% (Engert 2010; Engert 2012).
Staging of HL is based on the Ann Arbor system (Carbone 1971), with the addition of a definition of bulky disease (largest tumour diameter > 10 cm), often referred to as the Cotswold modification (Lister 1989). Information about prognostic factors such as mediastinal mass, other bulky nodal disease, and extent of sub‐diaphragmatic disease is included in this classification. Generally, HL is differentiated into early stage HL and advanced stage HL. On the basis of clinical staging and risk factors, patients are usually assigned to early favourable, early unfavourable and advanced stages (Engert 2007; Klimm 2005). However, there are still small differences in the definition of risk factors used and in the classification of certain subgroups of patients among the different study groups in Europe and the USA.
Description of the intervention
Usually patients with early stage HL receive two cycles of ABVD (adriamycin, bleomycin, vinblastine, and dacarbazine) in combination with involved‐field radiotherapy (Engert 2010; Rancea 2013). Depending on the intensity and dose of treatment given, long‐ term complications such as secondary malignancies (Franklin 2005), cardiac disease (Adams 2004) and infertility occur more frequently in Hodgkin survivors as compared to the general population. For patients with early stage disease, the 20‐year cumulative secondary malignancy rate is estimated to be between 4% and 20 % (Franklin 2005; Ng 2002a). Risk factors for secondary malignancies (and cardiac disease) are the choice and dose of radiotherapy and chemotherapy (Aleman 2003; Bhatia 2003; Dores 2002; Franklin 2005; Green 2000; Ng 2002a; Ng 2002b; Swerdlow 2000; van Leeuwen 2000). Unfortunately, no long‐term comparison of combined modality treatment, consisting of chemotherapy plus radiotherapy, with chemotherapy alone was possible in cohorts of Hodgkin survivors, in part due to the changes in treatment regimens over time (Ng 2002a). Nonetheless, to avoid additional radiation‐induced toxicity, chemotherapy‐ alone treatment for patients with early stage HL has been advocated (Canellos 2005). This notion was supported by two clinical trials comparing combined modality treatment with chemotherapy alone in which no significant survival disadvantage was observed in patients receiving chemotherapy alone (HD6; MSKCC trial #90‐44). However, one of these trials compared two cycles of chemotherapy plus radiotherapy with four to six cycles of chemotherapy. Data are now emerging on long‐term toxicity also of chemotherapy, including secondary malignancies and cardiac disease (Henderson 2016; Maraldo 2015; Schaapveld 2015).
How the intervention might work
Chemotherpay and radiotherapy act on differentiating cells, prone to damage, and stop their growth and ultimately damage them, as a result the tumour mass shrinks. Along with tumour cure, normal body cells are also affected after treatment resulting in treatment‐ related side effects.
Biologic basis of chemotherapy
The most commonly used chemotherapeutic drugs in the treatment of early stage HL are classified as follows.
-
Alkylating agents: cyclophosphamide, mechlorethamine, procarbazine, dacarbazine.
-
Anti‐tumour antibiotics: bleomycin, doxorubicine (adriamycin), epirubicin.
-
Anti‐mitotic agents: vincristine, vinblastine.
-
Steroid hormones: prednisone.
Alkylating agents and anti‐tumour antibiotics are phase‐nonspecific chemotherapeutic drugs which can injure DNA at any phase of cell cycle, but appear to then block in S‐phase or G2 at a check point in a cell cycle before cell division (Sausville 2005). Anti‐mitotic agents and steroid hormones are phase‐specific chemotherapeutic drugs. Anti‐mitotic agents act in M‐phase and prevent tumour cell division by destroying mitotic spindle, and anti‐metabolites act in S‐phase and prevent replication of the tumour cell's DNA, stopping tumour cell proliferation. Steroid hormones act in M‐phase by suppressing the mitosis in lymphocytes (Chaber 2006).
Biologic basis of radiotherapy
Injury to DNA is the primary mechanism by which ionising radiation kills cells. This happens largely via the formation of free radicals, which accounts for 65 % or more of the damage to biologic materials. This may cause base damage, single‐strand breaks, double‐strand breaks, sugar damage, and DNA‐DNA and DNA‐protein cross‐links. Lymphoma cells are highly radiosensitive, and they undergo rapid apoptosis in response to DNA damage within a few hours after irradiation to relatively low doses. Because of this high radiosensitivity of lymphoma cells, much lower doses of radiation are necessary than for most solid tumours. Generally, normal cells are capable of repairing some of the radiation damage, whereas lymphoma cells are not (McBride 2008).
Why it is important to do this review
In recent years, a concept of minimal curative therapy with greatest efficacy and least toxicity has emerged in the treatment of early stage HL (Connors 2001; Connors 2005). This concept is based on the assumption that avoidance of radiotherapy would result in fewer deaths from late effects and the long‐term survival would be at least comparable and possibly better for patients treated with chemotherapy alone in early stage HL. To test this assumption, we performed a systematic review with meta‐analysis of randomised controlled trials (RCTs) comparing chemotherapy alone with chemotherapy plus radiotherapy in patients with early stage HL with respect to adverse events, response rate, progression‐free survival or similar outcomes, and overall survival.
Objectives
To assess the effects of chemotherapy alone compared to chemotherapy plus radiotherapy in adults with early stage Hodgkin lymphoma (HL).
Methods
Criteria for considering studies for this review
Types of studies
We included randomised controlled trials (RCTs) comparing chemotherapy alone with combined modality treatment consisting of chemotherapy plus radiotherapy in newly diagnosed patients with early favourable and early unfavourable stages clinical stage (CS) I and CS II Hodgkin lymphoma (HL). We excluded RCTs comparing chemotherapy alone with chemotherapy plus radiotherapy in patients with all stages of HL if more than 20 % of patients had advanced disease. We used the risk factor definitions as described in the individual trials. The terms "early stage" and "limited stage" were considered equivalent. We excluded quasi‐ randomised trials. We had also planned to exclude trials including fewer than 10 patients per arm, although we did not find such trials.
Types of participants
We included both male and female adults, with newly confirmed diagnosis of early stage HL (CS I and II) without any prior treatment for HL. If there were more than 20 % of the patients with advanced stage, the trial was excluded. In contrast to the first version of this review ( Herbst 2011 ), we excluded trials including children, as their treatment differs from that of adults (Kung 2006; Wolden 2012).
Types of interventions
We compared chemotherapy alone (single agent or multiple agent, regardless of dose, number of cycles and intervention time) and both chemotherapy plus radiotherapy (regardless of dose, field used and intervention time) as primary treatment for people with CS I and CS II HL (early favourable and early unfavourable stages of HL). In the first version of the review, we excluded trials if the chemotherapy regimen was not identical in all study arms. As the value of radiotherapy in addition to chemotherapy is still not clear, also compared to more cycles of chemotherapy in the control arm, we amended the inclusion criteria. In contrast to the first version of the review, we also included trials with varying numbers of cycles of chemotherapy between intervention and control arms, same chemotherapy regimen in both arms assumed. In this update, trials with different numbers of chemotherapy cycles in both arms are presented in a second comparison.
Types of outcome measures
Primary outcomes
We evaluated overall survival (OS) as the primary endpoint. The preferred definition of OS was "time from entry onto the clinical trial until death as a result of any cause" (Cheson 2007).
Secondary outcomes
-
Response rate
-
Measured as overall response rate (ORR) and complete response (CR).
-
The definitions of overall response and CR were used as given in the publication. If only CR and partial response were given, the ORR was calculated as CR plus partial response.
-
-
Progression‐free survival (PFS)
-
Definded as time to tumour progression, relapse or death.
-
Because not all trials reported PFS according to our definition, we accepted other tumour control outcomes and evaluated these.
-
-
Adverse events (AEs)
-
Most trials reported AEs , but in different ways. Because of insufficient comparable data we focused on AEs considered of particular interest: infection‐ related mortality, second cancer‐ related mortality, cardiac disease‐ related mortality and infertility.
-
Search methods for identification of studies
We adapted search strategies from the Cochrane Handbook for Systematic Reviews of Interventions (Lefebvre 2011). No language restriction was applied to reduce the language bias, especially English language bias, as studies showing an intervention to be effective are more likely to be published in English (Dickersin 1993; Egger 1997; Juni 2002). We designed a search strategy with the assistance of the Information Specialist (IM) for health‐related bibliographic databases.
Electronic searches
We searched the following databases and sources.
-
Databases of medical literature:
-
Cochrane Central Register of Controlled Trials from January 1977 to November 2010 and for the update from December 2010 to December 2016 (for search strategies see Appendix 1);
-
MEDLINE (Ovid) from January 1977 to November 2010 and for the update from December 2010 to December 2016 (for search strategy see Appendix 2);
-
Embase from January 1977 to June 2009 (for search strategy see Appendix 3).
-
-
Conference proceedings of the annual meetings of the following societies for abstracts (2000 to 2015, if not included in CENTRAL):
-
American Society of Hematology (ASH) (update until 2015);
-
American Society of Clinical Oncology (ASCO) (update until 2015);
-
International Symposium on Hodgkin Lymphoma (IHSL) (update until 2013).
-
-
Databases of ongoing trials:
-
meta‐register of controlled trials: https://www.controlled‐trials.com/mrct/ ;
-
EU clinical trials register: https://www.clinicaltrialsregister.eu/ctr‐search/search ;
-
Clinicaltrials.gov: https://www.clinicaltrials.gov ;
-
databases and websites of relevant institutions, agencies, organisations, societies and registries.
-
Searching other resources
-
Handsearching:
-
We checked the reference lists of all identified trials, relevant review articles and current treatment guidelines for further literature.
-
-
Personal contacts:
-
We contacted experts in the field in order to retrieve information on unpublished trials.
-
Data collection and analysis
Selection of studies
Two review authors (OB, NS) independently screened the results of the search for eligibility for this review by reading the abstracts. In the case of disagreement, we obtained the full‐ text publication. If no consensus could be reached, we asked a third review author for final decision (Higgins 2011).
We documented the study selection process in a flow chart, as recommended in the PRISMA (Preferred Reporting Items for Systematic reviews and Meta‐Analysis) statement (Moher 2009), showing the total numbers of retrieved references and the numbers of included and excluded studies (see Figure 1).

Study flow diagram.
Data extraction and management
Two review authors (OB, NS) extracted data as specified in the guidelines of Cochrane . If required, we contacted the authors of particular studies for supplementary information (Higgins 2011b).
For the data extraction we used a standardised form containing the following items:
-
general information: author, title, source, publication date, country, language, duplicate publications;
-
quality assessment: (as specified in the 'Assessment of risk of bias in included studies' section);
-
study characteristics: trial design, aims, setting and dates, source of patients, inclusion/exclusion criteria, comparability of groups, subgroup analysis, statistical methods, power calculations, treatment cross‐overs, compliance with assigned treatment, length of follow‐ up, time point of randomisation;
-
patient characteristics: age, gender, ethnicity, number of patients recruited/allocated/evaluated, patients lost to follow‐ up, additional diagnoses, stage of disease;
-
interventions: setting, type of (multi‐agent) chemotherapy (intensity of regimen, number of cycles), field and dose of radiotherapy, duration of follow‐ up;
-
outcomes: OS, PFS, response rate (CR, ORR), AEs .
Assessment of risk of bias in included studies
Two review authors (OB, NS) independently assessed the risk of bias in each study using the following criteria outlined in the Cochrane Handbook for Systematic Reviews of Interventions (Higgins 2011b):
-
sequence generation;
-
allocation concealment;
-
blinding (patients, personnel, outcome assessors);
-
incomplete outcome data;
-
selective outcome reporting;
-
other sources of bias.
For every criterion we made a judgement using one of three categories:
-
'low risk': if the criterion was adequately fulfilled in the study (i.e. the study was at a low risk of bias for the given criterion);
-
'high risk': if the criterion was not fulfilled in the study (i.e. the study was at high risk of bias for the given criterion);
-
'unclear risk': if the study report did not provide sufficient information to allow for a judgement of 'low risk' or 'high risk', or if the risk of bias was unknown for one of the criteria listed above.
Measures of treatment effect
Time‐to‐event data
For treatment effect measures of individual trials estimated as hazard ratios (HRs) for OS and PFS/tumour control from survival analysis, we used methods described by Parmar 1998 and Tierney 2007. As no HRs were reported, we used logrank statistics through reported P values and numbers of events in comparison arm and estimated the HRs for OS and PFS/tumour control indirectly. When P values were not reported, we estimated HRs for OS and PFS/tumour control using survival curves data. Finally, we calculated and entered log HRs with standard errors (SEs) in RevMan 5 (RevMan 2014) for analysis.
Dichotomous data
We calculated effect measures of individual trials for ORR, CR and AEs as risk ratios (RRs).
Dealing with missing data
A number of potential sources for missing data are suggested in Chapter 16 of the Cochrane Handbook for Systematic Reviews of Interventions (Higgins 2011a), which need to be taken into account: at study level, at outcome level and at summary data level. In the first instance, it is of the utmost importance to differentiate between data 'missing at random' and 'not missing at random'.
If data were missing, we intended in the next step, to request this from the original investigators. If, after this, data were still missing, we would have made explicit assumptions of any methods used: for example, that the data were assumed to be missing at random or that missing values were assumed to have a particular value, such as a poor outcome.
Additionally, we intended to perform sensitivity analyses to estimate how sensitive the results were to reasonable changes in the assumptions that we had made.
Assessment of heterogeneity
We assessed heterogeneity of treatment effects between trials using a Chi2 test with a significance level at P value < 0.05. We used the I2 statistic to quantify possible heterogeneity (I2 > 30 % moderate heterogeneity, I2 > 75 % considerable heterogeneity) (Deeks 2011). We intended to explore potential causes of heterogeneity through sensitivity and subgroup analyses.
Assessment of reporting biases
In meta‐analyses involving at least 10 trials, we intended to explore potential publication bias by generating a funnel plot and statistically testing this by conducting a linear regression test (Sterne 2011). We would have considered a P value of < 0.1 as significant for this test. However, as we included only seven trials in the review, this test was not conducted (Sterne 2011).
Data synthesis
We performed analyses according to the recommendations of Cochrane (Deeks 2011). We used the Cochrane statistical software Review Manager (RevMan) 5 (RevMan 2014) for analyses. We analysed same numbers and different numbers of chemotherapy cycles in each arm separately (e.g. three cycles in the experimental arm versus four cycles in the standard arm). Had the data been considered sufficiently similar to be combined, we intended to pool the results using a fixed‐effect model. Due to the clinical heterogeneity of the trials (e.g. different type of chemotherapy, starting points in different decades), we used a random‐effects model.
We used the GRADE (Grading of Recommendations Assessment, Development and Evaluation) profiler to create 'Summary of findings' tables, as suggested in the Cochrane Handbook for Systematic Reviews of Interventions (Schünemann 2011). We prioritised outcomes according to their relevance to patients. The most important outcome was OS, followed by PFS, AEs , CR and ORR.
Subgroup analysis and investigation of heterogeneity
We planned the following subgroup analyses to investigate the potential causes of heterogeneity with different treatment effects in different groups.
-
Proportion of patients with early favourable stage HL versus early unfavourable stage HL.
-
Bulky versus non‐bulky disease e.g. I) with mediastinal mass versus without mediastinal mass II) with > 3 involved nodal areas versus < 3 involved nodal areas.
-
Different sequence of interventions e.g. chemotherapy + radiotherapy versus radiotherapy + chemotherapy versus chemotherapy‐radiotherapy‐chemotherapy.
-
Different radiotherapy treatment regimens e.g. involved‐field (IF)‐radiotherapy versus extended‐ field (EF)‐radiotherapy.
-
Different chemotherapy regimens e.g. ABVD ( adriamycin, bleomycin, vinblastine, and dacarbazine ) versus CVPP (cyclophosphamide, vinblastine, procarbazine, prednisone) versus EBVP (epirubicin, bleomycin, vinblastine, prednisone).
We assessed subgroup differences using the test for subgroup differences in RevMan5 (RevMan 2014).
Sensitivity analysis
We performed a sensitivity analysis to assess the robustness of the overall result with respect to quality and trial design. Using sensitivity analysis we explored the following .
-
Measures of study quality (intention‐t o ‐treat (ITT) analysis, > 10 % of patients not evaluated versus ≤ 10 % not evaluated).
-
Measures of OS, PFS, CR and ORR while excluding three trials (HD6; MSKCC trial #90‐44; UK NCRI Rapid), because of potential other high risk of bias (high number of patients did not receive the intended therapy and no per‐protocol results available).
-
Additional measures of PFS with per‐protocol results of one trial (UK NCRI Rapid).
Results
Description of studies
Results of the search
Our updated literature search led to 5518 potentially relevant references related to the treatment of patients with early stage Hodgkin lymphoma (HL). Of these, we identified 602 as duplicates and excluded 4852 at the initial stage of screening because they did not fulfil our predefined inclusion criteria. The remaining 64 publications we retrieved as full‐ text publications or abstract publications for detailed evaluation. Of these 64 trials, we excluded 40 trials. So finally we formally included seven trials (24 publications) with 2564 patients in the main analyses of this review.
The search in 2010 yielded 2800 references. Of these, we excluded 2749 at the initial stage. Of the remaining 51 trials, we excluded 41 and so we included five trials with 10 publications in the analyses of the review.
We documented the overall number of trials screened, identified, selected, excluded and included in a PRISMA flow diagram (Figure 1).
Included studies
See also the 'Characteristics of included studies' tables and Table 1.
| Number of patients evaluated | 18: chemotherapy 19: chemotherapy plus radiotherapy | 193: chemotherapy 188: chemotherapy plus radiotherapy | 268: chemotherapy 251: chemotherapy plus radiotherapy | 137: chemotherapy 139: chemotherapy plus radiotherapy | 130: chemotherapy 448: chemotherapy plus radiotherapy | 99: chemotherapy 102: chemotherapy plus radiotherapy | 76: chemotherapy 76: chemotherapy plus radiotherapy | 211: chemotherapy 209: chemotherapy plus radiotherapy |
| Chemotherapy and radiotherapy | 6 cycles of CVPP +/‐ involved‐field radiotherapy (dosage unknown) | 4 cycles of ABVD vs 3 cycles of ABVD + 30 Gy (+6 Gy) involved node radiotherapy | 6 cycles of ABVD vs 4 cycles of ABVD + 30 Gy (+6 Gy) involved node radiotherapy | 4 cycles of ABVD or 2 cycles of ABVD + 35 Gy subtotal nodal radiotherapy | 6 cycles of EBVP +/‐ IF radiotherapy | 6 cycles of ABVD +/‐ EF‐radiotherapy | 6 cycles of ABVD +/‐ EF or IF radiotherapy | 3 cycles of ABVD +/‐ 30 Gy IF‐radiotherapy |
| Median duration of follow‐up | 1.8 years | 1.1 years | 1.1 years | 11.3 years | 4.3 years | 11.4 years | 5.6 years | 60 months |
We included seven trials (CALGB 7751; EORTC‐GELA H9‐F; H10F/H10U; HD6; Mexico B2H031; MSKCC trial #90‐44; UK NCRI Rapid) in this review. Five trials had the same number of chemotherapy cycles in each arm (CALGB 7751; EORTC‐GELA H9‐F; Mexico B2H031; MSKCC trial #90‐44; UK NCRI Rapid), two with different numbers of chemotherapy cycles in the experimental arm and the standard arm (H10F/H10U; HD6). The earliest trial recruited in the 1970s and the latest between 2003 and 2010. We extracted the data from full‐ text publications for six trials and for one trial (EORTC‐GELA H9‐F), from the abstract. For the H10 trial we analysed the two subgroups H10F and H10U separately.
Design
Of the seven included trials, three are two‐armed randomised controlled trials (RCTs) (CALGB 7751; MSKCC trial #90‐44; UK NCRI Rapid); four are three‐armed RCTs :
One trial (H10F/H10U) divided patients into two main groups (favourable (F) and unfavourable (U)) prior to randomisation, and then used a three‐armed design for each group: one standard arm (chemotherapy plus radiotherapy), one positron emission tomography (PET)‐negative (chemotherapy alone) and one PET‐positive arm (chemotherapy plus radiotherapy) in each group. We excluded the PET‐positive arm of each group in this systematic review.
Mexico B2H031 randomised patients to radiotherapy alone, chemotherapy plus radiotherapy or chemotherapy alone. We excluded the radiotherapy arm in this systematic review.
EORTC‐GELA H9‐F randomised patients to chemotherapy alone, chemotherapy plus radiotherapy with 36 Gy or chemotherapy plus radiotherapy with 20 Gy. We evaluated the two radiotherapy dosages together in this review.
HD6 randomised patients to chemotherapy alone versus radiotherapy alone or chemotherapy plus radiotherapy. In the experimental arm people with an unfavourable risk profile received chemotherapy plus radiotherapy, whereas people with a favourable risk profile received radiotherapy only. In the standard arm, people with unfavourable and favourable risk profile both received chemotherapy only. We considered in this review only people with an unfavourable risk profile and the comparison chemotherapy alone versus chemotherapy plus radiotherapy.
Two trials compared different numbers of chemotherapy cycles in the arms (H10F/H10U; HD6).
Sample sizes
The smallest trial included 55 (37 analysed) patients (CALGB 7751) and the largest trial 1137 (900 PET‐negative patients analysed) patients (H10F/H10U).
Location
The included trials came from a range of research groups from different countries: one trial in USA (CALGB 7751); one trial in USA and Canada (MSKCC trial #90‐44); one trial in USA, Canada and Italy (HD6); two trials in different institutions of European countries (EORTC‐GELA H9‐F; H10F/H10U); one trial in Mexico (Mexico B2H031); and one trial in UK (UK NCRI Rapid).
Participants
This review included a total of 2564 male and female adults, with a newly confirmed diagnosis of clinical stage (CS) I and II or pathologic stage (PS) I and II HL and without previous treatment.
Interventions
Chemotherapy cycles used:
-
six cycles of chemotherapy alone or six cycles of same chemotherapy plus radiotherapy in four trials (CALGB 7751; EORTC‐GELA H9‐F; Mexico B2H031; MSKCC trial #90‐44);
-
three cycles of chemotherapy alone or three cycles of same chemotherapy plus radiotherapy in one trial (UK NCRI Rapid);
-
six cycles of chemotherapy alone or four cycles of same chemotherapy plus radiotherapy in a subgroup of one trial (H10U);
-
four cycles of chemotherapy alone or three cycles of same chemotherapy plus radiotherapy in a subgroup of one trial (H10F);
-
four cycles of chemotherapy alone or two cycles of same chemotherapy plus radiotherapy in one trial (HD6).
Chemotherapy regimens used:
-
ABVD (adriamycin, bleomycin, vinblastine, and dacarbazine) in five trials (H10F/H10U; HD6; Mexico B2H031; MSKCC trial #90‐44; UK NCRI Rapid);
-
CVPP (cyclophosphamide, vinblastine, procarbazine, prednisone) in one trial (CALGB 7751);
-
EBVP (epirubicin, bleomycin, vinblastine, prednisone) in one trial (EORTC‐GELA H9‐F).
Size of radiation fields used for the delivery of radiotherapy:
-
involved‐field radiotherapy in three trials (CALGB 7751; EORTC‐GELA H9‐F; UK NCRI Rapid);
-
extended‐field radiotherapy in one trial (Mexico B2H031);
-
mixed radiotherapy (extended‐field or involved‐field radiotherapy) in one trial (MSKCC trial #90‐44);
-
subtotal nodal radiotherapy in one trial (HD6);
One trial (Mexico B2H031) administrated three cycles of chemotherapy before and after radiotherapy (sandwich technique); in the other trials chemotherapy was administered prior to radiotherapy.
Outcomes
Primary outcome measure
Six of the seven trials analysed overall survival (CALGB 7751; EORTC‐GELA H9‐F; HD6; Mexico B2H031; MSKCC trial #90‐44; UK NCRI Rapid).
Secondary outcome measures
Not all of the included trials reported p rogression‐free survival (PFS) data according to our definition (time to progression or death of any cause). All trials except CALGB 7751 reported some type of progression outcome (see Table 2). Three trials (CALGB 7751; Mexico B2H031; MSKCC trial #90‐44) reported response rate. Most trials reported adverse events (AEs), but in different ways. Two trials reported infection‐ related mortality (HD6; MSKCC trial #90‐44), four trials second cancer‐ related mortality (EORTC‐GELA H9‐F; HD6; Mexico B2H031; UK NCRI Rapid), and three cardiac disease‐ related mortality (CALGB 7751; Mexico B2H031; UK NCRI Rapid). No trial reported infertility.
| Trial | Definition of progression outcome. |
| Definition of disease‐free survival not reported (Note all patients are in CR at the time of randomisation). | |
| From the date of random assignment to date of progression—as relapse after previous complete remission or progression after reaching partial remission (>= 50% decrease and resolution of B symptoms and no new lesions) or progressive disease (50% increase from nadir of any previous partial remission lesions or appearance of new lesions) on computed tomography scan measurements during protocol treatment or death resulting from any cause, whichever occurred first. | |
| Measured as event‐free survival from the date of randomisation until the date of disease progression or death from any cause. | |
| Contradictory definitions. In the methods section: “Disease free survival was calculated for CR patients from the beginning of treatment until clinically or radiologically and biopsy proven relapse.” In the results section the percentage disease free were calculated based on the full population. | |
| Time from enrolment until any progression of disease. | |
| Time from the date of randomisation to first progression, relapse, or death, whichever occurred first. |
Conflict of interest
No trial reported information with respect to conflict of interest.
Excluded studies
After the screening of abstracts we excluded 4852 trials that clearly did not match our inclusion criteria.
We excluded a total of 40 articles after detailed evaluation of full text publications with the following main reasons:
-
eight trials were non‐randomised comparisons or reviews (Cimino 1990; Cosset 1992; Kim 2003; Körholz 2004; Longo 1992; Meyer 2013; Reinartz 2013; Specht 1992);
-
16 trials not chemotherapy alone versus chemotherapy plus radiotherapy (Andrieu 1999; Brusamolino 1994; Cheveresan 1998; Desablens 1999; Dionet 1988; Ferme 2005; Horning 2007; Noordijk 2006; Pavlovsky 1997; Radford 2002; Rüffer 1996; Rüffer 1998; Rüffer 1999; Straus 1989; Thistlethwaite 2007; Thomas 2004);
-
eight trials involved < 80% early stage patients (Bonnet 2007; Horning 1996; Kung 1993; Kung 2006; Laskar 2004; O'Dwyer 1984; O'Dwyer 1985; Picardi 2007);
-
six trials did not include adults (Friedmann 2014; Lemerle 1986; Nachman 2002; Pavlovsky 1988; Weiner 1997; Wolden 2012);
-
two publications were of "one trial" (Hirsch 1994; Hirsch 1996), where MSKCC patients were randomised to chemotherapy alone versus chemotherapy plus radiotherapy, or different chemotherapy plus differing radiotherapy schemes were followed for pulmonary function for approximately one year. The 45 patients with a relevant comparison to this review are presumably included in the MSKCC trial #90‐44.
These publications we described under Characteristics of excluded studies.
Risk of bias in included studies
See 'Risk of bias' tables sections in the 'Characteristics of included studies' tables and to Figure 2: this 'Risk of bias' summary figure presents all our judgements in a cross‐tabulation of study by entry. Overall, we considered the quality of included trials to be moderate.

Methodological quality summary: review authors' judgements about each methodological quality item for each included study.
Allocation
A random component in the sequence generation process described in three trials (H10F/H10U; HD6; MSKCC trial #90‐44), we judged the risk of selection bias as low. The other trials are described as "randomised trials" without further information about the process of randomisation (CALGB 7751; EORTC‐GELA H9‐F; Mexico B2H031; UK NCRI Rapid), so we judged the risk of bias as unclear.
Four trials performed treatment allocation of patients at a central trial office (H10F/H10U; HD6; MSKCC trial #90‐44; UK NCRI Rapid), we judged these to be at low risk of potential bias. We judged the risk of selection bias for the other three trials to be unclear (CALGB 7751; EORTC‐GELA H9‐F; Mexico B2H031), because of no available information regarding the allocation concealment.
Blinding
As radiotherapy is difficult to blind, one does not expect the patients to be blinded. However, one trial reported information about blinding of outcome assessors or statisticians (H10F/H10U), so we judged the risk of bias as low. As blinding of the outcome assessors is considered important for this review, we judged the other trials as unclear for the question of blinding.
Although the trials were not blinded, this does not affect the outcome overall survival (OS). Therefore, we judged the risk of blinding for OS as low for all trials.
Incomplete outcome data
Four trials described missing outcome data in detail or included all randomised patients in the analysis without reporting any missing data for this outcome (EORTC‐GELA H9‐F; H10F/H10U; MSKCC trial #90‐44; UK NCRI Rapid); hence we judged the risk of bias as low.
In the Mexico B2H031 trial 20/327 patients were missing from the analyses without further information (this information was not available only for the two arms included in this review). As the number of missing patients is less than 10%, we judged the risk of bias as low. Similarly for the HD6 trial with 6/405 patients not analysed. The CALGB 7751 trial did not analyse a high proportion of patients (18/55 patients), therefore we judged the risk of bias as high.
Selective reporting
Most of the trials reported little information about which outcomes were primary outcomes and how these were defined, so we judged the risk of bias as unclear for these trials (CALGB 7751; EORTC‐GELA H9‐F; Mexico B2H031; MSKCC trial #90‐44). Three trials did not report all of the study’s pre‐specified secondary outcomes (H10F/H10U; HD6; UK NCRI Rapid), hence we judged the risk of bias as high. We found study protocols for four trials only (EORTC‐GELA H9‐F; H10F/H10U; HD6; UK NCRI Rapid).
Other potential sources of bias
Three trials did not provide sufficient information to assess whether an important risk of bias exists, therefore we judged the risk of other potential sources of bias as unclear (CALGB 7751; H10F/H10U; Mexico B2H031). One trial ended early due to predefined stopping rule. The hazard ratio (HR) estimate is based on the full group receiving additional radiotherapy and not only those patients up to the time the no radiotherapy arm was stopped (EORTC‐GELA H9‐F). This is known to increase the effect estimate of trials. In addition, the data are preliminary. So we judged the risk of bias as high for this trial. In the UK NCRI Rapid trial 28 of 420 patients did not receive treatment as randomised: two received radiotherapy in the chemotherapy alone arm and 26 did not receive radiotherapy in the chemotherapy plus radiotherapy arm. Five of the eight patients who died in the chemotherapy plus radiotherapy arm, received no radiotherapy. These patients were still included in the analysis. Because this could effect the results, we judged the risk of bias as high. In the MSKCC trial #90‐44 trial, 11 patients randomised to the chemotherapy plus radiotherapy arm never received radiotherapy (six refused, four progressed on chemotherapy prior to receiving radiotherapy, one never received radiotherapy because of bleomycin‐ induced toxicity to radiotherapy). In the HD6 trial, a total of 41 patients did not re c eive the assigned therapy. Among the patients in the chemotherapy arm, 16 of 196 patients without any further subdivision into favourable and unfavourable risk profile, in the radiation‐therapy group, 11 of the 64 patients in the cohort with a favourable risk profile (radiotherapy alone) and 14 of the 139 in the cohort with an unfavourable risk profile (chemotherapy plus radiotherapy) did not receive the assigned therapy. For both these trials, we judged the risk of bias as high.
Effects of interventions
See: Summary of findings for the main comparison Same number of chemotherapy cycles in both arms; Summary of findings 2 Different numbers of chemotherapy cycles in both arms
1. Same number of chemotherapy cycles in both arms
Five of the seven trials evaluated the same number of chemotherapy cycles in each arm (CALGB 7751; EORTC‐GELA H9‐F; Mexico B2H031; MSKCC trial #90‐44; UK NCRI Rapid).
Primary outcome Overall survival (OS)
Patients
Five trials with 1388 patients reported OS (CALGB 7751; EORTC‐GELA H9‐F; Mexico B2H031; MSKCC trial #90‐44; UK NCRI Rapid). In the UK NCRI Rapid trial, 12% of the patients in the chemotherapy plus radiotherapy arm did not receive treatment as randomised: 26 did not receive radiotherapy. Five of the eight patients who died in the chemotherapy plus radiotherapy arm received no radiotherapy. These patients were included in the published analysis. In the MSKCC trial #90‐44 trial, 11 patients randomised to radiotherapy never received radiotherapy. Because this affects the results and no per‐protocol results were available for both trials, we excluded the trials from the meta‐analysis for a sensitivity analysis and performed subgroup analyses without these trials as well (three trials with 816 patients).
Results
The addition of radiotherapy to chemotherapy has probably little or no difference on OS (hazard ratio (HR) = 0.48; 95% confidence interval (CI) 0.22 to 1.06; P = 0.07, see Analysis 1.1), with a moderate grade of heterogeneity between trials (I2 = 52%). One reason for the heterogeneity could be the results of the UK NCRI Rapid and MSKCC trial #90‐44 trials. In the UK NCRI Rapid trial 28 of 420 patients did not receive treatment as randomised: two received radiotherapy in the chemotherapy alone arm and 26 did not receive radiotherapy in the chemotherapy plus radiotherapy arm. Five of the eight patients who died in the chemotherapy plus radiotherapy arm received no radiotherapy. These patients were included in the published analysis of the trial. In the MSKCC trial #90‐44 trial, 11 patients randomised to the chemotherapy plus radiotherapy arm never received radiotherapy (six refused, fo ur progressed on chemotherapy prior to receiving radiotherapy, one never received radiotherapy because of bleomycin‐ induced toxicity to radiotherapy).
In a sensitivity analysis without UK NCRI Rapid and MSKCC trial #90‐44, the addition of radiotherapy to chemotherapy significantly improved OS (HR 0.31; 95% CI 0.19 to 0.52; P < 0.00001). We found no evidence of heterogeneity across the trials in the meta‐analysis (P value of the homogeneity test = 0.72; I² = 0%), see Figure 3.

Forest plot of comparison: 2 Overall survival ‐‐ same number of chemotherapy cycles without UK NCRI Rapid and MSKCC trial #90‐44 , outcome: 2.1 Sensitivity analysis ‐ without UK NCRI Rapid and MSKCC trial #90‐44.
Subgroup analyses
The subgroup analyses showed no statistically significant differences between the subgroups examined (early favourable or unfavourable disease, bulky or non‐bulky disease, timing and type of radiation therapy, type of chemotherapy). See Analysis 1.2; Analysis 1.3; Analysis 1.4; Analysis 1.5; Analysis 1.6.
The P value for the intention‐to‐teat (ITT)‐analysis is P = 0.78, so there are no statistically significant differences between the subgroups in the performed sensitivity analysis, see Analysis 1.7.
Subgroup analyses withoutUK NCRI RapidandMSKCC trial #90‐44
The subgroup analyses without UK NCRI Rapid and MSKCC trial #90‐44 showed no statistically significant differences between the subgroups examined (early favourable or unfavourable disease, bulky or non‐bulky disease, timing of radiotherapy, type of radiotherapy and type of chemotherapy. See Analysis 2.2; Analysis 2.3; Analysis 2.4; Analysis 2.5; Analysis 2.6.
There are no statistically significant subgroup differences in the ITT‐analysis as well (P = 0.42), see Analysis 2.7.
Secondary outcomes
Progression‐free survival (PFS)
Patients
Four trials with 1351 patients reported PFS (EORTC‐GELA H9‐F; Mexico B2H031; MSKCC trial #90‐44; UK NCRI Rapid).
Results
Not all trials reported PFS according to the definition in the protocol (time to progression or death from any cause). However, all trials in the main analysis reported some progression endpoint, such as event‐free survival, time to treatment failure and time to progression, and were evaluated as tumour control. We have provided exact given definitions in Table 2.
The combination of chemotherapy and radiotherapy probably improved PFS statistically significantly (HR 0.42; 95% CI 0.25 to 0.72); P = 0.001; see Figure 4), with a clear statistical heterogeneity between trials (I2 = 69%), which may in part be due to the different definitions used. For example, some trials examined progression or freedom from treatment failure in all patients, while others examined disease‐free survival, which is restricted to patients who reached a complete response (CR).

Forest plot of comparison: 2 Progression‐free survival, outcome: 2.1 All trials.
In a sensitivity analysis without the UK NCRI Rapid and MSKCC trial #90‐44 trials, the addition of radiotherapy to chemotherapy significantly improved PFS (HR 0.28, 95% CI 0.20 to 0.39; P < 0.00001), see Analysis 4.1.
Subgroup analyses
The subgroup analysis including the UK NCRI Rapid and MSKCC trial #90‐44 trials by proportion of patients with early favourable disease (P = 0.01, see Analysis 3.2), which showed statistically significant differences. In trials with early favourable patients (EORTC‐GELA H9‐F, 578 patients, HR 0.27; 95% CI 0.17 to 0.43; P < 0.00001) and unfavourable patients only (Mexico B2H031, 201 patients, HR 0.29; 95% CI 0.17 to 0.48; P < 0.00001), the addition of radiotherapy to chemotherapy significantly improved PFS. The trials with mixed patient population (MSKCC trial #90‐44; UK NCRI Rapid, 572 patients) showed no evidence for a difference between treatments (HR 0.71; 95% CI 0.43 to 1.17; P = 0.18).
The other subgroup analyses showed no statistically significant differences between the subgroups examined (bulky or non‐bulky disease, timing of radiotherapy, type of radiotherapy, type of chemotherapy), see Analysis 3.3; Analysis 3.4; Analysis 3.5; Analysis 3.6.
Because of the potential other high risk of bias of the UK NCRI Rapid trial, we used the per‐protocol results of this trial for another sensitivity analysis. We excluded the MSKCC trial #90‐44 trial because no per‐protocol results were available. The results of the analysis agreed with the main results that the combination of chemotherapy and radiotherapy probably improved PFS in a statistically significant way (HR 0.30; 95% CI 0.22 to 0.41; P < 0.00001), see Analysis 3.7.
Subgroup analyses withoutUK NCRI RapidandMSKCC trial #90‐44
The subgroup analyses without the UK NCRI Rapid and MSKCC trial #90‐44 trials showed no statistically significant differences between the subgroups examined (early favourable or unfavourable disease, bulky or non‐bulky disease, timing of radiotherapy, type of radiotherapy and type of chemotherapy, see Analysis 4.2; Analysis 4.3; Analysis 4.4; Analysis 4.5; Analysis 4.6).
Complete response (CR)
Patients
Three trials including 376 patients reported the CR rate (CALGB 7751; Mexico B2H031; MSKCC trial #90‐44).
Results
We found no evidence of an improvement in CR in favour of the chemotherapy plus radiotherapy group (risk ratio (RR) 1.08; 95% CI 0.93 to 1.25; P = 0.33), with a clear statistical heterogeneity between trials (I2 = 67%), without explainable reasons (Figure 5). In a sensitivity analysis without the MSKCC trial #90‐44 trial, the results do not change (RR 1.22; 95% CI 0.84 to 1.78; P = 0.28, see Analysis 6.1).

Forest plot of comparison: 3 Complete response rate, outcome: 3.1 All trials.
Subgroup analyses
A subgroup analysis by type of chemotherapy showed statistically significant differences (P = 0.03), see Analysis 5.6. In one trial (CALGB 7751, 37 patients), chemotherapy plus radiotherapy showed a statistically significant improved CR by administering CVPP (RR 1.55; 95% CI 1.06 to 2.27; P = 0.03), the use of ABVD showed no evidence for differences between chemotherapy alone and chemotherapy plus radiotherapy regarding CR (Mexico B2H031; MSKCC trial #90‐44, 339 patients, RR 1.02; 95% CI 0.95 to 1.09; P = 0.64).
The other subgroup and sensitivity analyses showed no statistically significant differences between the subgroups (early favourable or unfavourable disease, bulky or non‐bulky disease, timing and type of radiotherapy, see Analysis 5.2; Analysis 5.3; Analysis 5.4; Analysis 5.5.
There are statistically significant subgroup differences in the ITT‐analysis (P = 0.03), see Analysis 5.7. In one trial without ITT‐analysis (CALGB 7751, 37 patients), chemotherapy plus radiotherapy showed a statistically significant improved CR. The trials with ITT‐analysis (≤ 10 % of patients not evaluated; Mexico B2H031; MSKCC trial #90‐44, 339 patients, RR 1.02; 95% CI 0.95 to 1.09; P = 0.64) showed no evidence for a difference between the trials.
Subgroup analyses withoutMSKCC trial #90‐44
Without the MSKCC trial #90‐44 trial, the subgroup analyses showed no statistically significant differences between the subgroups examined (bulky or non‐bulky disease, timing and type of radiation therapy, type of chemotherapy, see Analysis 6.2; Analysis 6.3; Analysis 6.4; Analysis 6.5) and the ITT‐analysis, see Analysis 6.6.
Overall response rate (ORR)
Patients
Two trials including 339 patients reported ORR (Mexico B2H031; MSKCC trial #90‐44).
Results
We found no evidence of a statistically significant difference regarding ORR between the chemotherapy alone group and the chemotherapy plus radiotherapy group (RR 1.00; 95% CI 0.94 to 1.07; P = 0.98), with a fixed‐effect analysis. We found no evidence of heterogeneity across the trials in the meta‐analysis (P value of the homogeneity test = 0.37; I² = 0%) (Figure 6). Without the MSKCC trial #90‐44 trial, only one trial reported ORR and the results do not change (RR 1.04; 95% CI 0.92 to 1.18; P = 0.51), see Analysis 8.1.

Forest plot of comparison: 4 Overall Response Rate, outcome: 4.1 All Trials.
Subgroup analyses
No subgroup analysis showed statistically significant differences (P = 0.44 for early favourable or unfavourable disease, bulky or non‐bulky disease, timing and type of radiotherapy, see Analysis 7.2; Analysis 7.3; Analysis 7.4; Analysis 7.5).
Subgroup analyses withoutMSKCC trial #90‐44
Without the MSKCC trial #90‐44 trial, only one trial reported ORR (Mexico B2H031), therefore we did not perform subgroup analyses.
Adverse events (AEs)
Most adverse events reported in the trials seem to be similar in both groups and are typical for the chemotherapy received (e.g. haematological effects, bleomycin‐ induced lung disease). Only a few trials reported AEs considered of particular interest (secondary malignancies, cardiac disease). Regarding infection‐ related mortality, (one trial (MSKCC trial #90‐44), 152 patients, RR 0.33; 95% CI 0.01 to 8.06; P = 0.5), second cancer‐ related mortality (three trials (EORTC‐GELA H9‐F; Mexico B2H031; UK NCRI Rapid), 1199 patients, RR 0.53; 95% CI 0.07 to 4.29; P = 0.55), and cardiac disease‐ related mortality (two trials (CALGB 7751; UK NCRI Rapid), 457 patients, RR 2.94; 95% CI 0.31 to 27.55; P = 0.35), there are no statistically significant differences between the use of chemotherapy alone and chemotherapy plus radiotherapy (see Analysis 9.1; Analysis 9.2; Analysis 9.3). No trial reported data regarding infertility.
In a sensitivity analysis without the UK NCRI Rapid and MSKCC trial #90‐44 trials, the results do not change : there are no statistically significant differences between the use of chemotherapy alone and chemotherapy plus radiotherapy regarding second cancer‐ related mortality (two trials (EORTC‐GELA H9‐F; Mexico B2H031), 779 patients, RR 0.71; 95% CI 0.02 to 33.60; P = 0.86, see Analysis 10.1) and cardiac disease‐ related mortality (one trial (CALGB 7751), 37 patients, RR 2.85; 95% CI 0.12 to 65.74; P = 0.51, see Analysis 10.2). Without MSKCC trial #90‐44, no trial reported infection‐ related mortality.
2. Different numbers of chemotherapy cycles in both arms
Two of the seven trials evaluated different numbers of chemotherapy cycles in each arm (H10F/H10U; HD6)
Primary outcome Overall survival (OS)
Patients
Only one trial with 276 patients reported OS (HD6), therefore we did not perform subgroup analyses. In this trial, 41 of 399 patients did not receive therapy as randomised, therefore a sensitivity analysis without the HD6 trial could no be performed for the same reasons.
Results
The use of chemotherapy alone significantly improved OS (HR 2.12; 95% CI 1.03 to 4.37; P = 0.04), see Analysis 11.1.
Secondary outcomes
Progression‐free survival (PFS)
Patients:
Both trials with 1176 patients reported PFS (H10F/H10U; HD6).
Results
The addition of radiotherapy to chemotherapy did not improve PFS in a statistically significant way (HR 0.42; 95% CI 0.14 to 1.24; P = 0.12, see Analysis 12.1 ) with a clear statistical heterogeneity between trials (I2 = 84%), which may in part be due to the different definitions used.
In a sensitivity analysis without the HD6 trial, the addition of radiotherapy to chemotherapy significantly improved PFS (HR 0.24; 95% CI 0.07 to 0.88; P = 0.03, based on one trial, 900 partic i pants), see Analysis 13.1.
Subgroup analyses
The subgroup analyses by proportion of patients with early favourable disease (P = 0.03, see Analysis 12.2) and type of radiotherapy (P = 0.04, see Analysis 12.4) showed statistically significant differences.
In the part of the trial with early favourable patients (H10F, 381 patients), the addition of radiotherapy to chemotherapy significantly improved PFS (HR 0.11; 95% CI 0.03 to 0.40; P = 0.001). In the trials with only unfavourable patients (H10U; HD6, 795 patients), the addition of radiotherapy to chemotherapy showed no evidence for a difference regarding PFS (HR 0.67; 95% CI 0.26 to 1.76; P = 0.42).
Chemotherapy plus radiotherapy improved PFS in a statistically significant way by the use of involved‐ field radiotherapy (H10F/H10U, 900 patients, HR 0.24; 95% CI 0.07 to 0.88; P = 0.03). No evidence for a difference between chemotherapy alone and chemotherapy plus radiotherapy was shown by the use of subtotal nodal radiation (HD6, 276 patients, HR 1.09; 95% CI 0.62 to 1.93; P = 0.76).
The other subgroup analysis showed no statistically significant differences between the subgroups examined (bulky or non‐bulky disease P = 0.93, see Analysis 12.3).
As data of all patients were analysed, we did not perform sensitivity/ITT‐analysis.
Subgroup analyses withoutHD6
No subgroup analysis showed statistically significant differences (P = 0.07 for early favourable or unfavourable disease and bulky or non‐bulky disease, see Analysis 13.2; Analysis 13.3).
Complete response (CR)
Not reported.
Overall response rate (ORR)
Not reported.
Adverse events ( AEs)
Only one trial (HD6) reported adverse events considered of particular interest, but there is no evidence for differences between the use of chemotherapy alone and chemotherapy plus radiotherapy regarding infection‐ related mortality (RR 6.90; 95% CI 0.36 to 132.34; P = 0.20), second cancer‐ related mortality (RR 2.22; 95% CI 0.70 to 7.03; P = 0.18), and cardiac disease‐ related mortality (RR 0.99; 95% CI 0.14 to 6.90; P = 0.99), see Analysis 14.1; Analysis 14.2; Analysis 14.3. The trial did not report data regarding infertility. A sensitivity analysis without the HD6 trial could no be performed.
Discussion
Summary of main results
The following findings emerge from this updated Cochrane review and meta‐analysis evaluating the effects of chemotherapy alone compared to chemotherapy plus radiotherapy in adults with early‐stage Hodgkin lymphoma (HL).
Same number of chemotherapy cycles in both arms
-
The addition of radiotherapy to chemotherapy has probably little or no difference on OS. Without inclusion of two trials from the main analysis because of potential other high risk of bias chemotherapy plus radiotherapy improves overall survival (OS) compared to chemotherapy alone (results of the sensitivity analysis).
-
Chemotherapy plus radiotherapy probably improves progression‐free survival (PFS) /tumour control compared to chemotherapy alone.
-
Regarding complete response (CR), there are no significant statistical differences between chemotherapy alone and chemotherapy plus radiotherapy.
-
Regarding overall response rate (ORR), there are no significant statistical differences between chemotherapy alone and chemotherapy plus radiotherapy.
-
There are no significant statistical differences between chemotherapy alone and chemotherapy plus radiotherapy regarding adverse events‐ related mortality considered of particular interest (infection‐ related mortality, second cancer‐ related mortality and cardiac disease‐ related mortality).
Different numbers of chemotherapy cycles in both arms
-
Chemotherapy alone may improve slightly OS compared to chemotherapy plus radiotherapy, based on one trial with potential other high risk of bias.
-
Regarding PFS/ tumour control, there are no significant statistical differences between chemotherapy alone and chemotherapy plus radiotherapy. Without inclusion of one trial from the main analysis becaus of potential other high risk of bias, chemotherapy plus radiotherapy improves PFS compared to chemotherapy alone (results of the sensitivity analysis, based on one trial).
-
There are no significant statistical differences between chemotherapy alone and chemotherapy plus radiotherapy regarding adverse events‐ related mortality considered of particular interest (infection‐ related mortality, second cancer‐ related mortality and cardiac disease‐ related mortality), based on one trial.
When interpreting these results, it is important to consider that results lacking statistical significance do not necessarily rule out differences which may be clinically relevant for some patients.
Overall completeness and applicability of evidence
There are seven published r a ndomised controlled trials (RCTs) dealing with a comparison of chemotherapy alone and chemotherapy plus radiotherapy in previously untreated adults with early stage HL .
Six of the included studies were published as full‐text articles, providing sufficient information about the design, participants, methods and outcomes (CALGB 7751; H10F/H10U; HD6; Mexico B2H031; MSKCC trial #90‐44; UK NCRI Rapid). The remaining trial was published as abstract and therefore lacked information on relevant data (EORTC‐GELA H9‐F).
Five of the seven trials evaluated the same number of chemotherapy cycles in each arm (CALGB 7751; EORTC‐GELA H9‐F; Mexico B2H031; MSKCC trial #90‐44; UK NCRI Rapid), and two, different numbers of cycles (H10F/H10U; HD6).
The primary endpoint of this review was OS, due to its prime clinical relevance and its importance for patients. Moreover, it is a commonly accepted direct measure of the benefit of cancer treatment, as well as an endpoint that is not subject to bias by the outcome assessor. Five trials with 1388 patients evaluated the same number of chemotherapy cycles in each arm included in this meta‐analysis, the addition of radiotherapy to chemotherapy has no evidence for a difference in OS. With the exception of two trials from the main analysis because of potential other high risk of bias, OS is significantly better in patients receiving chemotherapy plus radiotherapy compared to chemotherapy alone (results of the sensitivity analysis, two trials were excluded from the main analysis because of potential other high risk of bias). Only one trial with different cycles of chemotherapy in the arms reported OS and found a benefit for the use of chemotherapy alone. This trial has a potential other high risk of bias as well.
In addition to these published trials, we are aware of three ongoing trials (GHSG HD16; GHSG HD17; HD0801) comparing chemotherapy alone and chemotherapy plus radiotherapy in adults with the same number of cycles of chemotherapy in both arms. These trials included 2720 patients with early‐stage HL, as dealt with in this systematic review. The publication of the results of these trials could deliver clearly results regarding OS and will necessitate an update to this review. We identified no ongoing trials comparing chemotherapy alone and chemotherapy plus radiotherapy with different numbers of chemotherapy cycles in the arms.
Quality of the evidence
Overall, we judged the potential risk of bias of the seven included trials as moderate.
All the included trials were reported as randomised studies, but only three of the trials reported the sequence generation process. In three trials, the treatment allocation of patients is unclear.
As radiotherapy is difficult to blind, in the included trials blinding of patients as well as blinding of physicians was impossible. Blinding of the outcome assessor would have made no difference to the primary outcome, OS, and therefore we judged the risk of performance and detection bias to be low for all three trials. For the other reported outcomes, most studies did not report whether outcome assessors were blinded with the exception of one trial. As it is not feasible to blind the intervention exercise, we judged the risk of detection bias for these trials as unclear.
For four trials, we judged the potential risk of other bias as high. In one trial, one arm was stopped early and data were not available for these patients. In the other three trials, patients did not receive treatment as randomised, but were included in the analysis. Because this could effect the results, we excluded the trials from the meta‐analysis for a sensitivity analysis and performed subgroup analyses without these trials.
Three trials did not report all of the study’s pre‐specified secondary outcomes, hence we judged the risk of selective reporting bias as high for these trials.
For the same number of chemotherapy cycles in both arms, we judged the quality of evidence for OS as moderate. We downgraded one point for substantial heterogeneity. The inclusion of two trials in which several patients did not receive planned radiotherapy, could lead to increased heterogeneity. The quality of evidence for the sensitivity analysis without these trials is moderate, as the results are more imprecise, as less patients have been included and less events happened, but homogenous. The quality of the evidence for PFS (definition of PFS varied across trials), we considered to be moderate as well. Because of the very small number of adverse events (AEs), we considered the quality of evidence for AEs as low (imprecision). For CR, we judged the quality of evidence as low because of th e low number of events (imprecision) and heterogeneity (inconsistency) between the trials, see summary of findings Table for the main comparison.
For different numbers of chemotherapy cycles in the arms, we judged the quality of evidence for OS as low, because only one trial provided data with a very low number of events (imprecision) and the trial have potential other high risk of bias because 41 of 399 patients did not receive therapy as randomised. For PFS, we considered the quality of evidence as low because of the strong heterogeneity of data (inconsistency) and for AEs as low, because only one trial provided data with a very low number of events (high imprecision), see summary of findings Table 2.
Potential biases in the review process
To prevent bias within the review, we considered only RCTs and performed all relevant processes in duplicate. We developed a sensitive search strategy, and searched all relevant data from international cancer congresses and study registries to minimise potential publication bias. We are not aware of any obvious deficiencies in our review process. We generated no funnel plot to explore potential publication bias because the number of included trials was too low (<10 trials). However, in our intensive search in trial registries we found no completed but unpublished trials, therefore we judge potential risk of publication bias as low.
Agreements and disagreements with other studies or reviews
To our knowledge this is the first comprehensive review with meta‐analysis focusing on patients with early stage HL in adults that compared chemotherapy alone with chemotherapy plus radiotherapy.
The main analysis according to the strict inclusion criteria of our review protocol included seven randomised controlled trials with 2564 patients of both early favourable and early unfavourable HL . The literature search revealed a number of trials with more than 20% of patients in advanced stages (Bonnet 2007; Horning 1996; Kung 1993; Kung 2006; Laskar 2004; O'Dwyer 1984; O'Dwyer 1985; Picardi 2007) or trials including children (Friedmann 2014; Lemerle 1986; Nachman 2002; Pavlovsky 1988; Weiner 1997; Wolden 2012, but wh i ch do not match the inclusion criteria.
In the UK NCRI Rapid trial, patients with positive positron emission tomography (PET findings) received a fourth cycle of ABVD and radiotherapy. No results are stated for this arm. However, this comparison did not match the inclusion criteria. Similar ly for the patients with positive PET findings of the H10F/H10U trial. These patients did not receive received chemotherapy only, thus no comparison was possible. In PET positive patients irradiation is probably more important than in PET negative patients, and PET positive patients have a higher risk of dying, thus survival in the trials with PET negative patients is higher. If that is the case, then the restriction of omitting irradiation for PET negative patients in UK NCRI Rapid and H10F/H10U probably caused the need of irradiation in the analysis regarding PFS/tumour control is underestimated.
Crump and c olleagues considered in a review the role of radiation therapy in the treatment of early stage HL and matched relevant RCTs to different topics without performing a meta‐analysis (Crump 2015). Because they included only RCTs published from 2003 onward or systematic reviews published from 2011 onward they identified only one trial (HD6), which dealt with the comparison of chemotherapy plus radiotherapy versus chemotherapy alone. The other trials did not refer to this comparison including two trials from this review (H10F/H10U; UK NCRI Rapid), which presented a comparison of FDG‐PET scanning versus direct therapy.
Sickinger and colleagues meta‐analysed the effects of PET‐adapted therapy (chemotherapy only) or chemotherapy followed by radiotherapy in patients with HL in a systematic review (Sickinger 2015). They found moderate‐ quality evidence that PFS is better in individuals with early stage HL and a negative PET scan receiving chemotherapy and additional radiotherapy in contrast to those receiving chemotherapy only, based on results of three trials (H10F/H10U; Picardi 2007; UK NCRI Rapid), without a differentiation between same and different numbers of chemotherapy cycles in the arms.
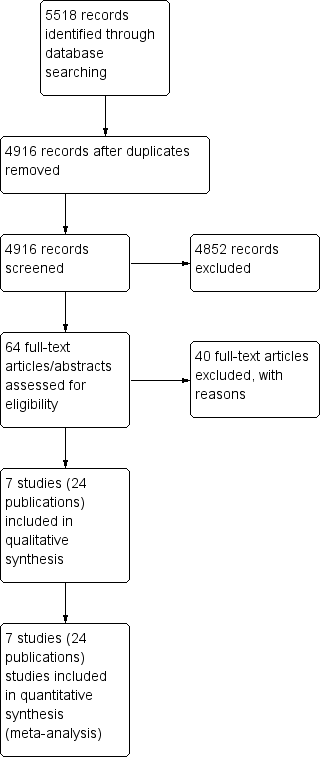
Study flow diagram.
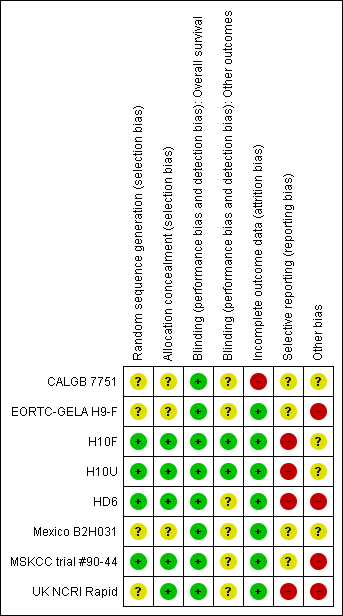
Methodological quality summary: review authors' judgements about each methodological quality item for each included study.
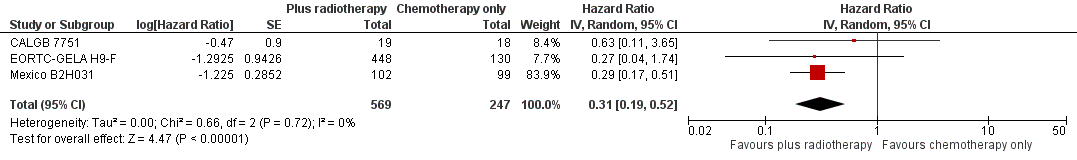
Forest plot of comparison: 2 Overall survival ‐‐ same number of chemotherapy cycles without UK NCRI Rapid and MSKCC trial #90‐44 , outcome: 2.1 Sensitivity analysis ‐ without UK NCRI Rapid and MSKCC trial #90‐44.
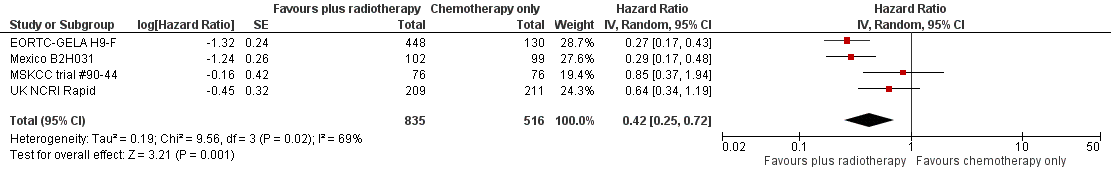
Forest plot of comparison: 2 Progression‐free survival, outcome: 2.1 All trials.

Forest plot of comparison: 3 Complete response rate, outcome: 3.1 All trials.
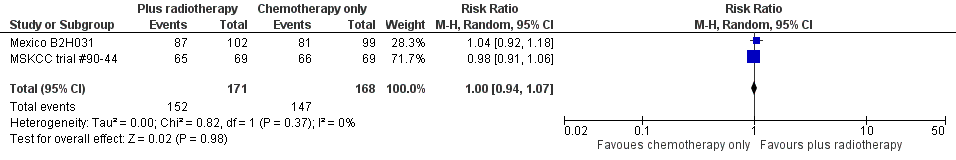
Forest plot of comparison: 4 Overall Response Rate, outcome: 4.1 All Trials.
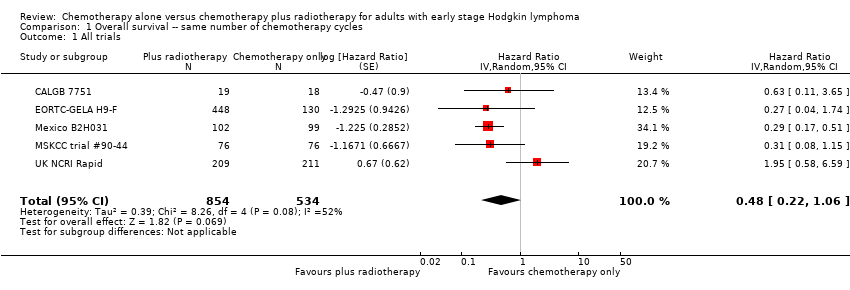
Comparison 1 Overall survival ‐‐ same number of chemotherapy cycles, Outcome 1 All trials.

Comparison 1 Overall survival ‐‐ same number of chemotherapy cycles, Outcome 2 Proportion of patients early favourable.

Comparison 1 Overall survival ‐‐ same number of chemotherapy cycles, Outcome 3 Bulky vs non‐bulky.
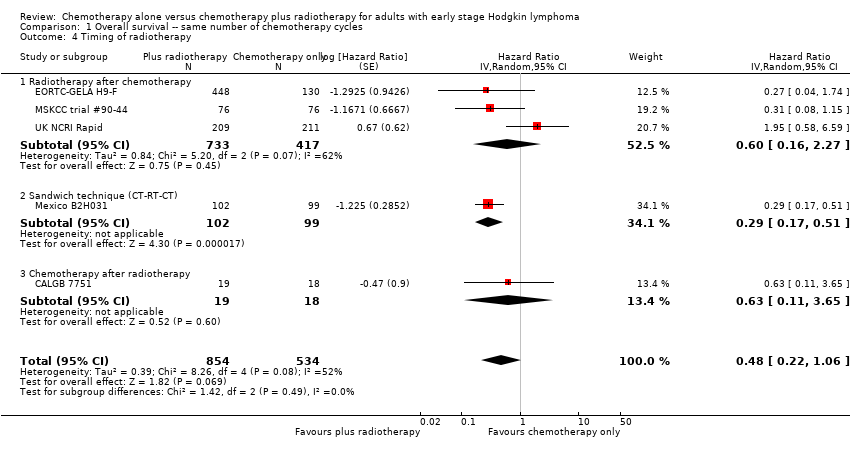
Comparison 1 Overall survival ‐‐ same number of chemotherapy cycles, Outcome 4 Timing of radiotherapy.
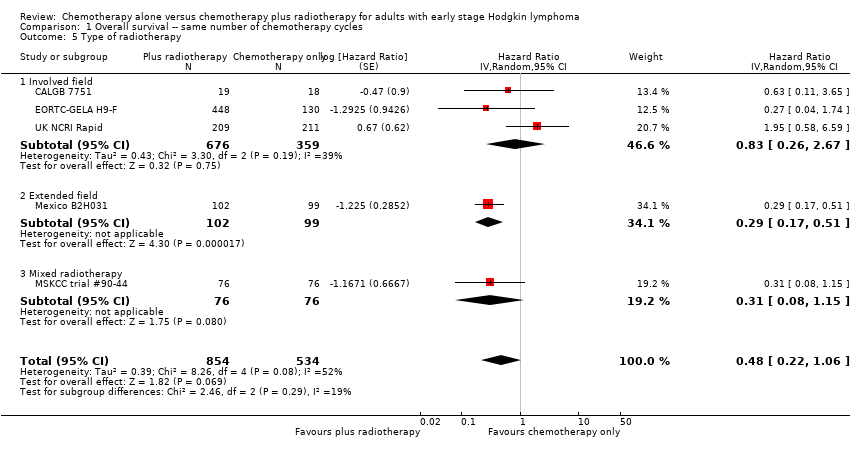
Comparison 1 Overall survival ‐‐ same number of chemotherapy cycles, Outcome 5 Type of radiotherapy.

Comparison 1 Overall survival ‐‐ same number of chemotherapy cycles, Outcome 6 Type of chemotherapy.

Comparison 1 Overall survival ‐‐ same number of chemotherapy cycles, Outcome 7 ITT‐analysis.

Comparison 2 Overall survival ‐‐ same number of chemotherapy cycles without UK NCRI Rapid and MSKCC trial #90‐44, Outcome 1 Sensitivity analysis ‐ without UK NCRI RAPID and MSKCC trial #90‐44.

Comparison 2 Overall survival ‐‐ same number of chemotherapy cycles without UK NCRI Rapid and MSKCC trial #90‐44, Outcome 2 Proportion of patients early favourable.
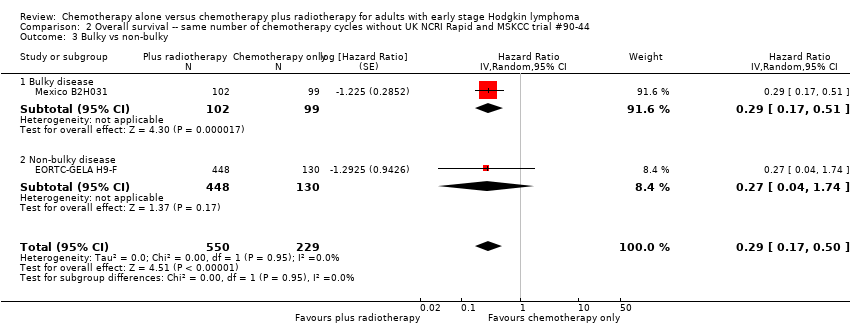
Comparison 2 Overall survival ‐‐ same number of chemotherapy cycles without UK NCRI Rapid and MSKCC trial #90‐44, Outcome 3 Bulky vs non‐bulky.
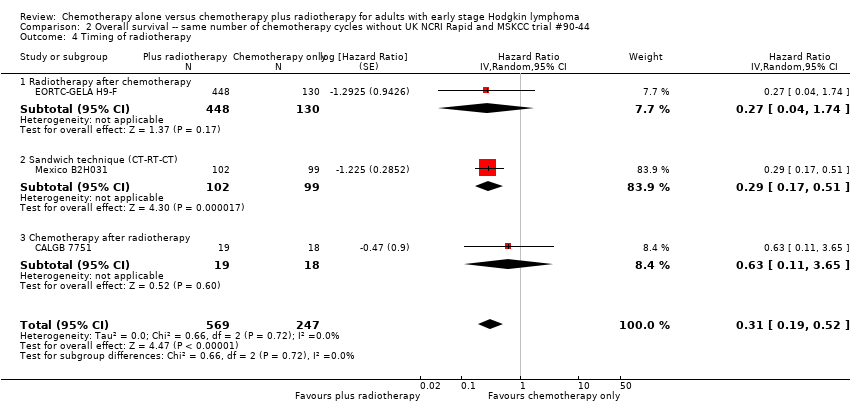
Comparison 2 Overall survival ‐‐ same number of chemotherapy cycles without UK NCRI Rapid and MSKCC trial #90‐44, Outcome 4 Timing of radiotherapy.
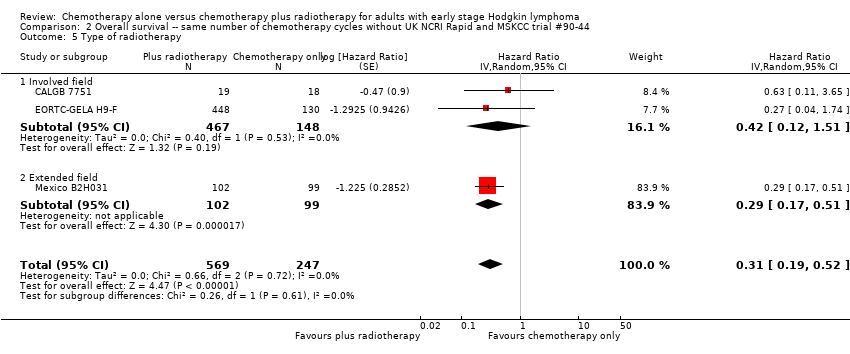
Comparison 2 Overall survival ‐‐ same number of chemotherapy cycles without UK NCRI Rapid and MSKCC trial #90‐44, Outcome 5 Type of radiotherapy.

Comparison 2 Overall survival ‐‐ same number of chemotherapy cycles without UK NCRI Rapid and MSKCC trial #90‐44, Outcome 6 Type of chemotherapy.

Comparison 2 Overall survival ‐‐ same number of chemotherapy cycles without UK NCRI Rapid and MSKCC trial #90‐44, Outcome 7 ITT‐analysis.

Comparison 3 Progression‐free survival ‐‐ same number of chemotherapy cycles, Outcome 1 All trials.

Comparison 3 Progression‐free survival ‐‐ same number of chemotherapy cycles, Outcome 2 Proportion of patients early favourable.
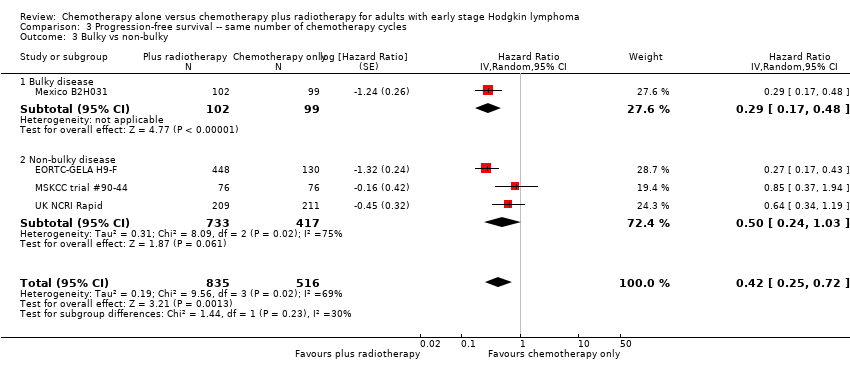
Comparison 3 Progression‐free survival ‐‐ same number of chemotherapy cycles, Outcome 3 Bulky vs non‐bulky.

Comparison 3 Progression‐free survival ‐‐ same number of chemotherapy cycles, Outcome 4 Timing of radiotherapy.

Comparison 3 Progression‐free survival ‐‐ same number of chemotherapy cycles, Outcome 5 Type of radiotherapy.

Comparison 3 Progression‐free survival ‐‐ same number of chemotherapy cycles, Outcome 6 Type of chemotherapy.

Comparison 3 Progression‐free survival ‐‐ same number of chemotherapy cycles, Outcome 7 Sensitivity analysis (per protocol results of the UK NCRI RAPID, without MSKCC trial #90‐44).
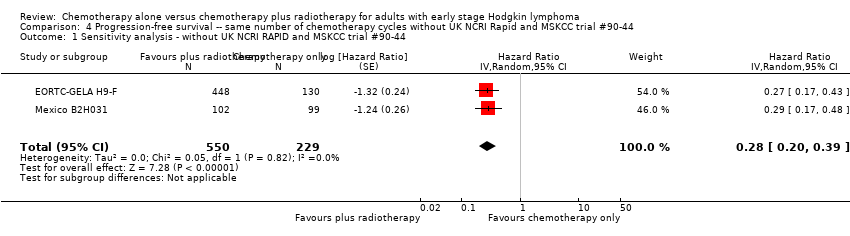
Comparison 4 Progression‐free survival ‐‐ same number of chemotherapy cycles without UK NCRI Rapid and MSKCC trial #90‐44, Outcome 1 Sensitivity analysis ‐ without UK NCRI RAPID and MSKCC trial #90‐44.
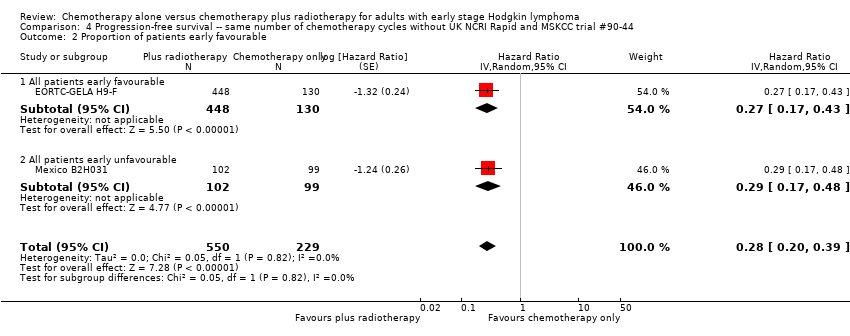
Comparison 4 Progression‐free survival ‐‐ same number of chemotherapy cycles without UK NCRI Rapid and MSKCC trial #90‐44, Outcome 2 Proportion of patients early favourable.
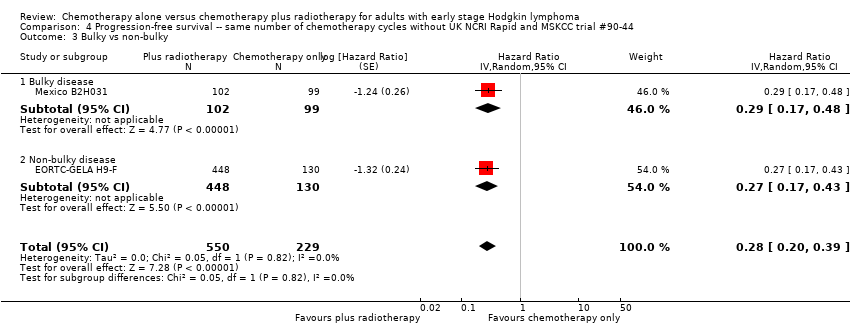
Comparison 4 Progression‐free survival ‐‐ same number of chemotherapy cycles without UK NCRI Rapid and MSKCC trial #90‐44, Outcome 3 Bulky vs non‐bulky.
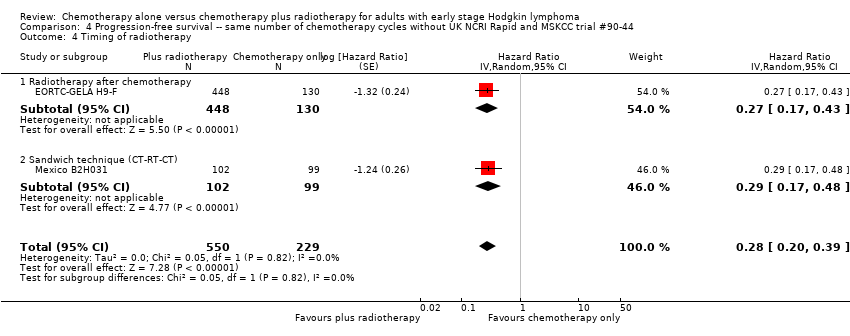
Comparison 4 Progression‐free survival ‐‐ same number of chemotherapy cycles without UK NCRI Rapid and MSKCC trial #90‐44, Outcome 4 Timing of radiotherapy.

Comparison 4 Progression‐free survival ‐‐ same number of chemotherapy cycles without UK NCRI Rapid and MSKCC trial #90‐44, Outcome 5 Type of radiotherapy.

Comparison 4 Progression‐free survival ‐‐ same number of chemotherapy cycles without UK NCRI Rapid and MSKCC trial #90‐44, Outcome 6 Type of chemotherapy.
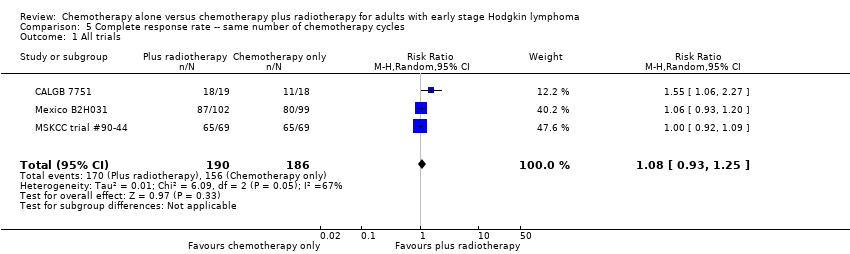
Comparison 5 Complete response rate ‐‐ same number of chemotherapy cycles, Outcome 1 All trials.

Comparison 5 Complete response rate ‐‐ same number of chemotherapy cycles, Outcome 2 Proportion of patients early favourable.

Comparison 5 Complete response rate ‐‐ same number of chemotherapy cycles, Outcome 3 Bulky vs non‐bulky.

Comparison 5 Complete response rate ‐‐ same number of chemotherapy cycles, Outcome 4 Timing of radiotherapy.

Comparison 5 Complete response rate ‐‐ same number of chemotherapy cycles, Outcome 5 Type of radiotherapy.
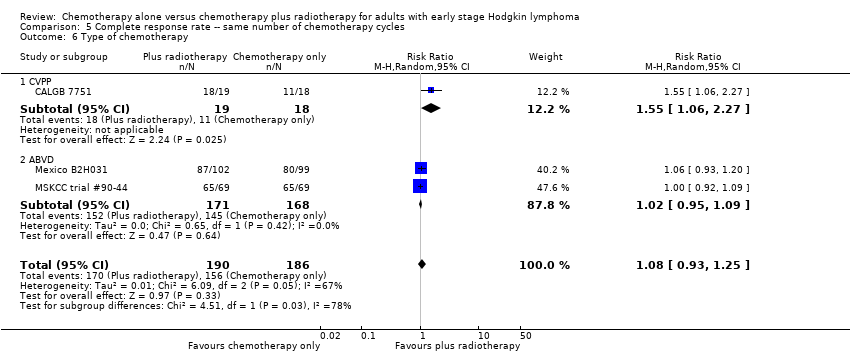
Comparison 5 Complete response rate ‐‐ same number of chemotherapy cycles, Outcome 6 Type of chemotherapy.
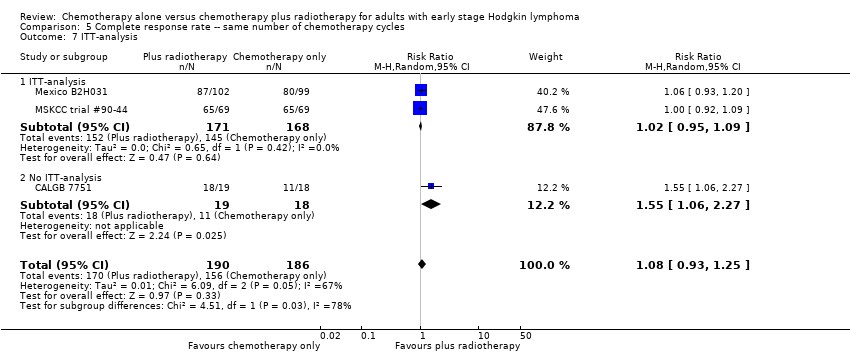
Comparison 5 Complete response rate ‐‐ same number of chemotherapy cycles, Outcome 7 ITT‐analysis.
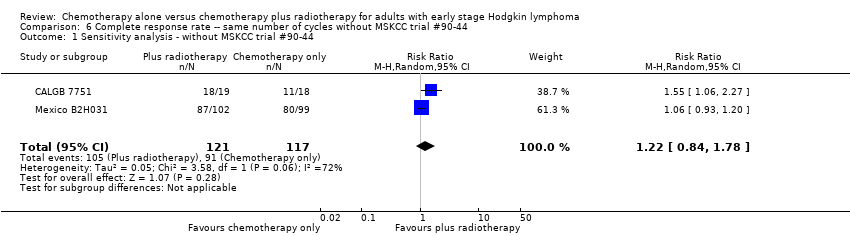
Comparison 6 Complete response rate ‐‐ same number of cycles without MSKCC trial #90‐44, Outcome 1 Sensitivity analysis ‐ without MSKCC trial #90‐44.

Comparison 6 Complete response rate ‐‐ same number of cycles without MSKCC trial #90‐44, Outcome 2 Bulky vs non‐bulky.

Comparison 6 Complete response rate ‐‐ same number of cycles without MSKCC trial #90‐44, Outcome 3 Timing of radiotherapy.

Comparison 6 Complete response rate ‐‐ same number of cycles without MSKCC trial #90‐44, Outcome 4 Type of radiotherapy.

Comparison 6 Complete response rate ‐‐ same number of cycles without MSKCC trial #90‐44, Outcome 5 Type of chemotherapy.
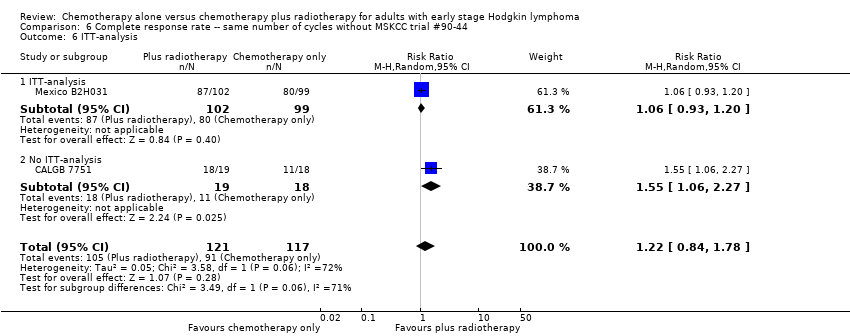
Comparison 6 Complete response rate ‐‐ same number of cycles without MSKCC trial #90‐44, Outcome 6 ITT‐analysis.

Comparison 7 Overall response rate ‐‐ same number of chemotherapy cycles, Outcome 1 All trials.

Comparison 7 Overall response rate ‐‐ same number of chemotherapy cycles, Outcome 2 Proportion of patients early favourable.
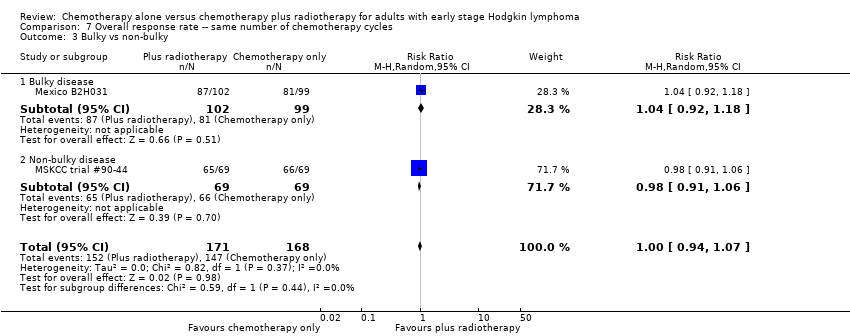
Comparison 7 Overall response rate ‐‐ same number of chemotherapy cycles, Outcome 3 Bulky vs non‐bulky.

Comparison 7 Overall response rate ‐‐ same number of chemotherapy cycles, Outcome 4 Timing of radiotherapy.

Comparison 7 Overall response rate ‐‐ same number of chemotherapy cycles, Outcome 5 Type of radiotherapy.

Comparison 8 Overall response rate ‐‐ same number of chemotherapy cycles without MSKCC trial #90‐44, Outcome 1 Sensitivity analysis ‐ without MSKCC trial #90‐44.
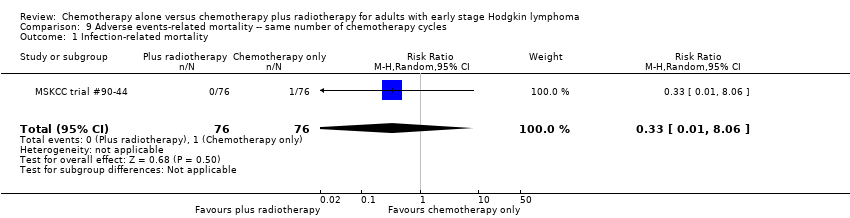
Comparison 9 Adverse events‐ related mortality ‐‐ same number of chemotherapy cycles, Outcome 1 Infection‐ related mortality.

Comparison 9 Adverse events‐ related mortality ‐‐ same number of chemotherapy cycles, Outcome 2 Second cancer‐ related mortality.

Comparison 9 Adverse events‐ related mortality ‐‐ same number of chemotherapy cycles, Outcome 3 Cardiac disease‐ related mortality.
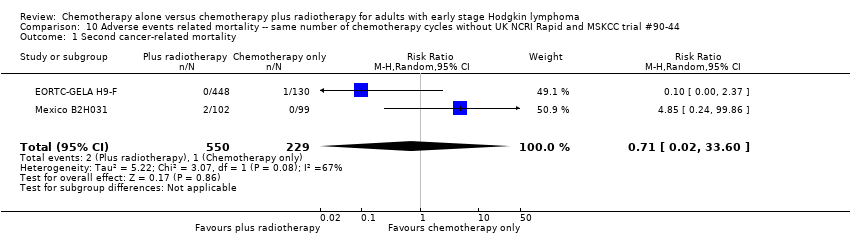
Comparison 10 Adverse events related mortality ‐‐ same number of chemotherapy cycles without UK NCRI Rapid and MSKCC trial #90‐44, Outcome 1 Second cancer‐ related mortality.

Comparison 10 Adverse events related mortality ‐‐ same number of chemotherapy cycles without UK NCRI Rapid and MSKCC trial #90‐44, Outcome 2 Cardiac disease‐ related mortality.

Comparison 11 Overall survival ‐ different numbers of chemotherapy cycles, Outcome 1 All trials.

Comparison 12 Progression‐free survival ‐‐ different numbers of chemotherapy cycles, Outcome 1 All trials.

Comparison 12 Progression‐free survival ‐‐ different numbers of chemotherapy cycles, Outcome 2 Proportion of patients early favourable.

Comparison 12 Progression‐free survival ‐‐ different numbers of chemotherapy cycles, Outcome 3 Bulky vs non‐bulky.
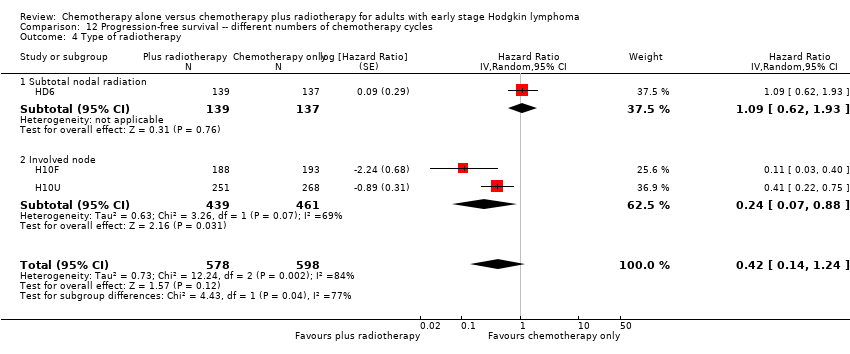
Comparison 12 Progression‐free survival ‐‐ different numbers of chemotherapy cycles, Outcome 4 Type of radiotherapy.
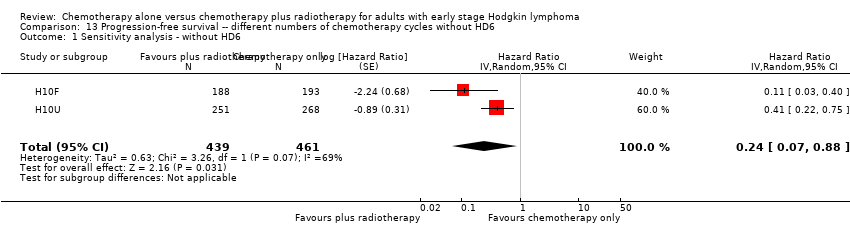
Comparison 13 Progression‐free survival ‐‐ different numbers of chemotherapy cycles without HD6, Outcome 1 Sensitivity analysis ‐ without HD6.
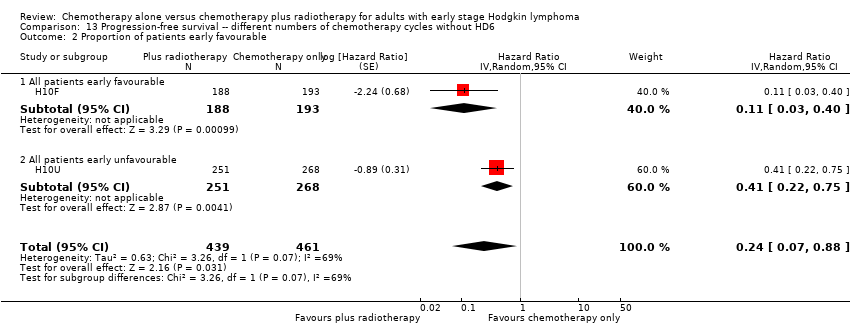
Comparison 13 Progression‐free survival ‐‐ different numbers of chemotherapy cycles without HD6, Outcome 2 Proportion of patients early favourable.

Comparison 13 Progression‐free survival ‐‐ different numbers of chemotherapy cycles without HD6, Outcome 3 Bulky vs non‐bulky.

Comparison 14 Adverse events related mortality ‐‐ different numbers of chemotherapy cycles, Outcome 1 Infection‐ related mortality.

Comparison 14 Adverse events related mortality ‐‐ different numbers of chemotherapy cycles, Outcome 2 Second cancer‐ related mortality.
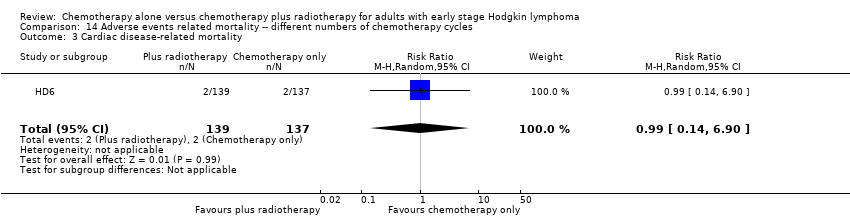
Comparison 14 Adverse events related mortality ‐‐ different numbers of chemotherapy cycles, Outcome 3 Cardiac disease‐ related mortality.
| Same number of chemotherapy cycles in both arms | ||||||
| Chemotherapy alone versus chemotherapy plus radiotherapy for adults with early stage Hodgkin lymphoma. | ||||||
| Outcomes | № of participants | Quality of the evidence | Relative effect | Anticipated absolute effects* (95% CI) | Comment | |
| Risk with chemotherapy only | Risk with chemotherapy plus radiotherapy | |||||
| Mortality (calculated instead of overall survival) Follow‐up : 5 years The low‐ mortality rate was taken from the EORTC‐GELA H9‐F trial, the high‐ mortality rate was taken from the Mexico B2H031trial | 1388 | ⊕⊕⊕⊝ | HR 0.48 | Low risk to die | ||
| 30 per 1000 | 15 per 1000 | Number of people who will die | ||||
| High risk to die | ||||||
| 150 per 1000 | 75 per 1000 | |||||
| Mortality sensitivity analysis (calculated instead of overall survival) ‐ without UK NCRI Rapid trial and MSKCC trial #90‐44due to high risk of other bias Follow‐up : 5 years The low‐ mortality rate was taken from the EORTC‐GELA H9‐F trial, the high‐ mortality rate was taken from the Mexico B2H031trial | 816 | ⊕⊕⊕⊝ | HR 0.31 | Low risk to die | ||
| 30 per 1000 | 9 per 1000 | Number of people who will die | ||||
| High risk to die | ||||||
| 150 per 1000 | 49 per 1000 | |||||
| Relapse, progression or death (calculated instead of PFS) Follow‐up : 5 years | 1351 | ⊕⊕⊕⊝ | HR 0.42 | Low risk of progress, relapse or death | ||
| 100 per 1000 | 43 per 1000 | Number of people who will have a progress, relapse or die | ||||
| High risk of progress, relapse or death | ||||||
| 300 per 1000 | 139 per 1000 | |||||
| Infection‐ related mortality | 152 | ⊕⊕⊝⊝ | RR 0.33 | Study population | ||
| 13 per 1000 | 4 per 1000 | |||||
| Second cancer‐ related mortality | 1199 | ⊕⊕⊝⊝ | RR 0.53 | Study population | ||
| 9 per 1,000 | 5 per 1000 | |||||
| Cardiac disease‐ related mortality | 457 | ⊕⊕⊝⊝ | RR 2.94 | Low risk | ||
| 1 per 1,000 | 3 per 1000 | |||||
| Complete response rate | 376 | ⊕⊕⊝⊝ | RR 1.08 | Study population | ||
| 839 per 1,000 | 906 per 1000 | |||||
| *The risk in the intervention group (and its 95% confidence interval) is based on the assumed risk in the comparison group and the relative effect of the intervention (and its 95% CI). | ||||||
| GRADE Working Group grades of evidence | ||||||
| 1 Substantial heterogeneity, downgraded by 1 point for inconsistency 2 Sensitivity analysis, excluding two trials with potential high risk of other bias. Downgraded by 1 point for imprecision due to low number of included patients and events 3 Definition of PFS varied across trials, downgraded by 1 point for inconsistency 4 Very small number of events, downgraded by 2 points for imprecision 5Statistical heterogeneity (I ² = 67%), downgraded by 1 point for inconsistency 6 Low number of events, downgraded by 1 point for imprecision | ||||||
| Different numbers of chemotherapy cycles in both arms | ||||||
| Chemotherapy alone versus chemotherapy plus radiotherapy for adults with early stage Hodgkin lymphoma | ||||||
| Outcomes | № of participants | Quality of the evidence | Relative effect | Anticipated absolute effects* (95% CI) | Comment | |
| Risk with chemotherapy only | Risk with chemotherapy plus radiotherapy | |||||
| Mortality (calculated instead of overall survival) Follow‐up : 5 years The low‐ mortality rate was taken from the EORTC‐GELA H9‐F trial, the high‐ mortality rate was taken from the Mexico B2H031trial | 276 | ⊕⊕⊝⊝ | HR 2.12 | Low risk to die | ||
| 30 per 1000 | 63 per 1000 | Number of people who will die | ||||
| High risk to die | ||||||
| 150 per 1000 | 291 per 1000 | |||||
| Relapse, progression or death (calculated instead of PFS) Follow‐up : 5 years | 1176 | ⊕⊕⊝⊝ | HR 0.42 | Low risk of progress, death | ||
| 100 per 1000 | 43 per 1000 | Number of people who will have a progress, relapse or die | ||||
| High risk of progress, death | ||||||
| 300 per 1000 | 139 per 1000 | |||||
| Relapse, progression or death (calculated instead of PFS) sensitivity analysis ‐ without HD6trial due to high risk of other bias Follow‐up : 5 years | 900 2 (RCTs) | ⊕⊕⊕⊝ | HR 0.24 | Low risk of progress, death | ||
| 100 per 1000 | 25 per 1000 (7 to 88) | Number of people who will have a progress, relapse or die | ||||
| High risk of progress, death | ||||||
| 300 per 1000 | 82 per 1000 (25 to 269) | |||||
| Infection‐ related mortality | 276 | ⊕⊕⊝⊝ | RR 6.90 | Low risk | ||
| 1 per 1000 | 7 per 1000 | |||||
| Second cancer‐ related mortality | 276 | ⊕⊕⊝⊝ | RR 2.22 | Study population | ||
| 29 per 1000 | 65 per 1000 | |||||
| Cardiac disease‐ related mortality | 276 | ⊕⊕⊝⊝ | RR 0.99 | Study population | ||
| 15 per 1000 | 14 per 1000 | |||||
| Complete response rate | not reported | |||||
| *The risk in the intervention group (and its 95% confidence interval) is based on the assumed risk in the comparison group and the relative effect of the intervention (and its 95% CI). | ||||||
| GRADE Working Group grades of evidence | ||||||
| 1 Very low number of events, downgraded by 2 points for imprecision 2 Serious heterogeneity (I² = 84%), downgraded by 2 points for inconsistency | ||||||
| Number of patients evaluated | 18: chemotherapy 19: chemotherapy plus radiotherapy | 193: chemotherapy 188: chemotherapy plus radiotherapy | 268: chemotherapy 251: chemotherapy plus radiotherapy | 137: chemotherapy 139: chemotherapy plus radiotherapy | 130: chemotherapy 448: chemotherapy plus radiotherapy | 99: chemotherapy 102: chemotherapy plus radiotherapy | 76: chemotherapy 76: chemotherapy plus radiotherapy | 211: chemotherapy 209: chemotherapy plus radiotherapy |
| Chemotherapy and radiotherapy | 6 cycles of CVPP +/‐ involved‐field radiotherapy (dosage unknown) | 4 cycles of ABVD vs 3 cycles of ABVD + 30 Gy (+6 Gy) involved node radiotherapy | 6 cycles of ABVD vs 4 cycles of ABVD + 30 Gy (+6 Gy) involved node radiotherapy | 4 cycles of ABVD or 2 cycles of ABVD + 35 Gy subtotal nodal radiotherapy | 6 cycles of EBVP +/‐ IF radiotherapy | 6 cycles of ABVD +/‐ EF‐radiotherapy | 6 cycles of ABVD +/‐ EF or IF radiotherapy | 3 cycles of ABVD +/‐ 30 Gy IF‐radiotherapy |
| Median duration of follow‐up | 1.8 years | 1.1 years | 1.1 years | 11.3 years | 4.3 years | 11.4 years | 5.6 years | 60 months |
| Trial | Definition of progression outcome. |
| Definition of disease‐free survival not reported (Note all patients are in CR at the time of randomisation). | |
| From the date of random assignment to date of progression—as relapse after previous complete remission or progression after reaching partial remission (>= 50% decrease and resolution of B symptoms and no new lesions) or progressive disease (50% increase from nadir of any previous partial remission lesions or appearance of new lesions) on computed tomography scan measurements during protocol treatment or death resulting from any cause, whichever occurred first. | |
| Measured as event‐free survival from the date of randomisation until the date of disease progression or death from any cause. | |
| Contradictory definitions. In the methods section: “Disease free survival was calculated for CR patients from the beginning of treatment until clinically or radiologically and biopsy proven relapse.” In the results section the percentage disease free were calculated based on the full population. | |
| Time from enrolment until any progression of disease. | |
| Time from the date of randomisation to first progression, relapse, or death, whichever occurred first. |
| Outcome or subgroup title | No. of studies | No. of participants | Statistical method | Effect size |
| 1 All trials Show forest plot | 5 | 1388 | Hazard Ratio (Random, 95% CI) | 0.48 [0.22, 1.06] |
| 2 Proportion of patients early favourable Show forest plot | 4 | 968 | Hazard Ratio (Random, 95% CI) | 0.31 [0.19, 0.50] |
| 2.1 All patients early favourable | 1 | 578 | Hazard Ratio (Random, 95% CI) | 0.27 [0.04, 1.74] |
| 2.2 Mixed patient population (˜ 30 to 50% patients early unfavourable) | 1 | 152 | Hazard Ratio (Random, 95% CI) | 0.31 [0.08, 1.15] |
| 2.3 All patients early unfavourable | 2 | 238 | Hazard Ratio (Random, 95% CI) | 0.31 [0.18, 0.54] |
| 3 Bulky vs non‐bulky Show forest plot | 4 | 1351 | Hazard Ratio (Random, 95% CI) | 0.47 [0.18, 1.19] |
| 3.1 Bulky disease | 1 | 201 | Hazard Ratio (Random, 95% CI) | 0.29 [0.17, 0.51] |
| 3.2 Non‐bulky disease | 3 | 1150 | Hazard Ratio (Random, 95% CI) | 0.60 [0.16, 2.27] |
| 4 Timing of radiotherapy Show forest plot | 5 | 1388 | Hazard Ratio (Random, 95% CI) | 0.48 [0.22, 1.06] |
| 4.1 Radiotherapy after chemotherapy | 3 | 1150 | Hazard Ratio (Random, 95% CI) | 0.60 [0.16, 2.27] |
| 4.2 Sandwich technique (CT‐RT‐CT) | 1 | 201 | Hazard Ratio (Random, 95% CI) | 0.29 [0.17, 0.51] |
| 4.3 Chemotherapy after radiotherapy | 1 | 37 | Hazard Ratio (Random, 95% CI) | 0.63 [0.11, 3.65] |
| 5 Type of radiotherapy Show forest plot | 5 | 1388 | Hazard Ratio (Random, 95% CI) | 0.48 [0.22, 1.06] |
| 5.1 Involved field | 3 | 1035 | Hazard Ratio (Random, 95% CI) | 0.83 [0.26, 2.67] |
| 5.2 Extended field | 1 | 201 | Hazard Ratio (Random, 95% CI) | 0.29 [0.17, 0.51] |
| 5.3 Mixed radiotherapy | 1 | 152 | Hazard Ratio (Random, 95% CI) | 0.31 [0.08, 1.15] |
| 6 Type of chemotherapy Show forest plot | 5 | 1388 | Hazard Ratio (Random, 95% CI) | 0.48 [0.22, 1.06] |
| 6.1 ABVD | 3 | 773 | Hazard Ratio (Random, 95% CI) | 0.53 [0.17, 1.68] |
| 6.2 CVPP | 1 | 37 | Hazard Ratio (Random, 95% CI) | 0.63 [0.11, 3.65] |
| 6.3 EBVP | 1 | 578 | Hazard Ratio (Random, 95% CI) | 0.27 [0.04, 1.73] |
| 7 ITT‐analysis Show forest plot | 5 | 1388 | Hazard Ratio (Random, 95% CI) | 0.48 [0.22, 1.06] |
| 7.1 ITT‐analysis | 4 | 1351 | Hazard Ratio (Random, 95% CI) | 0.47 [0.18, 1.19] |
| 7.2 No ITT‐analysis | 1 | 37 | Hazard Ratio (Random, 95% CI) | 0.63 [0.11, 3.65] |
| Outcome or subgroup title | No. of studies | No. of participants | Statistical method | Effect size |
| 1 Sensitivity analysis ‐ without UK NCRI RAPID and MSKCC trial #90‐44 Show forest plot | 3 | 816 | Hazard Ratio (Random, 95% CI) | 0.31 [0.19, 0.52] |
| 2 Proportion of patients early favourable Show forest plot | 3 | 816 | Hazard Ratio (Random, 95% CI) | 0.31 [0.19, 0.52] |
| 2.1 All patients early favourable | 1 | 578 | Hazard Ratio (Random, 95% CI) | 0.27 [0.04, 1.74] |
| 2.2 All patients early unfavourable | 2 | 238 | Hazard Ratio (Random, 95% CI) | 0.31 [0.18, 0.54] |
| 3 Bulky vs non‐bulky Show forest plot | 2 | 779 | Hazard Ratio (Random, 95% CI) | 0.29 [0.17, 0.50] |
| 3.1 Bulky disease | 1 | 201 | Hazard Ratio (Random, 95% CI) | 0.29 [0.17, 0.51] |
| 3.2 Non‐bulky disease | 1 | 578 | Hazard Ratio (Random, 95% CI) | 0.27 [0.04, 1.74] |
| 4 Timing of radiotherapy Show forest plot | 3 | 816 | Hazard Ratio (Random, 95% CI) | 0.31 [0.19, 0.52] |
| 4.1 Radiotherapy after chemotherapy | 1 | 578 | Hazard Ratio (Random, 95% CI) | 0.27 [0.04, 1.74] |
| 4.2 Sandwich technique (CT‐RT‐CT) | 1 | 201 | Hazard Ratio (Random, 95% CI) | 0.29 [0.17, 0.51] |
| 4.3 Chemotherapy after radiotherapy | 1 | 37 | Hazard Ratio (Random, 95% CI) | 0.63 [0.11, 3.65] |
| 5 Type of radiotherapy Show forest plot | 3 | 816 | Hazard Ratio (Random, 95% CI) | 0.31 [0.19, 0.52] |
| 5.1 Involved field | 2 | 615 | Hazard Ratio (Random, 95% CI) | 0.42 [0.12, 1.51] |
| 5.2 Extended field | 1 | 201 | Hazard Ratio (Random, 95% CI) | 0.29 [0.17, 0.51] |
| 6 Type of chemotherapy Show forest plot | 3 | 816 | Hazard Ratio (Random, 95% CI) | 0.31 [0.19, 0.52] |
| 6.1 ABVD | 1 | 201 | Hazard Ratio (Random, 95% CI) | 0.29 [0.17, 0.51] |
| 6.2 CVPP | 1 | 37 | Hazard Ratio (Random, 95% CI) | 0.63 [0.11, 3.65] |
| 6.3 EBVP | 1 | 578 | Hazard Ratio (Random, 95% CI) | 0.27 [0.04, 1.73] |
| 7 ITT‐analysis Show forest plot | 3 | 816 | Hazard Ratio (Random, 95% CI) | 0.31 [0.19, 0.52] |
| 7.1 ITT‐analysis | 2 | 779 | Hazard Ratio (Random, 95% CI) | 0.29 [0.17, 0.50] |
| 7.2 No ITT‐analysis | 1 | 37 | Hazard Ratio (Random, 95% CI) | 0.63 [0.11, 3.65] |
| Outcome or subgroup title | No. of studies | No. of participants | Statistical method | Effect size |
| 1 All trials Show forest plot | 4 | 1351 | Hazard Ratio (Random, 95% CI) | 0.42 [0.25, 0.72] |
| 2 Proportion of patients early favourable Show forest plot | 4 | 1351 | Hazard Ratio (Random, 95% CI) | 0.42 [0.25, 0.72] |
| 2.1 All patients early favourable | 1 | 578 | Hazard Ratio (Random, 95% CI) | 0.27 [0.17, 0.43] |
| 2.2 Mixed patient population (˜ 30 to 50% patients early unfavourable) | 2 | 572 | Hazard Ratio (Random, 95% CI) | 0.71 [0.43, 1.17] |
| 2.3 All patients early unfavourable | 1 | 201 | Hazard Ratio (Random, 95% CI) | 0.29 [0.17, 0.48] |
| 3 Bulky vs non‐bulky Show forest plot | 4 | 1351 | Hazard Ratio (Random, 95% CI) | 0.42 [0.25, 0.72] |
| 3.1 Bulky disease | 1 | 201 | Hazard Ratio (Random, 95% CI) | 0.29 [0.17, 0.48] |
| 3.2 Non‐bulky disease | 3 | 1150 | Hazard Ratio (Random, 95% CI) | 0.50 [0.24, 1.03] |
| 4 Timing of radiotherapy Show forest plot | 4 | 1351 | Hazard Ratio (Random, 95% CI) | 0.42 [0.25, 0.72] |
| 4.1 Radiotherapy after chemotherapy | 3 | 1150 | Hazard Ratio (Random, 95% CI) | 0.50 [0.24, 1.03] |
| 4.2 Sandwich technique (CT‐RT‐CT) | 1 | 201 | Hazard Ratio (Random, 95% CI) | 0.29 [0.17, 0.48] |
| 5 Type of radiotherapy Show forest plot | 4 | 1351 | Hazard Ratio (Random, 95% CI) | 0.42 [0.25, 0.72] |
| 5.1 Involved field | 2 | 998 | Hazard Ratio (Random, 95% CI) | 0.40 [0.17, 0.94] |
| 5.2 Extended field | 1 | 201 | Hazard Ratio (Random, 95% CI) | 0.29 [0.17, 0.48] |
| 5.3 Mixed radiotherapy | 1 | 152 | Hazard Ratio (Random, 95% CI) | 0.85 [0.37, 1.94] |
| 6 Type of chemotherapy Show forest plot | 4 | 1351 | Hazard Ratio (Random, 95% CI) | 0.42 [0.25, 0.72] |
| 6.1 ABVD | 3 | 773 | Hazard Ratio (Random, 95% CI) | 0.51 [0.26, 0.99] |
| 6.2 EBVP | 1 | 578 | Hazard Ratio (Random, 95% CI) | 0.27 [0.17, 0.43] |
| 7 Sensitivity analysis (per protocol results of the UK NCRI RAPID, without MSKCC trial #90‐44) Show forest plot | 3 | 1199 | Hazard Ratio (Random, 95% CI) | 0.30 [0.22, 0.41] |
| Outcome or subgroup title | No. of studies | No. of participants | Statistical method | Effect size |
| 1 Sensitivity analysis ‐ without UK NCRI RAPID and MSKCC trial #90‐44 Show forest plot | 2 | 779 | Hazard Ratio (Random, 95% CI) | 0.28 [0.20, 0.39] |
| 2 Proportion of patients early favourable Show forest plot | 2 | 779 | Hazard Ratio (Random, 95% CI) | 0.28 [0.20, 0.39] |
| 2.1 All patients early favourable | 1 | 578 | Hazard Ratio (Random, 95% CI) | 0.27 [0.17, 0.43] |
| 2.2 All patients early unfavourable | 1 | 201 | Hazard Ratio (Random, 95% CI) | 0.29 [0.17, 0.48] |
| 3 Bulky vs non‐bulky Show forest plot | 2 | 779 | Hazard Ratio (Random, 95% CI) | 0.28 [0.20, 0.39] |
| 3.1 Bulky disease | 1 | 201 | Hazard Ratio (Random, 95% CI) | 0.29 [0.17, 0.48] |
| 3.2 Non‐bulky disease | 1 | 578 | Hazard Ratio (Random, 95% CI) | 0.27 [0.17, 0.43] |
| 4 Timing of radiotherapy Show forest plot | 2 | 779 | Hazard Ratio (Random, 95% CI) | 0.28 [0.20, 0.39] |
| 4.1 Radiotherapy after chemotherapy | 1 | 578 | Hazard Ratio (Random, 95% CI) | 0.27 [0.17, 0.43] |
| 4.2 Sandwich technique (CT‐RT‐CT) | 1 | 201 | Hazard Ratio (Random, 95% CI) | 0.29 [0.17, 0.48] |
| 5 Type of radiotherapy Show forest plot | 2 | 779 | Hazard Ratio (Random, 95% CI) | 0.28 [0.20, 0.39] |
| 5.1 Involved field | 1 | 578 | Hazard Ratio (Random, 95% CI) | 0.27 [0.17, 0.43] |
| 5.2 Extended field | 1 | 201 | Hazard Ratio (Random, 95% CI) | 0.29 [0.17, 0.48] |
| 6 Type of chemotherapy Show forest plot | 2 | 779 | Hazard Ratio (Random, 95% CI) | 0.28 [0.20, 0.39] |
| 6.1 ABVD | 1 | 201 | Hazard Ratio (Random, 95% CI) | 0.29 [0.17, 0.48] |
| 6.2 EBVP | 1 | 578 | Hazard Ratio (Random, 95% CI) | 0.27 [0.17, 0.43] |
| Outcome or subgroup title | No. of studies | No. of participants | Statistical method | Effect size |
| 1 All trials Show forest plot | 3 | 376 | Risk Ratio (M‐H, Random, 95% CI) | 1.08 [0.93, 1.25] |
| 2 Proportion of patients early favourable Show forest plot | 3 | 376 | Risk Ratio (M‐H, Random, 95% CI) | 1.08 [0.93, 1.25] |
| 2.1 Mixed patient population (˜ 30 to 50% patients early unfavourable) | 1 | 138 | Risk Ratio (M‐H, Random, 95% CI) | 1.0 [0.92, 1.09] |
| 2.2 All patients early unfavourable | 2 | 238 | Risk Ratio (M‐H, Random, 95% CI) | 1.22 [0.84, 1.78] |
| 3 Bulky vs non‐bulky Show forest plot | 3 | 376 | Risk Ratio (M‐H, Random, 95% CI) | 1.08 [0.93, 1.25] |
| 3.1 Bulky disease | 1 | 201 | Risk Ratio (M‐H, Random, 95% CI) | 1.06 [0.93, 1.20] |
| 3.2 Non‐bulky disease | 2 | 175 | Risk Ratio (M‐H, Random, 95% CI) | 1.21 [0.73, 2.01] |
| 4 Timing of radiotherapy Show forest plot | 3 | 376 | Risk Ratio (M‐H, Random, 95% CI) | 1.08 [0.93, 1.25] |
| 4.1 Radiotherapy after chemotherapy | 1 | 138 | Risk Ratio (M‐H, Random, 95% CI) | 1.0 [0.92, 1.09] |
| 4.2 Sandwich technique (CT‐RT‐CT) | 1 | 201 | Risk Ratio (M‐H, Random, 95% CI) | 1.06 [0.93, 1.20] |
| 4.3 Chemotherapy after radiotherapy | 1 | 37 | Risk Ratio (M‐H, Random, 95% CI) | 1.55 [1.06, 2.27] |
| 5 Type of radiotherapy Show forest plot | 3 | 376 | Risk Ratio (M‐H, Random, 95% CI) | 1.08 [0.93, 1.25] |
| 5.1 Involved field | 1 | 37 | Risk Ratio (M‐H, Random, 95% CI) | 1.55 [1.06, 2.27] |
| 5.2 Extended field | 1 | 201 | Risk Ratio (M‐H, Random, 95% CI) | 1.06 [0.93, 1.20] |
| 5.3 Mixed | 1 | 138 | Risk Ratio (M‐H, Random, 95% CI) | 1.0 [0.92, 1.09] |
| 6 Type of chemotherapy Show forest plot | 3 | 376 | Risk Ratio (M‐H, Random, 95% CI) | 1.08 [0.93, 1.25] |
| 6.1 CVPP | 1 | 37 | Risk Ratio (M‐H, Random, 95% CI) | 1.55 [1.06, 2.27] |
| 6.2 ABVD | 2 | 339 | Risk Ratio (M‐H, Random, 95% CI) | 1.02 [0.95, 1.09] |
| 7 ITT‐analysis Show forest plot | 3 | 376 | Risk Ratio (M‐H, Random, 95% CI) | 1.08 [0.93, 1.25] |
| 7.1 ITT‐analysis | 2 | 339 | Risk Ratio (M‐H, Random, 95% CI) | 1.02 [0.95, 1.09] |
| 7.2 No ITT‐analysis | 1 | 37 | Risk Ratio (M‐H, Random, 95% CI) | 1.55 [1.06, 2.27] |
| Outcome or subgroup title | No. of studies | No. of participants | Statistical method | Effect size |
| 1 Sensitivity analysis ‐ without MSKCC trial #90‐44 Show forest plot | 2 | 238 | Risk Ratio (M‐H, Random, 95% CI) | 1.22 [0.84, 1.78] |
| 2 Bulky vs non‐bulky Show forest plot | 2 | 238 | Risk Ratio (M‐H, Random, 95% CI) | 1.22 [0.84, 1.78] |
| 2.1 Bulky disease | 1 | 201 | Risk Ratio (M‐H, Random, 95% CI) | 1.06 [0.93, 1.20] |
| 2.2 Non‐bulky disease | 1 | 37 | Risk Ratio (M‐H, Random, 95% CI) | 1.55 [1.06, 2.27] |
| 3 Timing of radiotherapy Show forest plot | 2 | 238 | Risk Ratio (M‐H, Random, 95% CI) | 1.22 [0.84, 1.78] |
| 3.1 Sandwich technique (CT‐RT‐CT) | 1 | 201 | Risk Ratio (M‐H, Random, 95% CI) | 1.06 [0.93, 1.20] |
| 3.2 Chemotherapy after radiotherapy | 1 | 37 | Risk Ratio (M‐H, Random, 95% CI) | 1.55 [1.06, 2.27] |
| 4 Type of radiotherapy Show forest plot | 2 | 238 | Risk Ratio (M‐H, Random, 95% CI) | 1.22 [0.84, 1.78] |
| 4.1 Involved field | 1 | 37 | Risk Ratio (M‐H, Random, 95% CI) | 1.55 [1.06, 2.27] |
| 4.2 Extended field | 1 | 201 | Risk Ratio (M‐H, Random, 95% CI) | 1.06 [0.93, 1.20] |
| 5 Type of chemotherapy Show forest plot | 2 | 238 | Risk Ratio (M‐H, Random, 95% CI) | 1.22 [0.84, 1.78] |
| 5.1 CVPP | 1 | 37 | Risk Ratio (M‐H, Random, 95% CI) | 1.55 [1.06, 2.27] |
| 5.2 ABVD | 1 | 201 | Risk Ratio (M‐H, Random, 95% CI) | 1.06 [0.93, 1.20] |
| 6 ITT‐analysis Show forest plot | 2 | 238 | Risk Ratio (M‐H, Random, 95% CI) | 1.22 [0.84, 1.78] |
| 6.1 ITT‐analysis | 1 | 201 | Risk Ratio (M‐H, Random, 95% CI) | 1.06 [0.93, 1.20] |
| 6.2 No ITT‐analysis | 1 | 37 | Risk Ratio (M‐H, Random, 95% CI) | 1.55 [1.06, 2.27] |
| Outcome or subgroup title | No. of studies | No. of participants | Statistical method | Effect size |
| 1 All trials Show forest plot | 2 | 339 | Risk Ratio (M‐H, Random, 95% CI) | 1.00 [0.94, 1.07] |
| 2 Proportion of patients early favourable Show forest plot | 2 | 339 | Risk Ratio (M‐H, Random, 95% CI) | 1.00 [0.94, 1.07] |
| 2.1 All patients early favourable | 1 | 138 | Risk Ratio (M‐H, Random, 95% CI) | 0.98 [0.91, 1.06] |
| 2.2 Mixed patient population (˜ 30 to 50% patients early unfavourable) | 1 | 201 | Risk Ratio (M‐H, Random, 95% CI) | 1.04 [0.92, 1.18] |
| 3 Bulky vs non‐bulky Show forest plot | 2 | 339 | Risk Ratio (M‐H, Random, 95% CI) | 1.00 [0.94, 1.07] |
| 3.1 Bulky disease | 1 | 201 | Risk Ratio (M‐H, Random, 95% CI) | 1.04 [0.92, 1.18] |
| 3.2 Non‐bulky disease | 1 | 138 | Risk Ratio (M‐H, Random, 95% CI) | 0.98 [0.91, 1.06] |
| 4 Timing of radiotherapy Show forest plot | 2 | 339 | Risk Ratio (M‐H, Random, 95% CI) | 1.00 [0.94, 1.07] |
| 4.1 Radiotherapy after chemotherapy | 1 | 138 | Risk Ratio (M‐H, Random, 95% CI) | 0.98 [0.91, 1.06] |
| 4.2 Sandwich technique (CT‐RT‐CT) | 1 | 201 | Risk Ratio (M‐H, Random, 95% CI) | 1.04 [0.92, 1.18] |
| 5 Type of radiotherapy Show forest plot | 2 | 339 | Risk Ratio (M‐H, Random, 95% CI) | 1.00 [0.94, 1.07] |
| 5.1 Extended field | 1 | 201 | Risk Ratio (M‐H, Random, 95% CI) | 1.04 [0.92, 1.18] |
| 5.2 Mixed | 1 | 138 | Risk Ratio (M‐H, Random, 95% CI) | 0.98 [0.91, 1.06] |
| Outcome or subgroup title | No. of studies | No. of participants | Statistical method | Effect size |
| 1 Sensitivity analysis ‐ without MSKCC trial #90‐44 Show forest plot | 1 | 201 | Risk Ratio (M‐H, Random, 95% CI) | 1.04 [0.92, 1.18] |
| Outcome or subgroup title | No. of studies | No. of participants | Statistical method | Effect size |
| 1 Infection‐ related mortality Show forest plot | 1 | 152 | Risk Ratio (M‐H, Random, 95% CI) | 0.33 [0.01, 8.06] |
| 2 Second cancer‐ related mortality Show forest plot | 3 | 1199 | Risk Ratio (M‐H, Random, 95% CI) | 0.53 [0.07, 4.29] |
| 3 Cardiac disease‐ related mortality Show forest plot | 2 | 457 | Risk Ratio (M‐H, Random, 95% CI) | 2.94 [0.31, 27.55] |
| Outcome or subgroup title | No. of studies | No. of participants | Statistical method | Effect size |
| 1 Second cancer‐ related mortality Show forest plot | 2 | 779 | Risk Ratio (M‐H, Random, 95% CI) | 0.71 [0.02, 33.60] |
| 2 Cardiac disease‐ related mortality Show forest plot | 1 | 37 | Risk Ratio (M‐H, Random, 95% CI) | 2.85 [0.12, 65.74] |
| Outcome or subgroup title | No. of studies | No. of participants | Statistical method | Effect size |
| 1 All trials Show forest plot | 1 | 276 | Hazard Ratio (Random, 95% CI) | 2.12 [1.03, 4.37] |
| Outcome or subgroup title | No. of studies | No. of participants | Statistical method | Effect size |
| 1 All trials Show forest plot | 3 | 1176 | Hazard Ratio (Random, 95% CI) | 0.42 [0.14, 1.24] |
| 2 Proportion of patients early favourable Show forest plot | 3 | 1176 | Hazard Ratio (Random, 95% CI) | 0.42 [0.14, 1.24] |
| 2.1 All patients early favourable | 1 | 381 | Hazard Ratio (Random, 95% CI) | 0.11 [0.03, 0.40] |
| 2.2 All patients early unfavourable | 2 | 795 | Hazard Ratio (Random, 95% CI) | 0.67 [0.26, 1.76] |
| 3 Bulky vs non‐bulky Show forest plot | 3 | 1176 | Hazard Ratio (Random, 95% CI) | 0.42 [0.14, 1.24] |
| 3.1 Bulky disease | 1 | 519 | Hazard Ratio (Random, 95% CI) | 0.41 [0.22, 0.75] |
| 3.2 Non‐bulky disease | 2 | 657 | Hazard Ratio (Random, 95% CI) | 0.37 [0.04, 3.61] |
| 4 Type of radiotherapy Show forest plot | 3 | 1176 | Hazard Ratio (Random, 95% CI) | 0.42 [0.14, 1.24] |
| 4.1 Subtotal nodal radiation | 1 | 276 | Hazard Ratio (Random, 95% CI) | 1.09 [0.62, 1.93] |
| 4.2 Involved node | 2 | 900 | Hazard Ratio (Random, 95% CI) | 0.24 [0.07, 0.88] |
| Outcome or subgroup title | No. of studies | No. of participants | Statistical method | Effect size |
| 1 Sensitivity analysis ‐ without HD6 Show forest plot | 2 | 900 | Hazard Ratio (Random, 95% CI) | 0.24 [0.07, 0.88] |
| 2 Proportion of patients early favourable Show forest plot | 2 | 900 | Hazard Ratio (Random, 95% CI) | 0.24 [0.07, 0.88] |
| 2.1 All patients early favourable | 1 | 381 | Hazard Ratio (Random, 95% CI) | 0.11 [0.03, 0.40] |
| 2.2 All patients early unfavourable | 1 | 519 | Hazard Ratio (Random, 95% CI) | 0.41 [0.22, 0.75] |
| 3 Bulky vs non‐bulky Show forest plot | 2 | 900 | Hazard Ratio (Random, 95% CI) | 0.24 [0.07, 0.88] |
| 3.1 Bulky disease | 1 | 519 | Hazard Ratio (Random, 95% CI) | 0.41 [0.22, 0.75] |
| 3.2 Non‐bulky disease | 1 | 381 | Hazard Ratio (Random, 95% CI) | 0.11 [0.03, 0.40] |
| Outcome or subgroup title | No. of studies | No. of participants | Statistical method | Effect size |
| 1 Infection‐ related mortality Show forest plot | 1 | 276 | Risk Ratio (M‐H, Random, 95% CI) | 6.9 [0.36, 132.34] |
| 2 Second cancer‐ related mortality Show forest plot | 1 | 276 | Risk Ratio (M‐H, Random, 95% CI) | 2.22 [0.70, 7.03] |
| 3 Cardiac disease‐ related mortality Show forest plot | 1 | 276 | Risk Ratio (M‐H, Random, 95% CI) | 0.99 [0.14, 6.90] |