Quimioterapia sola versus quimioterapia más radioterapia para pacientes adultos con linfoma de Hodgkin en estadio inicial
Información
- DOI:
- https://doi.org/10.1002/14651858.CD007110.pub3Copiar DOI

- Base de datos:
-
- Cochrane Database of Systematic Reviews
- Versión publicada:
-
- 27 abril 2017see what's new
- Tipo:
-
- Intervention
- Etapa:
-
- Review
- Grupo Editorial Cochrane:
-
Grupo Cochrane de Hematología
- Copyright:
-
- Copyright © 2017 The Cochrane Collaboration. Published by John Wiley & Sons, Ltd.
Cifras del artículo
Altmetric:
Citado por:
Autores
Contributions of authors
Blank O: Abstract screening, data extraction, quality assessment (risk of bias ), data analysis and interpretation, drafting of the review, 'Summary of findings' tables , adverse events.
Skoetz N: Data checking (third author), communication between authors, proofreading, update screening.
Monsef I: Search strategy, electronic search, handsearching for trials.
Specht L: Clinical expertise, advice for the protocol.
Engert A: Clinical expertise, content input.
von Tresckow B: Clinical expertise, content input.
Sources of support
Internal sources
-
University Hospital of Cologne, Department I of Internal Medicine, Germany.
External sources
-
BMBF, Germany.
For the first version of the review: Project grant application NO 01KG0815, Federal Ministry of Education and Research (BMBF)
Declarations of interest
Blank O: no known conflict of interest.
Monsef I: no known conflict of interest.
Specht L: no known conflict of interest.
Engert A: no known conflict of interest.
Skoetz N: no known conflict of interest.
von Tresckow B: no known conflict of interest.
Acknowledgements
We are grateful to the following persons for their comments and improving the first version of the review: Dr. Sue Richards and Prof. Benjamin Djulbegovic, Editors of the Cochrane Haematological Malignancies Group, and Sabine Kluge and Dr. Kathrin Bauer from Cochrane Haematological Malignancies Group.
We are grateful to the following persons for publishing the first version of the review: Rehan F, Brillant C, Schulz H, Bohlius J, Herbst C.
Version history
| Published | Title | Stage | Authors | Version |
| 2017 Apr 27 | Chemotherapy alone versus chemotherapy plus radiotherapy for adults with early stage Hodgkin lymphoma | Review | Oliver Blank, Bastian von Tresckow, Ina Monsef, Lena Specht, Andreas Engert, Nicole Skoetz | |
| 2011 Feb 16 | Chemotherapy alone versus chemotherapy plus radiotherapy for early stage Hodgkin lymphoma | Review | Christine Herbst, Fareed Ahmed Rehan, Nicole Skoetz, Julia Bohlius, Corinne Brillant, Holger Schulz, Ina Monsef, Lena Specht, Andreas Engert | |
| 2008 Apr 23 | Chemotherapy alone versus chemotherapy plus radiotherapy for early stage Hodgkin Lymphoma | Protocol | Fareed Ahmed Rehan, Julia Bohlius, Corinne Brillant, Ina Monsef, Lena Specht, Andreas Engert | |
Differences between protocol and review
Data synthesis
Because of the clinical heterogeneity of the trials (e.g. different types of chemotherapy, starting points in different decades) we used a random‐effects model.
Assessment of risk of bias in included studies
For quality assessment we preferred to use a "domain‐based evaluation" as described in Cochrane's tool for assessing risk of bias (Higgins 2011b), since it was more compatible to the 'Risk of bias' table included in the RevMan 5. We replaced the following quality questions.
-
Was treatment allocation concealed?
-
Were outcome assessors blind to treatment assigned?
-
Were numbers of withdraws, dropouts, lost to follow‐up and protocol violations in each group stated and were there less than 10% in each arm?
-
Were patients included in the analyses as part of the group to which they were allocated (intention‐to‐treat analyses)?
-
Were the baseline characteristics similar in both groups?
Progression‐free survival
Because not all trials reported progression‐free survival (PFS) according to our definition (time to progress or relapse or death of any cause in all randomised patients), we accepted other progression outcomes and evaluated these as tumour control.
'Summary of findings' tables
We included 'Summary of findings' tables using the GRADE approach.
Differences between review and review update
-
In accordance with Methodological Expectations of Cochrane Intervention Reviews (MECIR), we additionally searched the following clinical trial registers:
-
EU clinical trials register: https://www.clinicaltrialsregister.eu/ctr‐search/search;
-
Clinicaltrials.gov: https://clinicaltrials.gov/.
-
-
No post‐hoc analyses: in the updated review we did not search explicitly for patients in advanced stages, therefore it is doubtful that all trials are identified and post‐hoc analyses could be biased.
-
In contrast to the first version of this review, we excluded trials randomising children. We considered only trials with adults. So we excluded the GATLA 9‐H‐77 trial (Pavlovsky 1988) from the analyses, because the trial did not include a large enough proportion of adults and that data for this subgroup were not available.
-
In the first version of the review, we excluded trials if the number of cycles of chemotherapy was not identical in both study arms. In contrast to the first version, we included these trials in the update and added a second comparison with trials evaluating different numbers of chemotherapy cycles in both arms.
-
In this update we excluded the sensitivity analysis regarding the influence of a single large study on the overall result because the data situation changed. However we excluded three trials (HD6; MSKCC trial #90‐44; UK NCRI Rapid) from a sensitivity analysis because we found potential other high risk of bias regarding overall survival (OS), and we did not find per‐protocol results. Because of the published per‐protocol results regarding progression‐free survival (PFS) of the UK NCRI Rapid trial, we completed a sensitivity analysis with these results. For the other trials no per‐protocol results for PFS were available.
-
To reduce the number of the subgroup analyses, we removed some of the clinically less relevant subgroups (median length of follow‐up and four ‐year survival in the chemotherapy alone group), or of these where no data are available (gender, age, clinical stage). We will consider the subgroup analyses regarding gender, age and clinical stage for future updates if more data allow such analyses.
-
We examined the trials regarding adverse events. Because of insufficient comparable data we focused on adverse events leading to death: infection‐ related mortality, second cancer‐ related mortality, cardiac disease‐ related mortality.
Notes
Parts of the review matched the templates of the Cochrane Haematological Malignancies Group, especially the methods.
Keywords
MeSH
Medical Subject Headings (MeSH) Keywords
- Chemoradiotherapy;
- Combined Modality Therapy [methods];
- Disease Progression;
- Heart Diseases [mortality];
- Hodgkin Disease [*drug therapy, mortality, pathology, *radiotherapy];
- Infections [mortality];
- Neoplasms, Second Primary [mortality];
- Randomized Controlled Trials as Topic;
- Recurrence;
- Survival Analysis;
Medical Subject Headings Check Words
Humans;
PICO
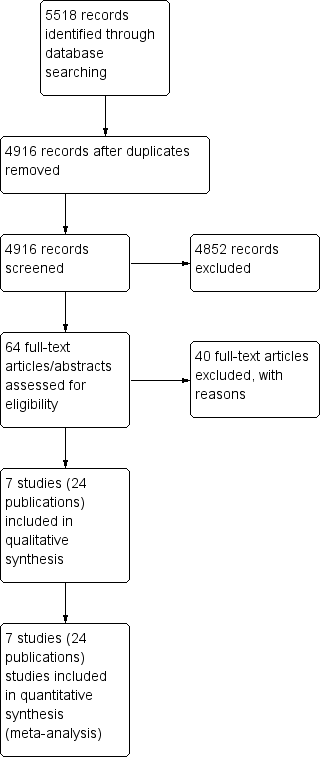
Study flow diagram.
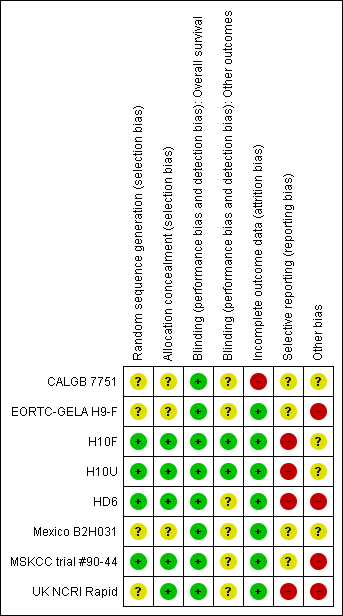
Methodological quality summary: review authors' judgements about each methodological quality item for each included study.
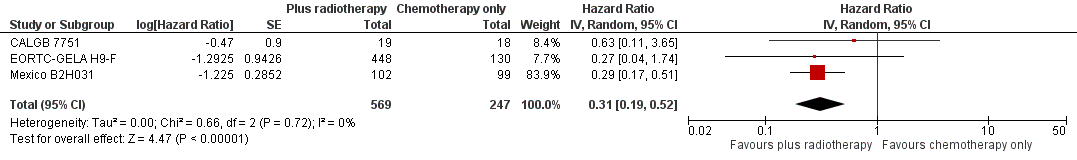
Forest plot of comparison: 2 Overall survival ‐‐ same number of chemotherapy cycles without UK NCRI Rapid and MSKCC trial #90‐44 , outcome: 2.1 Sensitivity analysis ‐ without UK NCRI Rapid and MSKCC trial #90‐44.
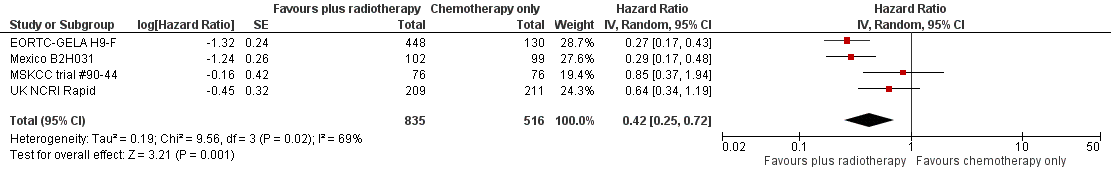
Forest plot of comparison: 2 Progression‐free survival, outcome: 2.1 All trials.

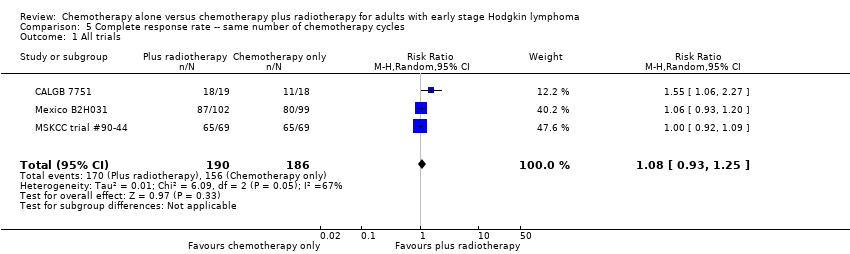
Forest plot of comparison: 3 Complete response rate, outcome: 3.1 All trials.
Forest plot of comparison: 4 Overall Response Rate, outcome: 4.1 All Trials.
Comparison 1 Overall survival ‐‐ same number of chemotherapy cycles, Outcome 1 All trials.

Comparison 1 Overall survival ‐‐ same number of chemotherapy cycles, Outcome 2 Proportion of patients early favourable.

Comparison 1 Overall survival ‐‐ same number of chemotherapy cycles, Outcome 3 Bulky vs non‐bulky.
Comparison 1 Overall survival ‐‐ same number of chemotherapy cycles, Outcome 4 Timing of radiotherapy.
Comparison 1 Overall survival ‐‐ same number of chemotherapy cycles, Outcome 5 Type of radiotherapy.

Comparison 1 Overall survival ‐‐ same number of chemotherapy cycles, Outcome 6 Type of chemotherapy.

Comparison 1 Overall survival ‐‐ same number of chemotherapy cycles, Outcome 7 ITT‐analysis.

Comparison 2 Overall survival ‐‐ same number of chemotherapy cycles without UK NCRI Rapid and MSKCC trial #90‐44, Outcome 1 Sensitivity analysis ‐ without UK NCRI RAPID and MSKCC trial #90‐44.

Comparison 2 Overall survival ‐‐ same number of chemotherapy cycles without UK NCRI Rapid and MSKCC trial #90‐44, Outcome 2 Proportion of patients early favourable.
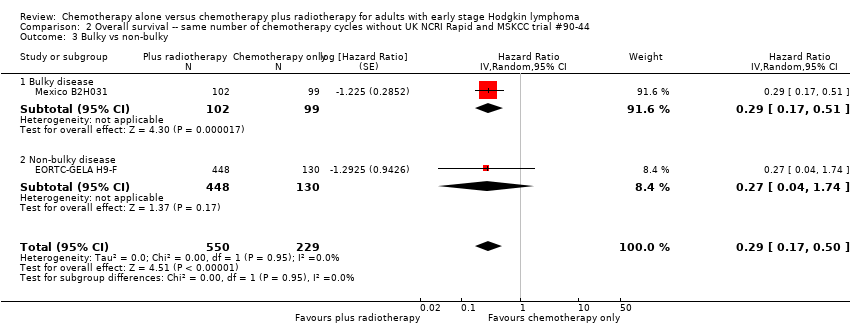
Comparison 2 Overall survival ‐‐ same number of chemotherapy cycles without UK NCRI Rapid and MSKCC trial #90‐44, Outcome 3 Bulky vs non‐bulky.
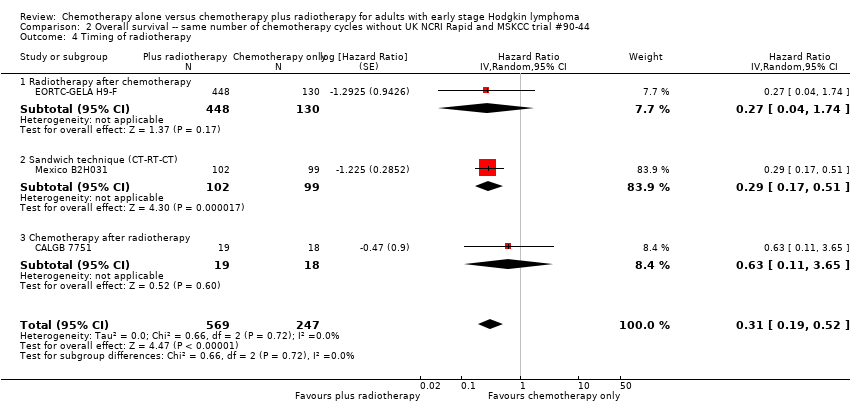
Comparison 2 Overall survival ‐‐ same number of chemotherapy cycles without UK NCRI Rapid and MSKCC trial #90‐44, Outcome 4 Timing of radiotherapy.
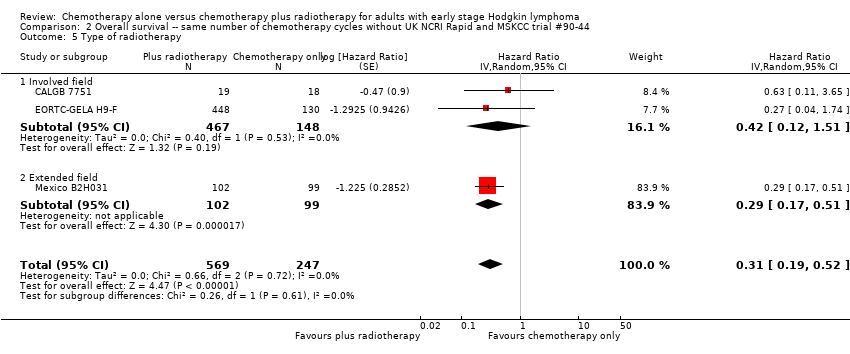
Comparison 2 Overall survival ‐‐ same number of chemotherapy cycles without UK NCRI Rapid and MSKCC trial #90‐44, Outcome 5 Type of radiotherapy.

Comparison 2 Overall survival ‐‐ same number of chemotherapy cycles without UK NCRI Rapid and MSKCC trial #90‐44, Outcome 6 Type of chemotherapy.

Comparison 2 Overall survival ‐‐ same number of chemotherapy cycles without UK NCRI Rapid and MSKCC trial #90‐44, Outcome 7 ITT‐analysis.

Comparison 3 Progression‐free survival ‐‐ same number of chemotherapy cycles, Outcome 1 All trials.

Comparison 3 Progression‐free survival ‐‐ same number of chemotherapy cycles, Outcome 2 Proportion of patients early favourable.
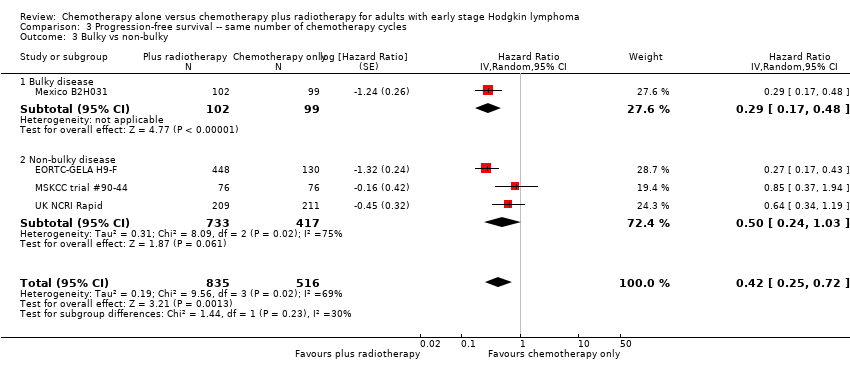
Comparison 3 Progression‐free survival ‐‐ same number of chemotherapy cycles, Outcome 3 Bulky vs non‐bulky.

Comparison 3 Progression‐free survival ‐‐ same number of chemotherapy cycles, Outcome 4 Timing of radiotherapy.

Comparison 3 Progression‐free survival ‐‐ same number of chemotherapy cycles, Outcome 5 Type of radiotherapy.

Comparison 3 Progression‐free survival ‐‐ same number of chemotherapy cycles, Outcome 6 Type of chemotherapy.

Comparison 3 Progression‐free survival ‐‐ same number of chemotherapy cycles, Outcome 7 Sensitivity analysis (per protocol results of the UK NCRI RAPID, without MSKCC trial #90‐44).
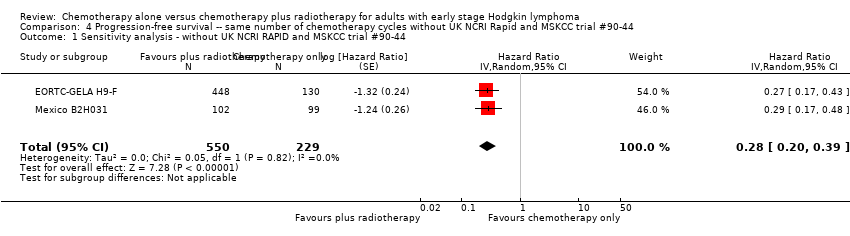
Comparison 4 Progression‐free survival ‐‐ same number of chemotherapy cycles without UK NCRI Rapid and MSKCC trial #90‐44, Outcome 1 Sensitivity analysis ‐ without UK NCRI RAPID and MSKCC trial #90‐44.
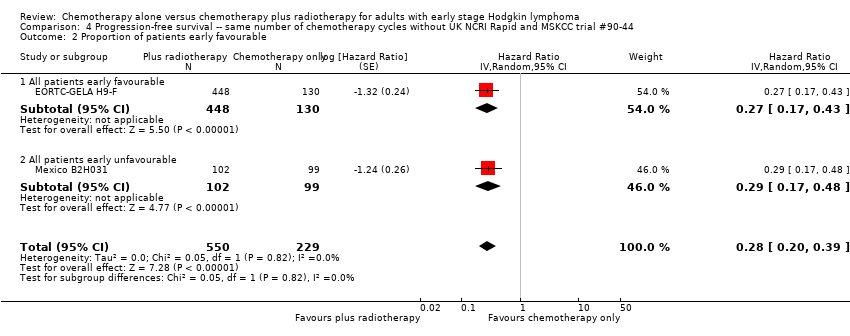
Comparison 4 Progression‐free survival ‐‐ same number of chemotherapy cycles without UK NCRI Rapid and MSKCC trial #90‐44, Outcome 2 Proportion of patients early favourable.
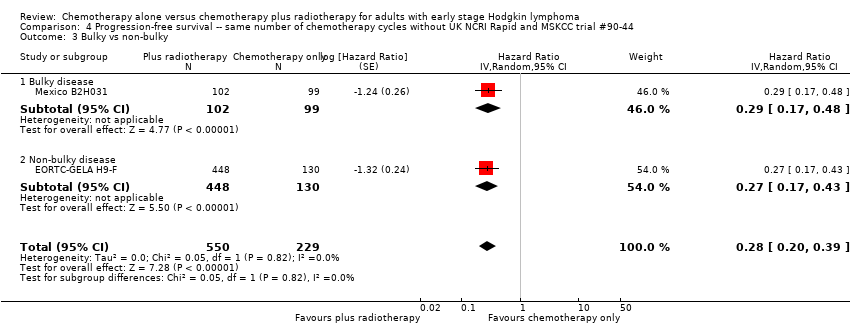
Comparison 4 Progression‐free survival ‐‐ same number of chemotherapy cycles without UK NCRI Rapid and MSKCC trial #90‐44, Outcome 3 Bulky vs non‐bulky.
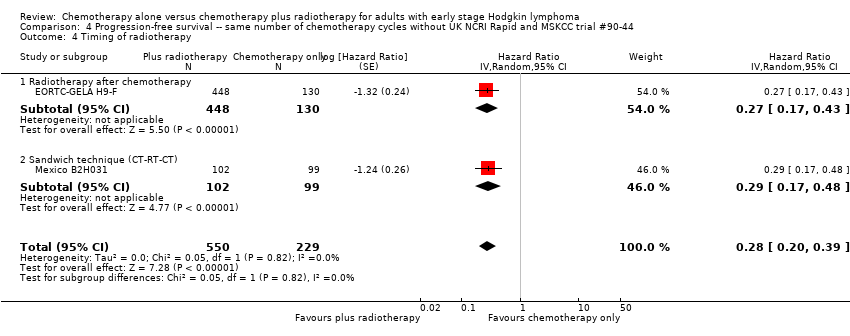
Comparison 4 Progression‐free survival ‐‐ same number of chemotherapy cycles without UK NCRI Rapid and MSKCC trial #90‐44, Outcome 4 Timing of radiotherapy.

Comparison 4 Progression‐free survival ‐‐ same number of chemotherapy cycles without UK NCRI Rapid and MSKCC trial #90‐44, Outcome 5 Type of radiotherapy.

Comparison 4 Progression‐free survival ‐‐ same number of chemotherapy cycles without UK NCRI Rapid and MSKCC trial #90‐44, Outcome 6 Type of chemotherapy.
Comparison 5 Complete response rate ‐‐ same number of chemotherapy cycles, Outcome 1 All trials.

Comparison 5 Complete response rate ‐‐ same number of chemotherapy cycles, Outcome 2 Proportion of patients early favourable.

Comparison 5 Complete response rate ‐‐ same number of chemotherapy cycles, Outcome 3 Bulky vs non‐bulky.

Comparison 5 Complete response rate ‐‐ same number of chemotherapy cycles, Outcome 4 Timing of radiotherapy.

Comparison 5 Complete response rate ‐‐ same number of chemotherapy cycles, Outcome 5 Type of radiotherapy.
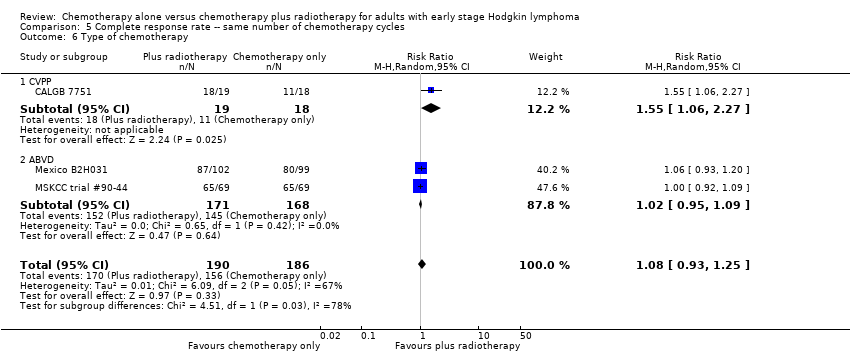
Comparison 5 Complete response rate ‐‐ same number of chemotherapy cycles, Outcome 6 Type of chemotherapy.
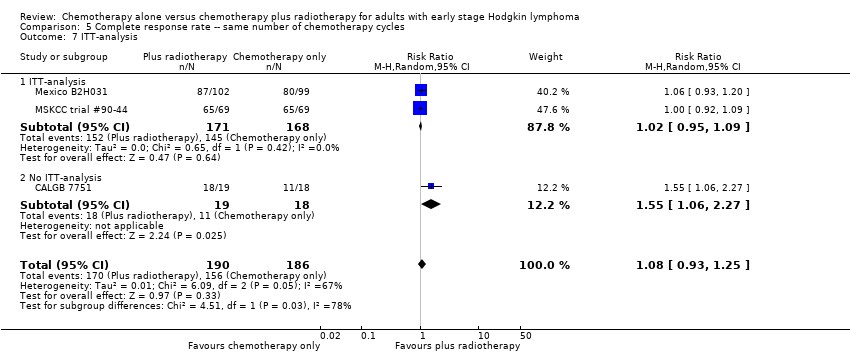
Comparison 5 Complete response rate ‐‐ same number of chemotherapy cycles, Outcome 7 ITT‐analysis.
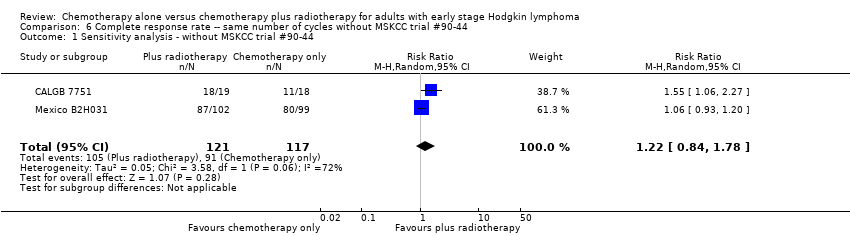
Comparison 6 Complete response rate ‐‐ same number of cycles without MSKCC trial #90‐44, Outcome 1 Sensitivity analysis ‐ without MSKCC trial #90‐44.

Comparison 6 Complete response rate ‐‐ same number of cycles without MSKCC trial #90‐44, Outcome 2 Bulky vs non‐bulky.

Comparison 6 Complete response rate ‐‐ same number of cycles without MSKCC trial #90‐44, Outcome 3 Timing of radiotherapy.

Comparison 6 Complete response rate ‐‐ same number of cycles without MSKCC trial #90‐44, Outcome 4 Type of radiotherapy.

Comparison 6 Complete response rate ‐‐ same number of cycles without MSKCC trial #90‐44, Outcome 5 Type of chemotherapy.
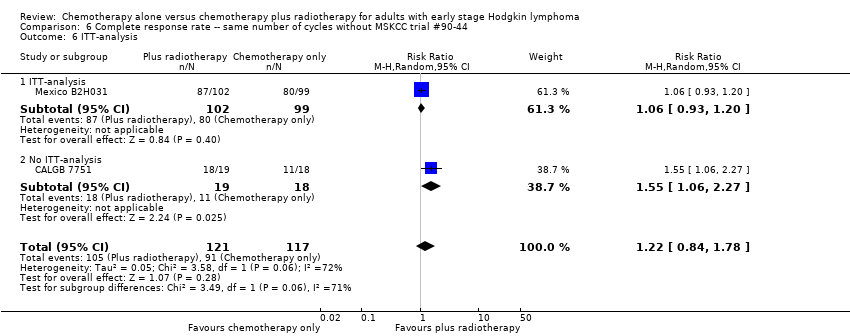
Comparison 6 Complete response rate ‐‐ same number of cycles without MSKCC trial #90‐44, Outcome 6 ITT‐analysis.

Comparison 7 Overall response rate ‐‐ same number of chemotherapy cycles, Outcome 1 All trials.

Comparison 7 Overall response rate ‐‐ same number of chemotherapy cycles, Outcome 2 Proportion of patients early favourable.
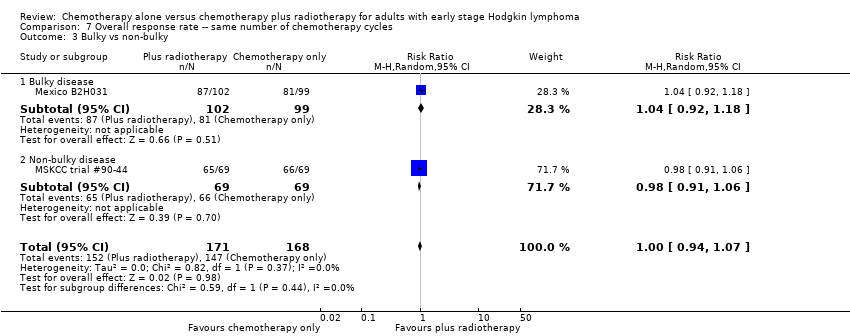
Comparison 7 Overall response rate ‐‐ same number of chemotherapy cycles, Outcome 3 Bulky vs non‐bulky.

Comparison 7 Overall response rate ‐‐ same number of chemotherapy cycles, Outcome 4 Timing of radiotherapy.

Comparison 7 Overall response rate ‐‐ same number of chemotherapy cycles, Outcome 5 Type of radiotherapy.

Comparison 8 Overall response rate ‐‐ same number of chemotherapy cycles without MSKCC trial #90‐44, Outcome 1 Sensitivity analysis ‐ without MSKCC trial #90‐44.
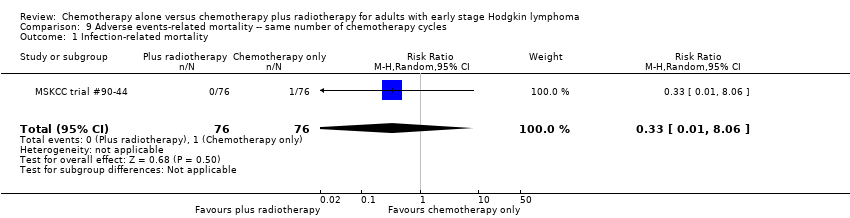
Comparison 9 Adverse events‐ related mortality ‐‐ same number of chemotherapy cycles, Outcome 1 Infection‐ related mortality.

Comparison 9 Adverse events‐ related mortality ‐‐ same number of chemotherapy cycles, Outcome 2 Second cancer‐ related mortality.

Comparison 9 Adverse events‐ related mortality ‐‐ same number of chemotherapy cycles, Outcome 3 Cardiac disease‐ related mortality.
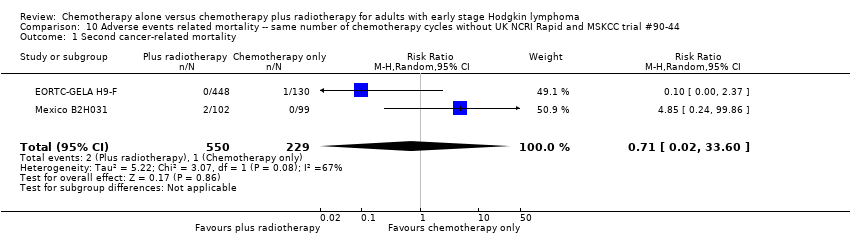
Comparison 10 Adverse events related mortality ‐‐ same number of chemotherapy cycles without UK NCRI Rapid and MSKCC trial #90‐44, Outcome 1 Second cancer‐ related mortality.

Comparison 10 Adverse events related mortality ‐‐ same number of chemotherapy cycles without UK NCRI Rapid and MSKCC trial #90‐44, Outcome 2 Cardiac disease‐ related mortality.

Comparison 11 Overall survival ‐ different numbers of chemotherapy cycles, Outcome 1 All trials.

Comparison 12 Progression‐free survival ‐‐ different numbers of chemotherapy cycles, Outcome 1 All trials.

Comparison 12 Progression‐free survival ‐‐ different numbers of chemotherapy cycles, Outcome 2 Proportion of patients early favourable.

Comparison 12 Progression‐free survival ‐‐ different numbers of chemotherapy cycles, Outcome 3 Bulky vs non‐bulky.
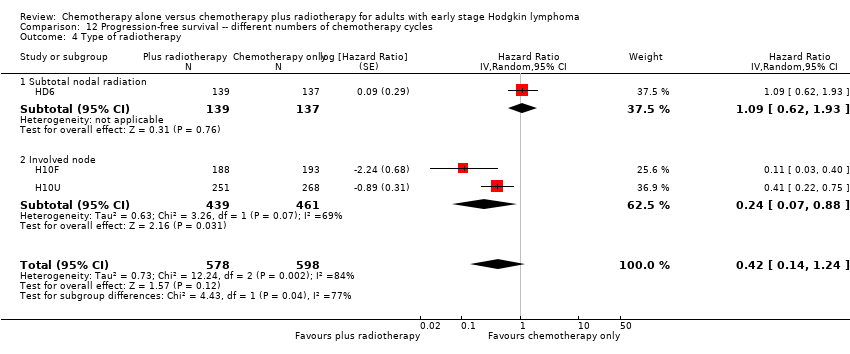
Comparison 12 Progression‐free survival ‐‐ different numbers of chemotherapy cycles, Outcome 4 Type of radiotherapy.
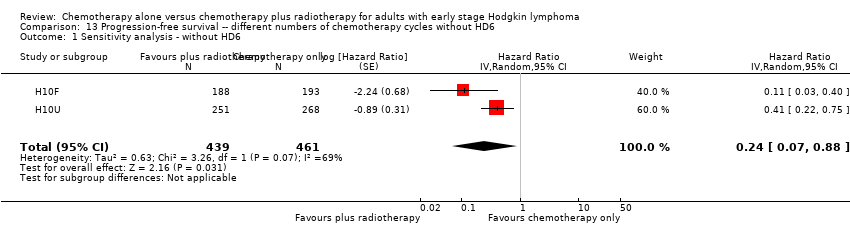
Comparison 13 Progression‐free survival ‐‐ different numbers of chemotherapy cycles without HD6, Outcome 1 Sensitivity analysis ‐ without HD6.
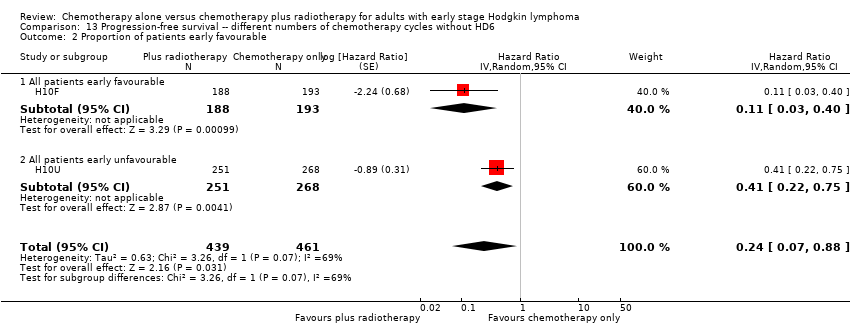
Comparison 13 Progression‐free survival ‐‐ different numbers of chemotherapy cycles without HD6, Outcome 2 Proportion of patients early favourable.

Comparison 13 Progression‐free survival ‐‐ different numbers of chemotherapy cycles without HD6, Outcome 3 Bulky vs non‐bulky.

Comparison 14 Adverse events related mortality ‐‐ different numbers of chemotherapy cycles, Outcome 1 Infection‐ related mortality.

Comparison 14 Adverse events related mortality ‐‐ different numbers of chemotherapy cycles, Outcome 2 Second cancer‐ related mortality.
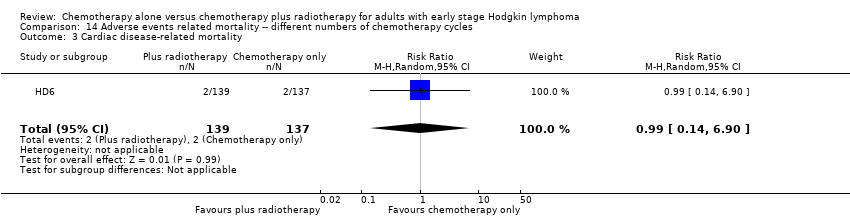
Comparison 14 Adverse events related mortality ‐‐ different numbers of chemotherapy cycles, Outcome 3 Cardiac disease‐ related mortality.
| Same number of chemotherapy cycles in both arms | ||||||
| Chemotherapy alone versus chemotherapy plus radiotherapy for adults with early stage Hodgkin lymphoma. | ||||||
| Outcomes | № of participants | Quality of the evidence | Relative effect | Anticipated absolute effects* (95% CI) | Comment | |
| Risk with chemotherapy only | Risk with chemotherapy plus radiotherapy | |||||
| Mortality (calculated instead of overall survival) Follow‐up : 5 years The low‐ mortality rate was taken from the EORTC‐GELA H9‐F trial, the high‐ mortality rate was taken from the Mexico B2H031trial | 1388 | ⊕⊕⊕⊝ | HR 0.48 | Low risk to die | ||
| 30 per 1000 | 15 per 1000 | Number of people who will die | ||||
| High risk to die | ||||||
| 150 per 1000 | 75 per 1000 | |||||
| Mortality sensitivity analysis (calculated instead of overall survival) ‐ without UK NCRI Rapid trial and MSKCC trial #90‐44due to high risk of other bias Follow‐up : 5 years The low‐ mortality rate was taken from the EORTC‐GELA H9‐F trial, the high‐ mortality rate was taken from the Mexico B2H031trial | 816 | ⊕⊕⊕⊝ | HR 0.31 | Low risk to die | ||
| 30 per 1000 | 9 per 1000 | Number of people who will die | ||||
| High risk to die | ||||||
| 150 per 1000 | 49 per 1000 | |||||
| Relapse, progression or death (calculated instead of PFS) Follow‐up : 5 years | 1351 | ⊕⊕⊕⊝ | HR 0.42 | Low risk of progress, relapse or death | ||
| 100 per 1000 | 43 per 1000 | Number of people who will have a progress, relapse or die | ||||
| High risk of progress, relapse or death | ||||||
| 300 per 1000 | 139 per 1000 | |||||
| Infection‐ related mortality | 152 | ⊕⊕⊝⊝ | RR 0.33 | Study population | ||
| 13 per 1000 | 4 per 1000 | |||||
| Second cancer‐ related mortality | 1199 | ⊕⊕⊝⊝ | RR 0.53 | Study population | ||
| 9 per 1,000 | 5 per 1000 | |||||
| Cardiac disease‐ related mortality | 457 | ⊕⊕⊝⊝ | RR 2.94 | Low risk | ||
| 1 per 1,000 | 3 per 1000 | |||||
| Complete response rate | 376 | ⊕⊕⊝⊝ | RR 1.08 | Study population | ||
| 839 per 1,000 | 906 per 1000 | |||||
| *The risk in the intervention group (and its 95% confidence interval) is based on the assumed risk in the comparison group and the relative effect of the intervention (and its 95% CI). | ||||||
| GRADE Working Group grades of evidence | ||||||
| 1 Substantial heterogeneity, downgraded by 1 point for inconsistency 2 Sensitivity analysis, excluding two trials with potential high risk of other bias. Downgraded by 1 point for imprecision due to low number of included patients and events 3 Definition of PFS varied across trials, downgraded by 1 point for inconsistency 4 Very small number of events, downgraded by 2 points for imprecision 5Statistical heterogeneity (I ² = 67%), downgraded by 1 point for inconsistency 6 Low number of events, downgraded by 1 point for imprecision | ||||||
| Different numbers of chemotherapy cycles in both arms | ||||||
| Chemotherapy alone versus chemotherapy plus radiotherapy for adults with early stage Hodgkin lymphoma | ||||||
| Outcomes | № of participants | Quality of the evidence | Relative effect | Anticipated absolute effects* (95% CI) | Comment | |
| Risk with chemotherapy only | Risk with chemotherapy plus radiotherapy | |||||
| Mortality (calculated instead of overall survival) Follow‐up : 5 years The low‐ mortality rate was taken from the EORTC‐GELA H9‐F trial, the high‐ mortality rate was taken from the Mexico B2H031trial | 276 | ⊕⊕⊝⊝ | HR 2.12 | Low risk to die | ||
| 30 per 1000 | 63 per 1000 | Number of people who will die | ||||
| High risk to die | ||||||
| 150 per 1000 | 291 per 1000 | |||||
| Relapse, progression or death (calculated instead of PFS) Follow‐up : 5 years | 1176 | ⊕⊕⊝⊝ | HR 0.42 | Low risk of progress, death | ||
| 100 per 1000 | 43 per 1000 | Number of people who will have a progress, relapse or die | ||||
| High risk of progress, death | ||||||
| 300 per 1000 | 139 per 1000 | |||||
| Relapse, progression or death (calculated instead of PFS) sensitivity analysis ‐ without HD6trial due to high risk of other bias Follow‐up : 5 years | 900 2 (RCTs) | ⊕⊕⊕⊝ | HR 0.24 | Low risk of progress, death | ||
| 100 per 1000 | 25 per 1000 (7 to 88) | Number of people who will have a progress, relapse or die | ||||
| High risk of progress, death | ||||||
| 300 per 1000 | 82 per 1000 (25 to 269) | |||||
| Infection‐ related mortality | 276 | ⊕⊕⊝⊝ | RR 6.90 | Low risk | ||
| 1 per 1000 | 7 per 1000 | |||||
| Second cancer‐ related mortality | 276 | ⊕⊕⊝⊝ | RR 2.22 | Study population | ||
| 29 per 1000 | 65 per 1000 | |||||
| Cardiac disease‐ related mortality | 276 | ⊕⊕⊝⊝ | RR 0.99 | Study population | ||
| 15 per 1000 | 14 per 1000 | |||||
| Complete response rate | not reported | |||||
| *The risk in the intervention group (and its 95% confidence interval) is based on the assumed risk in the comparison group and the relative effect of the intervention (and its 95% CI). | ||||||
| GRADE Working Group grades of evidence | ||||||
| 1 Very low number of events, downgraded by 2 points for imprecision 2 Serious heterogeneity (I² = 84%), downgraded by 2 points for inconsistency | ||||||
| Number of patients evaluated | 18: chemotherapy 19: chemotherapy plus radiotherapy | 193: chemotherapy 188: chemotherapy plus radiotherapy | 268: chemotherapy 251: chemotherapy plus radiotherapy | 137: chemotherapy 139: chemotherapy plus radiotherapy | 130: chemotherapy 448: chemotherapy plus radiotherapy | 99: chemotherapy 102: chemotherapy plus radiotherapy | 76: chemotherapy 76: chemotherapy plus radiotherapy | 211: chemotherapy 209: chemotherapy plus radiotherapy |
| Chemotherapy and radiotherapy | 6 cycles of CVPP +/‐ involved‐field radiotherapy (dosage unknown) | 4 cycles of ABVD vs 3 cycles of ABVD + 30 Gy (+6 Gy) involved node radiotherapy | 6 cycles of ABVD vs 4 cycles of ABVD + 30 Gy (+6 Gy) involved node radiotherapy | 4 cycles of ABVD or 2 cycles of ABVD + 35 Gy subtotal nodal radiotherapy | 6 cycles of EBVP +/‐ IF radiotherapy | 6 cycles of ABVD +/‐ EF‐radiotherapy | 6 cycles of ABVD +/‐ EF or IF radiotherapy | 3 cycles of ABVD +/‐ 30 Gy IF‐radiotherapy |
| Median duration of follow‐up | 1.8 years | 1.1 years | 1.1 years | 11.3 years | 4.3 years | 11.4 years | 5.6 years | 60 months |
| Trial | Definition of progression outcome. |
| Definition of disease‐free survival not reported (Note all patients are in CR at the time of randomisation). | |
| From the date of random assignment to date of progression—as relapse after previous complete remission or progression after reaching partial remission (>= 50% decrease and resolution of B symptoms and no new lesions) or progressive disease (50% increase from nadir of any previous partial remission lesions or appearance of new lesions) on computed tomography scan measurements during protocol treatment or death resulting from any cause, whichever occurred first. | |
| Measured as event‐free survival from the date of randomisation until the date of disease progression or death from any cause. | |
| Contradictory definitions. In the methods section: “Disease free survival was calculated for CR patients from the beginning of treatment until clinically or radiologically and biopsy proven relapse.” In the results section the percentage disease free were calculated based on the full population. | |
| Time from enrolment until any progression of disease. | |
| Time from the date of randomisation to first progression, relapse, or death, whichever occurred first. |
| Outcome or subgroup title | No. of studies | No. of participants | Statistical method | Effect size |
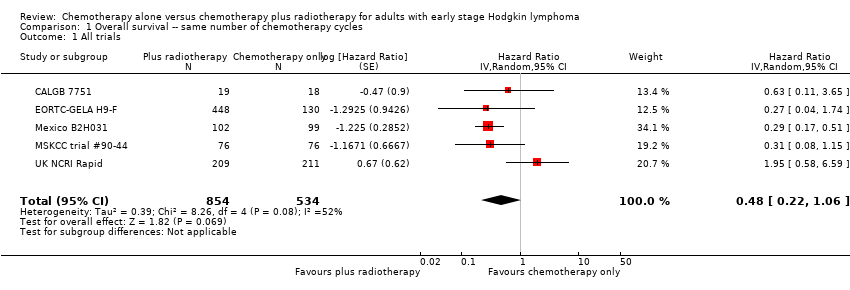
| 1 All trials Show forest plot | 5 | 1388 | Hazard Ratio (Random, 95% CI) | 0.48 [0.22, 1.06] |
| 2 Proportion of patients early favourable Show forest plot | 4 | 968 | Hazard Ratio (Random, 95% CI) | 0.31 [0.19, 0.50] |
| 2.1 All patients early favourable | 1 | 578 | Hazard Ratio (Random, 95% CI) | 0.27 [0.04, 1.74] |
| 2.2 Mixed patient population (˜ 30 to 50% patients early unfavourable) | 1 | 152 | Hazard Ratio (Random, 95% CI) | 0.31 [0.08, 1.15] |
| 2.3 All patients early unfavourable | 2 | 238 | Hazard Ratio (Random, 95% CI) | 0.31 [0.18, 0.54] |
| 3 Bulky vs non‐bulky Show forest plot | 4 | 1351 | Hazard Ratio (Random, 95% CI) | 0.47 [0.18, 1.19] |
| 3.1 Bulky disease | 1 | 201 | Hazard Ratio (Random, 95% CI) | 0.29 [0.17, 0.51] |
| 3.2 Non‐bulky disease | 3 | 1150 | Hazard Ratio (Random, 95% CI) | 0.60 [0.16, 2.27] |
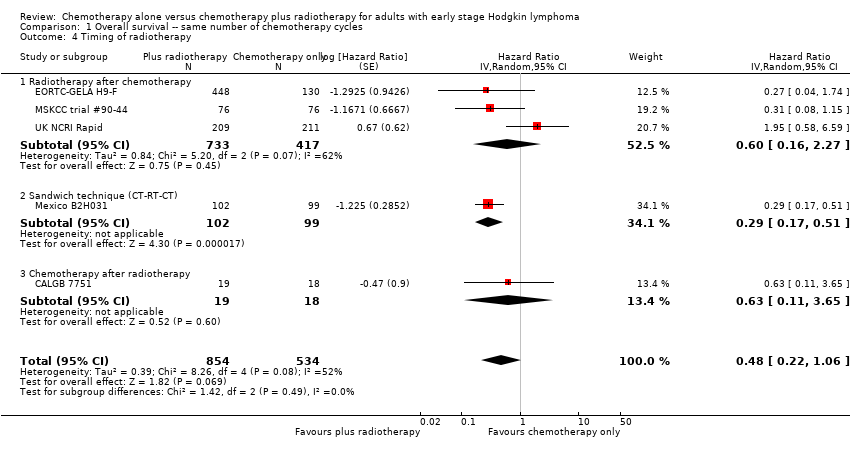
| 4 Timing of radiotherapy Show forest plot | 5 | 1388 | Hazard Ratio (Random, 95% CI) | 0.48 [0.22, 1.06] |
| 4.1 Radiotherapy after chemotherapy | 3 | 1150 | Hazard Ratio (Random, 95% CI) | 0.60 [0.16, 2.27] |
| 4.2 Sandwich technique (CT‐RT‐CT) | 1 | 201 | Hazard Ratio (Random, 95% CI) | 0.29 [0.17, 0.51] |
| 4.3 Chemotherapy after radiotherapy | 1 | 37 | Hazard Ratio (Random, 95% CI) | 0.63 [0.11, 3.65] |
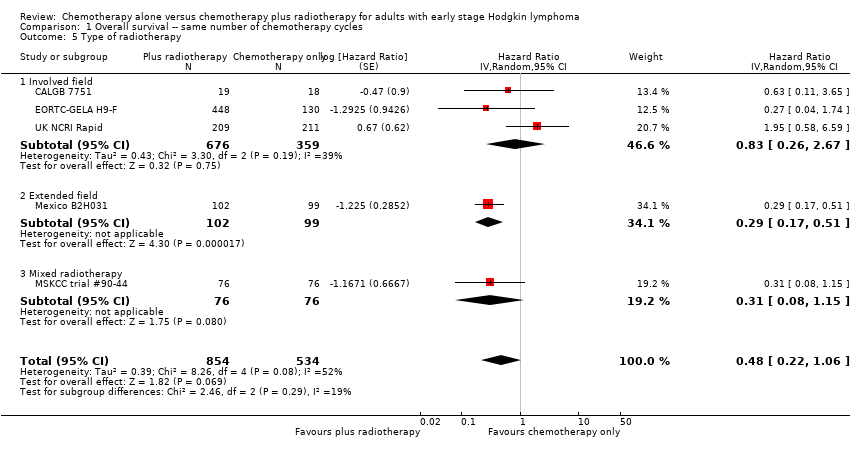
| 5 Type of radiotherapy Show forest plot | 5 | 1388 | Hazard Ratio (Random, 95% CI) | 0.48 [0.22, 1.06] |
| 5.1 Involved field | 3 | 1035 | Hazard Ratio (Random, 95% CI) | 0.83 [0.26, 2.67] |
| 5.2 Extended field | 1 | 201 | Hazard Ratio (Random, 95% CI) | 0.29 [0.17, 0.51] |
| 5.3 Mixed radiotherapy | 1 | 152 | Hazard Ratio (Random, 95% CI) | 0.31 [0.08, 1.15] |
| 6 Type of chemotherapy Show forest plot | 5 | 1388 | Hazard Ratio (Random, 95% CI) | 0.48 [0.22, 1.06] |
| 6.1 ABVD | 3 | 773 | Hazard Ratio (Random, 95% CI) | 0.53 [0.17, 1.68] |
| 6.2 CVPP | 1 | 37 | Hazard Ratio (Random, 95% CI) | 0.63 [0.11, 3.65] |
| 6.3 EBVP | 1 | 578 | Hazard Ratio (Random, 95% CI) | 0.27 [0.04, 1.73] |
| 7 ITT‐analysis Show forest plot | 5 | 1388 | Hazard Ratio (Random, 95% CI) | 0.48 [0.22, 1.06] |
| 7.1 ITT‐analysis | 4 | 1351 | Hazard Ratio (Random, 95% CI) | 0.47 [0.18, 1.19] |
| 7.2 No ITT‐analysis | 1 | 37 | Hazard Ratio (Random, 95% CI) | 0.63 [0.11, 3.65] |
| Outcome or subgroup title | No. of studies | No. of participants | Statistical method | Effect size |
| 1 Sensitivity analysis ‐ without UK NCRI RAPID and MSKCC trial #90‐44 Show forest plot | 3 | 816 | Hazard Ratio (Random, 95% CI) | 0.31 [0.19, 0.52] |
| 2 Proportion of patients early favourable Show forest plot | 3 | 816 | Hazard Ratio (Random, 95% CI) | 0.31 [0.19, 0.52] |
| 2.1 All patients early favourable | 1 | 578 | Hazard Ratio (Random, 95% CI) | 0.27 [0.04, 1.74] |
| 2.2 All patients early unfavourable | 2 | 238 | Hazard Ratio (Random, 95% CI) | 0.31 [0.18, 0.54] |
| 3 Bulky vs non‐bulky Show forest plot | 2 | 779 | Hazard Ratio (Random, 95% CI) | 0.29 [0.17, 0.50] |
| 3.1 Bulky disease | 1 | 201 | Hazard Ratio (Random, 95% CI) | 0.29 [0.17, 0.51] |
| 3.2 Non‐bulky disease | 1 | 578 | Hazard Ratio (Random, 95% CI) | 0.27 [0.04, 1.74] |
| 4 Timing of radiotherapy Show forest plot | 3 | 816 | Hazard Ratio (Random, 95% CI) | 0.31 [0.19, 0.52] |
| 4.1 Radiotherapy after chemotherapy | 1 | 578 | Hazard Ratio (Random, 95% CI) | 0.27 [0.04, 1.74] |
| 4.2 Sandwich technique (CT‐RT‐CT) | 1 | 201 | Hazard Ratio (Random, 95% CI) | 0.29 [0.17, 0.51] |
| 4.3 Chemotherapy after radiotherapy | 1 | 37 | Hazard Ratio (Random, 95% CI) | 0.63 [0.11, 3.65] |
| 5 Type of radiotherapy Show forest plot | 3 | 816 | Hazard Ratio (Random, 95% CI) | 0.31 [0.19, 0.52] |
| 5.1 Involved field | 2 | 615 | Hazard Ratio (Random, 95% CI) | 0.42 [0.12, 1.51] |
| 5.2 Extended field | 1 | 201 | Hazard Ratio (Random, 95% CI) | 0.29 [0.17, 0.51] |
| 6 Type of chemotherapy Show forest plot | 3 | 816 | Hazard Ratio (Random, 95% CI) | 0.31 [0.19, 0.52] |
| 6.1 ABVD | 1 | 201 | Hazard Ratio (Random, 95% CI) | 0.29 [0.17, 0.51] |
| 6.2 CVPP | 1 | 37 | Hazard Ratio (Random, 95% CI) | 0.63 [0.11, 3.65] |
| 6.3 EBVP | 1 | 578 | Hazard Ratio (Random, 95% CI) | 0.27 [0.04, 1.73] |
| 7 ITT‐analysis Show forest plot | 3 | 816 | Hazard Ratio (Random, 95% CI) | 0.31 [0.19, 0.52] |
| 7.1 ITT‐analysis | 2 | 779 | Hazard Ratio (Random, 95% CI) | 0.29 [0.17, 0.50] |
| 7.2 No ITT‐analysis | 1 | 37 | Hazard Ratio (Random, 95% CI) | 0.63 [0.11, 3.65] |
| Outcome or subgroup title | No. of studies | No. of participants | Statistical method | Effect size |
| 1 All trials Show forest plot | 4 | 1351 | Hazard Ratio (Random, 95% CI) | 0.42 [0.25, 0.72] |
| 2 Proportion of patients early favourable Show forest plot | 4 | 1351 | Hazard Ratio (Random, 95% CI) | 0.42 [0.25, 0.72] |
| 2.1 All patients early favourable | 1 | 578 | Hazard Ratio (Random, 95% CI) | 0.27 [0.17, 0.43] |
| 2.2 Mixed patient population (˜ 30 to 50% patients early unfavourable) | 2 | 572 | Hazard Ratio (Random, 95% CI) | 0.71 [0.43, 1.17] |
| 2.3 All patients early unfavourable | 1 | 201 | Hazard Ratio (Random, 95% CI) | 0.29 [0.17, 0.48] |
| 3 Bulky vs non‐bulky Show forest plot | 4 | 1351 | Hazard Ratio (Random, 95% CI) | 0.42 [0.25, 0.72] |
| 3.1 Bulky disease | 1 | 201 | Hazard Ratio (Random, 95% CI) | 0.29 [0.17, 0.48] |
| 3.2 Non‐bulky disease | 3 | 1150 | Hazard Ratio (Random, 95% CI) | 0.50 [0.24, 1.03] |
| 4 Timing of radiotherapy Show forest plot | 4 | 1351 | Hazard Ratio (Random, 95% CI) | 0.42 [0.25, 0.72] |
| 4.1 Radiotherapy after chemotherapy | 3 | 1150 | Hazard Ratio (Random, 95% CI) | 0.50 [0.24, 1.03] |
| 4.2 Sandwich technique (CT‐RT‐CT) | 1 | 201 | Hazard Ratio (Random, 95% CI) | 0.29 [0.17, 0.48] |
| 5 Type of radiotherapy Show forest plot | 4 | 1351 | Hazard Ratio (Random, 95% CI) | 0.42 [0.25, 0.72] |
| 5.1 Involved field | 2 | 998 | Hazard Ratio (Random, 95% CI) | 0.40 [0.17, 0.94] |
| 5.2 Extended field | 1 | 201 | Hazard Ratio (Random, 95% CI) | 0.29 [0.17, 0.48] |
| 5.3 Mixed radiotherapy | 1 | 152 | Hazard Ratio (Random, 95% CI) | 0.85 [0.37, 1.94] |
| 6 Type of chemotherapy Show forest plot | 4 | 1351 | Hazard Ratio (Random, 95% CI) | 0.42 [0.25, 0.72] |
| 6.1 ABVD | 3 | 773 | Hazard Ratio (Random, 95% CI) | 0.51 [0.26, 0.99] |
| 6.2 EBVP | 1 | 578 | Hazard Ratio (Random, 95% CI) | 0.27 [0.17, 0.43] |
| 7 Sensitivity analysis (per protocol results of the UK NCRI RAPID, without MSKCC trial #90‐44) Show forest plot | 3 | 1199 | Hazard Ratio (Random, 95% CI) | 0.30 [0.22, 0.41] |
| Outcome or subgroup title | No. of studies | No. of participants | Statistical method | Effect size |
| 1 Sensitivity analysis ‐ without UK NCRI RAPID and MSKCC trial #90‐44 Show forest plot | 2 | 779 | Hazard Ratio (Random, 95% CI) | 0.28 [0.20, 0.39] |
| 2 Proportion of patients early favourable Show forest plot | 2 | 779 | Hazard Ratio (Random, 95% CI) | 0.28 [0.20, 0.39] |
| 2.1 All patients early favourable | 1 | 578 | Hazard Ratio (Random, 95% CI) | 0.27 [0.17, 0.43] |
| 2.2 All patients early unfavourable | 1 | 201 | Hazard Ratio (Random, 95% CI) | 0.29 [0.17, 0.48] |
| 3 Bulky vs non‐bulky Show forest plot | 2 | 779 | Hazard Ratio (Random, 95% CI) | 0.28 [0.20, 0.39] |
| 3.1 Bulky disease | 1 | 201 | Hazard Ratio (Random, 95% CI) | 0.29 [0.17, 0.48] |
| 3.2 Non‐bulky disease | 1 | 578 | Hazard Ratio (Random, 95% CI) | 0.27 [0.17, 0.43] |
| 4 Timing of radiotherapy Show forest plot | 2 | 779 | Hazard Ratio (Random, 95% CI) | 0.28 [0.20, 0.39] |
| 4.1 Radiotherapy after chemotherapy | 1 | 578 | Hazard Ratio (Random, 95% CI) | 0.27 [0.17, 0.43] |
| 4.2 Sandwich technique (CT‐RT‐CT) | 1 | 201 | Hazard Ratio (Random, 95% CI) | 0.29 [0.17, 0.48] |
| 5 Type of radiotherapy Show forest plot | 2 | 779 | Hazard Ratio (Random, 95% CI) | 0.28 [0.20, 0.39] |
| 5.1 Involved field | 1 | 578 | Hazard Ratio (Random, 95% CI) | 0.27 [0.17, 0.43] |
| 5.2 Extended field | 1 | 201 | Hazard Ratio (Random, 95% CI) | 0.29 [0.17, 0.48] |
| 6 Type of chemotherapy Show forest plot | 2 | 779 | Hazard Ratio (Random, 95% CI) | 0.28 [0.20, 0.39] |
| 6.1 ABVD | 1 | 201 | Hazard Ratio (Random, 95% CI) | 0.29 [0.17, 0.48] |
| 6.2 EBVP | 1 | 578 | Hazard Ratio (Random, 95% CI) | 0.27 [0.17, 0.43] |
| Outcome or subgroup title | No. of studies | No. of participants | Statistical method | Effect size |
| 1 All trials Show forest plot | 3 | 376 | Risk Ratio (M‐H, Random, 95% CI) | 1.08 [0.93, 1.25] |
| 2 Proportion of patients early favourable Show forest plot | 3 | 376 | Risk Ratio (M‐H, Random, 95% CI) | 1.08 [0.93, 1.25] |
| 2.1 Mixed patient population (˜ 30 to 50% patients early unfavourable) | 1 | 138 | Risk Ratio (M‐H, Random, 95% CI) | 1.0 [0.92, 1.09] |
| 2.2 All patients early unfavourable | 2 | 238 | Risk Ratio (M‐H, Random, 95% CI) | 1.22 [0.84, 1.78] |
| 3 Bulky vs non‐bulky Show forest plot | 3 | 376 | Risk Ratio (M‐H, Random, 95% CI) | 1.08 [0.93, 1.25] |
| 3.1 Bulky disease | 1 | 201 | Risk Ratio (M‐H, Random, 95% CI) | 1.06 [0.93, 1.20] |
| 3.2 Non‐bulky disease | 2 | 175 | Risk Ratio (M‐H, Random, 95% CI) | 1.21 [0.73, 2.01] |
| 4 Timing of radiotherapy Show forest plot | 3 | 376 | Risk Ratio (M‐H, Random, 95% CI) | 1.08 [0.93, 1.25] |
| 4.1 Radiotherapy after chemotherapy | 1 | 138 | Risk Ratio (M‐H, Random, 95% CI) | 1.0 [0.92, 1.09] |
| 4.2 Sandwich technique (CT‐RT‐CT) | 1 | 201 | Risk Ratio (M‐H, Random, 95% CI) | 1.06 [0.93, 1.20] |
| 4.3 Chemotherapy after radiotherapy | 1 | 37 | Risk Ratio (M‐H, Random, 95% CI) | 1.55 [1.06, 2.27] |
| 5 Type of radiotherapy Show forest plot | 3 | 376 | Risk Ratio (M‐H, Random, 95% CI) | 1.08 [0.93, 1.25] |
| 5.1 Involved field | 1 | 37 | Risk Ratio (M‐H, Random, 95% CI) | 1.55 [1.06, 2.27] |
| 5.2 Extended field | 1 | 201 | Risk Ratio (M‐H, Random, 95% CI) | 1.06 [0.93, 1.20] |
| 5.3 Mixed | 1 | 138 | Risk Ratio (M‐H, Random, 95% CI) | 1.0 [0.92, 1.09] |
| 6 Type of chemotherapy Show forest plot | 3 | 376 | Risk Ratio (M‐H, Random, 95% CI) | 1.08 [0.93, 1.25] |
| 6.1 CVPP | 1 | 37 | Risk Ratio (M‐H, Random, 95% CI) | 1.55 [1.06, 2.27] |
| 6.2 ABVD | 2 | 339 | Risk Ratio (M‐H, Random, 95% CI) | 1.02 [0.95, 1.09] |
| 7 ITT‐analysis Show forest plot | 3 | 376 | Risk Ratio (M‐H, Random, 95% CI) | 1.08 [0.93, 1.25] |
| 7.1 ITT‐analysis | 2 | 339 | Risk Ratio (M‐H, Random, 95% CI) | 1.02 [0.95, 1.09] |
| 7.2 No ITT‐analysis | 1 | 37 | Risk Ratio (M‐H, Random, 95% CI) | 1.55 [1.06, 2.27] |
| Outcome or subgroup title | No. of studies | No. of participants | Statistical method | Effect size |
| 1 Sensitivity analysis ‐ without MSKCC trial #90‐44 Show forest plot | 2 | 238 | Risk Ratio (M‐H, Random, 95% CI) | 1.22 [0.84, 1.78] |
| 2 Bulky vs non‐bulky Show forest plot | 2 | 238 | Risk Ratio (M‐H, Random, 95% CI) | 1.22 [0.84, 1.78] |
| 2.1 Bulky disease | 1 | 201 | Risk Ratio (M‐H, Random, 95% CI) | 1.06 [0.93, 1.20] |
| 2.2 Non‐bulky disease | 1 | 37 | Risk Ratio (M‐H, Random, 95% CI) | 1.55 [1.06, 2.27] |
| 3 Timing of radiotherapy Show forest plot | 2 | 238 | Risk Ratio (M‐H, Random, 95% CI) | 1.22 [0.84, 1.78] |
| 3.1 Sandwich technique (CT‐RT‐CT) | 1 | 201 | Risk Ratio (M‐H, Random, 95% CI) | 1.06 [0.93, 1.20] |
| 3.2 Chemotherapy after radiotherapy | 1 | 37 | Risk Ratio (M‐H, Random, 95% CI) | 1.55 [1.06, 2.27] |
| 4 Type of radiotherapy Show forest plot | 2 | 238 | Risk Ratio (M‐H, Random, 95% CI) | 1.22 [0.84, 1.78] |
| 4.1 Involved field | 1 | 37 | Risk Ratio (M‐H, Random, 95% CI) | 1.55 [1.06, 2.27] |
| 4.2 Extended field | 1 | 201 | Risk Ratio (M‐H, Random, 95% CI) | 1.06 [0.93, 1.20] |
| 5 Type of chemotherapy Show forest plot | 2 | 238 | Risk Ratio (M‐H, Random, 95% CI) | 1.22 [0.84, 1.78] |
| 5.1 CVPP | 1 | 37 | Risk Ratio (M‐H, Random, 95% CI) | 1.55 [1.06, 2.27] |
| 5.2 ABVD | 1 | 201 | Risk Ratio (M‐H, Random, 95% CI) | 1.06 [0.93, 1.20] |
| 6 ITT‐analysis Show forest plot | 2 | 238 | Risk Ratio (M‐H, Random, 95% CI) | 1.22 [0.84, 1.78] |
| 6.1 ITT‐analysis | 1 | 201 | Risk Ratio (M‐H, Random, 95% CI) | 1.06 [0.93, 1.20] |
| 6.2 No ITT‐analysis | 1 | 37 | Risk Ratio (M‐H, Random, 95% CI) | 1.55 [1.06, 2.27] |
| Outcome or subgroup title | No. of studies | No. of participants | Statistical method | Effect size |
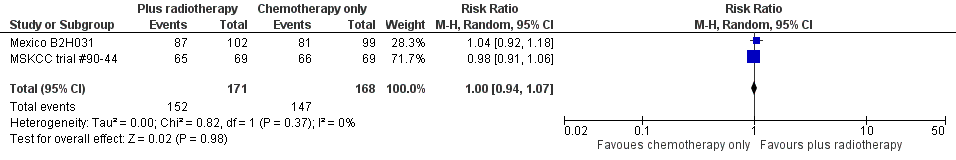
| 1 All trials Show forest plot | 2 | 339 | Risk Ratio (M‐H, Random, 95% CI) | 1.00 [0.94, 1.07] |
| 2 Proportion of patients early favourable Show forest plot | 2 | 339 | Risk Ratio (M‐H, Random, 95% CI) | 1.00 [0.94, 1.07] |
| 2.1 All patients early favourable | 1 | 138 | Risk Ratio (M‐H, Random, 95% CI) | 0.98 [0.91, 1.06] |
| 2.2 Mixed patient population (˜ 30 to 50% patients early unfavourable) | 1 | 201 | Risk Ratio (M‐H, Random, 95% CI) | 1.04 [0.92, 1.18] |
| 3 Bulky vs non‐bulky Show forest plot | 2 | 339 | Risk Ratio (M‐H, Random, 95% CI) | 1.00 [0.94, 1.07] |
| 3.1 Bulky disease | 1 | 201 | Risk Ratio (M‐H, Random, 95% CI) | 1.04 [0.92, 1.18] |
| 3.2 Non‐bulky disease | 1 | 138 | Risk Ratio (M‐H, Random, 95% CI) | 0.98 [0.91, 1.06] |
| 4 Timing of radiotherapy Show forest plot | 2 | 339 | Risk Ratio (M‐H, Random, 95% CI) | 1.00 [0.94, 1.07] |
| 4.1 Radiotherapy after chemotherapy | 1 | 138 | Risk Ratio (M‐H, Random, 95% CI) | 0.98 [0.91, 1.06] |
| 4.2 Sandwich technique (CT‐RT‐CT) | 1 | 201 | Risk Ratio (M‐H, Random, 95% CI) | 1.04 [0.92, 1.18] |
| 5 Type of radiotherapy Show forest plot | 2 | 339 | Risk Ratio (M‐H, Random, 95% CI) | 1.00 [0.94, 1.07] |
| 5.1 Extended field | 1 | 201 | Risk Ratio (M‐H, Random, 95% CI) | 1.04 [0.92, 1.18] |
| 5.2 Mixed | 1 | 138 | Risk Ratio (M‐H, Random, 95% CI) | 0.98 [0.91, 1.06] |
| Outcome or subgroup title | No. of studies | No. of participants | Statistical method | Effect size |
| 1 Sensitivity analysis ‐ without MSKCC trial #90‐44 Show forest plot | 1 | 201 | Risk Ratio (M‐H, Random, 95% CI) | 1.04 [0.92, 1.18] |
| Outcome or subgroup title | No. of studies | No. of participants | Statistical method | Effect size |
| 1 Infection‐ related mortality Show forest plot | 1 | 152 | Risk Ratio (M‐H, Random, 95% CI) | 0.33 [0.01, 8.06] |
| 2 Second cancer‐ related mortality Show forest plot | 3 | 1199 | Risk Ratio (M‐H, Random, 95% CI) | 0.53 [0.07, 4.29] |
| 3 Cardiac disease‐ related mortality Show forest plot | 2 | 457 | Risk Ratio (M‐H, Random, 95% CI) | 2.94 [0.31, 27.55] |
| Outcome or subgroup title | No. of studies | No. of participants | Statistical method | Effect size |
| 1 Second cancer‐ related mortality Show forest plot | 2 | 779 | Risk Ratio (M‐H, Random, 95% CI) | 0.71 [0.02, 33.60] |
| 2 Cardiac disease‐ related mortality Show forest plot | 1 | 37 | Risk Ratio (M‐H, Random, 95% CI) | 2.85 [0.12, 65.74] |
| Outcome or subgroup title | No. of studies | No. of participants | Statistical method | Effect size |
| 1 All trials Show forest plot | 1 | 276 | Hazard Ratio (Random, 95% CI) | 2.12 [1.03, 4.37] |
| Outcome or subgroup title | No. of studies | No. of participants | Statistical method | Effect size |
| 1 All trials Show forest plot | 3 | 1176 | Hazard Ratio (Random, 95% CI) | 0.42 [0.14, 1.24] |
| 2 Proportion of patients early favourable Show forest plot | 3 | 1176 | Hazard Ratio (Random, 95% CI) | 0.42 [0.14, 1.24] |
| 2.1 All patients early favourable | 1 | 381 | Hazard Ratio (Random, 95% CI) | 0.11 [0.03, 0.40] |
| 2.2 All patients early unfavourable | 2 | 795 | Hazard Ratio (Random, 95% CI) | 0.67 [0.26, 1.76] |
| 3 Bulky vs non‐bulky Show forest plot | 3 | 1176 | Hazard Ratio (Random, 95% CI) | 0.42 [0.14, 1.24] |
| 3.1 Bulky disease | 1 | 519 | Hazard Ratio (Random, 95% CI) | 0.41 [0.22, 0.75] |
| 3.2 Non‐bulky disease | 2 | 657 | Hazard Ratio (Random, 95% CI) | 0.37 [0.04, 3.61] |
| 4 Type of radiotherapy Show forest plot | 3 | 1176 | Hazard Ratio (Random, 95% CI) | 0.42 [0.14, 1.24] |
| 4.1 Subtotal nodal radiation | 1 | 276 | Hazard Ratio (Random, 95% CI) | 1.09 [0.62, 1.93] |
| 4.2 Involved node | 2 | 900 | Hazard Ratio (Random, 95% CI) | 0.24 [0.07, 0.88] |
| Outcome or subgroup title | No. of studies | No. of participants | Statistical method | Effect size |
| 1 Sensitivity analysis ‐ without HD6 Show forest plot | 2 | 900 | Hazard Ratio (Random, 95% CI) | 0.24 [0.07, 0.88] |
| 2 Proportion of patients early favourable Show forest plot | 2 | 900 | Hazard Ratio (Random, 95% CI) | 0.24 [0.07, 0.88] |
| 2.1 All patients early favourable | 1 | 381 | Hazard Ratio (Random, 95% CI) | 0.11 [0.03, 0.40] |
| 2.2 All patients early unfavourable | 1 | 519 | Hazard Ratio (Random, 95% CI) | 0.41 [0.22, 0.75] |
| 3 Bulky vs non‐bulky Show forest plot | 2 | 900 | Hazard Ratio (Random, 95% CI) | 0.24 [0.07, 0.88] |
| 3.1 Bulky disease | 1 | 519 | Hazard Ratio (Random, 95% CI) | 0.41 [0.22, 0.75] |
| 3.2 Non‐bulky disease | 1 | 381 | Hazard Ratio (Random, 95% CI) | 0.11 [0.03, 0.40] |
| Outcome or subgroup title | No. of studies | No. of participants | Statistical method | Effect size |
| 1 Infection‐ related mortality Show forest plot | 1 | 276 | Risk Ratio (M‐H, Random, 95% CI) | 6.9 [0.36, 132.34] |
| 2 Second cancer‐ related mortality Show forest plot | 1 | 276 | Risk Ratio (M‐H, Random, 95% CI) | 2.22 [0.70, 7.03] |
| 3 Cardiac disease‐ related mortality Show forest plot | 1 | 276 | Risk Ratio (M‐H, Random, 95% CI) | 0.99 [0.14, 6.90] |