Tratamiento habitual con formoterol para el asma crónica: eventos adversos graves
Appendices
Appendix 1. Pharmacology of beta2‐agonists
Beta2‐agonists are thought to cause bronchodilation primarily through binding beta2‐adrenoceptors on airways smooth muscle (ASM), with subsequent activation of both membrane‐bound potassium channels and a signalling cascade involving enzyme activation and changes in intracellular calcium levels following a rise in cyclic adenosine monophosphate (cAMP) (Barnes 1993). However, beta2‐adrenoceptors are also expressed on a wide range of cell types where beta2‐agonists may have a clinically significant effect including airway epithelium (Morrison 1993), mast cells, post capillary venules, sensory and cholinergic nerves and dendritic cells (Anderson 2006). Beta2‐agonists will also cross‐react to some extent with other beta‐adrenoceptors including beta1‐adrenoceptors on the heart.
The in vivo effect of any beta2‐agonist will depend on a number of factors relating to both the drug and the patient. The degree to which a drug binds to one receptor over another is known as selectivity, which can be defined as absolute binding ratios to different receptors in vitro, whilst functional selectivity is measured from downstream effects of drugs in different tissue types in vitro or in vivo. All of the beta2‐agonists described thus far are more beta2 selective than their predecessor isoprenaline in vitro. However, because attempts to differentiate selectivity between the newer agents are confounded by so many factors, it is difficult to draw conclusions about in vitro selectivity studies and probably best to concentrate on specific adverse side effects in human subjects at doses which cause the same degree of bronchodilatation. The potency of a drug refers to the concentration that achieves half the maximal receptor activation of which that drug is capable but it is not very important clinically as for each drug, manufacturers will alter the dose to try to achieve a therapeutic ratio of desired to undesired effects. In contrast efficacy refers to the ability of a drug to activate its receptor independent of drug concentration. Drugs that fully activate a receptor are known as full agonists and those that partially activate a receptor are known as partial agonists. Efficacy also is very much dependent on the system in which it is being tested and is affected by factors including the number of receptors available and the presence of other agonists and antagonists. Thus whilst salmeterol acts as a partial agonist in vitro it causes a similar degree of bronchodilation to the strong agonist formoterol in stable asthmatic patients (Van Noord 1996), presumably because there are an abundance of well‐coupled beta2‐adrenoceptors available with few downstream antagonising signals. In contrast, with repetitive dosing formoterol is significantly better than salmeterol at preventing methacholine‐induced bronchoconstriction (Palmqvist 1999). These differences have led to attempts to define the 'intrinsic efficacy' of a drug independent of tissue conditions (Hanania 2002), as shown in Table 3. The clinical significance of intrinsic efficacy remains unclear.
| Drug | Intrinsic efficacy (%) |
| Isoprenaline, adrenaline | 100 |
| Fenoterol | 42 |
| Formoterol | 20 |
| Salbutamol | 4.9 |
| Salmeterol | < 2 |
Adapted from Hanania 2002. The authors acknowledge that it is difficult to determine the intrinsic efficacy of salmeterol given its high lipophilicity.
Appendix 2. Possible mechanisms of increased asthma mortality with beta‐agonists
Direct toxicity
This hypothesis states that direct adverse effects of beta2‐agonists are responsible for an associated increase in mortality and most research in the area has concentrated on effects detrimental to the heart. Whilst it is often assumed that cardiac side effects of beta2‐agonists are due to cross‐reactivity with beta1‐adrenoceptors (i.e. poor selectivity), it is worth noting that human myocardium also contains an abundance of beta2‐adrenoceptors capable of triggering positive chronotropic and inotropic responses (Lipworth 1992). Indeed, there is good evidence that cardiovascular side effects of isoprenaline (Arnold 1985) and other beta2‐agonists including salbutamol (Hall 1989) are mediated predominantly via cardiac beta2‐adrenoceptors thus making the concept of in vitro selectivity less relevant. Generalised beta2‐adrenoceptor activation can also cause hypokalaemia (Brown 1983) and it has been proposed that, through these and other actions, beta2‐agonists may predispose to life‐threatening dysrhythmias or cause other adverse cardiac effects.
During the 1960s epidemic most deaths occurred in patients with severe asthma and it was originally assumed that asthma and its sequelae, including hypoxia, were the primary cause of death. However, mucus plugging and hypoxia does not preclude a cardiac event as the final cause of death, and one might expect those with severe asthma to take more doses of a prescribed inhaler. As noted by Speizer and Doll most deaths in the 1960s were in the 10 to 19 age group and “at these ages children have begun to act independently and may be particularly prone to misuse a self‐administered form of treatment” (Speizer 1968). If toxicity were related to increasing doses of beta2‐agonists one might expect most deaths to occur in hospital where high doses are typically used and this was not the case. One possible explanation for this anomaly was provided by animal experiments in which large doses of isoprenaline caused little ill effect in anaesthetised dogs with normal arterial oxygenation whereas much smaller doses caused fatal cardiac depression and asystole (although no obvious dysrhythmia) when hypoxic (Collins 1969; McDevitt 1974). It has been hypothesised therefore that such events would be less likely in hospital where supplemental oxygen is routinely given. The clinical relevance of these studies remains unclear although there is some evidence of a synergistic effect between hypoxia and salbutamol use in asthmatic patients in reducing total peripheral vascular resistance (Burggraaf 2001) – another beta2‐mediated effect which could be detrimental to the heart during an acute asthma attack through a reduction in diastolic blood pressure. Other potential mechanisms of isoprenaline toxicity include a potential increase in mucous plugging and worsening of ventilation perfusion mismatch despite bronchodilation (Pearce 1990).
Further concerns about a possible toxic effect of beta2‐agonists were raised during the New Zealand epidemic in the 1970s. In 1981 Wilson et al, who first reported the epidemic, reviewed 22 fatal cases of asthma and noted “In 16 patients death was seen to be sudden and unexpected. Although all were experiencing respiratory distress, most were not cyanosed and the precipitate nature of their death suggested a cardiac event, such as an arrest, inappropriate to the severity of their respiratory problem” (Wilson 1981). In humans, fenoterol causes significantly greater chronotropic, inotropic and electrocardiographic side effects than salbutamol in asthmatic patients (Wong 1990). Interestingly, across the same parameters fenoterol also causes more side effects than isoprenaline (Burgess 1991).
In patients with mild asthma and without a bronchoconstrictor challenge, salmeterol and salbutamol cause a similar degree of near maximal bronchodilation at low doses (Bennett 1994). However, whilst as a one‐off dose salbutamol is typically used at two to four times the concentration of salmeterol, the dose equivalences for salmeterol versus salbutamol in increasing heart rate and decreasing potassium concentration and diastolic blood pressure were 17.7, 7.8 and 7.6 respectively (i.e. salmeterol had a greater effect across all parameters). Given the lower intrinsic efficacy of salmeterol (Table 1), these results highlight the importance of in vivo factors; one possible explanation for the difference is the increased lipophilicity of salmeterol compared to salbutamol contributing to higher systemic absorption (Bennett 1994).
When comparing increasing actuations of standard doses of formoterol and salmeterol inhalers in stable asthmatic patients, relatively similar cardiovascular effects are seen at lower doses (Guhan 2000). However, at the highest doses (above those recommended by the manufacturers) there were trends towards an increase in systolic blood pressure with formoterol; in comparison there was a trend towards a decrease in diastolic blood pressure and an increase in QTc interval with salmeterol although no statistical analysis of the difference was performed. In contrast in asthmatic patients with methacholine‐induced bronchoconstriction there was no significant difference between salmeterol and formoterol in causing increased heart rate and QTc interval although formoterol caused significantly greater bronchodilation and hypokalaemia (Palmqvist 1999). Whilst there is good evidence of cardiovascular and metabolic side effects with increasing doses of beta2‐agonists, it is a little difficult to envisage serious adverse effects of this nature when using LABAs at manufacturer‐recommended preventative doses. However, it is possible that some patients choose to use repeated doses of LABAs during exacerbations.
Tolerance
In this setting, the term tolerance refers to an impaired response to beta2‐agonists in patients who have been using regular beta2‐agonist treatment previously (Haney 2006). Tolerance is likely to result from a combination of reduced receptor numbers secondary to receptor internalisation and reduced production and also uncoupling of receptors to downstream signalling pathways following repeated activation (Barnes 1995). This phenomenon is likely to explain the beneficial reduction in systemic side effects seen with regular use of beta2‐agonists including salbutamol after one to two weeks (Lipworth 1989). However, the same effect on beta2‐adrenoceptors in the lung might be expected to produce a diminished response to the bronchodilating activity of beta2‐agonists following regular use. In patients with stable asthma, whilst there is some evidence of tolerance to both salbutamol (Nelson 1977) and terbutaline (Weber 1982) other studies have been less conclusive (Harvey 1982; Lipworth 1989). However, evidence of tolerance to short and long‐acting beta2‐agonists in both protecting against and reducing bronchoconstriction is much stronger in the setting of an acute bronchoconstrictor challenge with chemical, allergen and 'natural' stimuli (Haney 2006; Lipworth 1997).
Studies comparing salmeterol and formoterol have shown that both cause tolerance compared to placebo but there was no significant difference between the drugs (van der Woude 2001). There also appears to be little difference in the tolerance induced by regular formoterol and regular salbutamol treatment (Hancox 1999; Jones 2001). To the authors' knowledge no studies have looked specifically at the degree of tolerance caused by isoprenaline and fenoterol in the setting of acute bronchoconstriction. Tolerance to bronchodilation has been shown to clearly occur with addition of inhaled corticosteroids to salmeterol and formoterol (Lee 2003) and terbutaline (Yates 1996). There is conflicting evidence as to whether high‐dose steroids can reverse tolerance in the acute setting (Jones 2001; Lipworth 2000).
At first glance the toxicity and tolerance hypotheses might appear incompatible as systemic and cardiovascular tolerance ought to protect against toxicity in the acute setting and there is good evidence that such tolerance occurs in stable asthmatic patients (Lipworth 1989). However, whilst this study showed that changes in heart rate and potassium levels were blunted by previous beta2‐agonist use, they were not abolished; furthermore, at the doses studied these side effects appear to follow an exponential pattern (Lipworth 1989). In contrast, in the presence of bronchoconstrictor stimuli the bronchodilator response to beta2‐agonists follows a flatter curve (Hancox 1999; Wong 1990) and as previously discussed this curve is shifted downwards by previous beta2‐agonist exposure (Hancox 1999). Thus, it is theoretically possible that in the setting of an acute asthmatic attack and strong bronchoconstricting stimuli, bronchodilator tolerance could lead to repetitive beta2‐agonist use and ultimately more systemic side effects than would otherwise have occurred. Of course, other sequelae of inadequate bronchodilation including airway obstruction will be detrimental in this setting.
Whilst the tolerance hypothesis is often cited as contributing towards the asthma mortality epidemics it is difficult to argue that reduced efficacy of a drug can cause increased mortality relative to a time when that drug was not used at all. However, tolerance to the bronchodilating effect of endogenous circulating adrenaline is theoretically possible and there is also evidence of rebound bronchoconstriction when stopping fenoterol (Sears 1990), which may be detrimental. Furthermore, it appears that regular salbutamol treatment can actually increase airway responsiveness to allergen (Cockcroft 1993) a potentially important effect that could form a variant of the toxicity hypothesis. Differences between beta2‐agonists in this regard are unclear, but the combination of rebound hyper responsiveness and tolerance of the bronchodilator effect with regular beta2‐agonist exposure has been recently advocated as a possible mechanism to explain the association between beta2‐agonists and asthma mortality (Hancox 2006).
Other explanations
Confounding by severity
Historically, this hypothesis has been used extensively to try to explain the association between mortality and the use of fenoterol during the 1970s New Zealand epidemic (see Pearce 2007) and is still quoted today. The hypothesis essentially relies on the supposition that patients with more severe asthma are more likely to take either higher doses of beta2‐agonists or a particular beta2‐agonist (such as fenoterol) thereby explaining the association. This hypothesis was carefully ruled out in the three case‐control studies by comparing the association between fenoterol and mortality in patients with varying severity of disease (Crane 1989; Grainger 1991; Pearce 1990). Furthermore, the hypothesis cannot explain the overall increase in mortality in the 1960s and 1970s nor can it explain any significant increase in mortality (whether taking inhaled steroids or not) from randomised controlled trial data.
The delay hypothesis
This hypothesis accepts that beta2‐agonists or a particular beta2‐agonist cause an increased risk of mortality but indirectly by causing patients to delay before getting medical help and further treatments including high dose steroids and oxygen. There is evidence that both salmeterol and formoterol can reduce awareness of worsening underlying inflammation (Bijl‐Hofland 2001; McIvor 1998). It is difficult to rule out the delay hypothesis in either explaining or contributing towards both the asthma mortality epidemics and an association with regular use of LABAs. There is evidence that beta2‐agonists with higher intrinsic efficacy are more effective at relieving bronchoconstriction in the acute setting (Hanania 2007) and could paradoxically cause patients to delay seeking medical help for longer. For the delay hypothesis to explain the increase in mortality during the 1960s and 1970s one has to imply that hospital treatment of asthma when mortality rates were low during the earlier years of the 20th century was effective. It is difficult to say exactly how effective such treatment is likely to have been.
Reduced corticosteroid treatment
A slight but significant variation of the delay hypothesis suggests that patients who have separate beta2‐agonists and corticosteroid inhalers may choose to take less corticosteroid because of better symptom control from the inhaled beta2‐agonists and it is reduced corticosteroid treatment that contributes to a rise in mortality. It is rather difficult to see how this hypothesis explains the epidemics of asthma deaths in the 1960s and 1970s relative to the 1920s and 30s (Figure 1), given that corticosteroids were not used for the treatment of asthma in the earlier decades. If this hypothesis were to explain increased mortality from more recent randomised controlled trial data one would not expect to see an increase in mortality in those taking LABAs alone.
Appendix 3. Sources and search methods for the Cochrane Airways Group Specialised Register (CAGR)
Electronic searches: core databases
| Database | Frequency of search |
| MEDLINE (Ovid) | Weekly |
| EMBASE (Ovid) | Weekly |
| CENTRAL (T he Cochrane Library) | Quarterly |
| PSYCINFO (Ovid) | Monthly |
| CINAHL (EBSCO) | Monthly |
| AMED (EBSCO) | Monthly |
Handsearches: core respiratory conference abstracts
| Conference | Years searched |
| American Academy of Allergy, Asthma and Immunology (AAAAI) | 2001 onwards |
| American Thoracic Society (ATS) | 2001 onwards |
| Asia Pacific Society of Respirology (APSR) | 2004 onwards |
| British Thoracic Society Winter Meeting (BTS) | 2000 onwards |
| Chest Meeting | 2003 onwards |
| European Respiratory Society (ERS) | 1992, 1994, 2000 onwards |
| International Primary Care Respiratory Group Congress (IPCRG) | 2002 onwards |
| Thoracic Society of Australia and New Zealand (TSANZ) | 1999 onwards |
MEDLINE search strategy used to identify trials for the CAGR
Asthma search
1. exp Asthma/
2. asthma$.mp.
3. (antiasthma$ or anti‐asthma$).mp.
4. Respiratory Sounds/
5. wheez$.mp.
6. Bronchial Spasm/
7. bronchospas$.mp.
8. (bronch$ adj3 spasm$).mp.
9. bronchoconstrict$.mp.
10. exp Bronchoconstriction/
11. (bronch$ adj3 constrict$).mp.
12. Bronchial Hyperreactivity/
13. Respiratory Hypersensitivity/
14. ((bronchial$ or respiratory or airway$ or lung$) adj3 (hypersensitiv$ or hyperreactiv$ or allerg$ or insufficiency)).mp.
15. ((dust or mite$) adj3 (allerg$ or hypersensitiv$)).mp.
16. or/1‐15
Filter to identify RCTs
1. exp "clinical trial [publication type]"/
2. (randomised or randomised).ab,ti.
3. placebo.ab,ti.
4. dt.fs.
5. randomly.ab,ti.
6. trial.ab,ti.
7. groups.ab,ti.
8. or/1‐7
9. Animals/
10. Humans/
11. 9 not (9 and 10)
12. 8 not 11
The MEDLINE strategy and RCT filter are adapted to identify trials in other electronic databases
Appendix 4. Definition of serious adverse events
The Expert Working Group (Efficacy) of the International Conference on Harmonisation of Technical Requirements for Registration of Pharmaceuticals for Human Use (ICH) define serious adverse events as follows (ICHE2a 1995):
"A serious adverse event (experience) or reaction is any untoward medical occurrence that at any dose:
-
Results in death,
-
Is life‐threatening,
-
Requires inpatient hospitalisation or prolongation of existing hospitalisation,
-
Results in persistent or significant disability/incapacity, or
-
Is a congenital anomaly/birth defect.
NOTE: The term "life‐threatening" in the definition of "serious" refers to an event in which the patient was at risk of death at the time of the event; it does not refer to an event which hypothetically might have caused death if it were more severe."

Changes in asthma mortality (5 to 34 age group) in three countries in relation to the introduction of isoprenaline forte in the UK and New Zealand and of fenoterol in New Zealand. (From Blauw 1995. With permission from the Lancet).

Inhaled fenoterol market share and annual asthma mortality in New Zealand in persons aged 5 to 34
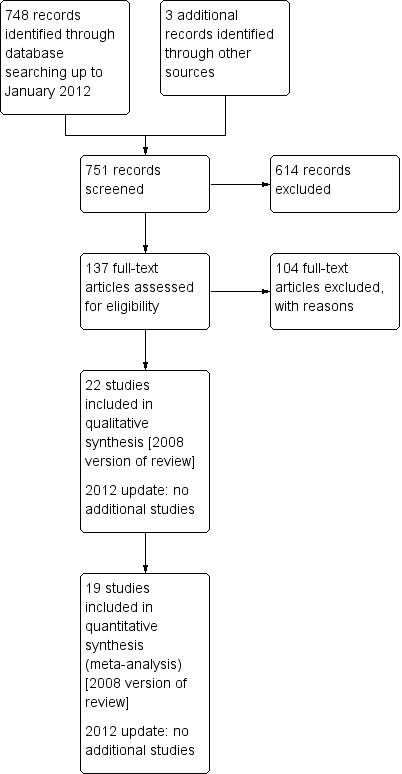
Study flow diagram.

Methodological quality summary: review authors' judgements about each methodological quality item for each included study.

Forest plot of comparison: 1 All‐cause mortality, outcome: 1.1 Overall results.

Forest plot of comparison: 2 Adults and children non‐fatal serious adverse events, outcome: 2.1 Formoterol versus placebo or salbutamol.
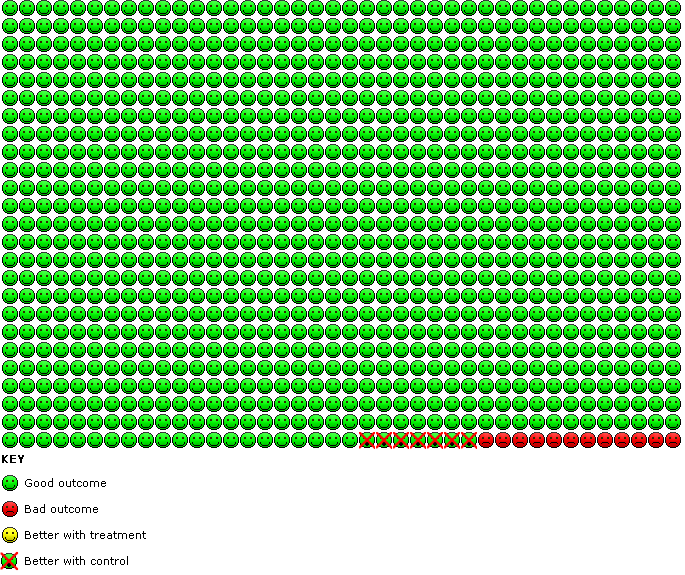
Serious adverse events with regular formoterol compared to placebo. In the control group 12 people out of 1000 had serious adverse events over 16 weeks, compared to 19 (95% CI 13 to 27) out of 1000 for the active treatment group.

Comparison 1 All‐cause mortality, Outcome 1 Overall results.

Comparison 2 Adults and children non‐fatal serious adverse events, Outcome 1 Formoterol versus placebo or salbutamol.

Comparison 3 Adults and children non‐fatal serious adverse events (without formoterol 24 µg arms), Outcome 1 Formoterol versus placebo or salbutamol.
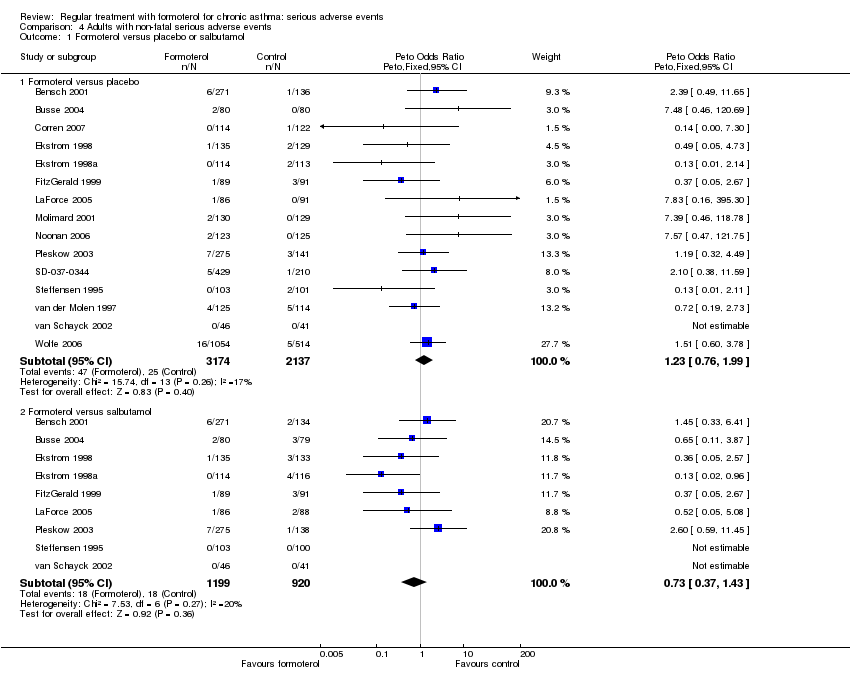
Comparison 4 Adults with non‐fatal serious adverse events, Outcome 1 Formoterol versus placebo or salbutamol.

Comparison 5 Children with non‐fatal serious adverse events, Outcome 1 Formoterol versus placebo or salbutamol.
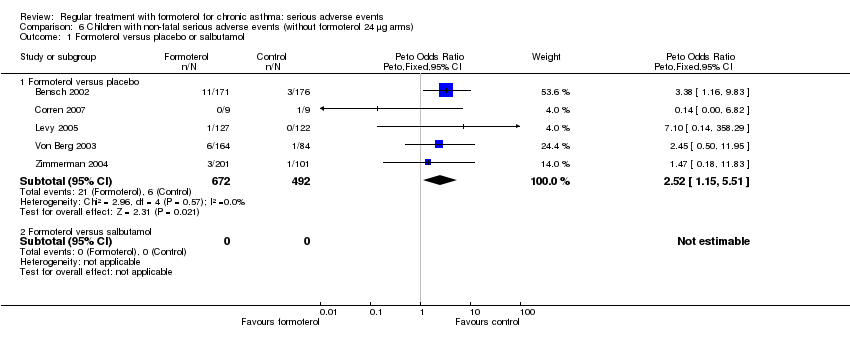
Comparison 6 Children with non‐fatal serious adverse events (without formoterol 24 µg arms), Outcome 1 Formoterol versus placebo or salbutamol.

Comparison 7 Dose comparison: formoterol 24 µg versus 12 µg twice daily, Outcome 1 Serious adverse events.

Comparison 8 Adults and children fatal and non‐fatal serious adverse events, Outcome 1 Formoterol versus placebo or salbutamol.

Comparison 9 Asthma mortality, Outcome 1 Formoterol versus placebo or salbutamol.

Comparison 10 Cardiovascular mortality, Outcome 1 Formoterol versus placebo or salbutamol.

Comparison 11 Adults and children non‐fatal asthma‐related serious adverse events, Outcome 1 Formoterol versus placebo or salbutamol.
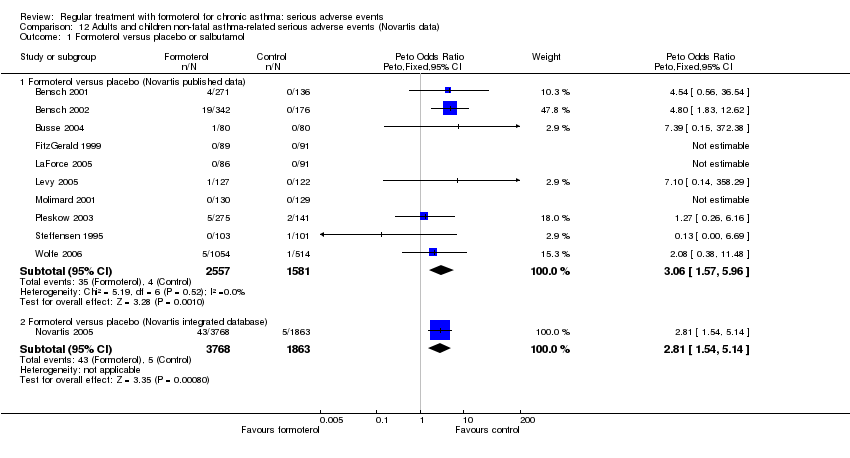
Comparison 12 Adults and children non‐fatal asthma‐related serious adverse events (Novartis data), Outcome 1 Formoterol versus placebo or salbutamol.
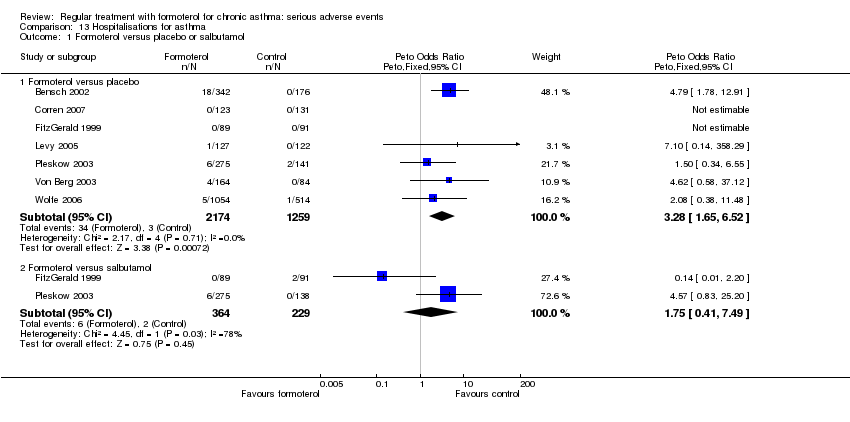
Comparison 13 Hospitalisations for asthma, Outcome 1 Formoterol versus placebo or salbutamol.

Comparison 14 Adults and children non‐fatal cardiovascular serious adverse events, Outcome 1 Formoterol versus placebo or salbutamol.

Comparison 15 Impact of inhaled corticosteroids on asthma‐related SAEs, Outcome 1 Patients with at least one asthma‐related SAE.
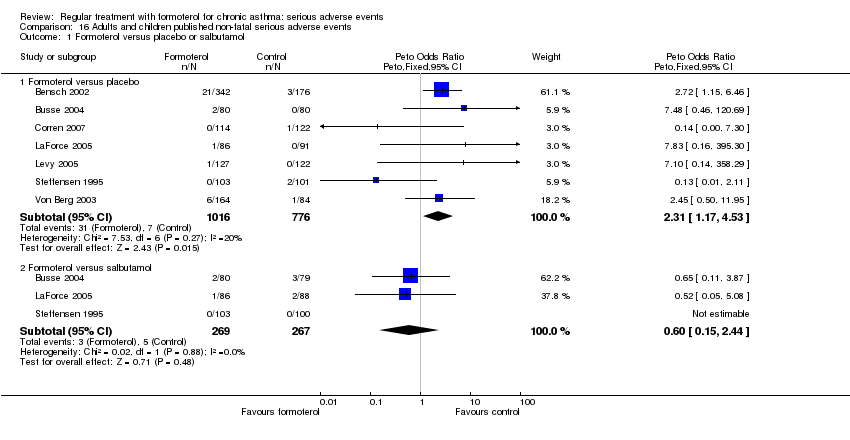
Comparison 16 Adults and children published non‐fatal serious adverse events, Outcome 1 Formoterol versus placebo or salbutamol.
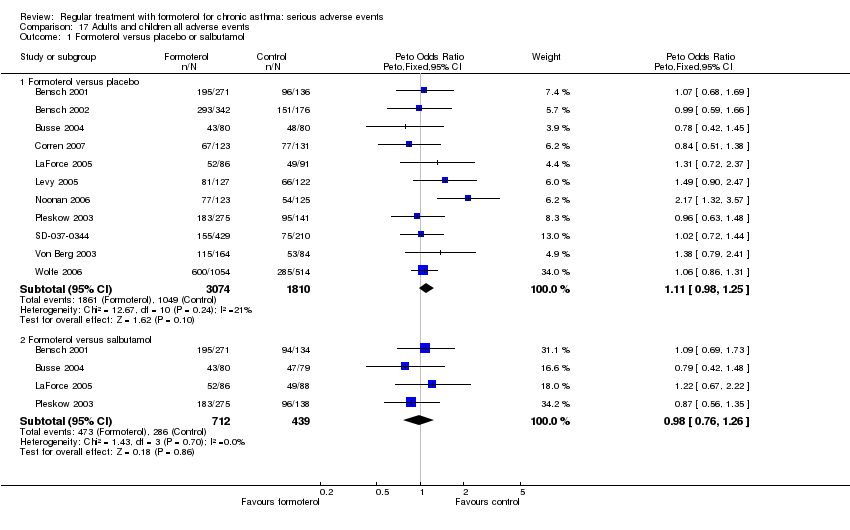
Comparison 17 Adults and children all adverse events, Outcome 1 Formoterol versus placebo or salbutamol.

Comparison 18 Adults and children published adverse events, Outcome 1 Formoterol versus placebo or salbutamol.

Comparison 19 Adults and children all published drug‐related adverse events, Outcome 1 Formoterol versus placebo or salbutamol.
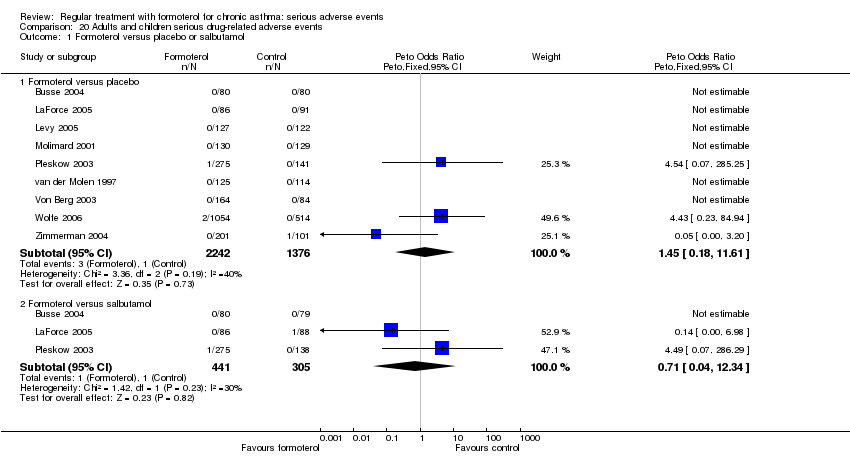
Comparison 20 Adults and children serious drug‐related adverse events, Outcome 1 Formoterol versus placebo or salbutamol.
| Regular formoterol versus placebo or salbutamol for chronic asthma: SAEs in adults and children | ||||||
| Patient or population: patients with chronic asthma Settings: community Intervention: regular formoterol versus placebo or salbutamol | ||||||
| Outcomes | Illustrative comparative risks* (95% CI) | Relative effect | No of participants | Quality of the evidence | Comments | |
| Assumed risk | Corresponding risk | |||||
| Control | Regular formoterol versus placebo or salbutamol | |||||
| SAEs ‐ formoterol versus placebo | Medium‐risk population | OR 1.57 | 6646 | ⊕⊕⊕⊕ | ||
| 10 per 1000 | 16 per 1000 | |||||
| SAEs ‐ formoterol versus salbutamol | Medium‐risk population | OR 0.72 | 2119 | ⊕⊕⊕⊝ | ||
| 23 per 1000 | 17 per 1000 | |||||
| *The basis for the assumed risk (e.g. the median control group risk across studies) is provided in footnotes. The corresponding risk (and its 95% confidence interval) is based on the assumed risk in the comparison group and the relative effect of the intervention (and its 95% CI). | ||||||
| GRADE Working Group grades of evidence | ||||||
| 1 Confidence interval includes the possibility of harm or benefit | ||||||
| Regular formoterol versus placebo or salbutamol for chronic asthma | ||||||
| Patient or population: patients with chronic asthma Settings: community Intervention: regular formoterol Comparison: placebo or salbutamol | ||||||
| Outcomes | Illustrative comparative risks* (95% CI) | Relative effect | No of participants | Quality of the evidence | Comments | |
| Assumed risk | Corresponding risk | |||||
| Placebo or salbutamol | Regular formoterol | |||||
| Mortality (all‐cause) ‐ formoterol versus placebo | Medium‐risk population | OR 1.52 | 5463 | ⊕⊕⊕⊝ | ||
| 0 per 1000 | 0 per 1000 | |||||
| Mortality (all‐cause) ‐ formoterol versus salbutamol | Medium‐risk population | OR 0.5 | 1418 | ⊕⊕⊕⊝ | ||
| 0 per 1000 | 0 per 1000 | |||||
| *The basis for the assumed risk (e.g. the median control group risk across studies) is provided in footnotes. The corresponding risk (and its 95% confidence interval) is based on the assumed risk in the comparison group and the relative effect of the intervention (and its 95% CI). | ||||||
| GRADE Working Group grades of evidence | ||||||
| 1 Not enough data to assess this outcome | ||||||
| Regular formoterol versus placebo or salbutamol for children with chronic asthma: serious adverse events | ||||||
| Patient or population: patients with chronic asthma (children) Settings: community Intervention: regular formoterol versus placebo or salbutamol | ||||||
| Outcomes | Illustrative comparative risks* (95% CI) | Relative effect | No of participants | Quality of the evidence | Comments | |
| Assumed risk | Corresponding risk | |||||
| Control | Regular formoterol versus placebo or salbutamol | |||||
| SAEs ‐ formoterol versus placebo | Medium‐risk population | OR 2.82 | 1335 | ⊕⊕⊕⊕ | ||
| 12 per 1000 | 33 per 1000 | |||||
| SAEs ‐ formoterol versus salbutamol | See comment | See comment | Not estimable | ‐ | See comment | |
| *The basis for the assumed risk (e.g. the median control group risk across studies) is provided in footnotes. The corresponding risk (and its 95% confidence interval) is based on the assumed risk in the comparison group and the relative effect of the intervention (and its 95% CI). | ||||||
| GRADE Working Group grades of evidence | ||||||
| Study ID | Sponsor |
| Novartis | |
| Novartis | |
| Novartis | |
| AstraZeneca | |
| AstraZeneca | |
| AstraZeneca | |
| Novartis | |
| Not reported | |
| Novartis | |
| Not reported | |
| Novartis | |
| Novartis | |
| Novartis | |
| AstraZeneca | |
| Novartis | |
| AstraZeneca | |
| Novartis | |
| AstraZeneca | |
| Not reported | |
| AstraZeneca | |
| Novartis | |
| AstraZeneca |
| Study ID | Proportion of participants on ICS |
| 51% | |
| 69% | |
| 64% | |
| 0% (withdrawn) | |
| 86% | |
| 89% | |
| 100% | |
| Not reported | |
| 62% | |
| 0% | |
| 67% | |
| 72% | |
| 100% | |
| 100% | |
| 44% | |
| 100% | |
| 87% | |
| 100% | |
| 95% | |
| 82% | |
| 62% | |
| 100% |
| Drug | Intrinsic efficacy (%) |
| Isoprenaline, adrenaline | 100 |
| Fenoterol | 42 |
| Formoterol | 20 |
| Salbutamol | 4.9 |
| Salmeterol | < 2 |
| Adapted from Hanania 2002. The authors acknowledge that it is difficult to determine the intrinsic efficacy of salmeterol given its high lipophilicity. | |
| Outcome or subgroup title | No. of studies | No. of participants | Statistical method | Effect size |
| 1 Overall results Show forest plot | 14 | Peto Odds Ratio (Peto, Fixed, 95% CI) | Subtotals only | |
| 1.1 Formoterol versus placebo | 14 | 5463 | Peto Odds Ratio (Peto, Fixed, 95% CI) | 4.50 [0.41, 49.49] |
| 1.2 Formoterol versus salbutamol | 6 | 1418 | Peto Odds Ratio (Peto, Fixed, 95% CI) | 0.47 [0.02, 8.98] |
| Outcome or subgroup title | No. of studies | No. of participants | Statistical method | Effect size |
| 1 Formoterol versus placebo or salbutamol Show forest plot | 19 | Peto Odds Ratio (Peto, Fixed, 95% CI) | Subtotals only | |
| 1.1 Formoterol versus placebo | 19 | 6646 | Peto Odds Ratio (Peto, Fixed, 95% CI) | 1.57 [1.06, 2.31] |
| 1.2 Formoterol versus salbutamol | 9 | 2119 | Peto Odds Ratio (Peto, Fixed, 95% CI) | 0.73 [0.37, 1.43] |
| Outcome or subgroup title | No. of studies | No. of participants | Statistical method | Effect size |
| 1 Formoterol versus placebo or salbutamol Show forest plot | 18 | Peto Odds Ratio (Peto, Fixed, 95% CI) | Subtotals only | |
| 1.1 Formoterol versus placebo | 18 | 5438 | Peto Odds Ratio (Peto, Fixed, 95% CI) | 1.55 [0.97, 2.48] |
| 1.2 Formoterol versus salbutamol | 9 | 1848 | Peto Odds Ratio (Peto, Fixed, 95% CI) | 0.41 [0.19, 0.90] |
| Outcome or subgroup title | No. of studies | No. of participants | Statistical method | Effect size |
| 1 Formoterol versus placebo or salbutamol Show forest plot | 15 | Peto Odds Ratio (Peto, Fixed, 95% CI) | Subtotals only | |
| 1.1 Formoterol versus placebo | 15 | 5311 | Peto Odds Ratio (Peto, Fixed, 95% CI) | 1.23 [0.76, 1.99] |
| 1.2 Formoterol versus salbutamol | 9 | 2119 | Peto Odds Ratio (Peto, Fixed, 95% CI) | 0.73 [0.37, 1.43] |
| Outcome or subgroup title | No. of studies | No. of participants | Statistical method | Effect size |
| 1 Formoterol versus placebo or salbutamol Show forest plot | 5 | Peto Odds Ratio (Peto, Fixed, 95% CI) | Subtotals only | |
| 1.1 Formoterol versus placebo | 5 | 1335 | Peto Odds Ratio (Peto, Fixed, 95% CI) | 2.48 [1.27, 4.83] |
| 1.2 Formoterol versus salbutamol | 0 | 0 | Peto Odds Ratio (Peto, Fixed, 95% CI) | 0.0 [0.0, 0.0] |
| Outcome or subgroup title | No. of studies | No. of participants | Statistical method | Effect size |
| 1 Formoterol versus placebo or salbutamol Show forest plot | 5 | Peto Odds Ratio (Peto, Fixed, 95% CI) | Subtotals only | |
| 1.1 Formoterol versus placebo | 5 | 1164 | Peto Odds Ratio (Peto, Fixed, 95% CI) | 2.52 [1.15, 5.51] |
| 1.2 Formoterol versus salbutamol | 0 | 0 | Peto Odds Ratio (Peto, Fixed, 95% CI) | 0.0 [0.0, 0.0] |
| Outcome or subgroup title | No. of studies | No. of participants | Statistical method | Effect size |
| 1 Serious adverse events Show forest plot | 5 | Peto Odds Ratio (Peto, Fixed, 95% CI) | Subtotals only | |
| 1.1 Adults (all‐cause) | 3 | 1598 | Peto Odds Ratio (Peto, Fixed, 95% CI) | 1.35 [0.64, 2.85] |
| 1.2 Children (all‐cause) | 1 | 342 | Peto Odds Ratio (Peto, Fixed, 95% CI) | 1.20 [0.52, 2.74] |
| 1.3 Asthma SAE | 1 | 3104 | Peto Odds Ratio (Peto, Fixed, 95% CI) | 2.16 [1.13, 4.11] |
| Outcome or subgroup title | No. of studies | No. of participants | Statistical method | Effect size |
| 1 Formoterol versus placebo or salbutamol Show forest plot | 19 | Peto Odds Ratio (Peto, Fixed, 95% CI) | Subtotals only | |
| 1.1 Formoterol versus placebo | 19 | 6646 | Peto Odds Ratio (Peto, Fixed, 95% CI) | 1.61 [1.09, 2.37] |
| 1.2 Formoterol versus salbutamol | 9 | 2119 | Peto Odds Ratio (Peto, Fixed, 95% CI) | 0.71 [0.37, 1.38] |
| Outcome or subgroup title | No. of studies | No. of participants | Statistical method | Effect size |
| 1 Formoterol versus placebo or salbutamol Show forest plot | 12 | Peto Odds Ratio (Peto, Fixed, 95% CI) | Subtotals only | |
| 1.1 Formoterol versus placebo | 12 | 4522 | Peto Odds Ratio (Peto, Fixed, 95% CI) | 4.54 [0.07, 285.25] |
| 1.2 Formoterol versus salbutamol | 6 | 1418 | Peto Odds Ratio (Peto, Fixed, 95% CI) | 4.49 [0.07, 286.29] |
| Outcome or subgroup title | No. of studies | No. of participants | Statistical method | Effect size |
| 1 Formoterol versus placebo or salbutamol Show forest plot | 12 | Peto Odds Ratio (Peto, Fixed, 95% CI) | Subtotals only | |
| 1.1 Formoterol versus placebo | 12 | 4522 | Peto Odds Ratio (Peto, Fixed, 95% CI) | 4.54 [0.07, 285.29] |
| 1.2 Formoterol versus salbutamol | 6 | 1418 | Peto Odds Ratio (Peto, Fixed, 95% CI) | 0.0 [0.0, 0.0] |
| Outcome or subgroup title | No. of studies | No. of participants | Statistical method | Effect size |
| 1 Formoterol versus placebo or salbutamol Show forest plot | 17 | Peto Odds Ratio (Peto, Fixed, 95% CI) | Subtotals only | |
| 1.1 Formoterol versus placebo | 17 | 5759 | Peto Odds Ratio (Peto, Fixed, 95% CI) | 1.99 [1.12, 3.53] |
| 1.2 Formoterol versus salbutamol | 9 | 2119 | Peto Odds Ratio (Peto, Fixed, 95% CI) | 0.74 [0.29, 1.88] |
| Outcome or subgroup title | No. of studies | No. of participants | Statistical method | Effect size |
| 1 Formoterol versus placebo or salbutamol Show forest plot | 11 | Peto Odds Ratio (Peto, Fixed, 95% CI) | Subtotals only | |
| 1.1 Formoterol versus placebo (Novartis published data) | 10 | 4138 | Peto Odds Ratio (Peto, Fixed, 95% CI) | 3.06 [1.57, 5.96] |
| 1.2 Formoterol versus placebo (Novartis integrated database) | 1 | 5631 | Peto Odds Ratio (Peto, Fixed, 95% CI) | 2.81 [1.54, 5.14] |
| Outcome or subgroup title | No. of studies | No. of participants | Statistical method | Effect size |
| 1 Formoterol versus placebo or salbutamol Show forest plot | 7 | Peto Odds Ratio (Peto, Fixed, 95% CI) | Subtotals only | |
| 1.1 Formoterol versus placebo | 7 | 3433 | Peto Odds Ratio (Peto, Fixed, 95% CI) | 3.28 [1.65, 6.52] |
| 1.2 Formoterol versus salbutamol | 2 | 593 | Peto Odds Ratio (Peto, Fixed, 95% CI) | 1.75 [0.41, 7.49] |
| Outcome or subgroup title | No. of studies | No. of participants | Statistical method | Effect size |
| 1 Formoterol versus placebo or salbutamol Show forest plot | 8 | Peto Odds Ratio (Peto, Fixed, 95% CI) | Subtotals only | |
| 1.1 Formoterol versus placebo | 8 | 3049 | Peto Odds Ratio (Peto, Fixed, 95% CI) | 0.69 [0.09, 5.21] |
| 1.2 Formoterol versus salbutamol | 5 | 803 | Peto Odds Ratio (Peto, Fixed, 95% CI) | 0.14 [0.01, 1.33] |
| Outcome or subgroup title | No. of studies | No. of participants | Statistical method | Effect size |
| 1 Patients with at least one asthma‐related SAE Show forest plot | 1 | Peto Odds Ratio (Peto, Fixed, 95% CI) | Subtotals only | |
| 1.1 Patients taking inhaled corticosteroids (all doses of formoterol)) | 1 | 3807 | Peto Odds Ratio (Peto, Fixed, 95% CI) | 2.58 [1.21, 5.49] |
| 1.2 Patients not taking inhaled corticosteroids (all doses of formoterol) | 1 | 1824 | Peto Odds Ratio (Peto, Fixed, 95% CI) | 3.22 [1.17, 8.89] |
| 1.3 Patients taking inhaled corticosteroids (formoterol 12 mcg twice daily) | 1 | 2708 | Peto Odds Ratio (Peto, Fixed, 95% CI) | 2.76 [1.06, 7.15] |
| 1.4 Patients not taking inhaled corticosteroids (formoterol 12 mcg twice daily) | 1 | 1103 | Peto Odds Ratio (Peto, Fixed, 95% CI) | 3.71 [0.75, 18.48] |
| Outcome or subgroup title | No. of studies | No. of participants | Statistical method | Effect size |
| 1 Formoterol versus placebo or salbutamol Show forest plot | 7 | Peto Odds Ratio (Peto, Fixed, 95% CI) | Subtotals only | |
| 1.1 Formoterol versus placebo | 7 | 1792 | Peto Odds Ratio (Peto, Fixed, 95% CI) | 2.31 [1.17, 4.53] |
| 1.2 Formoterol versus salbutamol | 3 | 536 | Peto Odds Ratio (Peto, Fixed, 95% CI) | 0.60 [0.15, 2.44] |
| Outcome or subgroup title | No. of studies | No. of participants | Statistical method | Effect size |
| 1 Formoterol versus placebo or salbutamol Show forest plot | 11 | Peto Odds Ratio (Peto, Fixed, 95% CI) | Subtotals only | |
| 1.1 Formoterol versus placebo | 11 | 4884 | Peto Odds Ratio (Peto, Fixed, 95% CI) | 1.11 [0.98, 1.25] |
| 1.2 Formoterol versus salbutamol | 4 | 1151 | Peto Odds Ratio (Peto, Fixed, 95% CI) | 0.98 [0.76, 1.26] |
| Outcome or subgroup title | No. of studies | No. of participants | Statistical method | Effect size |
| 1 Formoterol versus placebo or salbutamol Show forest plot | 8 | Odds Ratio (M‐H, Fixed, 95% CI) | Subtotals only | |
| 1.1 Formoterol versus placebo | 8 | 3743 | Odds Ratio (M‐H, Fixed, 95% CI) | 1.09 [0.94, 1.26] |
| 1.2 Formoterol versus salbutamol | 4 | 1151 | Odds Ratio (M‐H, Fixed, 95% CI) | 0.98 [0.76, 1.26] |
| Outcome or subgroup title | No. of studies | No. of participants | Statistical method | Effect size |
| 1 Formoterol versus placebo or salbutamol Show forest plot | 4 | Peto Odds Ratio (Peto, Fixed, 95% CI) | Subtotals only | |
| 1.1 Formoterol versus placebo | 4 | 2112 | Peto Odds Ratio (Peto, Fixed, 95% CI) | 1.42 [1.07, 1.88] |
| 1.2 Formoterol versus salbutamol | 3 | 542 | Peto Odds Ratio (Peto, Fixed, 95% CI) | 0.75 [0.48, 1.18] |
| Outcome or subgroup title | No. of studies | No. of participants | Statistical method | Effect size |
| 1 Formoterol versus placebo or salbutamol Show forest plot | 9 | Peto Odds Ratio (Peto, Fixed, 95% CI) | Subtotals only | |
| 1.1 Formoterol versus placebo | 9 | 3618 | Peto Odds Ratio (Peto, Fixed, 95% CI) | 1.45 [0.18, 11.61] |
| 1.2 Formoterol versus salbutamol | 3 | 746 | Peto Odds Ratio (Peto, Fixed, 95% CI) | 0.71 [0.04, 12.34] |