High initial concentration versus low initial concentration sevoflurane for inhalational induction of anaesthesia
Abstract
Background
Sevoflurane induction for general anaesthesia has been reported to be safe, reliable and well accepted by patients. Sevoflurane induction uses either low or high initial concentrations. The low initial concentration technique involves initially administering a low concentration of sevoflurane and gradually increasing the concentration of the dose until the patient is anaesthetized. The high initial concentration technique involves administering high concentrations from the beginning, then continuing with those high doses until the patient is anaesthetized. This review was originally published in 2013 and has been updated in 2016.
Objectives
We aimed to compare induction times and complication rates between high and low initial concentration sevoflurane anaesthetic induction techniques in adults and children who received inhalational induction for general anaesthesia. We defined 'high' as greater than or equal to and 'low' as less than a 4% initial concentration.
Search methods
For the updated review, we searched the following databases: Cochrane Central Register of Controlled Trials (CENTRAL; 2016, Issue 2), MEDLINE (1950 to February 2016), EMBASE (1980 to February 2016), Latin American Caribbean Health Sciences Literature (LILACS) (1982 to February 2016) and the Institute for Scientific Information (ISI) Web of Science (1946 to February 2016). We also searched the reference lists of relevant articles and conference proceedings and contacted the authors of included trials. The original search was run in September 2011.
Selection criteria
We sought all published and unpublished, randomized controlled trials comparing high versus low initial sevoflurane concentration inhalational induction. Our primary outcomes included two measures of anaesthesia (time to loss of the eyelash reflex (LOER) and time until a weighted object held in the patient's hand was dropped), time to successful insertion of a laryngeal mask airway (LMA) and time to endotracheal intubation. Other outcomes were complications of the technique.
Data collection and analysis
We used standardized methods for conducting a systematic review as described in the Cochrane Handbook for Systematic Reviews of Interventions. Two review authors independently extracted details of trial methods and outcome data from reports of all trials considered eligible for inclusion. We conducted all analyses on an intention‐to‐treat basis, when possible. We estimated overall treatment effects by using a fixed‐effect model when we found no substantial heterogeneity, whereas we applied the random‐effects model in the presence of considerable heterogeneity.
Main results
We reran the searches and included one new study (100 participants) in this updated review. In total, we included 11 studies with 829 participants, although most analyses were based on data from fewer participants and evidence of low quality. We noted substantial heterogeneity in the included trials. Thus, our results should be read with caution. It was not possible to combine trials for the primary outcome (LOER), but individual trials reported faster induction times (typically 24 to 82 seconds faster, 41 seconds (31.37 to 50.62)) with high initial concentration sevoflurane (six studies, 443 participants, low‐quality evidence). Apnoea appeared to be more common in the high initial concentration sevoflurane group (risk ratio (RR) 3.14, 95% confidence interval (CI) 1.72 to 5.7, two studies, 160 participants, low‐quality evidence). We found no evidence of differences between the two groups in the incidence of cough (odds ratio (OR) 1.23, 95% CI 0.53 to 2.81, eight studies, 589 participants, low‐quality evidence), laryngospasm (OR 1.59, 95% CI 0.16 to 15.9, seven studies, 588 participants, low‐quality evidence), breath holding (OR 1.16, 95% CI 0.47 to 2.83, five studies, 389 participants, low‐quality evidence), patient movement (RR 1.14, 95% CI 0.69 to 1.89, five studies, 445 participants, low‐quality evidence) or bradycardia (OR 0.8, 95% CI 0.22 to 2.88, three studies, 199 participants, low‐quality evidence), and the overall incidence of complications was low.
Authors' conclusions
A high initial concentration sevoflurane technique probably offers more rapid induction of anaesthesia and a similar rate of complications, except for apnoea, which may be more common with a high initial concentration. However, this conclusion is not definitive because the included studies provided evidence of low quality.
PICO
Plain language summary
High initial concentration versus low initial concentration sevoflurane for inhalational induction of anaesthesia
Review question
We reviewed the evidence from randomized controlled trials comparing high initial concentrations of sevoflurane with low initial concentrations to see whether the evidence supports use of high initial concentrations to reduce induction times and complications for inhalational induction of anaesthesia. This update of a review first published in 2013 is current to February 2016.
Background
General anaesthesia for surgery can be induced by having patients breathe a mixture of sevoflurane (a sweet‐smelling inhaled anaesthetic vapour or drug) and oxygen through a mask. This technique has been reported to be safe, reliable and well accepted by patients. The initial concentration of sevoflurane used for induction can be low or high. The low initial concentration technique involves administering a low concentration of sevoflurane (less than 4%), then gradually increasing the concentration until the patient is anaesthetized. The high initial concentration technique involves administering high concentrations of sevoflurane (from 4% to 8%) from the beginning, then continuing until the patient is anaesthetized. Immediately following loss of consciousness and before anaesthesia is deep enough to allow surgery, patients can go through a stage where they cough, their breathing and heart rate become irregular and they may hold their breath and make uncontrolled movements. A high concentration might shorten this stage.
Study characteristics
We included in our review 11 randomized controlled trials (829 participants). These trials were conducted between 1997 and 2014 and differed with regard to participants (adults vs children), concentrations of sevoflurane used, addition of nitrous oxide and opioids and other factors. Some elements of the methods suggested low‐quality evidence would be obtained. The studies could not always be combined, and study results cannot be stated with certainty.
Key results
The high initial concentration technique shortened induction time (six studies, 443 participants, low‐quality evidence) and led to similar rates of cough (eight studies, 589 participants, low‐quality evidence), sudden sustained closure of the vocal cords that prevented breathing (seven studies, 588 participants, low‐quality evidence), breath holding (five studies, 389 participants, low‐quality evidence), sudden movements (five studies, 445 participants, low‐quality evidence) and slow heart rate (three studies, 199 participants, low‐quality evidence). The high initial concentration technique showed greater suspension of breathing when compared with the low initial concentration technique (two studies, 160 participants, low‐quality evidence).
Quality of the evidence
The included studies provided low‐quality evidence, and study results should be interpreted with caution. More studies are needed to enable firm conclusions.
Authors' conclusions
Summary of findings
| High initial concentration versus low initial concentration for inhalational induction of anaesthesia | ||||||
| Patient or population: patients with inhalational induction of anaesthesia | ||||||
| Outcomes | Illustrative comparative risks* (95% CI) | Relative effect | Number of participants | Quality of the evidence | Comments | |
| Assumed risk | Corresponding risk | |||||
| Control | High initial concentration vs low initial concentration | |||||
| Time to loss of eyelash reflex | Mean time to loss of eyelash reflex in control groups was | Mean time to loss of eyelash reflex in intervention groups was | 443 | ⊕⊕⊝⊝ | ||
| Cough | 38 per 1000 | 47 per 1000 | OR 1.23 | 589 | ⊕⊕⊝⊝ | |
| Laryngospasm | 5 per 1000 | 7 per 1000 | OR 1.59 | 588 | ⊕⊕⊝⊝ | |
| Breath holding | 56 per 1000 | 64 per 1000 | OR 1.16 | 389 | ⊕⊕⊝⊝ | |
| Apneoa | 141 per 1000 | 442 per 1000 | RR 3.14 | 160 | ⊕⊕⊝⊝ | |
| Patient movement | 163 per 1000 | 186 per 1000 | RR 1.14 | 445 | ⊕⊕⊝⊝ | |
| Bradycardia | 66 per 1000 | 53 per 1000 | OR 0.8 | 199 | ⊕⊕⊝⊝ | |
| *The basis for the assumed risk (e.g. median control group risk across studies) is provided in footnotes. The corresponding risk (and its 95% confidence interval) is based on the assumed risk in the comparison group and the relative effect of the intervention (and its 95% CI) | ||||||
| GRADE Working Group grades of evidence | ||||||
| aDowngraded two levels because of serious concerns about selection bias, allocation concealment and blinding bDowngraded two levels because of serious concerns about allocation concealment and blinding cDowngraded two levels because of serious concerns about selection bias, allocation concealment and blinding dDowngraded two levels because of serious concerns about selection bias, allocation concealment and blinding eDowngraded two levels because of serious concerns about allocation concealment and blinding fDowngraded two levels because of serious concerns about allocation concealment and blinding gDowngraded two levels because of serious concerns about allocation concealment | ||||||
Background
Description of the condition
General anaesthesia (GA) may be induced by receiving an intravenous injection (IV induction) or by breathing in through a mask an anaesthetic vapour mixed with oxygen (inhalational induction). Inhalational anaesthetic induction may be the preferred method in children and in some adult patients who refuse intravenous cannulation (Eger 2003; Goresky 1996) or who have poor venous access or potentially difficult airways. One of the volatile anaesthetic agents commonly used for inhalational induction of anaesthesia is sevoflurane (Ultane®, Sevorane®, Sojourn™). Sevoflurane (2,2,2‐trifluoro‐1‐[trifluoromethyl] ethyl fluoromethyl ether) was first introduced into clinical practice in Japan in 1990; it is sweet‐smelling, non‐flammable and less irritating to mucous membranes than other agents.
Induction of anaesthesia with sevoflurane has been reported to be safe, reliable and well accepted by patients (De Hert 2015; van den Berg 2005). Its characteristics include inherent stability; low flammability; non‐pungent odour; limited irritation to airways; low blood or gas anaesthetic solubility, which allows rapid induction of and emergence from anaesthesia; minimal cardiovascular and respiratory side effects; and minimal end‐organ effects (Delgado‐Herrera 2001). The muscle relaxant properties of sevoflurane allow insertion of a laryngeal mask airway (LMA) or endotracheal tube (Aantaa 2001) without a muscle relaxant, provided adequate concentrations of anaesthetic are given.
Description of the intervention
Inhalational induction of anaesthesia with sevoflurane involves the use of a low or a high initial concentration of sevoflurane. The low initial concentration technique involves initially administering a low concentration of sevoflurane, then gradually increasing the concentration until the patient is anaesthetized (Eger 2003). The high initial concentration technique involves administering high concentrations of sevoflurane (from 4% to 8%) from the beginning, then continuing until the patient is anaesthetized (Eger 2003). Both techniques can be carried out by using different breathing patterns ‐ vital capacity or tidal volume breathing. The vital capacity method consists of breathing out the residual volume, then taking a maximal breath and holding it as long as is comfortable, followed by spontaneous respiration; the tidal volume method involves normal breathing and respiratory rates.
Other interventions or medications can be used to improve the quality of induction of anaesthesia, for example, inspiratory pressure support at 15 cm H2O via an anaesthetic ventilator (Banchereau 2005); priming of the breathing circuit with high concentration sevoflurane in oxygen, with or without prior nitrous oxide induction of anaesthesia (Yurino 1995); use of nitrous oxide with sevoflurane and oxygen (Dubois 1999; O'Shea 2001); and use of sufentanil (Meaudre 2004), midazolam (Nishiyama 2002), clonidine (Watanabe 2006) or dexmedetomidine (Mizrak 2013; Yao 2015) before induction of anaesthesia. Induction time‐ time to loss of the eyelash reflex (LOER) ‐ is measured to compare the efficacy of different methods. However, complications during induction of anaesthesia such as coughing, salivation, failed induction at the first attempt, laryngospasm, breath holding, apnoea, severe movement or panic reaction, hypotension, an epileptiform electroencephalogram (EEG) and bradycardia can increase morbidity (Epstein 1998; Kaisti 1999; Martin‐Larrauri 2004; Merquiol 2006; Roodman 2003; Vakkuri 2001; Yurino 1995).
How the intervention might work
High concentration volatile anaesthetic induction has been reported to result in a shorter (faster) induction time (Epstein 1998; Martin‐Larrauri 2004). A high inspired sevoflurane concentration could increase sevoflurane concentration in alveoli and in the brain, so the action of sevoflurane is more rapid than with a low inspired sevoflurane concentration. A high concentration might shorten the second stage of anaesthesia, reducing the time during which coughing and breath holding may occur. On the other hand, a high initial concentration might cause increased irritation to the patient's airways.
Why it is important to do this review
A shorter induction time is usually desirable, but this may be accompanied by several complications such as breath holding, laryngospasm, severe movement, salivation and hypotension (Dubois 1999; Epstein 1998; Martin‐Larrauri 2004). More frequent apnoea of longer duration (Pancaro 2005) has been reported after induction with a high concentration of sevoflurane, as have a higher incidence of bradycardia (Green 2000) and an epileptiform electroencephalogram (EEG) (Constant 2005; Vakkuri 2001).
Objectives
We aimed to compare induction times and complication rates between high and low initial concentration sevoflurane anaesthetic induction techniques in adults and children who received inhalational induction for general anaesthesia. We defined 'high' as greater than or equal to and 'low' as less than a 4% initial concentration.
Methods
Criteria for considering studies for this review
Types of studies
We aimed to include all published and unpublished randomized controlled trials (RCTs) comparing high (≥ 4%) versus low (< 4%) initial concentration inhalational induction.
Types of participants
We included participants of all ages who received a sevoflurane induction technique for general anaesthesia.
Types of interventions
We included two sevoflurane induction techniques for general anaesthesia.
-
High initial concentration sevoflurane (control) ‐ equal to or greater than a 4% concentration of sevoflurane, including vital capacity and tidal volume breath induction.
-
Low initial concentration sevoflurane induction (intervention) ‐ starting concentration less than 4% sevoflurane.
Types of outcome measures
Primary outcomes
-
Induction time (time to loss of eyelash reflex (LOER), assessed in seconds (beginning from inhalation of gas until LOER); or time to drop a weighted object, assessed in seconds (beginning from inhalation of gas until weighted object, for example, a weighted syringe, dropped); or time to successfully insert laryngeal mask.
Secondary outcomes
-
Patient satisfaction (numerical rating scale).
-
Failed inhalational induction, from any cause, at the first attempt (yes or no).
-
Complications.
We defined complications as follows.
-
Major complications.
-
Cough during induction period.
-
Laryngospasm.
-
Breath holding.
-
Apnoea.
-
Severe patient movement or physical reaction such as grabbing the mask, trying to move off the operating table, etc.
-
-
Minor complications.
-
Hypotension (drop of more than 20% of baseline blood pressure).
-
Salivation.
-
Epileptiform EEG.
-
Bradycardia (fall of heart rate to below 20% of baseline value).
-
Search methods for identification of studies
Electronic searches
In this updated review, we searched the following databases for relevant trials in February 2016: the Cochrane Central Register of Controlled Trials (CENTRAL; 2016, Issue 2); MEDLINE SilverPlatter (1950 to February 2016), EMBASE SilverPlatter (1980 to February 2016), Latin American Caribbean Health Sciences Literature (LILACS) (1982 to February 2016) and the Institute for Scientific Information (ISI) Web of Science (1946 to February 2016).
We developed a specific search strategy for each database. We based each search strategy on search developed for MEDLINE (Appendix 1). Please see Appendix 2 (CENTRAL); Appendix 3 (EMBASE); Appendix 4 (LILACS); and Appendix 5 (ISI Web of Science).
Searching other resources
We searched the following for relevant trials in February 2016.
-
Specialist journals such as Anesthesia and Analgesia; Anesthesiology; Anaesthesia; Acta Anaesthesiologica Scandinavica; British Journal of Anaesthesia; Canadian Journal of Anaesthesia; and European Journal of Anaesthesiology.
-
Conference proceedings and abstracts (American Society of Anesthesiologists (ASA); International Anaesthesia Research Society (IARS)).
-
European Society of Anaesthesiologists (ESA).
-
The grey literature (System for Information on Grey Literature in Europe (SIGLE)).
-
Reference lists of relevant articles.
We also contacted known trialists, experts and medical or pharmaceutical companies to ask about unpublished trials.
We applied no language restriction.
Data collection and analysis
Selection of studies
Two review authors (PB and SB) independently scanned the titles and abstracts of reports identified by searching electronic databases and by handsearching journals. We obtained and assessed the full articles of any possibly or definitely relevant trials according to definitions provided in the criteria for considering studies for this review. We (PB and SB) resolved disagreements by consensus or, if necessary, by consulting a third review author (PP).
Data extraction and management
We used a data extraction form to obtain data from individual studies (Appendix 6). Two review authors (PB and SB) extracted the data. We used five studies previously chosen as fulfilling the review selection criteria to pilot the form, to ensure that data obtained were adequate for the purposes of the review. We contacted study authors to obtain or to clarify missing or unclear data.
After extracting data, we performed double data entry and screened the database for inconsistencies as a quality assurance measure.
For dichotomous outcomes, we extracted the number with outcomes and the number of participants for the two groups. We found five studies that reported multiple comparison groups (Dubois 1999; Hsu 2000; Martin‐Larrauri 2004; Mendonca 2001; Yurino 1995). We pooled appropriate groups by using the formula suggested in the Cochrane Handbook for Systematic Reviews of Interventions (Higgins 2011).
For continuous outcomes, we extracted the mean and the standard deviation (SD) for each group. We found two studies that reported multiple comparison groups (Hsu 2000; Martin‐Larrauri 2004). To gain the means and standard deviations of our intervention and comparisons of interest, we estimated them by pooling the appropriate group using the formula suggested in the Cochrane Handbook for Systematic Reviews of Interventions (Higgins 2011).
Assessment of risk of bias in included studies
Two review authors (PB and SB) assessed the risk of bias of each trial according to the guidelines provided in the Cochrane Handbook for Systematic Reviews of Interventions (Higgins 2011). Our assessment criteria were as follows.
-
Random sequence generation (selection bias): low, unclear, high risk.
-
Allocation concealment (selection bias): low, unclear, high risk.
-
Blinding (performance bias and detection bias): low, unclear, high risk. However, participant blinding during inhalation induction (performance bias) was inevitable.
-
Incomplete outcome data (attrition bias): low, unclear, high risk.
-
Use of intention‐to‐treat analysis: yes, no, no information.
We resolved conflicts during assessment through discussion and, if necessary, through evaluation by a third review author (PP).
Measures of treatment effect
We analysed continuous data (i.e. time to loss of eyelash reflex, time to drop a weighted object and time to successful insertion of a laryngeal mask airway) as mean differences (MDs) using the inverse variance method. We analysed continuous data that used different scales by using standardized mean differences, when appropriate. We used standard deviations to standardize mean differences to a single scale.
For proportions (dichotomous outcomes), namely, patient satisfaction, failed gas induction, cough, laryngospasm, breath holding, hypotension, salivation, epileptiform EEG and bradycardia, we used the Peto odds ratio (OR). Because apnoea and patient movement were reported at an incidence greater than 10%, we used the risk ratio (RR).
Unit of analysis issues
We expected no unit of analysis issues.
Dealing with missing data
We attempted to contact study authors to ask for missing data. If study authors did not respond, we extracted all available data from the publication. If data were missing because of participant dropout or losses to follow‐up, we planned to conduct a primary analysis based on complete data and a sensitivity analysis with missing data imputed on the basis of worst‐case and best‐case scenarios.
Assessment of heterogeneity
We assessed heterogeneity by considering the Q test and the I2 statistic (Higgins 2011). We considered heterogeneity to be high if I2 was greater than 35% and the Q test returned a result with P value < 0.10.
As heterogeneity was high, we used a random‐effects model in pooling results, when this was possible (Higgins 2011). If the I2 statistic was greater than 75%, we did not pool the results because heterogeneity was high. We explored clinical heterogeneity and performed subgroup analyses when appropriate.
Assessment of reporting biases
If possible, we planned to assess reporting biases (such as publication bias) by using funnel plots. We planned to assess funnel plot asymmetry both visually by using formal tests.
We assessed selective outcome reporting bias as having low risk (all pre‐specified, expected outcomes have been reported), high risk (not all pre‐specified, expected outcomes have been reported) or unclear risk.
Data synthesis
We analysed data and displayed them by using the Review Manager (RevMan 5.3) software distributed by The Cochrane Collaboration.
The review differs from the protocol in several ways (Boonmak 2007); see Differences between protocol and review. As a result of the small number of events, we used the Peto method for dichotomous data. Therefore, we could not present the risk ratio (RR) as mentioned in the protocol (Boonmak 2007). Instead we used the odds ratio (OR) and its 95% confidence interval (CI). We combined data using the mean difference (MD) for continuous data and presented them together with 95% CIs. We agreed to add two continuous outcomes (time to endotracheal intubation and time to successful insertion of a laryngeal mask) to the analysis because both are clinically important outcomes. Only one study reported time to intubation (Dubois 1999). Two studies measured time to successful insertion of a laryngeal mask; this is reported below (Martin‐Larrauri 2004; Singh 2014).
We were not able to examine publication bias by using a funnel plot because data were insufficient.
We presented key information for both primary and secondary outcomes in the 'Summary of findings' tables, which we created by using GRADEpro software (GRADEpro 2011). We used the GRADE (Grades of Recommendation, Assessment, Development and Evaluation Working Group) approach to describe the overall quality of the outcome, rating quality as high, moderate, low or very low (Higgins 2011). We examined risk of bias, indirectness of evidence, inconsistency of results, imprecision of results and potential publication bias in making the assessment. We downgraded the quality of evidence from high if we found deficiencies in these domains. We included the following outcomes in the 'Summary of findings' table.
-
Time to loss of eyelash reflex.
-
Cough.
-
Laryngospasm.
-
Breath holding.
-
Apnoea.
-
Patient movement.
-
Bradycardia.
Subgroup analysis and investigation of heterogeneity
One primary outcome, time to loss of eyelash reflex (LOER), showed substantial heterogeneity between studies (poor overlapping of CIs, I2 = 91%, P value < 0.0001). We performed subgroup analyses by age group (children vs adults), nitrous oxide supplement, opioid supplement, initial dose of sevoflurane and breathing technique, as stated in the protocol, and found substantial heterogeneity in all subgroups. We did not pool the results (Analysis 1.1).
Sensitivity analysis
We planned to perform sensitivity analyses based on risk of bias and allocation of missing data, as stated in the protocol (Boonmak 2007); see Differences between protocol and review. However, we were not able to do this because of the small number of included studies for the primary outcome. We performed sensitivity analysis for the LOER outcome by removing one study, which seemed very different from all other studies (Hall 2000). A sensitivity analysis indicated no influence on effects.
Results
Description of studies
Results of the search
After we had removed duplicates, we identified 8308 citations from searches of databases, journals, and conference proceedings and through citation review in this update (Figure 1). In the first version of our review, we assessed 13 full‐text articles after screening by title and abstract; we included 10 of those 13 studies and excluded three studies (Boonmak 2012).
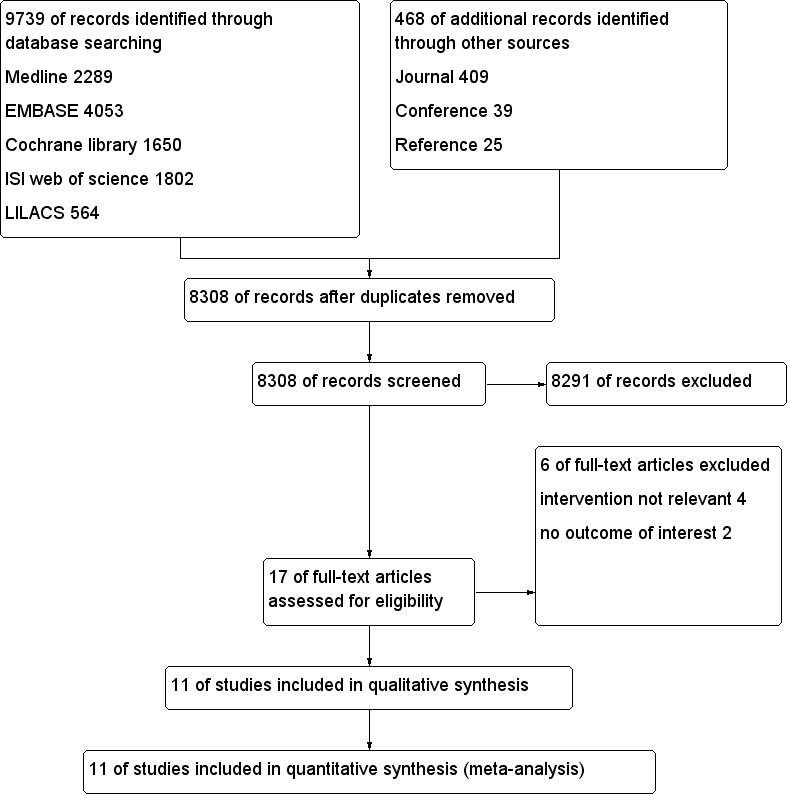
Study flow diagram.
For this update, we obtained four full papers that were potentially eligible for inclusion in the review. We included only one additional trial (Singh 2014) and excluded three of the four articles for reasons described under Characteristics of excluded studies. No trials are awaiting assessment.
Included studies
We included 11 trials (829 participants) in this update of the review (Baum 1997; Dubois 1999; Epstein 1998; Green 2000; Hall 2000; Hsu 2000; Martin‐Larrauri 2004; Mendonca 2001; Pancaro 2005; Singh 2014; Yurino 1995); see Characteristics of included studies.
Six studies compared high and low initial concentrations in participants with tidal volume breathing using nitrous oxide (N2O) and oxygen (O2) (Baum 1997; Dubois 1999; Epstein 1998; Green 2000; Hsu 2000; Singh 2014). Three studies compared high and low initial concentrations with vital capacity breathing with N2O and O2 in adult participants (Martin‐Larrauri 2004; Mendonca 2001; Yurino 1995). Two studies compared high and low initial concentrations with tidal volume breathing with O2 in adults (Hall 2000; Pancaro 2005).
Six studies reported LOER time (Dubois 1999; Epstein 1998; Hall 2000; Hsu 2000; Martin‐Larrauri 2004; Singh 2014). Only one trial reported time to drop a weighted object (Mendonca 2001). Martin‐Larrauri 2004 reported time to successful insertion of a laryngeal mask airway. Singh 2014 reported time from IV cannulation to laryngeal mask airway insertion but did not show time to laryngeal mask airway insertion. Dubois 1999 reported time to endotracheal intubation. Most studies reported complications such as cough, laryngospasm, breath holding, patient movement, bradycardia, apnoea, hypotension and salivation. However, no studies reported patient satisfaction or epileptiform EEG.
Excluded studies
We excluded six studies. Of those six studies, we excluded two because they did not report the outcome of interest (Munoz 1999; Nishiyama 1997) and four because they did not compare low and high initial concentrations (Julliac 2013; Kreuzer 2014; Lee 2013; Walpole 1999); see Characteristics of excluded studies.
Studies awaiting classification
No studies are awaiting classification.
Ongoing studies
We found no ongoing studies.
Risk of bias in included studies
We assessed the risk of bias of included studies using the ’Risk of bias’ tool developed by The Cochrane Collaboration (Higgins 2011). This risk of bias tool invites judgements on five items for each trial (selection bias, performance bias, detection bias, attrition bias, reporting bias). All review authors independently assessed risk of bias for each study and resolved disagreements by discussion. Please see Figure 2 and Characteristics of included studies for our assessment of risk of bias in the included studies. Two studies were of high methodological quality (Green 2000; Pancaro 2005).
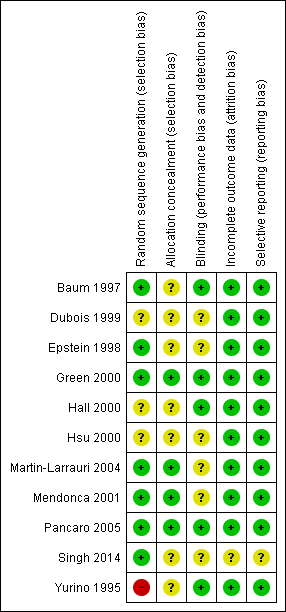
Methodological quality summary: review authors' judgements about each methodological quality item for each included study.
Allocation
Four of the 11 included studies had adequate allocation concealment (Green 2000; Martin‐Larrauri 2004; Mendonca 2001; Pancaro 2005) (see Figure 3). Seven studies did not describe their allocation concealment (Baum 1997; Dubois 1999; Epstein 1998; Hall 2000; Hsu 2000; Singh 2014; Yurino 1995).
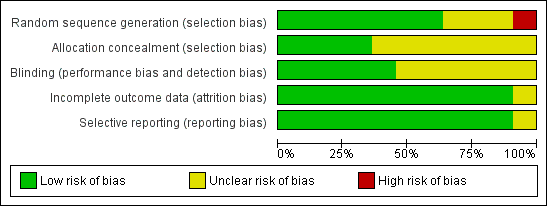
Methodological quality graph: review authors' judgements about each methodological quality item presented as percentages across all included studies.
Blinding
Five studies had adequate blinding (Baum 1997; Green 2000; Hall 2000; Pancaro 2005; Yurino 1995). The remaining six studies did not describe their blinding (Dubois 1999; Epstein 1998; Hsu 2000; Martin‐Larrauri 2004; Mendonca 2001; Singh 2014).
Incomplete outcome data
None of the included studies reported any dropouts.
Selective reporting
We found that all planned outcomes were reported in 10 trials with no selective reporting of outcomes. However, one trial did not clearly describe adverse events (Singh 2014).
Other potential sources of bias
All 11 included studies reported between‐group comparisons of baseline characteristics.
Effects of interventions
See 'Summary of findings' for the main comparison.
Primary outcomes
Time to loss of eyelash reflex (LOER) (seconds)
See Analysis 1.1.
Six studies reported LOER (Dubois 1999; Epstein 1998; Hall 2000; Hsu 2000; Martin‐Larrauri 2004; Singh 2014). We noted considerable heterogeneity between the six studies (I2 = 91%, P value < 0.0001). We explored the source of heterogeneity by performing the following subgroup analyses, as stated in the protocol (Boonmak 2007). We rated this outcome as having low‐quality evidence because one study had high risk of selection bias (Yurino 1995), five studies had unclear risk of allocation concealment bias (Baum 1997; Dubois 1999; Epstein 1998; Hall 2000; Hsu 2000) and five studies had unclear risk of blinding bias (Dubois 1999; Epstein 1998; Hsu 2000; Martin‐Larrauri 2004; Singh 2014).
Subgroup analysis by age group of participants
We found considerable heterogeneity for both children (I2 = 94%, P value < 0.00001) and adults (I2 = 84%, P value = 0.01).
Subgroup analysis by supplement drugs
We noted substantial heterogeneity in four studies that used nitrous oxide as the supplement drug (I2 = 94%, P value < 0.00001) (Epstein 1998; Hsu 2000; Martin‐Larrauri 2004; Singh 2014). One study did not apply nitrous oxide to participants (Hall 2000). Three included studies did not use opioid as a supplement drug and revealed considerable heterogeneity (I2 = 85%, P value = 0.0002) (Epstein 1998; Hall 2000; Hsu 2000). One study used an opioid (Martin‐Larrauri 2004).
Subgroup analysis by initial dose of sevoflurane
We observed considerable heterogeneity for both the 4% to 6% initial concentration group (I2 = 74%, P value = 0.05) and the 6% to 8% initial concentration group (I2 = 93%, P value < 0.00001).
Subgroup analysis by breathing techniques
We noted considerable heterogeneity for the tidal volume breathing technique (I2 = 93%, P value < 0.00001). One study compared tidal volume and vital capacity breathing (Martin‐Larrauri 2004).
We performed a sensitivity analysis by removing one study (Hall 2000) because of its differences from other studies. We found heterogeneity among the studies (I2 = 92%, P value < 0.0001).
We found considerable heterogeneity across the included studies, which reflects the variety of initial sevoflurane concentrations, adjuvant drugs, characteristics of participants and clinical techniques used. Other possible reasons include variation in the magnitude of treatment effects in each study, differences in the number of participants between different treatment and control groups and small‐study effects from one study (Hall 2000). Therefore, we could not combine the results statistically; instead we have reported the findings from individual studies (Analysis 1.1). Epstein 1998 had a shorter LOER in the high initial concentration group (MD 24.00 seconds, 95% CI 17.43 to 30.57 seconds, 40 participants, moderate‐quality evidence). Hsu 2000 reported a shorter LOER in the high initial concentration group (MD 82.00 seconds, 95% CI 46.43 to 117.57 seconds, 13 participants, low‐quality evidence). Hall 2000 had a shorter time to LOER in the high initial concentration group than in the low initial concentration group (MD 42.50 seconds, 95% CI 34.33 to 50.67 seconds, 99 participants, moderate‐quality evidence). Dubois 1999 had a shorter time to LOER in the high initial concentration group (MD 30.98 seconds, 95% CI 23.25 to 38.71 seconds, 65 participants, low‐quality evidence), and Martin‐Larrauri 2004 had a shorter time to LOER in the high initial concentration group (MD 37.00 seconds, 95% CI 34.71 to 39.29 seconds, 126 participants, moderate‐quality evidence). Singh 2014 had a shorter time to LOER in the high initial concentration group (MD 59.4 seconds, 95% CI 51.83 to 66.97 seconds, 100 participants, low‐quality evidence).
Time to drop a weighted object (seconds)
Only one study reported time until the participant dropped a weighted object (Mendonca 2001) and found a statistically significant difference between low and high initial concentration groups (MD 33 seconds, 95% CI 19.67 to 46.33 seconds, 40 participants, moderate‐quality evidence). We rated this as moderate‐quality evidence because risk of blinding bias was unclear.
Time to successful insertion of laryngeal mask airway (seconds)
Only one study presented these data (Martin‐Larrauri 2004). This study revealed a statistically significant shorter time to insert a laryngeal mask in the high initial concentration group compared with the low initial concentration group (MD 18 seconds, 95% CI 12 to 24 seconds, 126 participants, moderate‐quality evidence). We rated this as moderate‐quality evidence because risk of blinding bias was unclear.
Time to intubation (seconds)
Only one study presented time to intubation (Dubois 1999). This study revealed similar times with high initial concentrations and low initial concentrations (MD 30 seconds, 95% CI ‐1 to 61 seconds, 65 participants, low‐quality evidence). We rated this as low‐quality evidence because risk of selection bias, risk of allocation concealment bias and risk of blinding bias were unclear.
Secondary outcomes
Patient satisfaction
None of the 11 included studies looked at patient satisfaction.
Failed gas induction
Two studies aimed to assess this outcome (Hsu 2000; Mendonca 2001). However, Mendonca 2001 recorded no events. Hsu 2000 showed no significant differences in failed gas induction between high and low initial concentration groups (Peto OR 1.99, 95% CI 0.67 to 5.87, 180 participants, low‐quality evidence). We rated this as low‐quality evidence because risk of allocation concealment bias and blinding bias was unclear in one study.
Cough
See Analysis 1.2.
Eight studies showed no significant differences in the cough rate between high and low initial concentration groups (Peto OR 1.23, 95% CI 0.53 to 2.81, 589 participants, low‐quality evidence) (Baum 1997; Dubois 1999; Epstein 1998; Hsu 2000; Martin‐Larrauri 2004; Mendonca 2001; Pancaro 2005; Yurino 1995). We rated this outcome as providing low‐quality evidence because risk of allocation concealment bias and blinding bias was unclear in one study.
Laryngospasm
See Analysis 1.3.
Seven studies aimed to report this outcome (Epstein 1998; Hsu 2000; Martin‐Larrauri 2004; Mendonca 2001; Pancaro 2005; Singh 2014; Yurino 1995). However, investigators described only three incidences of laryngospasm ‐ two in the high initial concentration group (Martin‐Larrauri 2004; Singh 2014), and one in the low initial concentration group (Epstein 1998). These data provided no evidence of a significant difference in laryngospasm between high and low initial concentration groups (Peto OR 1.59, 95% CI 0.16 to 15.92, 588 participants, low‐quality evidence). We rated this outcome as providing low‐quality evidence because one study had high risk of selection bias, five studies had unclear risk of allocation concealment bias and five studies had unclear risk of blinding bias.
Breath holding
See Analysis 1.4.
Five studies showed no significant differences in breath holding between high and low initial concentration groups (Peto OR 1.16, 95% CI 0.47 to 2.83, 389 participants, low‐quality evidence) (Baum 1997; Hsu 2000; Martin‐Larrauri 2004; Mendonca 2001; Yurino 1995). We rated this outcome as providing low‐quality evidence because one study had high risk of selection bias, three studies had unclear risk of allocation concealment bias and two studies had unclear risk of blinding bias.
Apnoea
See Analysis 1.5.
Two studies suggested a significant difference in apnoea between high and low initial concentration groups (RR 3.14, 95% CI 1.72 to 5.70, 160 participants, low‐quality evidence) (Dubois 1999; Pancaro 2005) . We rated this outcome as providing low‐quality evidence because one study had unclear risk of allocation concealment bias and blinding bias.
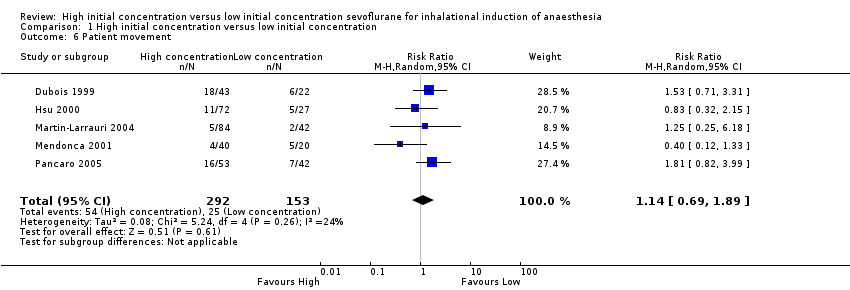
Patient movement
See Analysis 1.6.
Five studies showed no significant differences in patient movement between high and low initial concentration groups (RR 1.14, 95% CI 0.69 to 1.89, 445 participants, low‐quality evidence) (Dubois 1999; Hsu 2000; Martin‐Larrauri 2004; Mendonca 2001; Pancaro 2005). We rated this as low‐quality evidence because two studies had unclear risk of allocation concealment bias, and four studies had unclear risk of blinding bias.
Hypotension
The two studies that assessed this outcome reported no hypotension in high or low initial concentration groups (139 participants) (Epstein 1998; Hsu 2000). We rated this outcome as providing low‐quality evidence because one study had unclear risk of selection bias, and two studies had unclear risk of allocation concealment bias and blinding bias.
Salivation
See Analysis 1.7.
Six studies did not show evidence of a significant difference in salivation between high and low initial concentration groups (Peto OR 1.23, 95% CI 0.36 to 4.21, 487 participants, low‐quality evidence) (Epstein 1998; Hsu 2000; Martin‐Larrauri 2004; Mendonca 2001; Pancaro 2005; Yurino 1995). We rated this as moderate‐quality evidence because two studies had unclear risk of allocation concealment bias, and four studies had unclear risk of blinding bias.
Epileptiform EEG
None of the 11 included studies looked at this outcome.
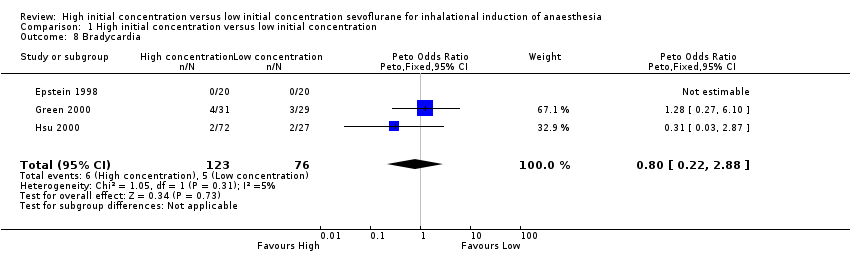
Bradycardia
See Analysis 1.8.
Three studies found no evidence of differences in bradycardia between high and low initial concentration groups (Peto OR 0.80, 95% CI 0.22 to 2.88, 119 participants, low‐quality evidence) (Epstein 1998; Green 2000; Hsu 2000). We rated this as low‐quality evidence because two studies had unclear risk of allocation concealment bias.
We have presented some of the secondary outcomes in summary of findings Table for the main comparison.
Discussion
Summary of main results
Review authors found that included studies were conducted so differently, especially with regard to the number of subgroups, with varying concentrations of sevoflurane, addition of nitrous oxide and opioids and different patient groups (adults vs children) that it is impossible to offer reliable conclusions. Evidence from six studies of 443 participants contributing data to the primary outcome of this review showed that the high initial concentration technique reduced time to loss of eyelash reflex (LOER). Combining the studies was not possible, but analysis of individual studies revealed that LOER appears to be quicker, typically by 24 to 82 seconds (six studies, 443 participants, low‐quality evidence). We found low‐quality evidence of increased apnoea (two studies, 160 participants) associated with the high initial concentration technique. However, the incidence of other complications was similar in each group and was generally low. Data were comparable in the incidence of cough (eight studies, 589 participants, low‐quality evidence), laryngospasm (seven studies, 588 participants, low‐quality evidence), breath holding (five studies, 389 participants, low‐quality evidence), bradycardia (three studies, 199 participants, low‐quality evidence) and patient movement (five studies, 445 participants, low‐quality evidence).
Overall completeness and applicability of evidence
The short duration of the included trials meant that no study reported incomplete data. All studies reported outcomes needed to evaluate the sevoflurane induction technique. All trials took place in recent years and used drug and anaesthetic techniques in current practice. However, the main limitations of these findings were the quality of the evidence and the small numbers of participants for many outcomes, so it is difficult for review authors to draw firm conclusions regarding many of our outcome measures. We included only 11 studies in the review (829 participants), and the number of participants for individual outcomes varied between 139 and 589 participants. Some included studies reported unclear blinding because participant blinding was inevitable. Other included studies had inadequate allocation concealment. Overall applicability of the results of this review is limited because of the great variety of techniques and participants included, although the techniques remain current.
Quality of the evidence
We included in this review 10 studies with 829 participants. Two studies (Green 2000; Pancaro 2005) had low risk of bias. Six studies (Dubois 1999; Epstein 1998; Hsu 2000; Martin‐Larrauri 2004; Mendonca 2001; Singh 2014) were unclear with regard to blinding technique. Seven studies (Baum 1997; Dubois 1999; Epstein 1998; Hall 2000; Hsu 2000; Singh 2014; Yurino 1995) did not state whether allocation was concealed. Only one study (Yurino 1995) had high risk of bias associated with the sampling technique. We have presented details in the risk of bias tables and in Figure 2. We found that overall the quality of the evidence for most outcomes was low or moderate as the result of performance bias and selection bias. However, performance bias (sevoflurane concentration blinding) had no effect on LOER nor on other adverse events.
Sufficient studies measured time to LOER that we could perform subgroup analysis according to age group, supplemental drug (nitrous oxide and opioid), initial dose of sevoflurane and technique of administration. The high initial concentration sevoflurane technique showed a consistently shorter time to LOER than was seen with the low initial concentration sevoflurane technique.
Possible effects of study design on our findings include considerable clinical variation in techniques used; different studies applied different initial sevoflurane concentrations, breathing techniques, priming techniques, drug supplementation and anaesthetic circuits.
Initial concentrations in the low initial inhalational induction groups described varied from 2% to less than 4% before sevoflurane was increased, but in the high initial concentration groups we noted initial concentrations ranging from 4% to 8%. Differences between groups in a particular study would be more likely if the difference between starting concentrations was large. However, after subgroup analysis, we determined time to LOER differences in both groups. The initial concentration in the high concentration group might be only one cause of the difference. Other than initial concentration, breathing techniques varied from single to multiple vital capacity breathing and tidal volume breathing in both groups. The effect of different breathing techniques on LOER is unpredictable, although vital capacity breathing seemed to have shorter time to LOER than tidal volume breathing (Baker 1999; Lejus 2006; Liu 2010). Opioid, a sedative drug, and nitrous oxide supplementation varied in dose and time of administration. These adjuncts will influence time to LOER and rate of complications, but again not in a predictable way. In other studies, nitrous oxide supplementation had variable effects on time to LOER and complications (Bordes 2006; Fassoulaki 2015;Fernandez‐Alcantud 2008; Goldman 2003; Kihara 2003; O'Shea 2001; Siau 2002).
Furthermore, measurements of induction time may be inaccurate among included studies. Investigators used two different measures ‐ time to LOER and time to drop a weighted object. Time to LOER was defined as time from the start of induction until the patient lost his or her eyelash reflex, whilst time to drop a weighted object was defined as time from the start of induction until the patient dropped a 20 mL syringe full of water from between his or her thumb and index finger. We could not pool these induction outcomes. The frequency at which the eyelash reflex was tested varied from every two seconds to every 10 seconds across studies, which might have led to inaccuracies in measurement.
The complications that we aimed to study were also variously defined, with many study authors using their own particular definitions and reporting only adverse events of interest to them. Overall incidence might be greater than in the studies. We found no trials comparing high and low initial concentrations that reported patient satisfaction, nor any that aimed to monitor the EEG for epileptiform activity.
Potential biases in the review process
We followed standard approaches of the Cochrane review process and believe that no specific biases apply to this review. However, differences between protocol and review might cause bias. We considered that evidence for significant heterogeneity was present when I2 > 35% instead of I2 > 50%, as mentioned in the protocol. We used the Peto odds ratio for rare events (incidence < 10% in the low initial concentration group) but used the risk ratio for apnoea and patient movement (incidence > 10%).
Agreements and disagreements with other studies or reviews
Our review suggests that the high initial concentration sevoflurane technique seems to offer a shorter induction time than is seen with a low initial concentration. This result was also reported in other reviews (Bordes 2006; Ghatge 2003; Lerman 2009) and was consistent across all age groups, with or without nitrous oxide supplementation.
Complications in the high and low initial concentration induction groups were comparable except for apnoea, which appeared more common in the high initial concentration group. Previous studies have reported comparable complications during inhalational induction (Bordes 2006; Ghatge 2003; Lerman 2009; Nathan 2004) but have presented no clear conclusions about the effects of differential concentrations of sevoflurane on bradycardia, the epileptiform EEG and apnoea.
Bradycardia (three studies; 199 participants) was comparable between the groups in our review (66 per 1000). Narrative reviews have provided no firm conclusions about bradycardia with high concentrations in healthy adults and children (Bordes 2006; Nathan 2004). Retrospective studies (Bai 2010; Kraemer 2010) and a review article (Walia 2016) showed higher prevalence of bradycardia associated with higher sevoflurane concentrations and Down syndrome.
Apneoa (two studies; 160 participants) was more common in high than in low initial concentration groups (141:1000). A previous narrative review suggested increased apnoea in children receiving a high concentration with midazolam (Lerman 2009).
Cough (38:1000 in the low concentration group), laryngospasm (6:1000 in the low concentration group), breath holding (56:1000 in the low concentration group), patient movement (145:1000 in the low concentration group) and salivation (21:1000 in the low concentration group) were comparable between groups in our review. Other studies reported that a high initial concentration sevoflurane technique is not associated with these clinical side effects (Bordes 2006; Ghatge 2003; Lerman 2009; Nathan 2004).
No study reported epilepiform EEG. However, Merquiol 2006 found that high initial (6%) sevoflurane induction had more epileptiform EEG than incremental sevoflurane induction in children (abstract only).Gibert 2012 and Schultz 2012 found that end‐tidal sevoflurane concentrations 4% or greater can cause epileptiform EEG in children. Kreuzer 2014 reported that 8% sevoflurane induction showed higher epileptiform EEG than 6% sevoflurane induction in children. In adults, Smith 2016 reported epileptiform EEG during 8% sevoflurane induction before elective carotid endarterectomy.

Study flow diagram.

Methodological quality summary: review authors' judgements about each methodological quality item for each included study.

Methodological quality graph: review authors' judgements about each methodological quality item presented as percentages across all included studies.

Comparison 1 High initial concentration versus low initial concentration, Outcome 1 Time to loss of eyelash reflex (seconds).

Comparison 1 High initial concentration versus low initial concentration, Outcome 2 Cough.

Comparison 1 High initial concentration versus low initial concentration, Outcome 3 Laryngospasm.

Comparison 1 High initial concentration versus low initial concentration, Outcome 4 Breath holding.
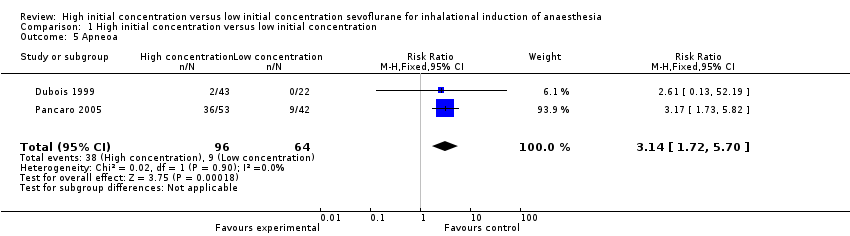
Comparison 1 High initial concentration versus low initial concentration, Outcome 5 Apneoa.
Comparison 1 High initial concentration versus low initial concentration, Outcome 6 Patient movement.

Comparison 1 High initial concentration versus low initial concentration, Outcome 7 Salivation.
Comparison 1 High initial concentration versus low initial concentration, Outcome 8 Bradycardia.
| High initial concentration versus low initial concentration for inhalational induction of anaesthesia | ||||||
| Patient or population: patients with inhalational induction of anaesthesia | ||||||
| Outcomes | Illustrative comparative risks* (95% CI) | Relative effect | Number of participants | Quality of the evidence | Comments | |
| Assumed risk | Corresponding risk | |||||
| Control | High initial concentration vs low initial concentration | |||||
| Time to loss of eyelash reflex | Mean time to loss of eyelash reflex in control groups was | Mean time to loss of eyelash reflex in intervention groups was | 443 | ⊕⊕⊝⊝ | ||
| Cough | 38 per 1000 | 47 per 1000 | OR 1.23 | 589 | ⊕⊕⊝⊝ | |
| Laryngospasm | 5 per 1000 | 7 per 1000 | OR 1.59 | 588 | ⊕⊕⊝⊝ | |
| Breath holding | 56 per 1000 | 64 per 1000 | OR 1.16 | 389 | ⊕⊕⊝⊝ | |
| Apneoa | 141 per 1000 | 442 per 1000 | RR 3.14 | 160 | ⊕⊕⊝⊝ | |
| Patient movement | 163 per 1000 | 186 per 1000 | RR 1.14 | 445 | ⊕⊕⊝⊝ | |
| Bradycardia | 66 per 1000 | 53 per 1000 | OR 0.8 | 199 | ⊕⊕⊝⊝ | |
| *The basis for the assumed risk (e.g. median control group risk across studies) is provided in footnotes. The corresponding risk (and its 95% confidence interval) is based on the assumed risk in the comparison group and the relative effect of the intervention (and its 95% CI) | ||||||
| GRADE Working Group grades of evidence | ||||||
| aDowngraded two levels because of serious concerns about selection bias, allocation concealment and blinding bDowngraded two levels because of serious concerns about allocation concealment and blinding cDowngraded two levels because of serious concerns about selection bias, allocation concealment and blinding dDowngraded two levels because of serious concerns about selection bias, allocation concealment and blinding eDowngraded two levels because of serious concerns about allocation concealment and blinding fDowngraded two levels because of serious concerns about allocation concealment and blinding gDowngraded two levels because of serious concerns about allocation concealment | ||||||
| Outcome or subgroup title | No. of studies | No. of participants | Statistical method | Effect size |
| 1 Time to loss of eyelash reflex (seconds) Show forest plot | 6 | 443 | Mean Difference (IV, Random, 95% CI) | ‐39.00 [‐50.62, ‐31.37] |
| 2 Cough Show forest plot | 8 | 589 | Peto Odds Ratio (Peto, Fixed, 95% CI) | 1.23 [0.53, 2.81] |
| 3 Laryngospasm Show forest plot | 7 | 588 | Peto Odds Ratio (Peto, Fixed, 95% CI) | 1.59 [0.16, 15.92] |
| 4 Breath holding Show forest plot | 5 | 389 | Peto Odds Ratio (Peto, Fixed, 95% CI) | 1.16 [0.47, 2.83] |
| 5 Apneoa Show forest plot | 2 | 160 | Risk Ratio (M‐H, Fixed, 95% CI) | 3.14 [1.72, 5.70] |
| 6 Patient movement Show forest plot | 5 | 445 | Risk Ratio (M‐H, Random, 95% CI) | 1.14 [0.69, 1.89] |
| 7 Salivation Show forest plot | 6 | 487 | Peto Odds Ratio (Peto, Fixed, 95% CI) | 1.23 [0.36, 4.21] |
| 8 Bradycardia Show forest plot | 3 | 199 | Peto Odds Ratio (Peto, Fixed, 95% CI) | 0.80 [0.22, 2.88] |