High initial concentration versus low initial concentration sevoflurane for inhalational induction of anaesthesia
Information
- DOI:
- https://doi.org/10.1002/14651858.CD006837.pub3Copy DOI

- Database:
-
- Cochrane Database of Systematic Reviews
- Version published:
-
- 29 June 2016see what's new
- Type:
-
- Intervention
- Stage:
-
- Review
- Cochrane Editorial Group:
-
Cochrane Anaesthesia Group
- Copyright:
-
- Copyright © 2016 The Cochrane Collaboration. Published by John Wiley & Sons, Ltd.
Article metrics
Altmetric:
Cited by:
Authors
Contributions of authors
Polpun Boonmak (PB), Suhattaya Boonmak (SB), Porjai Pattanittum (PP).
Conceiving of the review: PB.
Co‐ordinating the review: SB.
Undertaking manual searches: PB, SB.
Screening search results: PB, SB.
Organizing retrieval of papers: PB.
Screening retrieved papers against inclusion criteria: PB, SB.
Appraising the quality of papers: PB, SB.
Abstracting data from papers: PB, SB.
Writing to authors of papers to ask for additional information: PB.
Providing additional data related to papers: PB.
Obtaining and screening data on unpublished studies: PB.
Managing data for the review: PB, PP.
Entering data into Review Manager (RevMan 5.3): PB, SB.
Analysing RevMan statistical data: PB, PP.
Performing double entry of data: data entered by person one PB, data entered by person two SB.
Interpreting data: PB, PP.
Performing statistical analysis: PP.
Writing the review: PB, SB.
Writing the effects of interventions part: PP.
Creating 'Summary of findings' tables: PP, PB.
Commenting on the 'Summary of findings' tables: PB, SB.
Securing funding for the review: PB.
Performing previous work that was the foundation of the present study: PB.
Serving as guarantor for the review (one review author): PB.
Taking responsibility for reading and checking the review before submission: PB, SB, PP.
Sources of support
Internal sources
-
Systematic review grant, Faculty of Medicine, Khon Kaen University, Thailand.
-
Thai Cochrane Network, Thailand.
External sources
-
The Thailand Research Fund, Thailand.
Declarations of interest
Polpun Boonmak: none known.
Suhattaya Boonmak: none known.
Porjai Pattanittum: none known.
Acknowledgements
We would like to thank Jane Cracknell, Martha Delgado and Andrew Smith (Content Editors), Marialena Trivella (Statistical Editor), Thomas Ledowski and Mark Neuman (Peer Reviewers) and Janet Wale (representative of the Cochrane Consumer Network) for help and editorial advice provided during preparation of this systematic review (Boonmak 2012).
We would like to thank Martha Delgado, Marc Davison and Thomas Ledowski for help and editorial advice provided during preparation of the protocol for this systematic review (Boonmak 2007). We thank Karen Hovhannisyan for devising the search strategy and conducting the data search.
Version history
| Published | Title | Stage | Authors | Version |
| 2016 Jun 29 | High initial concentration versus low initial concentration sevoflurane for inhalational induction of anaesthesia | Review | Polpun Boonmak, Suhattaya Boonmak, Porjai Pattanittum | |
| 2012 Sep 12 | High initial concentration versus low initial concentration sevoflurane for inhalational induction of anaesthesia | Review | Polpun Boonmak, Suhattaya Boonmak, Porjai Pattanittum | |
| 2007 Oct 17 | High concentration versus low concentration sevoflurane for anaesthesia induction | Protocol | Polpun Boonmak, Suhattaya Boonmak, Wimonrat Krisanaprakornkit, Porjai Pattanittum | |
Differences between protocol and review
We changed the title to "High initial concentration versus low initial concentration sevoflurane for inhalational induction of anaesthesia".
We added two outcomes that we did not plan in the protocol (Boonmak 2007) ‐ time to endotracheal intubation and time to successful insertion of a laryngeal mask airway.
We did not use the risk ratio for dichotomous data, but we used the Peto odds ratio because events were rare.
We considered I2 > 35% as a sign of heterogeneity instead of I2 > 50%, as mentioned in the protocol.
If I2 was greater than 75%, we did not attempt to pool the results.
We conducted all analyses while using RevMan software version 5.3.5, not version 4.2.
Keywords
MeSH
Medical Subject Headings (MeSH) Keywords
Medical Subject Headings Check Words
Humans;
PICOs
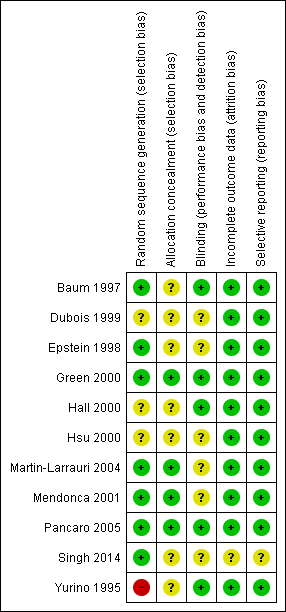
Methodological quality summary: review authors' judgements about each methodological quality item for each included study.
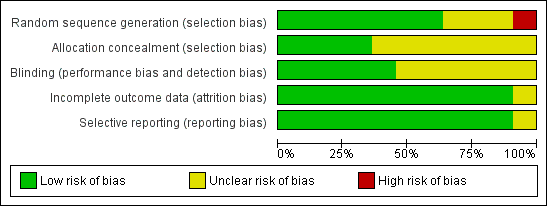
Methodological quality graph: review authors' judgements about each methodological quality item presented as percentages across all included studies.

Comparison 1 High initial concentration versus low initial concentration, Outcome 1 Time to loss of eyelash reflex (seconds).

Comparison 1 High initial concentration versus low initial concentration, Outcome 2 Cough.

Comparison 1 High initial concentration versus low initial concentration, Outcome 3 Laryngospasm.

Comparison 1 High initial concentration versus low initial concentration, Outcome 4 Breath holding.

Comparison 1 High initial concentration versus low initial concentration, Outcome 5 Apneoa.

Comparison 1 High initial concentration versus low initial concentration, Outcome 6 Patient movement.

Comparison 1 High initial concentration versus low initial concentration, Outcome 7 Salivation.

Comparison 1 High initial concentration versus low initial concentration, Outcome 8 Bradycardia.
| High initial concentration versus low initial concentration for inhalational induction of anaesthesia | ||||||
| Patient or population: patients with inhalational induction of anaesthesia | ||||||
| Outcomes | Illustrative comparative risks* (95% CI) | Relative effect | Number of participants | Quality of the evidence | Comments | |
| Assumed risk | Corresponding risk | |||||
| Control | High initial concentration vs low initial concentration | |||||
| Time to loss of eyelash reflex | Mean time to loss of eyelash reflex in control groups was | Mean time to loss of eyelash reflex in intervention groups was | 443 | ⊕⊕⊝⊝ | ||
| Cough | 38 per 1000 | 47 per 1000 | OR 1.23 | 589 | ⊕⊕⊝⊝ | |
| Laryngospasm | 5 per 1000 | 7 per 1000 | OR 1.59 | 588 | ⊕⊕⊝⊝ | |
| Breath holding | 56 per 1000 | 64 per 1000 | OR 1.16 | 389 | ⊕⊕⊝⊝ | |
| Apneoa | 141 per 1000 | 442 per 1000 | RR 3.14 | 160 | ⊕⊕⊝⊝ | |
| Patient movement | 163 per 1000 | 186 per 1000 | RR 1.14 | 445 | ⊕⊕⊝⊝ | |
| Bradycardia | 66 per 1000 | 53 per 1000 | OR 0.8 | 199 | ⊕⊕⊝⊝ | |
| *The basis for the assumed risk (e.g. median control group risk across studies) is provided in footnotes. The corresponding risk (and its 95% confidence interval) is based on the assumed risk in the comparison group and the relative effect of the intervention (and its 95% CI) | ||||||
| GRADE Working Group grades of evidence | ||||||
| aDowngraded two levels because of serious concerns about selection bias, allocation concealment and blinding bDowngraded two levels because of serious concerns about allocation concealment and blinding cDowngraded two levels because of serious concerns about selection bias, allocation concealment and blinding dDowngraded two levels because of serious concerns about selection bias, allocation concealment and blinding eDowngraded two levels because of serious concerns about allocation concealment and blinding fDowngraded two levels because of serious concerns about allocation concealment and blinding gDowngraded two levels because of serious concerns about allocation concealment | ||||||
| Outcome or subgroup title | No. of studies | No. of participants | Statistical method | Effect size |
| 1 Time to loss of eyelash reflex (seconds) Show forest plot | 6 | 443 | Mean Difference (IV, Random, 95% CI) | ‐39.00 [‐50.62, ‐31.37] |
| 2 Cough Show forest plot | 8 | 589 | Peto Odds Ratio (Peto, Fixed, 95% CI) | 1.23 [0.53, 2.81] |
| 3 Laryngospasm Show forest plot | 7 | 588 | Peto Odds Ratio (Peto, Fixed, 95% CI) | 1.59 [0.16, 15.92] |
| 4 Breath holding Show forest plot | 5 | 389 | Peto Odds Ratio (Peto, Fixed, 95% CI) | 1.16 [0.47, 2.83] |
| 5 Apneoa Show forest plot | 2 | 160 | Risk Ratio (M‐H, Fixed, 95% CI) | 3.14 [1.72, 5.70] |
| 6 Patient movement Show forest plot | 5 | 445 | Risk Ratio (M‐H, Random, 95% CI) | 1.14 [0.69, 1.89] |
| 7 Salivation Show forest plot | 6 | 487 | Peto Odds Ratio (Peto, Fixed, 95% CI) | 1.23 [0.36, 4.21] |
| 8 Bradycardia Show forest plot | 3 | 199 | Peto Odds Ratio (Peto, Fixed, 95% CI) | 0.80 [0.22, 2.88] |