Scolaris Content Display Scolaris Content Display

Study flow diagram.
Figuras y tablas -
Figure 1

Study flow diagram.

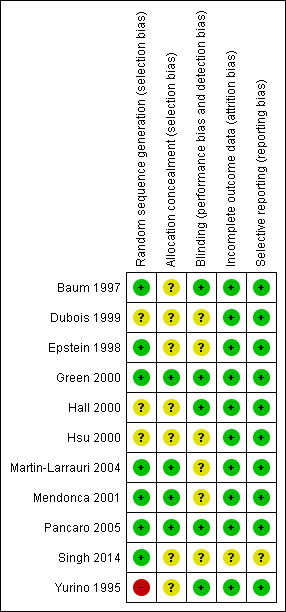
Methodological quality summary: review authors' judgements about each methodological quality item for each included study.
Figuras y tablas -
Figure 2

Methodological quality summary: review authors' judgements about each methodological quality item for each included study.

Methodological quality graph: review authors' judgements about each methodological quality item presented as percentages across all included studies.
Figuras y tablas -
Figure 3

Methodological quality graph: review authors' judgements about each methodological quality item presented as percentages across all included studies.

Comparison 1 High initial concentration versus low initial concentration, Outcome 1 Time to loss of eyelash reflex (seconds).
Figuras y tablas -
Analysis 1.1

Comparison 1 High initial concentration versus low initial concentration, Outcome 1 Time to loss of eyelash reflex (seconds).

Comparison 1 High initial concentration versus low initial concentration, Outcome 2 Cough.
Figuras y tablas -
Analysis 1.2

Comparison 1 High initial concentration versus low initial concentration, Outcome 2 Cough.

Comparison 1 High initial concentration versus low initial concentration, Outcome 3 Laryngospasm.
Figuras y tablas -
Analysis 1.3

Comparison 1 High initial concentration versus low initial concentration, Outcome 3 Laryngospasm.

Comparison 1 High initial concentration versus low initial concentration, Outcome 4 Breath holding.
Figuras y tablas -
Analysis 1.4

Comparison 1 High initial concentration versus low initial concentration, Outcome 4 Breath holding.

Comparison 1 High initial concentration versus low initial concentration, Outcome 5 Apneoa.
Figuras y tablas -
Analysis 1.5

Comparison 1 High initial concentration versus low initial concentration, Outcome 5 Apneoa.

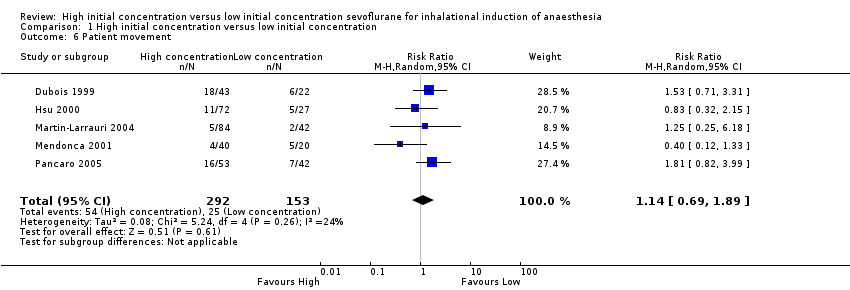
Comparison 1 High initial concentration versus low initial concentration, Outcome 6 Patient movement.
Figuras y tablas -
Analysis 1.6

Comparison 1 High initial concentration versus low initial concentration, Outcome 6 Patient movement.

Comparison 1 High initial concentration versus low initial concentration, Outcome 7 Salivation.
Figuras y tablas -
Analysis 1.7

Comparison 1 High initial concentration versus low initial concentration, Outcome 7 Salivation.

Comparison 1 High initial concentration versus low initial concentration, Outcome 8 Bradycardia.
Figuras y tablas -
Analysis 1.8

Comparison 1 High initial concentration versus low initial concentration, Outcome 8 Bradycardia.

Summary of findings for the main comparison. High initial concentration versus low initial concentration for inhalational induction of anaesthesia

High initial concentration versus low initial concentration for inhalational induction of anaesthesia

Patient or population: patients with inhalational induction of anaesthesia
Settings: patients undergoing various surgical procedures in operating rooms in Asia, Europe, North America
Intervention: high initial concentration versus low initial concentration

Outcomes

Illustrative comparative risks* (95% CI)

Relative effect
(95% CI)

Number of participants
(studies)

Quality of the evidence
(GRADE)

Comments

Assumed risk

Corresponding risk

Control

High initial concentration vs low initial concentration

Time to loss of eyelash reflex

Mean time to loss of eyelash reflex in control groups was
112.9 seconds

Mean time to loss of eyelash reflex in intervention groups was
41 lower
(31.37 to 50.62 lower)

443
(6 studies)

⊕⊕⊝⊝
lowa

Cough

38 per 1000

47 per 1000
(21 to 101)

OR 1.23
(0.53 to 2.81)

589
(8 studies)

⊕⊕⊝⊝
lowb

Laryngospasm

5 per 1000

7 per 1000
(1 to 68)

OR 1.59
(0.16 to 15.92)

588
(7 studies)

⊕⊕⊝⊝
lowc

Breath holding

56 per 1000

64 per 1000
(27 to 144)

OR 1.16
(0.47 to 2.83)

389
(5 studies)

⊕⊕⊝⊝
lowd

Apneoa

141 per 1000

442 per 1000
(242 to 802)

RR 3.14
(1.72 to 5.7)

160
(2 studies)

⊕⊕⊝⊝
lowe

Patient movement

163 per 1000

186 per 1000
(113 to 309)

RR 1.14
(0.69 to 1.89)

445
(5 studies)

⊕⊕⊝⊝
lowf

Bradycardia

66 per 1000

53 per 1000
(15 to 169)

OR 0.8
(0.22 to 2.88)

199
(3 studies)

⊕⊕⊝⊝
lowg

*The basis for the assumed risk (e.g. median control group risk across studies) is provided in footnotes. The corresponding risk (and its 95% confidence interval) is based on the assumed risk in the comparison group and the relative effect of the intervention (and its 95% CI)
CI: confidence interval; OR: odds ratio; RR: risk ratio

GRADE Working Group grades of evidence
High quality: Further research is very unlikely to change our confidence in the estimate of effect
Moderate quality: Further research is likely to have an important impact on our confidence in the estimate of effect and may change the estimate
Low quality: Further research is very likely to have an important impact on our confidence in the estimate of effect and is likely to change the estimate
Very low quality: We are very uncertain about the estimate

aDowngraded two levels because of serious concerns about selection bias, allocation concealment and blinding

bDowngraded two levels because of serious concerns about allocation concealment and blinding

cDowngraded two levels because of serious concerns about selection bias, allocation concealment and blinding

dDowngraded two levels because of serious concerns about selection bias, allocation concealment and blinding

eDowngraded two levels because of serious concerns about allocation concealment and blinding

fDowngraded two levels because of serious concerns about allocation concealment and blinding

gDowngraded two levels because of serious concerns about allocation concealment

Figuras y tablas -
Summary of findings for the main comparison. High initial concentration versus low initial concentration for inhalational induction of anaesthesia
Comparison 1. High initial concentration versus low initial concentration

Outcome or subgroup title

No. of studies

No. of participants

Statistical method

Effect size

1 Time to loss of eyelash reflex (seconds) Show forest plot

6

443

Mean Difference (IV, Random, 95% CI)

‐39.00 [‐50.62, ‐31.37]

2 Cough Show forest plot

8

589

Peto Odds Ratio (Peto, Fixed, 95% CI)

1.23 [0.53, 2.81]

3 Laryngospasm Show forest plot

7

588

Peto Odds Ratio (Peto, Fixed, 95% CI)

1.59 [0.16, 15.92]

4 Breath holding Show forest plot

5

389

Peto Odds Ratio (Peto, Fixed, 95% CI)

1.16 [0.47, 2.83]

5 Apneoa Show forest plot

2

160

Risk Ratio (M‐H, Fixed, 95% CI)

3.14 [1.72, 5.70]

6 Patient movement Show forest plot

5

445

Risk Ratio (M‐H, Random, 95% CI)

1.14 [0.69, 1.89]

7 Salivation Show forest plot

6

487

Peto Odds Ratio (Peto, Fixed, 95% CI)

1.23 [0.36, 4.21]

8 Bradycardia Show forest plot

3

199

Peto Odds Ratio (Peto, Fixed, 95% CI)

0.80 [0.22, 2.88]

Figuras y tablas -
Comparison 1. High initial concentration versus low initial concentration