Bicarbonate‐ versus lactate‐buffered solutions for acute continuous haemodiafiltration or haemofiltration
Abstract
Background
Acute kidney injury (AKI) is a severe loss of kidney function that results in patients' inability to appropriately excrete nitrogenous wastes and creatinine. Continuous haemodiafiltration (HDF) or haemofiltration (HF) are commonly used renal replacement therapies for people with AKI. Buffered dialysates and solutions used in HDF or HF have varying effects on acid‐base physiology and several electrolytes. The benefits and harms of bicarbonate‐ versus lactate‐buffered HDF or HF solutions for treating patients with AKI remain unclear.
Objectives
To assess the benefits and harms of bicarbonate‐ versus lactate‐buffered solutions for HDF or HF for treating people with AKI.
Search methods
We searched the Cochrane Renal Group's Specialised Register to 6 January 2015 through contact with the Trials' Search Co‐ordinator using search terms relevant to this review. We also searched the Chinese Biomedical Literature Database.
Selection criteria
All randomised controlled trials (RCT) and quasi‐RCTs that reported comparisons of bicarbonate‐buffered solutions with lactate‐buffered solutions for AKI were selected for inclusion irrespective of publication status or language.
Data collection and analysis
Two authors independently assessed titles and abstracts, and where necessary the full text of studies, to determine which satisfied our inclusion criteria. Data were extracted by two authors who independently assessed studies for eligibility and quality using a standardised data extraction form. Methodological quality was assessed using the Cochrane risk of bias tool. Results were expressed as risk ratio (RR) or mean difference (MD) with 95% confidence intervals (CI).
Main results
We identified four studies (171 patients) that met our inclusion criteria. Overall, study quality was suboptimal. There were significant reporting omissions related to methodological issues and potential harms. Outcome measures were not defined or reported adequately. The studies were small and lacked follow‐up phases.
Serum lactate levels were significantly lower in patients treated with bicarbonate‐buffered solutions (4 studies, 171 participants: MD ‐1.09 mmol/L, 95% CI ‐1.30 to ‐0.87; I2 = 0%). There were no differences in mortality (3 studies, 163 participants: RR 0.76, 95% CI 0.50 to 1.15; I2 = 0%); serum bicarbonate levels (3 studies, 163 participants: MD 0.27 mmol/L, 95% CI ‐1.45 to 1.99; I2 = 78%), serum creatinine (2 studies, 137 participants: MD ‐22.81 µmol/L, 95% CI ‐129.61 to 83.99; I2 = 73%), serum base excess (3 studies, 145 participants: MD 0.80, 95% CI ‐0.91 to 2.50; I2 = 38%), serum pH (4 studies, 171 participants: MD 0.01, 95% CI ‐0.02 to 0.03; I2 = 70%) or carbon dioxide partial pressure (3 studies, 151 participants: MD ‐1.04, 95% CI ‐3.84 to 1.76; I2 = 83%). A single study reported fewer cardiovascular events (RR 0.39, 95% CI 0.20 to 0.79), higher mean arterial pressure (10.25 mm Hg, 95% CI 6.68 to 13.82) and less hypotensive events (RR 0.44, 95% CI 0.26 to 0.75) in patients receiving bicarbonate‐buffered solutions. One study reported no significant difference in central venous pressure (MD 2.00 cm H2O, 95% CI ‐0.7 to, 4.77). Total length of hospital and ICU stay and relapse were not reported by any of the included studies.
Authors' conclusions
There were no significant different between bicarbonate‐ and lactate‐buffered solutions for mortality, serum bicarbonate levels, serum creatinine, serum base excess, serum pH, carbon dioxide partial pressure, central venous pressure and serum electrolytes. Patients treated with bicarbonate‐buffered solutions may experience fewer cardiovascular events, lower serum lactate levels, higher mean arterial pressure and less hypotensive events. With the exception of mortality, we were not able to assess the main primary outcomes of this review ‐ length of time in ICU, total length of hospital stay and relapse.
PICO
Plain language summary
Bicarbonate‐ versus lactate‐buffered solutions for acute continuous haemodiafiltration or haemofiltration
People with acute kidney injury (AKI) have serious loss of kidney function and are unable to rid wastes from the body in urine. People with AKI need dialysis (haemofiltration) which requires use of buffered solutions (dialysates) to rid waste from their blood. Different dialysates can have various effects on the balance of blood chemistry. Maintaining balanced blood chemistry helps to reduce risks of heart, blood circulation and blood pressure problems. We assessed the benefits and harms of bicarbonate‐buffered solutions and lactate‐buffered solutions by analysing results from four randomised controlled studies that together involved 171 participants. The evidence was flawed by study design and reporting problems, and the small number of people in the studies. Based on limited evidence from one study (117 participants), we found that people treated with bicarbonate‐buffered solutions may experience fewer heart and blood circulation problems and high blood pressure events. The studies did not include enough evidence to make recommendations about the use of these solutions.
Authors' conclusions
Summary of findings
| Bicarbonate‐ versus lactate‐buffered solutions for acute continuous haemodiafiltration or haemofiltration | ||||||
| Patient or population: patients with acute kidney injury Intervention: bicarbonate‐buffered solutions Comparison: lactate‐buffered solutions | ||||||
| Outcomes | Illustrative comparative risks* (95% CI) | Relative effect | No of participants | Quality of the evidence | Comments | |
| Assumed risk | Corresponding risk | |||||
| Lactate‐buffered solutions | Bicarbonate‐buffered solutions | |||||
| Mortality | 392 per 1000 (38 to 398) | 298 per 1000 | RR 0.76 (0.5 to 1.15) | 163 (3) | ⊕⊕⊕⊝ | |
| Serum bicarbonate (mmol/L) | The mean serum bicarbonate was 0.33 mmol/L higher with bicarbonate‐buffered solutions (1.59 lower to 2.25 higher) | 163 (3) | ⊕⊕⊝⊝ | |||
| Serum creatinine (µmol/L) | The mean serum creatinine was 18.25 µmol/L lower with bicarbonate‐buffered solutions (123.77 lower to 87.28 higher) | 137 (2) | ⊕⊕⊝⊝ | |||
| Serum lactate (mmol/L) | The mean serum lactate was 1.13 mmol/L lower with bicarbonate‐buffered solutions (1.32 to 0.94 lower) | 171 (4) | ⊕⊕⊕⊝ | |||
| Serum base excess | The mean serum base excess was 0.9 higher with bicarbonate‐buffered solutions (0.83 lower to 2.62 higher) | 145 (3) | ⊕⊕⊝⊝ | |||
| Serum pH | The mean serum pH was 0.00 higher with bicarbonate‐buffered solutions (0.03 lower to 0.04 higher) | 171 (4) | ⊕⊕⊝⊝ | |||
| pCO2 | The mean pCO2 was 0.82 lower with bicarbonate‐buffered solutions (3.22 lower to 1.58 higher) | 151 (3) | ⊕⊕⊝⊝ | |||
| Hypotensive events | 518 per 1000 | 230 per 1000 | RR 0.44 (0.26 to 0.75) | 20 (1) | ⊕⊕⊕⊝ | Based on one small study |
| Cardiovascular complications | 375 per 1000 | 148 per 1000 | RR 0.39 ( | 20 (1) | ⊕⊕⊕⊝ | Based on one small study |
| *The basis for the assumed risk (e.g. the median control group risk across studies) is provided in footnotes. The corresponding risk (and its 95%CI) is based on the assumed risk in the comparison group and the relative effect of the intervention (and its 95% CI). | ||||||
| GRADE Working Group grades of evidence | ||||||
Background
Description of the condition
Acute kidney injury (AKI) is a complex disorder for which there is currently no globally accepted definition. For this review we defined AKI diagnosis as: an abrupt (within 48 hours) reduction in kidney function marked by an absolute increase in serum creatinine (SCr) ≥ 0.3 mg/dL (≥ 26.4 μmol/L); a percentage increase in SCr of ≥ 50% (1.5‐fold increase from baseline); and reduction in urine output (documented oliguria of < 0.5 mL/kg/h for more than six hours) (Mehta 2007; Thadhani 1996).
AKI is often associated with electrolyte disturbances and loss of fluid homeostasis and causes can be categorised broadly as prerenal, postrenal and intrinsic renal (Lamiere 2005). Prerenal AKI results from decreased blood supply to the kidneys (Santacruz 1996); postrenal AKI is caused by urinary tract obstruction (Liano 1996); and intrarenal AKI results from direct kidney injury (Needham 2005). AKI is present in 1% to 5% of patients at hospital admission (Kaufman 1991) and affects 15% to 20% of patients in intensive care units (ICU); reported mortality rates range from 50% to 70% in these patients (Albright 2001; Singri 2003; Thadhani 1996). Infection and cardiorespiratory complications are the most common causes of death among patients with AKI (Needham 2005). Mortality rates have been relatively static over the past few decades despite significant advances in supportive care. Lack of improvement in mortality rates may be more apparent than real because it is currently common for patients to be older and have more pre‐existing chronic health problems than previously (Jaber 2004). The long‐term effects of AKI are indistinct and controversial because of the diverse (and in many cases multiple) causes of the disease and the paucity of long‐term follow‐up studies. However, the view that kidney recovery is complete is simplistic, and progressive kidney dysfunction after severe AKI is commonly observed. AKI is irreversible in 5% of patients, but in elderly people the proportion is as high as 16% (Bhandari 1996). Recent reports in children suggest that residual damage after AKI develops into progressive kidney failure by adolescence or early adulthood (Bhandari 1996; Lamiere 2005; Polito 1998).
Description of the intervention
Haemofiltration (HF) and haemodiafiltration (HDF) are renal replacement therapy methods. HDF combines both haemodialysis and HF. Haemodialysis is an extremely efficient method of removing low molecular weight toxins, while HF is more efficient at the removal of higher molecular weight toxins. With HF dialysate solution is not used, instead positive pressure drives water and dissolved toxins across the filter membrane from the blood side to the filtrate compartment. In haemodialysis, solutes and water are cleared from patients’ blood by movement across a semi‐permeable membrane. It has been suggested that HF and HDF may reduce the frequency and severity of intradialytic and post‐dialytic adverse symptoms and may be more effective than haemodialysis in the removal of high molecular weight molecules (Rabindranath 2006). HDF and HF use different replacement fluids to influence the acid‐base values, dialysate solutions can be a lactate‐ or bicarbonate‐based buffer (Kierdorf 1995). If patients with reduced lactate metabolism (e.g. concomitant severe liver failure, after liver transplantation or in lactic acidosis), bicarbonate‐buffered solutions should be used. In nearly all other cases of critically ill patients with AKI, lactate‐buffered solutions may be used as well as bicarbonate solutions (Kierdorf 1999). Therefore, different compositions of the buffers may be used in different patients.
How the intervention might work
HDF and HF appear to have a significant and variable impact on the concentration of several electrolytes and acid‐base balance (Heering 1999), which is likely in part, to depend on the composition of the dialysate. HD and HF solutions are used as buffers to correct acidosis (Macias 1996). HDF and HF are the most efficient blood purification method and characterised by using external substitution fluid provided as a sterile solution and can remove a wide spectrum of solutes of different molecular weights (Ledebo 1998; Ledebo 2010; Nagaoka 2011; Woods 2000). In Europe and Australia the dominant commercially available dialysates are either lactate‐buffered or bicarbonate‐buffered (Tan 2003), with a similar situation in China (Zhu 2000). Bicarbonate‐buffered solutions were developed as an outcome from the introduction of two‐chambered bag systems that separate calcium and magnesium from bicarbonate. These systems have been shown to improve peritoneal cell function (Dratwa 2003). Before bicarbonate‐buffered solutions were introduced, lactate‐buffered solutions had been used as the standard dialysate solution. Lactate‐buffered solutions can be converted to bicarbonate by using a pyruvate dehydrogenase enzyme mostly in liver and muscle tissue (Uchino 2005).
Why it is important to do this review
Various buffered dialysate solutions are likely to have different effects on acid‐base physiology and several electrolytes, and these differences may affect electrolyte mass balance (Tan 2003). To help avoid unnecessary investigations or interventions it is important that clinicians be aware of any differences attributable to buffered dialysates when unexplained changes in serum electrolyte concentrations occur over time in people undergoing continuous RRT (CRRT). The effectiveness and safety of lactate‐buffered and bicarbonate‐buffered solutions need to be reviewed and critically appraised to inform current practice.
Objectives
To assess the benefits and harms of bicarbonate‐ versus lactate‐buffered solutions for HDF or HF for treating people with AKI.
Methods
Criteria for considering studies for this review
Types of studies
All randomised controlled trials (RCTs) and quasi‐RCTs (in which allocation to treatment was obtained by alternation, use of alternate medical records, date of birth or other predictable methods) that investigated the use of bicarbonate‐buffered and lactate‐buffered HF solutions in patients with AKI were included. The first phase of cross‐over RCTs were also included.
Types of participants
Inclusion criteria
Adults and children with AKI estimated by either SCr, creatinine clearance (CrCl) or glomerular filtration rate (GFR) measurement.
AKI was defined as: an increase in SCr of 0.3 mg/dL over the baseline value, an increase > 50% over the baseline value, a reduction in the calculated CrCl > 50%, or a decrease in kidney function that resulted in need for HDF or HF.
Exclusion criteria
Patients with known chronic kidney disease (stages 4, 5 and 5D).
Types of interventions
Bicarbonate‐buffered dialysate versus lactate‐buffered dialysate.
Types of outcome measures
Primary outcomes
-
Mortality: death before ICU discharge; death before hospital discharge
-
Length of time in ICU
-
Total length of hospital stay
-
Relapse: return of signs or symptoms following RRT.
Secondary outcomes
-
Kidney function measures (CrCl, SCr, proteinuria, dialysis, GFR)
-
Clinical and biochemical parameters (e.g. blood pressure (BP); central venous pressure (CVP cm H2O); acid‐base balance (pH); partial pressure of carbon dioxide (pCO2); serum electrolytes (sodium, potassium, chloride, magnesium, phosphate); serum lactate and serum bicarbonate)
-
Adverse events (e.g. hyperkalaemia)
-
Economic outcomes.
Search methods for identification of studies
Electronic searches
We searched the Cochrane Renal Group's Specialised Register up to 6 January 2015 through contact with the Trials' Search Co‐ordinator using search terms relevant to this review. The Cochrane Renal Group’s Specialised Register contains studies identified from the following sources.
-
Quarterly searches of the Cochrane Central Register of Controlled Trials CENTRAL
-
Weekly searches of MEDLINE OVID SP
-
Handsearching of renal‐related journals & the proceedings of major renal conferences
-
Searching of the current year of EMBASE OVID SP
-
Weekly current awareness alerts for selected renal‐journals
-
Searches of the International Clinical Trials Register (ICTRP) Search Portal & ClinicalTrials.gov.
Studies contained in the Specialised Register are identified through search strategies for CENTRAL, MEDLINE, and EMBASE based on the scope of the Cochrane Renal Group. Details of these strategies as well as a list of handsearched journals, conference proceedings and current awareness alerts are available in the Specialised Register section of information about the Cochrane Renal Group.
We also searched the Chinese Biomedical Literature Database (CBMD) (1978 to May 2009). The search terms used were similar to MEDLINE.
See Appendix 1 for search terms used in for the various strategies for this review.
Searching other resources
-
Reference lists of nephrology textbooks, review articles and relevant studies.
-
Letters seeking information about unpublished or incomplete studies to investigators known to be involved in previous studies.
Data collection and analysis
Selection of studies
The search strategy described was applied to obtain titles and abstracts of studies with potential relevance to the review. Titles and abstracts were screened independently by two authors who discarded studies that were not applicable; however, studies and reviews that may have included relevant data or information on studies were retained initially. Two authors independently assessed retrieved abstracts, and if necessary the full text, of studies to determine which satisfied the inclusion criteria.
Data extraction and management
Data extraction was performed by two authors who worked independently and used standard data extraction forms. Studies reported in non‐English language journals were translated before assessment. Where more than one publication of one study was identified, reports were grouped together and the most recent or most complete data set used. Any discrepancies between published versions were highlighted. Any further information required from original investigators was requested by written correspondence and any relevant information obtained in this manner was included in the review. Disagreements were resolved through consultation with two authors.
Assessment of risk of bias in included studies
The following items were assessed using the risk of bias assessment tool (Higgins 2011) (see Appendix 1).
-
Was there adequate sequence generation?
-
Was allocation adequately concealed?
-
Was knowledge of the allocated interventions adequately prevented during the study?
-
Were incomplete outcome data adequately addressed?
-
Are reports of the study free of suggestion of selective outcome reporting?
-
Was the study apparently free of other problems that could put it at a risk of bias?
Measures of treatment effect
For dichotomous outcomes (such as mortality and adverse events) results were expressed as risk ratio (RR) with 95% confidence intervals (CI). Where continuous scales of measurement were used to assess the effects of treatment (such as SCr levels and length of hospital stay), the mean difference (MD) was calculated, or the standardised mean difference (SMD) if conversion to the same unit was not possible and different scales had been used.
Assessment of heterogeneity
Heterogeneity was analysed using a Chi² test on N‐1 degrees of freedom, with an alpha of 0.05 used for statistical significance and with the I² test (Higgins 2003). I² values of 25%, 50% and 75% correspond to low, medium and high levels of heterogeneity.
Data synthesis
Data were pooled using the random‐effects model, but the fixed‐effect model was also used analysed to ensure robustness of the model chosen and susceptibility to outliers.
Subgroup analysis and investigation of heterogeneity
If data were available, we planned the following subgroup analyses.
-
Participants (adults versus children)
-
Types of studies (cross‐over RCTs versus parallel RCTs).
Because of the small number of studies identified, we only performed subgroup analysis on mortality.
Results
Description of studies
Results of the search
The electronic searches yielded items from MEDLINE (66), EMBASE (243), CENTRAL (15), CBMD (3) and the Renal Register (65). A total of 286 unique reports (publications and abstracts) were identified. After screening titles and abstracts, 39 were retrieved as full text assessment. We identified four studies (12 reports) that were included in this review (Barenbrock 2000; Kierdorf 1995; Tan 2003; Zimmerman 1999) (Figure 1).

Study flow diagram
Included studies
See: Characteristics of included studies.
Design
One study was a parallel RCT (Barenbrock 2000) and three were cross‐over RCTs (Kierdorf 1995; Tan 2003; Zimmerman 1999). Two were multicentre studies (Barenbrock 2000; Zimmerman 1999).
Sample sizes
A total of 171 participants were enrolled in the four included studies. Sample sizes ranged from 8 to 117 participants.
Location
Two studies were conducted in Germany (Barenbrock 2000; Kierdorf 1995), one in Canada (Zimmerman 1999), and one in Australia (Tan 2003).
Setting
Three studies were conducted in ICUs (Barenbrock 2000; Tan 2003; Zimmerman 1999). Kierdorf 1995 did not report the setting.
Participants
All 171 participants underwent continuous venovenous haemofiltration (CVVH). Three studies restricted participants to those with AKI (Barenbrock 2000; Kierdorf 1995; Zimmerman 1999); Tan 2003 enrolled participants with severe AKI.
Interventions
Four studies reported concentrations of dialysate concentrations (Barenbrock 2000; Kierdorf 1995; Tan 2003; Zimmerman 1999) and two studies reported dialysate manufacturers (Barenbrock 2000; Zimmerman 1999) (see Table 1).
| Study | Bicarbonate solutions | Lactate solutions | ||
| Concentrations | Manufacturer | Concentrations | Manufacturer | |
| 140 mmol Na+, 109 mmol CI‐, 35 mmol HCO3‐, 1.5 mmol Ca2+, 0.5 mmol Mg2+, 5.6 mmol glucose | Fresenius Medical Care (Bad Homburg, Germany) | 135 mmol Na+, 106.5 mmol CI‐, 1.88 mmol Ca2+, 0.75 mmol Mg2+, 7.5 mmol glucose, 33.75 mmol lactate | Fresenius Medical Care (Bad Homburg, Germany) | |
| 140 mmol Na+, 110 mmol CI‐, 34.5 mmol HCO3‐, 3 mmol lactate, 1.75 mmol Ca2+, 0.5 mmol Mg2+, 5.6 mmol glucose | Schiwa (Glandorf, Germany) | 142 mmol Na+, 103 mmol CI‐, 44.5 mmol lactate, 2.0 mmol Ca2+, 0.75 mmol Mg2+, 5.6 mmol glucose | Schiwa (Glandorf, Germany) | |
| 140 mmol Na+, 109.5 mmol CI‐, 1.75 mmol Ca2+, 0.5 mmol Mg2+, 32 mmol bicarbonate, 3 mmol lactate | Not reported | 140 mmol Na+, 1 mmol K+, 100 mmol CI‐, 46 mmol lactate, 1.6 mmol Ca2+, 0.8 mmol Mg2+, 32 mmol bicarbonate, 10.8 mmol glucose | Not reported | |
| 140 mmol Na+, 106.5 mmol CI‐, 0.75 mmol Mg2+, 35 mmol bicarbonate | Dianeal (Baxter, Toronto, Canada) | 132 mmol Na+, 102 mmol CI‐, 35 mmol lactate, 1.75 mmol Ca2+, 0.75 mmol Mg2+, 83 mmol glucose | Normocarb (Vaughan, Canada) | |
Ca ‐ calcium; Cl ‐ chlorine; K ‐ potassium; HCO3‾ ‐ bicarbonate; Mg ‐ magnesium; Na ‐ sodium
Excluded studies
We excluded the 26 studies based on the full text because they were: not RCTs (7); the wrong intervention (14); and the wrong patient population (5).
Risk of bias in included studies

Risk of bias graph: review authors' judgements about each risk of bias item presented as percentages across all included studies.
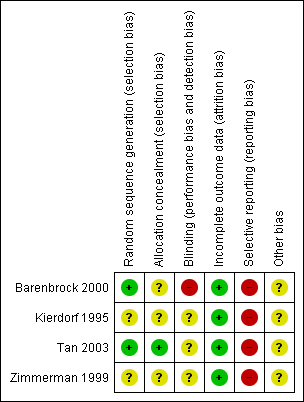
Risk of bias summary: review authors' judgements about each risk of bias item for each included study.
Allocation
Random sequence generation
Two studies used either random number tables (Tan 2003) or a computer program (Barenbrock 2000). The remaining two studies stated the studies were randomised but did not specify the methods used.
Allocation concealment
Tan 2003 used sealed opaque envelopes. The remaining three studies did not report the method of allocation concealment.
Blinding
Blinding of personnel, participants or outcome assessors was not reported in the four studies; Barenbrock 2000 stated blinding was not possible and was judged to be at high risk of bias.
Incomplete outcome data
All four studies accounted for all patients.
Selective reporting
Three studies reported one of our primary outcomes (mortality) (Barenbrock 2000; Kierdorf 1995; Zimmerman 1999); Tan 2003 reported four patients died at the end of the study but these data could not be meta‐analysed. Two studies reported SCr (Barenbrock 2000; Kierdorf 1995); none of the studies reported CrCl, proteinuria, dialysis, or GFR.
Other potential sources of bias
None of the studies reported their source of funding.
Effects of interventions
See: Summary of findings for the main comparison
Primary outcomes
Mortality
Three studies reported mortality (Barenbrock 2000; Kierdorf 1995; Zimmerman 1999). There were no significant differences in mortality between bicarbonate‐buffered dialysate and lactate‐buffered dialysate (Analysis 1.1 (3 studies, 163 participants): RR 0.76, 95% CI 0.50 to 1.15; I2 = 0%), either in the randomised cross‐over studies (Analysis 1.1.1 (2 studies, 46 participants): RR 0.72, 95% CI 0.27 to 1.90; I2 = 0%), or in the parallel RCT (Analysis 1.1.2 (1 study, 117 participants): 0.77, 95% CI 0.48 to 1.22). Tan 2003 reported four patients died at the end of the study.
Total length of hospital and ICU stay
Total hospital and ICU lengths of stay were not reported in any of the included studies.
Relapse
Relapse data were not reported in any of the included studies.
Secondary outcomes
Kidney function measures
CrCl, proteinuria, dialysis, and GFR were not reported in any of the included studies.
Serum creatinine
Two studies reported SCr levels (Barenbrock 2000; Kierdorf 1995). There was no significant difference in SCr levels between patients receiving bicarbonate‐buffered dialysate and lactate‐buffered dialysate (Analysis 1.2 (2 studies, 137 participants): MD ‐22.81 µmol/L, 95% CI ‐129.61 to 83.99; I2 = 73%). Heterogeneity was high.
Clinical and biochemical parameters
Blood pressure
Three studies reported blood pressure (Barenbrock 2000; Kierdorf 1995; Zimmerman 1999); only data from Barenbrock 2000 and Zimmerman 1999 could be extracted (Kierdorf 1995 reported mean arterial pressure was the same in both groups). Barenbrock 2000 reported no significant difference in either diastolic (Analysis 1.3.1 (1 study, 117 participants): ‐5.00 mm Hg, 95% CI ‐14.80 to 4.80) or systolic BP ((Analysis 1.3.2 (1 study, 117 participants): 2.00 mm Hg, 95% CI ‐3.54 to 7.54). Zimmerman 1999 reported mean arterial pressure was significantly higher in the bicarbonate group (Analysis 1.3.3 (1 study, 26 participants): 10.25 mm Hg, 95% CI 6.68 to 13.82).
Serum bicarbonate
Three studies reported serum bicarbonate levels (Barenbrock 2000; Kierdorf 1995; Zimmerman 1999). There was no significant difference in serum bicarbonate levels between bicarbonate‐buffered versus lactate‐buffered dialysate (Analysis 1.4 (3 studies, 163 participants): MD 0.27 mmol/L, 95% CI ‐1.45 to 1.99; I2 = 78%). The high heterogeneity was attributed to Barenbrock 2000. When this study was removed there was still no significant difference in serum bicarbonate levels between bicarbonate‐buffered and lactate‐buffered dialysate (MD ‐0.38 mmol/L, 95% CI ‐1.26 to 0.51; I2 = 0%).
Serum lactate
Four studies reported serum lactate levels (Barenbrock 2000; Kierdorf 1995; Tan 2003; Zimmerman 1999). Serum lactate levels were significantly lower in the bicarbonate group compared to the lactate group (Analysis 1.5 (4 studies, 171 participants): MD ‐1.09 mmol/L, 95% CI ‐1.30 to ‐0.87; I2 = 0%).
Serum base excess
Three studies reported mean serum base excess (Barenbrock 2000; Kierdorf 1995; Tan 2003). There was no significant difference in mean serum base excess between bicarbonate‐buffered dialysate and lactate‐buffered dialysate (Analysis 1.6 (3 studies, 145 participants): MD 0.80, 95% CI ‐0.91 to 2.50; I2 = 38%).
Serum pH
Four studies reported serum pH (Barenbrock 2000; Kierdorf 1995; Tan 2003; Zimmerman 1999). There was no significant difference in serum pH between bicarbonate‐buffered dialysate and lactate‐buffered dialysate (Analysis 1.7 (4 studies, 171 participants): MD 0.01, 95% CI ‐0.02 to 0.03, P = 0.78; I2 = 70%). The high heterogeneity could not be attributed to any one study and there was no change in the MD.
Carbon dioxide partial pressure
Three studies reported pCO2 (Barenbrock 2000; Tan 2003; Zimmerman 1999). There was no significant difference in pCO2 between bicarbonate‐buffered dialysate and lactate‐buffered dialysate (Analysis 1.8 (3 studies, 151 participants): MD ‐1.04, 95% CI ‐3.84 to 1.76, P = 0.50; I2 = 83%). The high heterogeneity could be attributed to Zimmerman 1999 and when removed from the analysis, pCO2 was significantly increased with lactate‐buffered dialysate (MD ‐0.21, 95% CI ‐1.09 to 1.52, I2 = 0%).
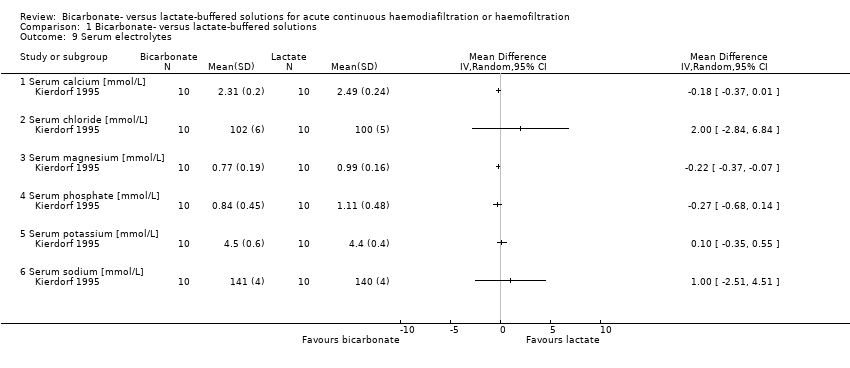
Serum electrolytes
Two studies reported serum electrolytes (Kierdorf 1995; Zimmerman 1999). Zimmerman 1999, a cross‐over study, reported only end‐of‐study data. Kierdorf 1995 showed that there were no significant differences between the groups for serum calcium, serum chloride, serum phosphate, serum potassium and serum sodium levels, but there was a significant decrease in serum magnesium in the bicarbonate‐buffered dialysate group (Analysis 1.9.3 (1 study, 20 participants): MD ‐0.22, 95% CI ‐0.37 to ‐0.07).
Hypotensive events
Barenbrock 2000 reported the number of hypotensive episodes was significantly lower in bicarbonate‐buffered dialysate treated patients compared with those treated with lactate‐buffered dialysate (Analysis 1.10 (1 study, 117 participants): RR 0.44, 95% CI 0.26 to 0.75).
Central venous pressure
Barenbrock 2000 reported no significant difference in CVP between bicarbonate‐buffered dialysate and lactate‐buffered dialysate (Analysis 1.11 (1 study, 117 participants): MD 2.00 cm H20, 95% CI ‐0.77 to 4.77).
Adverse events
Cardiovascular complications
Barenbrock 2000 reported the number of cardiovascular complications was significantly lower in the group treated with bicarbonate‐buffered dialysate than in the group treated with lactate‐buffered dialysate (Analysis 1.12 (1 study, 117 participants): RR 0.39, 95% CI 0.20 to 0.79).
Hyperkalaemia
Hyperkalaemia was not reported in any of the included studies.
Economic outcomes
Economic outcomes were not reported in any of the included studies.
Discussion
Summary of main results
There were no significant different between bicarbonate‐ and lactate‐buffered solutions for mortality, serum bicarbonate levels, SCr, serum base excess, serum pH, carbon dioxide partial pressure, central venous pressure and serum electrolytes. Patients treated with bicarbonate‐buffered solutions may experience fewer cardiovascular events, lower serum lactate levels, higher mean arterial pressure and less hypotensive events. With the exception of mortality, we were not able to assess the main primary outcomes of this review ‐ length of time in ICU, total length of hospital stay and relapse.
Overall, there was insufficient evidence to support a clinical advantage for either bicarbonate‐ or lactate‐buffered solutions for acute continuous HDF or HF.
Overall completeness and applicability of evidence
We planned to include all patients (adults or children) with AKI, regardless of gender, severity of AKI or age, however only older patients were included. Tan 2003 included participants with severe AKI and the other studies did not report the type of patients enrolled. Therefore, these findings might not apply to the patient with severe AKI or children. Three studies were conducted in ICUs (Barenbrock 2000; Tan 2003; Zimmerman 1999); one study did not report the setting. While we did not limit the language all studies were reported in English, which might limit the applicability of this review. We were unable to address all of the objectives of this review, because the results were based on only four studies (too small a sample to detect relevant differences between effects of treatment). Not all the studies reported our outcomes, in particular our primary outcomes (mortality, length of time in ICU, total length of hospital stay and relapse). Therefore, any further studies conducted in this area must be well‐designed RCTs which assess these outcomes.
Quality of the evidence
The quality of the evidence was not high, because randomisation methods and sequence generation were either poorly reported or absent, blinding was not reported, allocation concealment was poorly administered and reported, assessment of selective outcome reporting could not be undertaken because of the lack of information reported in the studies. We were not able to obtain further data from the study authors (Risk of bias in included studies). The number of patients enrolled in the four studies was very small, and the results of these four studies may be influenced by potential biases (the four eligible studies included only 171 patients), and the use of the cross‐over design. Many of the excluded studies did not employ random allocation of participants, whilst others did not use a prospective design. Future research should seek to address these methodological limitations in large, multi‐centre RCTs.
Potential biases in the review process
Our systematic review had some limitations. First, none of the studies in our systematic review reported data on cost‐effectiveness of bicarbonate‐ versus lactate‐buffered solutions for acute continuous HDF or HF. Second, there were only four studies that could be included in the analysis, which reduces the evaluation power and increases the possibility of publication bias. Third, it is possible that we have not identified all the relevant studies from computerised searching. Fourth, we acknowledge that our results may have been affected by the quality of study, blinding process, and other procedures. Fifth, this review may suffer from reporting bias, as we found no measurable data on most of the main outcomes and adverse events. Sixth, publication bias probably existed, although we did not assess this in detail because of the small numbers of studies that could be pooled.
Agreements and disagreements with other studies or reviews
There are no other systematic reviews on this subject, our review provides evidence derived from four studies, the results of the individual studies and the pooled analysis are similar. Our results for the main outcome, mortality, is similar to the findings from the included studies; further research is still needed.

Study flow diagram

Risk of bias graph: review authors' judgements about each risk of bias item presented as percentages across all included studies.

Risk of bias summary: review authors' judgements about each risk of bias item for each included study.

Comparison 1 Bicarbonate‐ versus lactate‐buffered solutions, Outcome 1 Mortality.

Comparison 1 Bicarbonate‐ versus lactate‐buffered solutions, Outcome 2 Serum creatinine.

Comparison 1 Bicarbonate‐ versus lactate‐buffered solutions, Outcome 3 Blood pressure.

Comparison 1 Bicarbonate‐ versus lactate‐buffered solutions, Outcome 4 Serum bicarbonate.

Comparison 1 Bicarbonate‐ versus lactate‐buffered solutions, Outcome 5 Serum lactate.

Comparison 1 Bicarbonate‐ versus lactate‐buffered solutions, Outcome 6 Serum base excess.

Comparison 1 Bicarbonate‐ versus lactate‐buffered solutions, Outcome 7 Serum pH.

Comparison 1 Bicarbonate‐ versus lactate‐buffered solutions, Outcome 8 carbon dioxide partial pressure.
Comparison 1 Bicarbonate‐ versus lactate‐buffered solutions, Outcome 9 Serum electrolytes.

Comparison 1 Bicarbonate‐ versus lactate‐buffered solutions, Outcome 10 Hypotensive events.

Comparison 1 Bicarbonate‐ versus lactate‐buffered solutions, Outcome 11 Central venous pressure.

Comparison 1 Bicarbonate‐ versus lactate‐buffered solutions, Outcome 12 Cardiovascular complications.
| Bicarbonate‐ versus lactate‐buffered solutions for acute continuous haemodiafiltration or haemofiltration | ||||||
| Patient or population: patients with acute kidney injury Intervention: bicarbonate‐buffered solutions Comparison: lactate‐buffered solutions | ||||||
| Outcomes | Illustrative comparative risks* (95% CI) | Relative effect | No of participants | Quality of the evidence | Comments | |
| Assumed risk | Corresponding risk | |||||
| Lactate‐buffered solutions | Bicarbonate‐buffered solutions | |||||
| Mortality | 392 per 1000 (38 to 398) | 298 per 1000 | RR 0.76 (0.5 to 1.15) | 163 (3) | ⊕⊕⊕⊝ | |
| Serum bicarbonate (mmol/L) | The mean serum bicarbonate was 0.33 mmol/L higher with bicarbonate‐buffered solutions (1.59 lower to 2.25 higher) | 163 (3) | ⊕⊕⊝⊝ | |||
| Serum creatinine (µmol/L) | The mean serum creatinine was 18.25 µmol/L lower with bicarbonate‐buffered solutions (123.77 lower to 87.28 higher) | 137 (2) | ⊕⊕⊝⊝ | |||
| Serum lactate (mmol/L) | The mean serum lactate was 1.13 mmol/L lower with bicarbonate‐buffered solutions (1.32 to 0.94 lower) | 171 (4) | ⊕⊕⊕⊝ | |||
| Serum base excess | The mean serum base excess was 0.9 higher with bicarbonate‐buffered solutions (0.83 lower to 2.62 higher) | 145 (3) | ⊕⊕⊝⊝ | |||
| Serum pH | The mean serum pH was 0.00 higher with bicarbonate‐buffered solutions (0.03 lower to 0.04 higher) | 171 (4) | ⊕⊕⊝⊝ | |||
| pCO2 | The mean pCO2 was 0.82 lower with bicarbonate‐buffered solutions (3.22 lower to 1.58 higher) | 151 (3) | ⊕⊕⊝⊝ | |||
| Hypotensive events | 518 per 1000 | 230 per 1000 | RR 0.44 (0.26 to 0.75) | 20 (1) | ⊕⊕⊕⊝ | Based on one small study |
| Cardiovascular complications | 375 per 1000 | 148 per 1000 | RR 0.39 ( | 20 (1) | ⊕⊕⊕⊝ | Based on one small study |
| *The basis for the assumed risk (e.g. the median control group risk across studies) is provided in footnotes. The corresponding risk (and its 95%CI) is based on the assumed risk in the comparison group and the relative effect of the intervention (and its 95% CI). | ||||||
| GRADE Working Group grades of evidence | ||||||
| Study | Bicarbonate solutions | Lactate solutions | ||
| Concentrations | Manufacturer | Concentrations | Manufacturer | |
| 140 mmol Na+, 109 mmol CI‐, 35 mmol HCO3‐, 1.5 mmol Ca2+, 0.5 mmol Mg2+, 5.6 mmol glucose | Fresenius Medical Care (Bad Homburg, Germany) | 135 mmol Na+, 106.5 mmol CI‐, 1.88 mmol Ca2+, 0.75 mmol Mg2+, 7.5 mmol glucose, 33.75 mmol lactate | Fresenius Medical Care (Bad Homburg, Germany) | |
| 140 mmol Na+, 110 mmol CI‐, 34.5 mmol HCO3‐, 3 mmol lactate, 1.75 mmol Ca2+, 0.5 mmol Mg2+, 5.6 mmol glucose | Schiwa (Glandorf, Germany) | 142 mmol Na+, 103 mmol CI‐, 44.5 mmol lactate, 2.0 mmol Ca2+, 0.75 mmol Mg2+, 5.6 mmol glucose | Schiwa (Glandorf, Germany) | |
| 140 mmol Na+, 109.5 mmol CI‐, 1.75 mmol Ca2+, 0.5 mmol Mg2+, 32 mmol bicarbonate, 3 mmol lactate | Not reported | 140 mmol Na+, 1 mmol K+, 100 mmol CI‐, 46 mmol lactate, 1.6 mmol Ca2+, 0.8 mmol Mg2+, 32 mmol bicarbonate, 10.8 mmol glucose | Not reported | |
| 140 mmol Na+, 106.5 mmol CI‐, 0.75 mmol Mg2+, 35 mmol bicarbonate | Dianeal (Baxter, Toronto, Canada) | 132 mmol Na+, 102 mmol CI‐, 35 mmol lactate, 1.75 mmol Ca2+, 0.75 mmol Mg2+, 83 mmol glucose | Normocarb (Vaughan, Canada) | |
| Ca ‐ calcium; Cl ‐ chlorine; K ‐ potassium; HCO3‾ ‐ bicarbonate; Mg ‐ magnesium; Na ‐ sodium | ||||
| Outcome or subgroup title | No. of studies | No. of participants | Statistical method | Effect size |
| 1 Mortality Show forest plot | 3 | 163 | Risk Ratio (M‐H, Random, 95% CI) | 0.76 [0.50, 1.15] |
| 1.1 Cross‐over RCTs | 2 | 46 | Risk Ratio (M‐H, Random, 95% CI) | 0.72 [0.27, 1.90] |
| 1.2 Parallel RCTs | 1 | 117 | Risk Ratio (M‐H, Random, 95% CI) | 0.77 [0.48, 1.22] |
| 2 Serum creatinine Show forest plot | 2 | 137 | Mean Difference (IV, Random, 95% CI) | ‐22.81 [‐129.61, 83.99] |
| 3 Blood pressure Show forest plot | 2 | Mean Difference (IV, Random, 95% CI) | Totals not selected | |
| 3.1 Systolic blood pressure | 1 | Mean Difference (IV, Random, 95% CI) | 0.0 [0.0, 0.0] | |
| 3.2 Diastolic blood pressure | 1 | Mean Difference (IV, Random, 95% CI) | 0.0 [0.0, 0.0] | |
| 3.3 MAP | 1 | Mean Difference (IV, Random, 95% CI) | 0.0 [0.0, 0.0] | |
| 4 Serum bicarbonate Show forest plot | 3 | 163 | Mean Difference (IV, Random, 95% CI) | 0.27 [‐1.45, 1.99] |
| 5 Serum lactate Show forest plot | 4 | 171 | Mean Difference (IV, Random, 95% CI) | ‐1.09 [‐1.30, ‐0.87] |
| 6 Serum base excess Show forest plot | 3 | 145 | Mean Difference (IV, Random, 95% CI) | 0.80 [‐0.91, 2.50] |
| 7 Serum pH Show forest plot | 4 | 171 | Mean Difference (IV, Random, 95% CI) | 0.01 [‐0.02, 0.03] |
| 8 carbon dioxide partial pressure Show forest plot | 3 | 151 | Mean Difference (IV, Random, 95% CI) | ‐1.04 [‐3.84, 1.76] |
| 9 Serum electrolytes Show forest plot | 1 | Mean Difference (IV, Random, 95% CI) | Totals not selected | |
| 9.1 Serum calcium [mmol/L] | 1 | Mean Difference (IV, Random, 95% CI) | 0.0 [0.0, 0.0] | |
| 9.2 Serum chloride [mmol/L] | 1 | Mean Difference (IV, Random, 95% CI) | 0.0 [0.0, 0.0] | |
| 9.3 Serum magnesium [mmol/L] | 1 | Mean Difference (IV, Random, 95% CI) | 0.0 [0.0, 0.0] | |
| 9.4 Serum phosphate [mmol/L] | 1 | Mean Difference (IV, Random, 95% CI) | 0.0 [0.0, 0.0] | |
| 9.5 Serum potassium [mmol/L] | 1 | Mean Difference (IV, Random, 95% CI) | 0.0 [0.0, 0.0] | |
| 9.6 Serum sodium [mmol/L] | 1 | Mean Difference (IV, Random, 95% CI) | 0.0 [0.0, 0.0] | |
| 10 Hypotensive events Show forest plot | 1 | Risk Ratio (M‐H, Random, 95% CI) | Totals not selected | |
| 11 Central venous pressure Show forest plot | 1 | Mean Difference (IV, Random, 95% CI) | Totals not selected | |
| 12 Cardiovascular complications Show forest plot | 1 | Risk Ratio (M‐H, Random, 95% CI) | Totals not selected | |