Soluciones amortiguadoras con bicarbonato versus lactato para la hemofiltración o la hemodiafiltración continuas agudas
Información
- DOI:
- https://doi.org/10.1002/14651858.CD006819.pub2Copiar DOI

- Base de datos:
-
- Cochrane Database of Systematic Reviews
- Versión publicada:
-
- 05 marzo 2015see what's new
- Tipo:
-
- Intervention
- Etapa:
-
- Review
- Grupo Editorial Cochrane:
-
Grupo Cochrane de Riñón y trasplante
- Copyright:
-
- Copyright © 2015 The Cochrane Collaboration. Published by John Wiley & Sons, Ltd.
Cifras del artículo
Altmetric:
Citado por:
Autores
Contributions of authors
-
Draft the protocol: JHT, KHY
-
Development of the search strategy: JHT, KHY
-
Search for studies: JHT, BM
-
Obtain copies of studies: YlL, BM, JHT
-
Select studies for inclusion: JHT, JYT
-
Extract data from studies: JHT, YlL, KHY, TXL
-
Enter data into RevMan: JHT, YlL
-
Carry out the analysis: JHT
-
Interpret the analysis: JHT, KHY, TXL
-
Draft the final review: JHT, KHY
-
Update the review: JHT, KHY
Sources of support
Internal sources
-
None known, Other.
External sources
-
None known, Other.
Declarations of interest
None known.
Acknowledgements
We would like to thank the following people.
-
The referees for their advice during the preparation of this review
-
The Cochrane Renal Group
-
TX Liu for their constructive criticism that enabled us to improve the overall quality of this review.
Version history
| Published | Title | Stage | Authors | Version |
| 2015 Mar 05 | Bicarbonate‐ versus lactate‐buffered solutions for acute continuous haemodiafiltration or haemofiltration | Review | Jin Hui Tian, Bin Ma, KeHu Yang, Yali Liu, Jiying Tan, Tian Xi Liu | |
| 2007 Oct 17 | Bicarbonate versus lactate solutions for acute haemodialysis | Protocol | Jin Hui Tian, Bin Ma, Ya Li Liu, Ji Ying Tan, Ke Hu Yang, Tian Xi Liu | |
Differences between protocol and review
Risk of bias assessment tool has replaced the quality assessment checklist.
Notes
As of issue 4 2015 this Cochrane Review is no longer being updated. There have been no new studies published on this topic in the past 12 years and there are currently no registered ongoing studies.
Keywords
MeSH
Medical Subject Headings (MeSH) Keywords
- Acute Kidney Injury [blood, mortality, *therapy];
- Bicarbonates [adverse effects, blood, *therapeutic use];
- Blood Pressure;
- Buffers;
- Creatinine [blood];
- Dialysis Solutions [adverse effects, *therapeutic use];
- Hemodiafiltration [methods];
- Hemofiltration [*methods];
- Lactates [*administration & dosage, adverse effects];
- Lactic Acid [blood];
- Randomized Controlled Trials as Topic;
Medical Subject Headings Check Words
Adult; Humans;
PICO

Study flow diagram

Risk of bias graph: review authors' judgements about each risk of bias item presented as percentages across all included studies.

Risk of bias summary: review authors' judgements about each risk of bias item for each included study.

Comparison 1 Bicarbonate‐ versus lactate‐buffered solutions, Outcome 1 Mortality.

Comparison 1 Bicarbonate‐ versus lactate‐buffered solutions, Outcome 2 Serum creatinine.

Comparison 1 Bicarbonate‐ versus lactate‐buffered solutions, Outcome 3 Blood pressure.

Comparison 1 Bicarbonate‐ versus lactate‐buffered solutions, Outcome 4 Serum bicarbonate.

Comparison 1 Bicarbonate‐ versus lactate‐buffered solutions, Outcome 5 Serum lactate.

Comparison 1 Bicarbonate‐ versus lactate‐buffered solutions, Outcome 6 Serum base excess.

Comparison 1 Bicarbonate‐ versus lactate‐buffered solutions, Outcome 7 Serum pH.

Comparison 1 Bicarbonate‐ versus lactate‐buffered solutions, Outcome 8 carbon dioxide partial pressure.
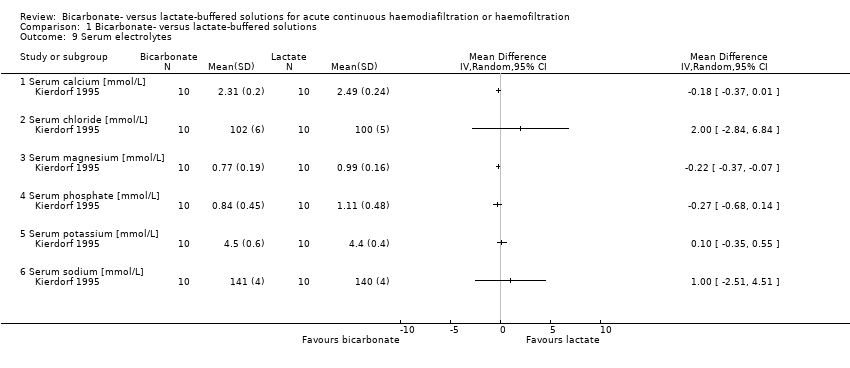
Comparison 1 Bicarbonate‐ versus lactate‐buffered solutions, Outcome 9 Serum electrolytes.

Comparison 1 Bicarbonate‐ versus lactate‐buffered solutions, Outcome 10 Hypotensive events.

Comparison 1 Bicarbonate‐ versus lactate‐buffered solutions, Outcome 11 Central venous pressure.

Comparison 1 Bicarbonate‐ versus lactate‐buffered solutions, Outcome 12 Cardiovascular complications.
| Bicarbonate‐ versus lactate‐buffered solutions for acute continuous haemodiafiltration or haemofiltration | ||||||
| Patient or population: patients with acute kidney injury Intervention: bicarbonate‐buffered solutions Comparison: lactate‐buffered solutions | ||||||
| Outcomes | Illustrative comparative risks* (95% CI) | Relative effect | No of participants | Quality of the evidence | Comments | |
| Assumed risk | Corresponding risk | |||||
| Lactate‐buffered solutions | Bicarbonate‐buffered solutions | |||||
| Mortality | 392 per 1000 (38 to 398) | 298 per 1000 | RR 0.76 (0.5 to 1.15) | 163 (3) | ⊕⊕⊕⊝ | |
| Serum bicarbonate (mmol/L) | The mean serum bicarbonate was 0.33 mmol/L higher with bicarbonate‐buffered solutions (1.59 lower to 2.25 higher) | 163 (3) | ⊕⊕⊝⊝ | |||
| Serum creatinine (µmol/L) | The mean serum creatinine was 18.25 µmol/L lower with bicarbonate‐buffered solutions (123.77 lower to 87.28 higher) | 137 (2) | ⊕⊕⊝⊝ | |||
| Serum lactate (mmol/L) | The mean serum lactate was 1.13 mmol/L lower with bicarbonate‐buffered solutions (1.32 to 0.94 lower) | 171 (4) | ⊕⊕⊕⊝ | |||
| Serum base excess | The mean serum base excess was 0.9 higher with bicarbonate‐buffered solutions (0.83 lower to 2.62 higher) | 145 (3) | ⊕⊕⊝⊝ | |||
| Serum pH | The mean serum pH was 0.00 higher with bicarbonate‐buffered solutions (0.03 lower to 0.04 higher) | 171 (4) | ⊕⊕⊝⊝ | |||
| pCO2 | The mean pCO2 was 0.82 lower with bicarbonate‐buffered solutions (3.22 lower to 1.58 higher) | 151 (3) | ⊕⊕⊝⊝ | |||
| Hypotensive events | 518 per 1000 | 230 per 1000 | RR 0.44 (0.26 to 0.75) | 20 (1) | ⊕⊕⊕⊝ | Based on one small study |
| Cardiovascular complications | 375 per 1000 | 148 per 1000 | RR 0.39 ( | 20 (1) | ⊕⊕⊕⊝ | Based on one small study |
| *The basis for the assumed risk (e.g. the median control group risk across studies) is provided in footnotes. The corresponding risk (and its 95%CI) is based on the assumed risk in the comparison group and the relative effect of the intervention (and its 95% CI). | ||||||
| GRADE Working Group grades of evidence | ||||||
| Study | Bicarbonate solutions | Lactate solutions | ||
| Concentrations | Manufacturer | Concentrations | Manufacturer | |
| 140 mmol Na+, 109 mmol CI‐, 35 mmol HCO3‐, 1.5 mmol Ca2+, 0.5 mmol Mg2+, 5.6 mmol glucose | Fresenius Medical Care (Bad Homburg, Germany) | 135 mmol Na+, 106.5 mmol CI‐, 1.88 mmol Ca2+, 0.75 mmol Mg2+, 7.5 mmol glucose, 33.75 mmol lactate | Fresenius Medical Care (Bad Homburg, Germany) | |
| 140 mmol Na+, 110 mmol CI‐, 34.5 mmol HCO3‐, 3 mmol lactate, 1.75 mmol Ca2+, 0.5 mmol Mg2+, 5.6 mmol glucose | Schiwa (Glandorf, Germany) | 142 mmol Na+, 103 mmol CI‐, 44.5 mmol lactate, 2.0 mmol Ca2+, 0.75 mmol Mg2+, 5.6 mmol glucose | Schiwa (Glandorf, Germany) | |
| 140 mmol Na+, 109.5 mmol CI‐, 1.75 mmol Ca2+, 0.5 mmol Mg2+, 32 mmol bicarbonate, 3 mmol lactate | Not reported | 140 mmol Na+, 1 mmol K+, 100 mmol CI‐, 46 mmol lactate, 1.6 mmol Ca2+, 0.8 mmol Mg2+, 32 mmol bicarbonate, 10.8 mmol glucose | Not reported | |
| 140 mmol Na+, 106.5 mmol CI‐, 0.75 mmol Mg2+, 35 mmol bicarbonate | Dianeal (Baxter, Toronto, Canada) | 132 mmol Na+, 102 mmol CI‐, 35 mmol lactate, 1.75 mmol Ca2+, 0.75 mmol Mg2+, 83 mmol glucose | Normocarb (Vaughan, Canada) | |
| Ca ‐ calcium; Cl ‐ chlorine; K ‐ potassium; HCO3‾ ‐ bicarbonate; Mg ‐ magnesium; Na ‐ sodium | ||||
| Outcome or subgroup title | No. of studies | No. of participants | Statistical method | Effect size |
| 1 Mortality Show forest plot | 3 | 163 | Risk Ratio (M‐H, Random, 95% CI) | 0.76 [0.50, 1.15] |
| 1.1 Cross‐over RCTs | 2 | 46 | Risk Ratio (M‐H, Random, 95% CI) | 0.72 [0.27, 1.90] |
| 1.2 Parallel RCTs | 1 | 117 | Risk Ratio (M‐H, Random, 95% CI) | 0.77 [0.48, 1.22] |
| 2 Serum creatinine Show forest plot | 2 | 137 | Mean Difference (IV, Random, 95% CI) | ‐22.81 [‐129.61, 83.99] |
| 3 Blood pressure Show forest plot | 2 | Mean Difference (IV, Random, 95% CI) | Totals not selected | |
| 3.1 Systolic blood pressure | 1 | Mean Difference (IV, Random, 95% CI) | 0.0 [0.0, 0.0] | |
| 3.2 Diastolic blood pressure | 1 | Mean Difference (IV, Random, 95% CI) | 0.0 [0.0, 0.0] | |
| 3.3 MAP | 1 | Mean Difference (IV, Random, 95% CI) | 0.0 [0.0, 0.0] | |
| 4 Serum bicarbonate Show forest plot | 3 | 163 | Mean Difference (IV, Random, 95% CI) | 0.27 [‐1.45, 1.99] |
| 5 Serum lactate Show forest plot | 4 | 171 | Mean Difference (IV, Random, 95% CI) | ‐1.09 [‐1.30, ‐0.87] |
| 6 Serum base excess Show forest plot | 3 | 145 | Mean Difference (IV, Random, 95% CI) | 0.80 [‐0.91, 2.50] |
| 7 Serum pH Show forest plot | 4 | 171 | Mean Difference (IV, Random, 95% CI) | 0.01 [‐0.02, 0.03] |
| 8 carbon dioxide partial pressure Show forest plot | 3 | 151 | Mean Difference (IV, Random, 95% CI) | ‐1.04 [‐3.84, 1.76] |
| 9 Serum electrolytes Show forest plot | 1 | Mean Difference (IV, Random, 95% CI) | Totals not selected | |
| 9.1 Serum calcium [mmol/L] | 1 | Mean Difference (IV, Random, 95% CI) | 0.0 [0.0, 0.0] | |
| 9.2 Serum chloride [mmol/L] | 1 | Mean Difference (IV, Random, 95% CI) | 0.0 [0.0, 0.0] | |
| 9.3 Serum magnesium [mmol/L] | 1 | Mean Difference (IV, Random, 95% CI) | 0.0 [0.0, 0.0] | |
| 9.4 Serum phosphate [mmol/L] | 1 | Mean Difference (IV, Random, 95% CI) | 0.0 [0.0, 0.0] | |
| 9.5 Serum potassium [mmol/L] | 1 | Mean Difference (IV, Random, 95% CI) | 0.0 [0.0, 0.0] | |
| 9.6 Serum sodium [mmol/L] | 1 | Mean Difference (IV, Random, 95% CI) | 0.0 [0.0, 0.0] | |
| 10 Hypotensive events Show forest plot | 1 | Risk Ratio (M‐H, Random, 95% CI) | Totals not selected | |
| 11 Central venous pressure Show forest plot | 1 | Mean Difference (IV, Random, 95% CI) | Totals not selected | |
| 12 Cardiovascular complications Show forest plot | 1 | Risk Ratio (M‐H, Random, 95% CI) | Totals not selected | |