Soluciones amortiguadoras con bicarbonato versus lactato para la hemofiltración o la hemodiafiltración continuas agudas
Appendices
Appendix 1. Electronic search strategies
| Database | Search terms |
| CENTRAL |
|
| MEDLINE |
|
| EMBASE |
|
Appendix 2. Risk of bias assessment tool
| Potential source of bias | Assessment criteria |
| Random sequence generation Selection bias (biased allocation to interventions) due to inadequate generation of a randomised sequence | Low risk of bias: Random number table; computer random number generator; coin tossing; shuffling cards or envelopes; throwing dice; drawing of lots; minimization (minimization may be implemented without a random element, and this is considered to be equivalent to being random). |
| High risk of bias: Sequence generated by odd or even date of birth; date (or day) of admission; sequence generated by hospital or clinic record number; allocation by judgement of the clinician; by preference of the participant; based on the results of a laboratory test or a series of tests; by availability of the intervention. | |
| Unclear: Insufficient information about the sequence generation process to permit judgement. | |
| Allocation concealment Selection bias (biased allocation to interventions) due to inadequate concealment of allocations prior to assignment | Low risk of bias: Randomisation method described that would not allow investigator/participant to know or influence intervention group before eligible participant entered in the study (e.g. central allocation, including telephone, web‐based, and pharmacy‐controlled, randomisation; sequentially numbered drug containers of identical appearance; sequentially numbered, opaque, sealed envelopes). |
| High risk of bias: Using an open random allocation schedule (e.g. a list of random numbers); assignment envelopes were used without appropriate safeguards (e.g. if envelopes were unsealed or non‐opaque or not sequentially numbered); alternation or rotation; date of birth; case record number; any other explicitly unconcealed procedure. | |
| Unclear: Randomisation stated but no information on method used is available. | |
| Blinding of participants and personnel Performance bias due to knowledge of the allocated interventions by participants and personnel during the study | Low risk of bias: No blinding or incomplete blinding, but the review authors judge that the outcome is not likely to be influenced by lack of blinding; blinding of participants and key study personnel ensured, and unlikely that the blinding could have been broken. |
| High risk of bias: No blinding or incomplete blinding, and the outcome is likely to be influenced by lack of blinding; blinding of key study participants and personnel attempted, but likely that the blinding could have been broken, and the outcome is likely to be influenced by lack of blinding. | |
| Unclear: Insufficient information to permit judgement | |
| Blinding of outcome assessment Detection bias due to knowledge of the allocated interventions by outcome assessors. | Low risk of bias: No blinding of outcome assessment, but the review authors judge that the outcome measurement is not likely to be influenced by lack of blinding; blinding of outcome assessment ensured, and unlikely that the blinding could have been broken. |
| High risk of bias: No blinding of outcome assessment, and the outcome measurement is likely to be influenced by lack of blinding; blinding of outcome assessment, but likely that the blinding could have been broken, and the outcome measurement is likely to be influenced by lack of blinding. | |
| Unclear: Insufficient information to permit judgement | |
| Incomplete outcome data Attrition bias due to amount, nature or handling of incomplete outcome data. | Low risk of bias: No missing outcome data; reasons for missing outcome data unlikely to be related to true outcome (for survival data, censoring unlikely to be introducing bias); missing outcome data balanced in numbers across intervention groups, with similar reasons for missing data across groups; for dichotomous outcome data, the proportion of missing outcomes compared with observed event risk not enough to have a clinically relevant impact on the intervention effect estimate; for continuous outcome data, plausible effect size (difference in means or standardized difference in means) among missing outcomes not enough to have a clinically relevant impact on observed effect size; missing data have been imputed using appropriate methods. |
| High risk of bias: Reason for missing outcome data likely to be related to true outcome, with either imbalance in numbers or reasons for missing data across intervention groups; for dichotomous outcome data, the proportion of missing outcomes compared with observed event risk enough to induce clinically relevant bias in intervention effect estimate; for continuous outcome data, plausible effect size (difference in means or standardized difference in means) among missing outcomes enough to induce clinically relevant bias in observed effect size; ‘as‐treated’ analysis done with substantial departure of the intervention received from that assigned at randomisation; potentially inappropriate application of simple imputation. | |
| Unclear: Insufficient information to permit judgement | |
| Selective reporting Reporting bias due to selective outcome reporting | Low risk of bias: The study protocol is available and all of the study’s pre‐specified (primary and secondary) outcomes that are of interest in the review have been reported in the pre‐specified way; the study protocol is not available but it is clear that the published reports include all expected outcomes, including those that were pre‐specified (convincing text of this nature may be uncommon). |
| High risk of bias: Not all of the study’s pre‐specified primary outcomes have been reported; one or more primary outcomes is reported using measurements, analysis methods or subsets of the data (e.g. subscales) that were not pre‐specified; one or more reported primary outcomes were not pre‐specified (unless clear justification for their reporting is provided, such as an unexpected adverse effect); one or more outcomes of interest in the review are reported incompletely so that they cannot be entered in a meta‐analysis; the study report fails to include results for a key outcome that would be expected to have been reported for such a study. | |
| Unclear: Insufficient information to permit judgement | |
| Other bias Bias due to problems not covered elsewhere in the table | Low risk of bias: The study appears to be free of other sources of bias. |
| High risk of bias: Had a potential source of bias related to the specific study design used; stopped early due to some data‐dependent process (including a formal‐stopping rule); had extreme baseline imbalance; has been claimed to have been fraudulent; had some other problem. | |
| Unclear: Insufficient information to assess whether an important risk of bias exists; insufficient rationale or evidence that an identified problem will introduce bias. |

Study flow diagram

Risk of bias graph: review authors' judgements about each risk of bias item presented as percentages across all included studies.

Risk of bias summary: review authors' judgements about each risk of bias item for each included study.

Comparison 1 Bicarbonate‐ versus lactate‐buffered solutions, Outcome 1 Mortality.

Comparison 1 Bicarbonate‐ versus lactate‐buffered solutions, Outcome 2 Serum creatinine.

Comparison 1 Bicarbonate‐ versus lactate‐buffered solutions, Outcome 3 Blood pressure.

Comparison 1 Bicarbonate‐ versus lactate‐buffered solutions, Outcome 4 Serum bicarbonate.

Comparison 1 Bicarbonate‐ versus lactate‐buffered solutions, Outcome 5 Serum lactate.

Comparison 1 Bicarbonate‐ versus lactate‐buffered solutions, Outcome 6 Serum base excess.

Comparison 1 Bicarbonate‐ versus lactate‐buffered solutions, Outcome 7 Serum pH.

Comparison 1 Bicarbonate‐ versus lactate‐buffered solutions, Outcome 8 carbon dioxide partial pressure.
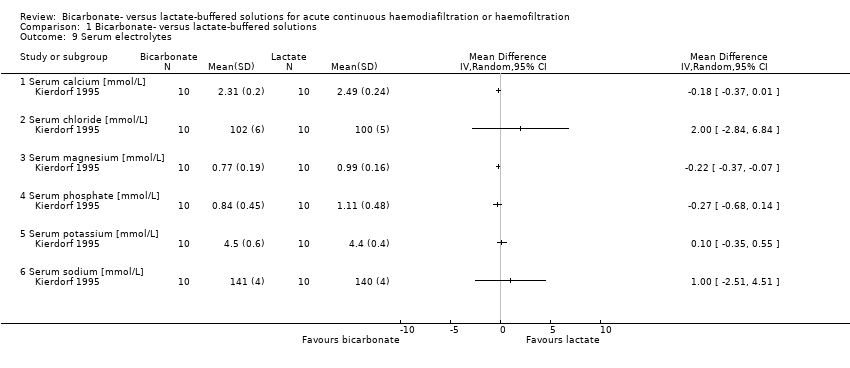
Comparison 1 Bicarbonate‐ versus lactate‐buffered solutions, Outcome 9 Serum electrolytes.

Comparison 1 Bicarbonate‐ versus lactate‐buffered solutions, Outcome 10 Hypotensive events.

Comparison 1 Bicarbonate‐ versus lactate‐buffered solutions, Outcome 11 Central venous pressure.

Comparison 1 Bicarbonate‐ versus lactate‐buffered solutions, Outcome 12 Cardiovascular complications.
| Bicarbonate‐ versus lactate‐buffered solutions for acute continuous haemodiafiltration or haemofiltration | ||||||
| Patient or population: patients with acute kidney injury Intervention: bicarbonate‐buffered solutions Comparison: lactate‐buffered solutions | ||||||
| Outcomes | Illustrative comparative risks* (95% CI) | Relative effect | No of participants | Quality of the evidence | Comments | |
| Assumed risk | Corresponding risk | |||||
| Lactate‐buffered solutions | Bicarbonate‐buffered solutions | |||||
| Mortality | 392 per 1000 (38 to 398) | 298 per 1000 | RR 0.76 (0.5 to 1.15) | 163 (3) | ⊕⊕⊕⊝ | |
| Serum bicarbonate (mmol/L) | The mean serum bicarbonate was 0.33 mmol/L higher with bicarbonate‐buffered solutions (1.59 lower to 2.25 higher) | 163 (3) | ⊕⊕⊝⊝ | |||
| Serum creatinine (µmol/L) | The mean serum creatinine was 18.25 µmol/L lower with bicarbonate‐buffered solutions (123.77 lower to 87.28 higher) | 137 (2) | ⊕⊕⊝⊝ | |||
| Serum lactate (mmol/L) | The mean serum lactate was 1.13 mmol/L lower with bicarbonate‐buffered solutions (1.32 to 0.94 lower) | 171 (4) | ⊕⊕⊕⊝ | |||
| Serum base excess | The mean serum base excess was 0.9 higher with bicarbonate‐buffered solutions (0.83 lower to 2.62 higher) | 145 (3) | ⊕⊕⊝⊝ | |||
| Serum pH | The mean serum pH was 0.00 higher with bicarbonate‐buffered solutions (0.03 lower to 0.04 higher) | 171 (4) | ⊕⊕⊝⊝ | |||
| pCO2 | The mean pCO2 was 0.82 lower with bicarbonate‐buffered solutions (3.22 lower to 1.58 higher) | 151 (3) | ⊕⊕⊝⊝ | |||
| Hypotensive events | 518 per 1000 | 230 per 1000 | RR 0.44 (0.26 to 0.75) | 20 (1) | ⊕⊕⊕⊝ | Based on one small study |
| Cardiovascular complications | 375 per 1000 | 148 per 1000 | RR 0.39 ( | 20 (1) | ⊕⊕⊕⊝ | Based on one small study |
| *The basis for the assumed risk (e.g. the median control group risk across studies) is provided in footnotes. The corresponding risk (and its 95%CI) is based on the assumed risk in the comparison group and the relative effect of the intervention (and its 95% CI). | ||||||
| GRADE Working Group grades of evidence | ||||||
| Study | Bicarbonate solutions | Lactate solutions | ||
| Concentrations | Manufacturer | Concentrations | Manufacturer | |
| 140 mmol Na+, 109 mmol CI‐, 35 mmol HCO3‐, 1.5 mmol Ca2+, 0.5 mmol Mg2+, 5.6 mmol glucose | Fresenius Medical Care (Bad Homburg, Germany) | 135 mmol Na+, 106.5 mmol CI‐, 1.88 mmol Ca2+, 0.75 mmol Mg2+, 7.5 mmol glucose, 33.75 mmol lactate | Fresenius Medical Care (Bad Homburg, Germany) | |
| 140 mmol Na+, 110 mmol CI‐, 34.5 mmol HCO3‐, 3 mmol lactate, 1.75 mmol Ca2+, 0.5 mmol Mg2+, 5.6 mmol glucose | Schiwa (Glandorf, Germany) | 142 mmol Na+, 103 mmol CI‐, 44.5 mmol lactate, 2.0 mmol Ca2+, 0.75 mmol Mg2+, 5.6 mmol glucose | Schiwa (Glandorf, Germany) | |
| 140 mmol Na+, 109.5 mmol CI‐, 1.75 mmol Ca2+, 0.5 mmol Mg2+, 32 mmol bicarbonate, 3 mmol lactate | Not reported | 140 mmol Na+, 1 mmol K+, 100 mmol CI‐, 46 mmol lactate, 1.6 mmol Ca2+, 0.8 mmol Mg2+, 32 mmol bicarbonate, 10.8 mmol glucose | Not reported | |
| 140 mmol Na+, 106.5 mmol CI‐, 0.75 mmol Mg2+, 35 mmol bicarbonate | Dianeal (Baxter, Toronto, Canada) | 132 mmol Na+, 102 mmol CI‐, 35 mmol lactate, 1.75 mmol Ca2+, 0.75 mmol Mg2+, 83 mmol glucose | Normocarb (Vaughan, Canada) | |
| Ca ‐ calcium; Cl ‐ chlorine; K ‐ potassium; HCO3‾ ‐ bicarbonate; Mg ‐ magnesium; Na ‐ sodium | ||||
| Outcome or subgroup title | No. of studies | No. of participants | Statistical method | Effect size |
| 1 Mortality Show forest plot | 3 | 163 | Risk Ratio (M‐H, Random, 95% CI) | 0.76 [0.50, 1.15] |
| 1.1 Cross‐over RCTs | 2 | 46 | Risk Ratio (M‐H, Random, 95% CI) | 0.72 [0.27, 1.90] |
| 1.2 Parallel RCTs | 1 | 117 | Risk Ratio (M‐H, Random, 95% CI) | 0.77 [0.48, 1.22] |
| 2 Serum creatinine Show forest plot | 2 | 137 | Mean Difference (IV, Random, 95% CI) | ‐22.81 [‐129.61, 83.99] |
| 3 Blood pressure Show forest plot | 2 | Mean Difference (IV, Random, 95% CI) | Totals not selected | |
| 3.1 Systolic blood pressure | 1 | Mean Difference (IV, Random, 95% CI) | 0.0 [0.0, 0.0] | |
| 3.2 Diastolic blood pressure | 1 | Mean Difference (IV, Random, 95% CI) | 0.0 [0.0, 0.0] | |
| 3.3 MAP | 1 | Mean Difference (IV, Random, 95% CI) | 0.0 [0.0, 0.0] | |
| 4 Serum bicarbonate Show forest plot | 3 | 163 | Mean Difference (IV, Random, 95% CI) | 0.27 [‐1.45, 1.99] |
| 5 Serum lactate Show forest plot | 4 | 171 | Mean Difference (IV, Random, 95% CI) | ‐1.09 [‐1.30, ‐0.87] |
| 6 Serum base excess Show forest plot | 3 | 145 | Mean Difference (IV, Random, 95% CI) | 0.80 [‐0.91, 2.50] |
| 7 Serum pH Show forest plot | 4 | 171 | Mean Difference (IV, Random, 95% CI) | 0.01 [‐0.02, 0.03] |
| 8 carbon dioxide partial pressure Show forest plot | 3 | 151 | Mean Difference (IV, Random, 95% CI) | ‐1.04 [‐3.84, 1.76] |
| 9 Serum electrolytes Show forest plot | 1 | Mean Difference (IV, Random, 95% CI) | Totals not selected | |
| 9.1 Serum calcium [mmol/L] | 1 | Mean Difference (IV, Random, 95% CI) | 0.0 [0.0, 0.0] | |
| 9.2 Serum chloride [mmol/L] | 1 | Mean Difference (IV, Random, 95% CI) | 0.0 [0.0, 0.0] | |
| 9.3 Serum magnesium [mmol/L] | 1 | Mean Difference (IV, Random, 95% CI) | 0.0 [0.0, 0.0] | |
| 9.4 Serum phosphate [mmol/L] | 1 | Mean Difference (IV, Random, 95% CI) | 0.0 [0.0, 0.0] | |
| 9.5 Serum potassium [mmol/L] | 1 | Mean Difference (IV, Random, 95% CI) | 0.0 [0.0, 0.0] | |
| 9.6 Serum sodium [mmol/L] | 1 | Mean Difference (IV, Random, 95% CI) | 0.0 [0.0, 0.0] | |
| 10 Hypotensive events Show forest plot | 1 | Risk Ratio (M‐H, Random, 95% CI) | Totals not selected | |
| 11 Central venous pressure Show forest plot | 1 | Mean Difference (IV, Random, 95% CI) | Totals not selected | |
| 12 Cardiovascular complications Show forest plot | 1 | Risk Ratio (M‐H, Random, 95% CI) | Totals not selected | |