Intervenciones antivirales para pacientes con un trasplante hepático e infección recurrente del injerto debido al virus de la hepatitis C
Información
- DOI:
- https://doi.org/10.1002/14651858.CD006803.pub4Copiar DOI

- Base de datos:
-
- Cochrane Database of Systematic Reviews
- Versión publicada:
-
- 04 diciembre 2013see what's new
- Tipo:
-
- Intervention
- Etapa:
-
- Review
- Grupo Editorial Cochrane:
-
Grupo Cochrane de Hepatobiliar
- Copyright:
-
- Copyright © 2014 The Cochrane Collaboration. Published by John Wiley & Sons, Ltd.
Cifras del artículo
Altmetric:
Citado por:
Autores
Contributions of authors
KS Gurusamy wrote the review, assessed the trials for inclusion, and extracted data on included trials.
E Tsochatzis, C Toon, and E Xirouchakis extracted the data on included trials.
AK Burroughs and BR Davidson critically commented on the review and provided advice for improving the review.
All authors agreed to the final version.
Sources of support
Internal sources
-
None, Other.
External sources
-
Hellenic Association for the Study of the Liver, Greece.
Dr E Tsochatzis receives an educational grant for his research in the UK.
Declarations of interest
None known.
Acknowledgements
To the Cochrane Hepato‐Biliary Group for the support that they have provided.
Dr Bujar Osmani, who contributed to the previous version of this Cochrane review.
Peer Reviewers: Jason Vanatta, USA; Ryan Groeschl, USA.
Contact Editor: Davor Stimac, Croatia.
This project was funded by the National Institute for Health Research.
Disclaimer of the Department of Health: 'The views and opinions expressed in the review are those of the authors and do not necessarily reflect those of the National Institute for Health Research (NIHR), National Health Services (NHS), or the Department of Health'.
Version history
| Published | Title | Stage | Authors | Version |
| 2013 Dec 04 | Antiviral interventions for liver transplant patients with recurrent graft infection due to hepatitis C virus | Review | Kurinchi Selvan Gurusamy, Emmanuel Tsochatzis, Clare D Toon, Elias Xirouchakis, Andrew K Burroughs, Brian R Davidson | |
| 2010 Jan 20 | Antiviral therapy for recurrent liver graft infection with hepatitis C virus | Review | Kurinchi Selvan Gurusamy, Emmanuel Tsochatzis, Elias Xirouchakis, Andrew K Burroughs, Brian R Davidson | |
| 2009 Jan 21 | Antiviral therapy for recurrent liver graft infection with hepatitis C virus | Review | Kurinchi Selvan Gurusamy, Bujar Osmani, Elias Xirouchakis, Andrew K Burroughs, Brian R Davidson | |
| 2007 Oct 17 | Antiviral therapy for recurrent liver graft infection with hepatitis C virus | Protocol | Kurinchi Selvan Gurusamy, Kumarakrishnan Samraj, Brian R Davidson | |
Differences between protocol and review
The outcomes have been divided into primary and secondary outcomes, and ordered by clinical importance. The outcomes retransplantation and graft rejection have now been clearly defined as those occurring after the start of therapy. Liver decompensation has been added as an additional primary outcome as this is an important clinical outcome that can be influenced by treatment. The outcomes initial poor function, primary graft non‐function, intensive therapy unit stay, and hospital stay have been removed as these events and outcomes are prior to the start of the treatment and hence are redundant.
Differences between first review and update
-
We updated the search and identified one new trial (Lodato 2008). Also, a previously included trial, which was available only as an abstract, was published as full text (Nair 2008), and we used the information from the full text for this update of the review.
-
We updated the assessment of risk of bias according to the new methods of bias risk assessment in the updated version of the Cochrane Handbook for Systematic Reviews of Interventions (Higgins 2008).
-
Previously, the risk ratio in outcomes such as fibrosis improvement, where higher incidence of an event was beneficial, was entered in the same way as outcomes such as fibrosis worsening, where higher incidence of an event was harmful. This meant that the readers had to take extra care when interpreting the risk ratios. Now, the incidence of non‐event has been reported in beneficial outcomes so that all risk ratios of less than one indicate benefit of the experimental intervention and risk ratios of more than one indicate harm of the experimental intervention for all the outcomes in the review.
-
For dichotomous variables in which there was only one trial included, we performed the Fisher's exact test. This is because of the potential for false estimates for risk ratio in RevMan 2008 in the presence of only one trial for the outcome.
Differences between first update and second update
-
We have updated the methods according to the updated version of the Cochrane Handbook for Systematic Reviews of Interventions (Higgins 2011).
-
We have added trial sequential analysis.
-
We have identified five new trials and included them in the systematic review (Gane 2009; Aguilera 2011; Yedibela 2011; Belli 2012; Calmus 2012).
Keywords
MeSH
Medical Subject Headings (MeSH) Keywords
- Antiviral Agents [adverse effects, *therapeutic use];
- Drug Therapy, Combination [adverse effects, methods];
- Genotype;
- Graft Rejection [epidemiology];
- Hepacivirus [genetics];
- Hepatitis C [*drug therapy, mortality];
- Interferon alpha‐2;
- Interferon‐alpha [therapeutic use];
- Liver Cirrhosis;
- Liver Transplantation [*adverse effects, mortality];
- Polyethylene Glycols [therapeutic use];
- Randomized Controlled Trials as Topic;
- Recombinant Proteins [therapeutic use];
- Recurrence;
- Reoperation;
- Ribavirin [adverse effects, therapeutic use];
Medical Subject Headings Check Words
Humans;

Study flow diagram.
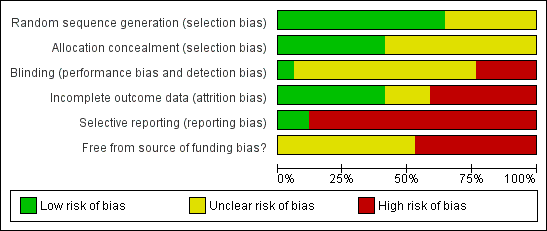
Methodological quality graph: Review authors' judgements about each methodological quality item presented as percentages across all included studies.

Methodological quality summary: Review authors' judgements about each methodological quality item for each included study.
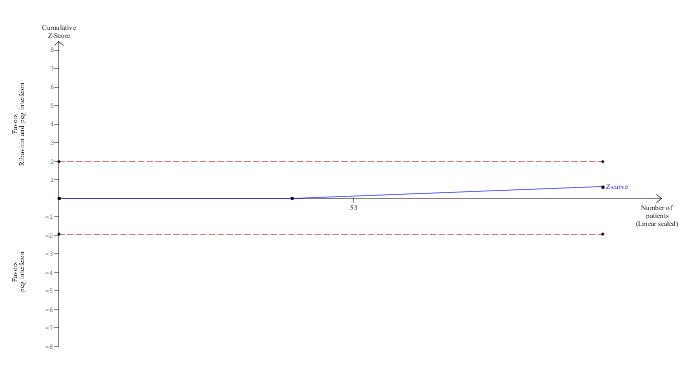
Trial Sequential Analysis of mortality (ribavirin plus peg interferon versus peg interferon)
The diversity‐adjusted required information size (DARIS) was calculated to 16,594 patients, based on the proportion of patients in the control group with the outcome of 4.1%, a relative risk reduction of 20%, an alpha of 5%, a beta of 20%, and a diversity of 0%. To account for zero event groups, a continuity correction of 0.01 was used in the calculation of the cumulative Z‐curve (blue line). After accruing 98 participants in two trials, only 0.59% of the DARIS has been reached. Accordingly, the Trial Sequential Analysis does not show the required information size and the trial sequential monitoring boundaries. As shown, the conventional boundaries (dotted red line) have also not been crossed by the cumulative Z‐curve.

Trial Sequential Analysis of fibrosis worsening (ribavirin plus peg interferon versus control)
The diversity‐adjusted required information size (DARIS) was calculated to 4066 patients, based on the proportion of patients in the control group with the outcome of 65.1%, a relative risk reduction of 20%, an alpha of 5%, a beta of 20%, and a diversity of 88.93%. After accruing 126 participants in two trials, only 3.1% of the DARIS has been reached. Accordingly, the Trial Sequential Analysis does not show the required information size and the trial sequential monitoring boundaries. As shown, the conventional boundaries (dotted red line) was no longer crossed by the cumulative Z‐curve after two trials although the conventional boundaries were crossed after the first trial.
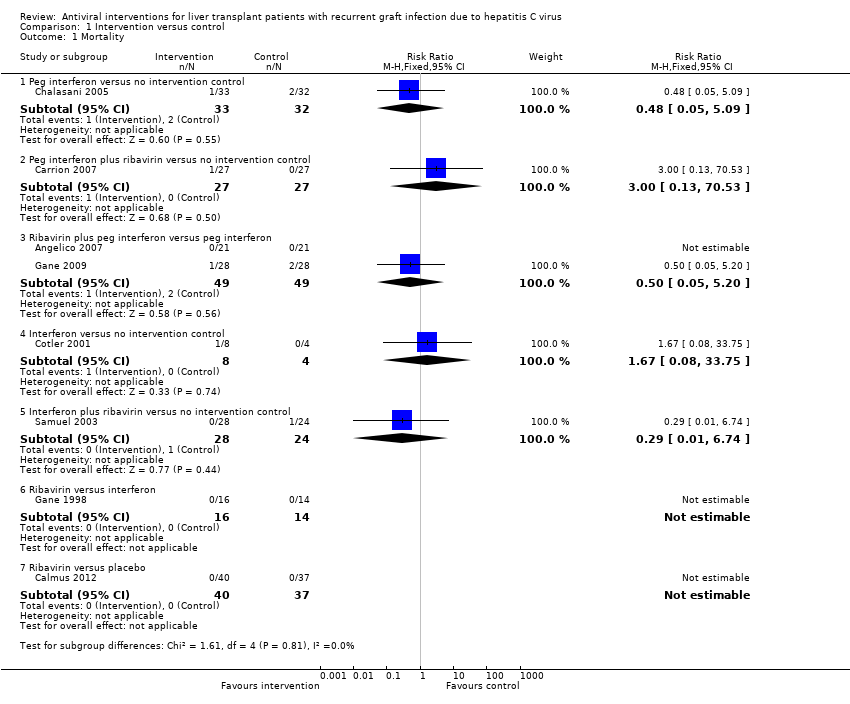
Comparison 1 Intervention versus control, Outcome 1 Mortality.

Comparison 1 Intervention versus control, Outcome 2 Retransplantation after start of therapy.

Comparison 1 Intervention versus control, Outcome 3 Treatment‐related serious adverse events (proportion).

Comparison 1 Intervention versus control, Outcome 4 Treatment‐related serious adverse events (number of serious adverse events).
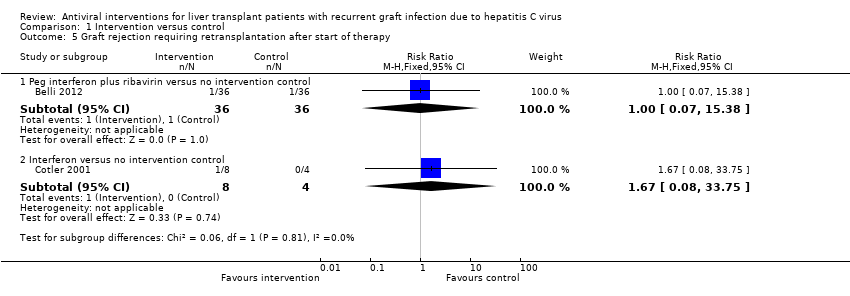
Comparison 1 Intervention versus control, Outcome 5 Graft rejection requiring retransplantation after start of therapy.
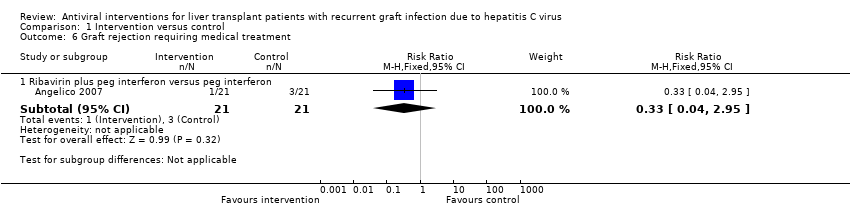
Comparison 1 Intervention versus control, Outcome 6 Graft rejection requiring medical treatment.
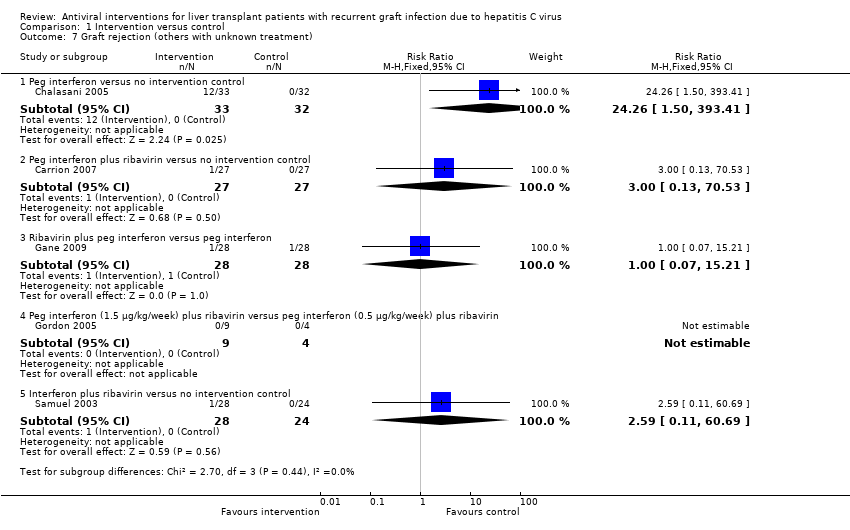
Comparison 1 Intervention versus control, Outcome 7 Graft rejection (others with unknown treatment).
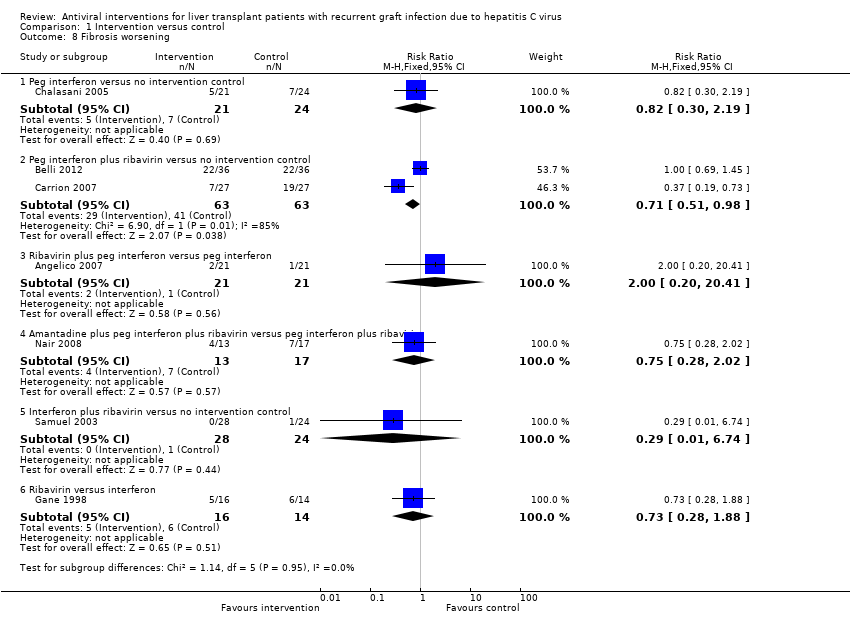
Comparison 1 Intervention versus control, Outcome 8 Fibrosis worsening.
| Mortality | ||||||
| Patient or population: Participants with recurrent liver graft infection with hepatitis C virus. | ||||||
| Outcomes | Illustrative comparative risks* (95% CI) | Relative effect | No of participants | Quality of the evidence | Comments | |
| Assumed risk | Corresponding risk | |||||
| Control | Intervention | |||||
| Peg interferon vs.control | 62 per 1000 | 30 per 1000 | RR 0.48 | 65 | ⊕⊝⊝⊝ | The assumed risk was the control group risk. |
| Peg interferon plus ribavirin vs.control | 63 per 1000 | 189 per 1000 | RR 3 | 54 | ⊕⊝⊝⊝ | Since there were no deaths in the control group, the assumed risk was the control group risk in a different trial included in this review. |
| Ribavirin plus peg interferon vs.peg interferon | 41 per 1000 | 20 per 1000 | RR 0.5 | 98 | ⊕⊝⊝⊝ | The assumed risk was the control group risk. |
| Interferon vs.control | 63 per 1000 | 105 per 1000 | RR 1.67 | 12 | ⊕⊝⊝⊝ | Since there were no deaths in the control group, the assumed risk was the control group risk in a different trial included in this review. |
| Interferon plus ribavirin vs.control | 42 per 1000 | 12 per 1000 | RR 0.29 | 52 | ⊕⊝⊝⊝ | The assumed risk was the control group risk. |
| Ribavirin vs.interferon | There were no deaths in either group. | Not estimable | 30 | ⊕⊝⊝⊝ | ‐ | |
| Ribavirin vs.placebo | There were no deaths in either group. | Not estimable | 77 | ⊕⊝⊝⊝ | ‐ | |
| *The basis for the assumed risk is provided in the comments section. The corresponding risk (and its 95% confidence interval) is based on the assumed risk in the comparison group and the relative effect of the intervention (and its 95% CI). | ||||||
| GRADE Working Group grades of evidence | ||||||
| 1 The trial(s) was (were) of high risk of bias. | ||||||
| Retransplantation | ||||||
| Patient or population: Participants with recurrent liver graft infection with hepatitis C virus. | ||||||
| Outcomes | Illustrative comparative risks* (95% CI) | Relative effect | No of participants | Quality of the evidence | Comments | |
| Assumed risk | Corresponding risk | |||||
| Control | Intervention | |||||
| Retransplantation after start of therapy ‐ ribavirin vs.placebo | No retransplantation in either group | Not estimable | 77 | ⊕⊝⊝⊝ | ||
| Retransplantation after start of therapy ‐ interferon vs.control | 10 per 1000 | 17 per 1000 | RR 1.67 | 12 | ⊕⊝⊝⊝ | There was no retransplantation in the control group. So, we used an assumed risk of 1%. |
| *The basis for the assumed risk is provided in the comments section. The corresponding risk (and its 95% confidence interval) is based on the assumed risk in the comparison group and the relative effect of the intervention (and its 95% CI). | ||||||
| GRADE Working Group grades of evidence | ||||||
| 1 The trial(s) was (were) of high risk of bias. | ||||||
| Outcome or subgroup title | No. of studies | No. of participants | Statistical method | Effect size |
| 1 Mortality Show forest plot | 8 | Risk Ratio (M‐H, Fixed, 95% CI) | Subtotals only | |
| 1.1 Peg interferon versus no intervention control | 1 | 65 | Risk Ratio (M‐H, Fixed, 95% CI) | 0.48 [0.05, 5.09] |
| 1.2 Peg interferon plus ribavirin versus no intervention control | 1 | 54 | Risk Ratio (M‐H, Fixed, 95% CI) | 3.0 [0.13, 70.53] |
| 1.3 Ribavirin plus peg interferon versus peg interferon | 2 | 98 | Risk Ratio (M‐H, Fixed, 95% CI) | 0.5 [0.05, 5.20] |
| 1.4 Interferon versus no intervention control | 1 | 12 | Risk Ratio (M‐H, Fixed, 95% CI) | 1.67 [0.08, 33.75] |
| 1.5 Interferon plus ribavirin versus no intervention control | 1 | 52 | Risk Ratio (M‐H, Fixed, 95% CI) | 0.29 [0.01, 6.74] |
| 1.6 Ribavirin versus interferon | 1 | 30 | Risk Ratio (M‐H, Fixed, 95% CI) | 0.0 [0.0, 0.0] |
| 1.7 Ribavirin versus placebo | 1 | 77 | Risk Ratio (M‐H, Fixed, 95% CI) | 0.0 [0.0, 0.0] |
| 2 Retransplantation after start of therapy Show forest plot | 2 | Risk Ratio (M‐H, Fixed, 95% CI) | Subtotals only | |
| 2.1 Interferon versus no intervention control | 1 | 12 | Risk Ratio (M‐H, Fixed, 95% CI) | 1.67 [0.08, 33.75] |
| 2.2 Ribavirin versus placebo | 1 | 77 | Risk Ratio (M‐H, Fixed, 95% CI) | 0.0 [0.0, 0.0] |
| 3 Treatment‐related serious adverse events (proportion) Show forest plot | 2 | Risk Ratio (M‐H, Fixed, 95% CI) | Subtotals only | |
| 3.1 Ribavirin plus peg interferon versus peg interferon | 1 | 56 | Risk Ratio (M‐H, Fixed, 95% CI) | 3.4 [1.46, 7.94] |
| 3.2 Ribavirin versus placebo | 1 | 77 | Risk Ratio (M‐H, Fixed, 95% CI) | 5.55 [0.70, 43.95] |
| 4 Treatment‐related serious adverse events (number of serious adverse events) Show forest plot | 2 | Rate Ratio (Fixed, 95% CI) | Subtotals only | |
| 4.1 Peg interferon versus no intervention control | 1 | 65 | Rate Ratio (Fixed, 95% CI) | 1.15 [0.52, 2.57] |
| 4.2 Ribavirin plus peg interferon versus peg interferon | 1 | 42 | Rate Ratio (Fixed, 95% CI) | 1.20 [0.36, 3.96] |
| 5 Graft rejection requiring retransplantation after start of therapy Show forest plot | 2 | Risk Ratio (M‐H, Fixed, 95% CI) | Subtotals only | |
| 5.1 Peg interferon plus ribavirin versus no intervention control | 1 | 72 | Risk Ratio (M‐H, Fixed, 95% CI) | 1.0 [0.07, 15.38] |
| 5.2 Interferon versus no intervention control | 1 | 12 | Risk Ratio (M‐H, Fixed, 95% CI) | 1.67 [0.08, 33.75] |
| 6 Graft rejection requiring medical treatment Show forest plot | 1 | Risk Ratio (M‐H, Fixed, 95% CI) | Subtotals only | |
| 6.1 Ribavirin plus peg interferon versus peg interferon | 1 | 42 | Risk Ratio (M‐H, Fixed, 95% CI) | 0.33 [0.04, 2.95] |
| 7 Graft rejection (others with unknown treatment) Show forest plot | 5 | Risk Ratio (M‐H, Fixed, 95% CI) | Subtotals only | |
| 7.1 Peg interferon versus no intervention control | 1 | 65 | Risk Ratio (M‐H, Fixed, 95% CI) | 24.26 [1.50, 393.41] |
| 7.2 Peg interferon plus ribavirin versus no intervention control | 1 | 54 | Risk Ratio (M‐H, Fixed, 95% CI) | 3.0 [0.13, 70.53] |
| 7.3 Ribavirin plus peg interferon versus peg interferon | 1 | 56 | Risk Ratio (M‐H, Fixed, 95% CI) | 1.0 [0.07, 15.21] |
| 7.4 Peg interferon (1.5 μg/kg/week) plus ribavirin versus peg interferon (0.5 μg/kg/week) plus ribavirin | 1 | 13 | Risk Ratio (M‐H, Fixed, 95% CI) | 0.0 [0.0, 0.0] |
| 7.5 Interferon plus ribavirin versus no intervention control | 1 | 52 | Risk Ratio (M‐H, Fixed, 95% CI) | 2.59 [0.11, 60.69] |
| 8 Fibrosis worsening Show forest plot | 7 | Risk Ratio (M‐H, Fixed, 95% CI) | Subtotals only | |
| 8.1 Peg interferon versus no intervention control | 1 | 45 | Risk Ratio (M‐H, Fixed, 95% CI) | 0.82 [0.30, 2.19] |
| 8.2 Peg interferon plus ribavirin versus no intervention control | 2 | 126 | Risk Ratio (M‐H, Fixed, 95% CI) | 0.71 [0.51, 0.98] |
| 8.3 Ribavirin plus peg interferon versus peg interferon | 1 | 42 | Risk Ratio (M‐H, Fixed, 95% CI) | 2.0 [0.20, 20.41] |
| 8.4 Amantadine plus peg interferon plus ribavirin versus peg interferon plus ribavirin | 1 | 30 | Risk Ratio (M‐H, Fixed, 95% CI) | 0.75 [0.28, 2.02] |
| 8.5 Interferon plus ribavirin versus no intervention control | 1 | 52 | Risk Ratio (M‐H, Fixed, 95% CI) | 0.29 [0.01, 6.74] |
| 8.6 Ribavirin versus interferon | 1 | 30 | Risk Ratio (M‐H, Fixed, 95% CI) | 0.73 [0.28, 1.88] |