| 1 Mortality Show forest plot | 8 | | Risk Ratio (M‐H, Fixed, 95% CI) | Subtotals only |
|
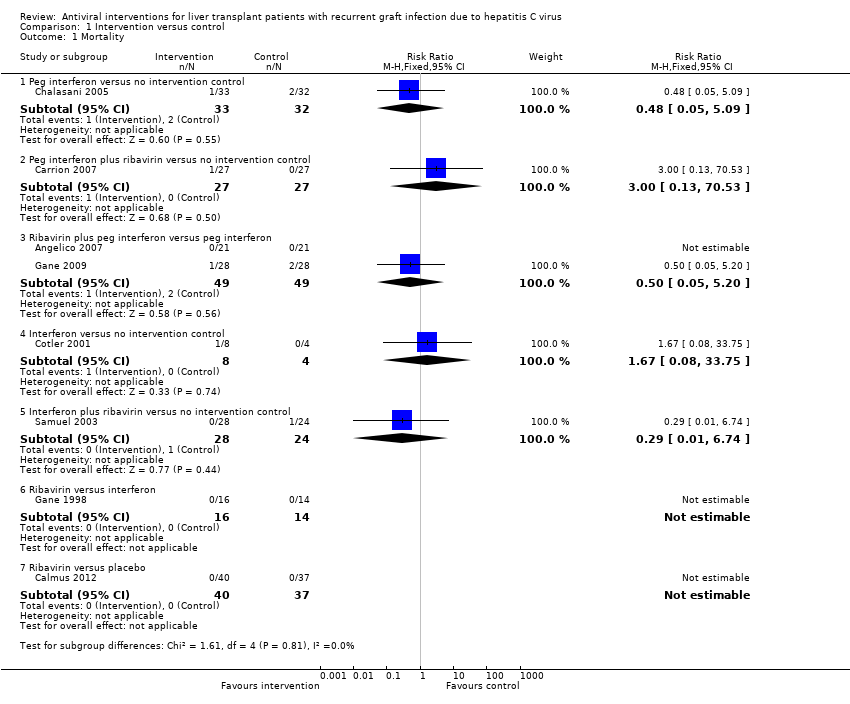
| 1.1 Peg interferon versus no intervention control | 1 | 65 | Risk Ratio (M‐H, Fixed, 95% CI) | 0.48 [0.05, 5.09] |
| 1.2 Peg interferon plus ribavirin versus no intervention control | 1 | 54 | Risk Ratio (M‐H, Fixed, 95% CI) | 3.0 [0.13, 70.53] |
| 1.3 Ribavirin plus peg interferon versus peg interferon | 2 | 98 | Risk Ratio (M‐H, Fixed, 95% CI) | 0.5 [0.05, 5.20] |
| 1.4 Interferon versus no intervention control | 1 | 12 | Risk Ratio (M‐H, Fixed, 95% CI) | 1.67 [0.08, 33.75] |
| 1.5 Interferon plus ribavirin versus no intervention control | 1 | 52 | Risk Ratio (M‐H, Fixed, 95% CI) | 0.29 [0.01, 6.74] |
| 1.6 Ribavirin versus interferon | 1 | 30 | Risk Ratio (M‐H, Fixed, 95% CI) | 0.0 [0.0, 0.0] |
| 1.7 Ribavirin versus placebo | 1 | 77 | Risk Ratio (M‐H, Fixed, 95% CI) | 0.0 [0.0, 0.0] |
| 2 Retransplantation after start of therapy Show forest plot | 2 | | Risk Ratio (M‐H, Fixed, 95% CI) | Subtotals only |
|
| 2.1 Interferon versus no intervention control | 1 | 12 | Risk Ratio (M‐H, Fixed, 95% CI) | 1.67 [0.08, 33.75] |
| 2.2 Ribavirin versus placebo | 1 | 77 | Risk Ratio (M‐H, Fixed, 95% CI) | 0.0 [0.0, 0.0] |
| 3 Treatment‐related serious adverse events (proportion) Show forest plot | 2 | | Risk Ratio (M‐H, Fixed, 95% CI) | Subtotals only |
|
| 3.1 Ribavirin plus peg interferon versus peg interferon | 1 | 56 | Risk Ratio (M‐H, Fixed, 95% CI) | 3.4 [1.46, 7.94] |
| 3.2 Ribavirin versus placebo | 1 | 77 | Risk Ratio (M‐H, Fixed, 95% CI) | 5.55 [0.70, 43.95] |
| 4 Treatment‐related serious adverse events (number of serious adverse events) Show forest plot | 2 | | Rate Ratio (Fixed, 95% CI) | Subtotals only |
|
| 4.1 Peg interferon versus no intervention control | 1 | 65 | Rate Ratio (Fixed, 95% CI) | 1.15 [0.52, 2.57] |
| 4.2 Ribavirin plus peg interferon versus peg interferon | 1 | 42 | Rate Ratio (Fixed, 95% CI) | 1.20 [0.36, 3.96] |
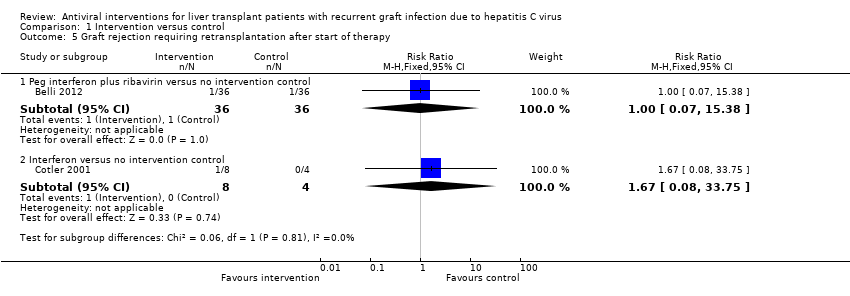
| 5 Graft rejection requiring retransplantation after start of therapy Show forest plot | 2 | | Risk Ratio (M‐H, Fixed, 95% CI) | Subtotals only |
|
| 5.1 Peg interferon plus ribavirin versus no intervention control | 1 | 72 | Risk Ratio (M‐H, Fixed, 95% CI) | 1.0 [0.07, 15.38] |
| 5.2 Interferon versus no intervention control | 1 | 12 | Risk Ratio (M‐H, Fixed, 95% CI) | 1.67 [0.08, 33.75] |
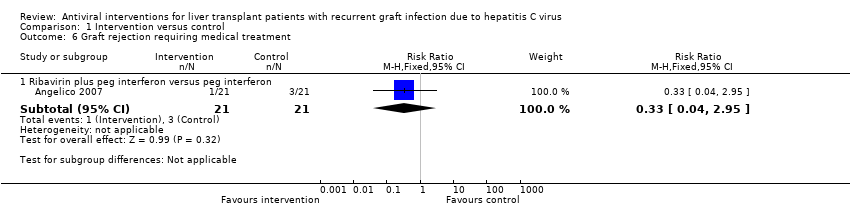
| 6 Graft rejection requiring medical treatment Show forest plot | 1 | | Risk Ratio (M‐H, Fixed, 95% CI) | Subtotals only |
|
| 6.1 Ribavirin plus peg interferon versus peg interferon | 1 | 42 | Risk Ratio (M‐H, Fixed, 95% CI) | 0.33 [0.04, 2.95] |
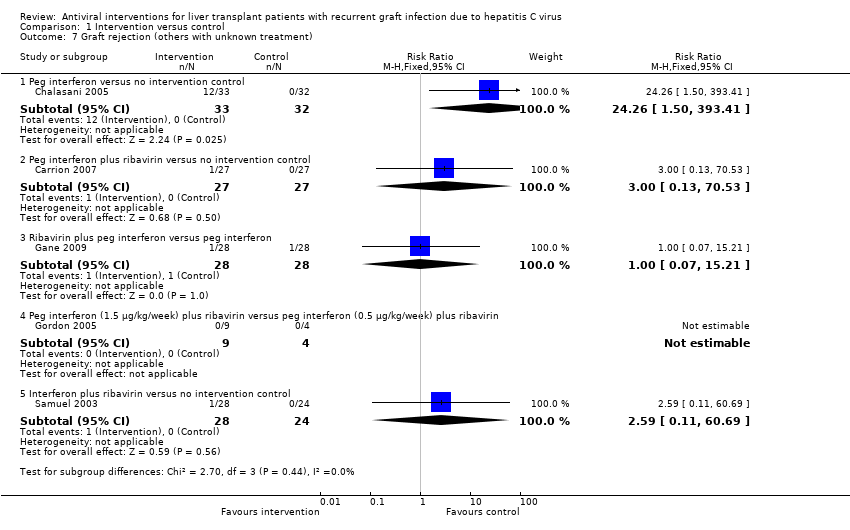
| 7 Graft rejection (others with unknown treatment) Show forest plot | 5 | | Risk Ratio (M‐H, Fixed, 95% CI) | Subtotals only |
|
| 7.1 Peg interferon versus no intervention control | 1 | 65 | Risk Ratio (M‐H, Fixed, 95% CI) | 24.26 [1.50, 393.41] |
| 7.2 Peg interferon plus ribavirin versus no intervention control | 1 | 54 | Risk Ratio (M‐H, Fixed, 95% CI) | 3.0 [0.13, 70.53] |
| 7.3 Ribavirin plus peg interferon versus peg interferon | 1 | 56 | Risk Ratio (M‐H, Fixed, 95% CI) | 1.0 [0.07, 15.21] |
| 7.4 Peg interferon (1.5 μg/kg/week) plus ribavirin versus peg interferon (0.5 μg/kg/week) plus ribavirin | 1 | 13 | Risk Ratio (M‐H, Fixed, 95% CI) | 0.0 [0.0, 0.0] |
| 7.5 Interferon plus ribavirin versus no intervention control | 1 | 52 | Risk Ratio (M‐H, Fixed, 95% CI) | 2.59 [0.11, 60.69] |
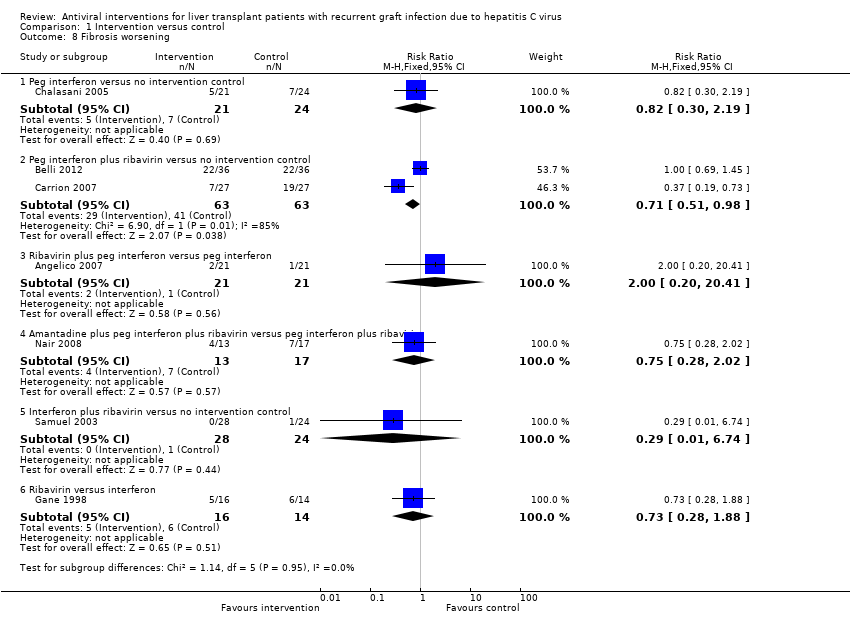
| 8 Fibrosis worsening Show forest plot | 7 | | Risk Ratio (M‐H, Fixed, 95% CI) | Subtotals only |
|
| 8.1 Peg interferon versus no intervention control | 1 | 45 | Risk Ratio (M‐H, Fixed, 95% CI) | 0.82 [0.30, 2.19] |
| 8.2 Peg interferon plus ribavirin versus no intervention control | 2 | 126 | Risk Ratio (M‐H, Fixed, 95% CI) | 0.71 [0.51, 0.98] |
| 8.3 Ribavirin plus peg interferon versus peg interferon | 1 | 42 | Risk Ratio (M‐H, Fixed, 95% CI) | 2.0 [0.20, 20.41] |
| 8.4 Amantadine plus peg interferon plus ribavirin versus peg interferon plus ribavirin | 1 | 30 | Risk Ratio (M‐H, Fixed, 95% CI) | 0.75 [0.28, 2.02] |
| 8.5 Interferon plus ribavirin versus no intervention control | 1 | 52 | Risk Ratio (M‐H, Fixed, 95% CI) | 0.29 [0.01, 6.74] |
| 8.6 Ribavirin versus interferon | 1 | 30 | Risk Ratio (M‐H, Fixed, 95% CI) | 0.73 [0.28, 1.88] |