Scolaris Content Display Scolaris Content Display

Late patient tracers vs no late patient tracer: Patients who did not complete treatment
Figuras y tablas -
Figure 1

Late patient tracers vs no late patient tracer: Patients who did not complete treatment

Late patient tracers (home visit) vs letter: Patients who did not complete treatment
Figuras y tablas -
Figure 2

Late patient tracers (home visit) vs letter: Patients who did not complete treatment

Reminders (automated telephone message) vs no message: Non‐attendance at clinic appointment
Figuras y tablas -
Figure 3

Reminders (automated telephone message) vs no message: Non‐attendance at clinic appointment

Reminder plus health education vs usual care: Non‐adherence to final clinic appointment
Figuras y tablas -
Figure 4

Reminder plus health education vs usual care: Non‐adherence to final clinic appointment

Comparison 1 Late patient tracers vs no late patient tracer, Outcome 1 Patients who did not complete treatment.
Figuras y tablas -
Analysis 1.1

Comparison 1 Late patient tracers vs no late patient tracer, Outcome 1 Patients who did not complete treatment.

Comparison 1 Late patient tracers vs no late patient tracer, Outcome 2 Failure of patients to return to treatment after first missed appointment.
Figuras y tablas -
Analysis 1.2

Comparison 1 Late patient tracers vs no late patient tracer, Outcome 2 Failure of patients to return to treatment after first missed appointment.

Comparison 2 Late patient tracers (home visit plus health education) vs usual care, Outcome 1 Patients who did not complete treatment.
Figuras y tablas -
Analysis 2.1

Comparison 2 Late patient tracers (home visit plus health education) vs usual care, Outcome 1 Patients who did not complete treatment.

Comparison 2 Late patient tracers (home visit plus health education) vs usual care, Outcome 2 Treatment interrupted for 2 consecutive months or more.
Figuras y tablas -
Analysis 2.2

Comparison 2 Late patient tracers (home visit plus health education) vs usual care, Outcome 2 Treatment interrupted for 2 consecutive months or more.

Comparison 2 Late patient tracers (home visit plus health education) vs usual care, Outcome 3 Treatment failure.
Figuras y tablas -
Analysis 2.3

Comparison 2 Late patient tracers (home visit plus health education) vs usual care, Outcome 3 Treatment failure.

Comparison 2 Late patient tracers (home visit plus health education) vs usual care, Outcome 4 Death.
Figuras y tablas -
Analysis 2.4

Comparison 2 Late patient tracers (home visit plus health education) vs usual care, Outcome 4 Death.

Comparison 2 Late patient tracers (home visit plus health education) vs usual care, Outcome 5 Sputum‐smear positive follow up.
Figuras y tablas -
Analysis 2.5

Comparison 2 Late patient tracers (home visit plus health education) vs usual care, Outcome 5 Sputum‐smear positive follow up.

Comparison 3 Late patient tracers (home visit) vs letter, Outcome 1 Patients who did not complete treatment.
Figuras y tablas -
Analysis 3.1

Comparison 3 Late patient tracers (home visit) vs letter, Outcome 1 Patients who did not complete treatment.

Comparison 3 Late patient tracers (home visit) vs letter, Outcome 2 Failure of patients to return for treatment after missed appointment.
Figuras y tablas -
Analysis 3.2

Comparison 3 Late patient tracers (home visit) vs letter, Outcome 2 Failure of patients to return for treatment after missed appointment.

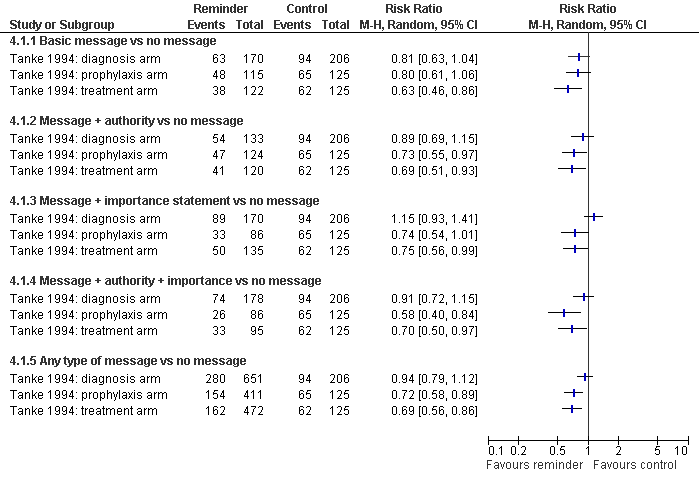
Comparison 4 Reminders (automated telephone message) vs no message, Outcome 1 Non‐attendance at clinic appointment.
Figuras y tablas -
Analysis 4.1

Comparison 4 Reminders (automated telephone message) vs no message, Outcome 1 Non‐attendance at clinic appointment.

Comparison 5 Reminders (non‐automated reminder phone call) vs no reminder, Outcome 1 Non‐adherence to Mantoux test reading.
Figuras y tablas -
Analysis 5.1

Comparison 5 Reminders (non‐automated reminder phone call) vs no reminder, Outcome 1 Non‐adherence to Mantoux test reading.

Comparison 6 Reminder plus health education vs usual care, Outcome 1 Non‐adherence to final clinic appointment.
Figuras y tablas -
Analysis 6.1

Comparison 6 Reminder plus health education vs usual care, Outcome 1 Non‐adherence to final clinic appointment.

Comparison 7 Reminder vs other types of reminders and no reminder, Outcome 1 Failed to return for skin test reading.
Figuras y tablas -
Analysis 7.1

Comparison 7 Reminder vs other types of reminders and no reminder, Outcome 1 Failed to return for skin test reading.

Comparison 7 Reminder vs other types of reminders and no reminder, Outcome 2 Failed to return for skin test reading.
Figuras y tablas -
Analysis 7.2

Comparison 7 Reminder vs other types of reminders and no reminder, Outcome 2 Failed to return for skin test reading.

Table 1. Detailed search strategies

Search set

Cochrane SRa

CENTRAL

MEDLINEb

EMBASEb

LILACSb

SCI‐EXPANDED & SSCI

CINAHL

1

tuberculosis

tuberculosis

tuberculosis

tuberculosis

tuberculosis

tuberculosis

tuberculosis

2

adherence

PATIENT COMPLIANCE

TUBERCULOSIS/DRUG THERAPY/PREVENTION AND CONTROL

TUBERCULOSIS

adherence

adherence

adherence

3

compliance

PATIENT DROPOUTS

PATIENT COMPLIANCE

PATIENT‐COMPLIANCE

compliance

compliance

compliance

4

monitor*

REMINDER SYSTEMS

PATIENT DROPOUTS

medication adherence

monitor*

monitor*

monitor*

5

reminder*

TREATMENT REFUSAL

COOPERATIVE BEHAVIOUR

REMINDER‐SYSTEM

reminder*

reminder*

reminder*

6

2 or 3 or 4 or 5 or 6

DIRECTLY OBSERVED THERAPY

TREATMENT REFUSAL

TREATMENT‐REFUSAL

2 or 3 or 4 or 5

non‐adherence

non‐adherence

7

1 and 6

medication adherence

medication adherence

DIRECTLY‐OBSERVED‐THERAPY

1 and 6

late patient tracer

late patient tracer

8

electronic monitoring

REMINDER SYSTEMS

electronic monitoring

2‐7/or

2‐7/or

9

nonadherence

electronic monitoring

nonadherence

1 and 8

1 and 8

10

non‐adherence

nonadherence

non‐adherence

11

late patient tracer

non‐adherence

late patient tracer

12

2‐11/or

DIRECTLY OBSERVED THERAPY

1 or 2

13

1 and 12

late patient tracer

3‐11/or

14

1 or 2

13 and 14

15

3‐13/or

16

14 and 15

aCochrane Infectious Diseases Group Specialized Register and the Cochrane Effective Practice and Organisation of Care Group Specialized Register.
bSearch terms used in combination with the search strategy for retrieving trials developed by The Cochrane Collaboration (Lefebvre 2006); upper case: MeSH or EMTREE heading; lower case: free text term.

Figuras y tablas -
Table 1. Detailed search strategies
Table 2. Risk of bias assessment

Intervention

Trial

Design

Generation of allocation sequence

Allocation concealment

Blinded assessment

Inclusion of randomized participants in the analysis

Protection against contamination

Late patient tracers

Krishnaswami 1981

RCT

Unclear

Unclear

Unclear

Adequate

Unclear

Paramasivan 1993

RCT

Adequate

Adequate

No

Adequate

Done

Mohan 2003

RCT

Adequate

Adequate

Yes

Adequate

Done

Reminder systems

Roberts 1983i

RCT

Unclear

Unclear

Unclear

Adequate

Unclear

Roberts 1983ii

RCT

Unclear

Unclear

Unclear

Adequate

Unclear

Sanmarti 1993

RCT

Unclear

Unclear

Unclear

Adequate

Unclear

Tanke 1994

Quasi‐RCT

Inadequate

Unclear

Unclear

Adequate

Unclear

Cheng 1997

Quasi‐RCT

Inadequate

Unclear

Unclear

Adequate

Unclear

Tanke 1997

RCT

Unclear

Unclear

Unclear

Adequate

Unclear

RCT: randomized controlled trial.

Figuras y tablas -
Table 2. Risk of bias assessment
Comparison 1. Late patient tracers vs no late patient tracer

Outcome or subgroup title

No. of studies

No. of participants

Statistical method

Effect size

1 Patients who did not complete treatment Show forest plot

2

Risk Ratio (M‐H, Fixed, 95% CI)

Totals not selected

1.1 Home visit plus health education vs usual care (directly observed therapy, short‐course)

1

Risk Ratio (M‐H, Fixed, 95% CI)

0.0 [0.0, 0.0]

1.2 Reminder letter vs usual care

1

Risk Ratio (M‐H, Fixed, 95% CI)

0.0 [0.0, 0.0]

2 Failure of patients to return to treatment after first missed appointment Show forest plot

1

Risk Ratio (M‐H, Fixed, 95% CI)

Totals not selected

Figuras y tablas -
Comparison 1. Late patient tracers vs no late patient tracer
Comparison 2. Late patient tracers (home visit plus health education) vs usual care

Outcome or subgroup title

No. of studies

No. of participants

Statistical method

Effect size

1 Patients who did not complete treatment Show forest plot

1

Risk Ratio (M‐H, Fixed, 95% CI)

Totals not selected

2 Treatment interrupted for 2 consecutive months or more Show forest plot

1

Risk Ratio (M‐H, Fixed, 95% CI)

Totals not selected

3 Treatment failure Show forest plot

1

Risk Ratio (M‐H, Fixed, 95% CI)

Totals not selected

4 Death Show forest plot

1

Risk Ratio (M‐H, Fixed, 95% CI)

Totals not selected

5 Sputum‐smear positive follow up Show forest plot

1

Risk Ratio (M‐H, Fixed, 95% CI)

Totals not selected

5.1 2 months

1

Risk Ratio (M‐H, Fixed, 95% CI)

0.0 [0.0, 0.0]

5.2 5 months

1

Risk Ratio (M‐H, Fixed, 95% CI)

0.0 [0.0, 0.0]

5.3 End of treatment

1

Risk Ratio (M‐H, Fixed, 95% CI)

0.0 [0.0, 0.0]

Figuras y tablas -
Comparison 2. Late patient tracers (home visit plus health education) vs usual care
Comparison 3. Late patient tracers (home visit) vs letter

Outcome or subgroup title

No. of studies

No. of participants

Statistical method

Effect size

1 Patients who did not complete treatment Show forest plot

1

Risk Ratio (M‐H, Fixed, 95% CI)

Totals not selected

2 Failure of patients to return for treatment after missed appointment Show forest plot

1

Risk Ratio (M‐H, Fixed, 95% CI)

Totals not selected

Figuras y tablas -
Comparison 3. Late patient tracers (home visit) vs letter
Comparison 4. Reminders (automated telephone message) vs no message

Outcome or subgroup title

No. of studies

No. of participants

Statistical method

Effect size

1 Non‐attendance at clinic appointment Show forest plot

3

Risk Ratio (M‐H, Random, 95% CI)

Totals not selected

1.1 Basic message vs no message

3

Risk Ratio (M‐H, Random, 95% CI)

0.0 [0.0, 0.0]

1.2 Message + authority vs no message

3

Risk Ratio (M‐H, Random, 95% CI)

0.0 [0.0, 0.0]

1.3 Message + importance statement vs no message

3

Risk Ratio (M‐H, Random, 95% CI)

0.0 [0.0, 0.0]

1.4 Message + authority + importance vs no message

3

Risk Ratio (M‐H, Random, 95% CI)

0.0 [0.0, 0.0]

1.5 Any type of message vs no message

3

Risk Ratio (M‐H, Random, 95% CI)

0.0 [0.0, 0.0]

Figuras y tablas -
Comparison 4. Reminders (automated telephone message) vs no message
Comparison 5. Reminders (non‐automated reminder phone call) vs no reminder

Outcome or subgroup title

No. of studies

No. of participants

Statistical method

Effect size

1 Non‐adherence to Mantoux test reading Show forest plot

1

Risk Ratio (M‐H, Fixed, 95% CI)

Totals not selected

1.1 Reminder phone call vs no call

1

Risk Ratio (M‐H, Fixed, 95% CI)

0.0 [0.0, 0.0]

Figuras y tablas -
Comparison 5. Reminders (non‐automated reminder phone call) vs no reminder
Comparison 6. Reminder plus health education vs usual care

Outcome or subgroup title

No. of studies

No. of participants

Statistical method

Effect size

1 Non‐adherence to final clinic appointment Show forest plot

1

Risk Ratio (M‐H, Fixed, 95% CI)

Totals not selected

1.1 Phone call plus health education vs usual care

1

Risk Ratio (M‐H, Fixed, 95% CI)

0.0 [0.0, 0.0]

1.2 Home visit plus health education vs usual care

1

Risk Ratio (M‐H, Fixed, 95% CI)

0.0 [0.0, 0.0]

Figuras y tablas -
Comparison 6. Reminder plus health education vs usual care
Comparison 7. Reminder vs other types of reminders and no reminder

Outcome or subgroup title

No. of studies

No. of participants

Statistical method

Effect size

1 Failed to return for skin test reading Show forest plot

1

Risk Ratio (M‐H, Fixed, 95% CI)

Totals not selected

1.1 Expert vs non‐expert

1

Risk Ratio (M‐H, Fixed, 95% CI)

0.0 [0.0, 0.0]

1.2 Take‐home card vs postcard

1

Risk Ratio (M‐H, Fixed, 95% CI)

0.0 [0.0, 0.0]

1.3 Take‐home card vs telephone call

1

Risk Ratio (M‐H, Fixed, 95% CI)

0.0 [0.0, 0.0]

1.4 Take‐home card vs person‐to‐person

1

Risk Ratio (M‐H, Fixed, 95% CI)

0.0 [0.0, 0.0]

1.5 Postcard vs telephone call

1

Risk Ratio (M‐H, Fixed, 95% CI)

0.0 [0.0, 0.0]

1.6 Postcard vs person‐to‐person

1

Risk Ratio (M‐H, Fixed, 95% CI)

0.0 [0.0, 0.0]

1.7 Telephone call vs person‐to‐person

1

Risk Ratio (M‐H, Fixed, 95% CI)

0.0 [0.0, 0.0]

2 Failed to return for skin test reading Show forest plot

1

Risk Ratio (M‐H, Fixed, 95% CI)

Totals not selected

Figuras y tablas -
Comparison 7. Reminder vs other types of reminders and no reminder