Antiviral prophylactic intervention for chronic hepatitis C virus in patients undergoing liver transplantation
Referencias
References to studies included in this review
References to studies excluded from this review
Additional references
Characteristics of studies
Characteristics of included studies [ordered by study ID]
Ir a:
| Methods | Randomised clinical trial | |
| Participants | Country: Italy. | |
| Interventions | The participants were randomly assigned to two groups. Timing of commencement of treatment: as soon as patients could tolerate food. | |
| Outcomes | The outcomes reported were inflammatory activity and adverse effects of drug. | |
| Notes | Reasons for post‐randomisation drop‐out: Initially 37 patients were randomised to three groups. Only two groups were included for this review. A total of 7 patients died in all the three groups. It is not clear how many died in each group. Hence, these data could not be used in our review. | |
| Risk of bias | ||
| Bias | Authors' judgement | Support for judgement |
| Blinding? | High risk | |
| Incomplete outcome data addressed? | High risk | Comment: Post‐randomisation drop‐outs could be related to the outcomes. |
| Free of selective reporting? | High risk | Comment: Important primary outcomes were not reported. |
| Free from academic bias? | Low risk | Comment: No previous published report of the same intervention by the author. |
| Methods | Randomised clinical trial | |
| Participants | Country: USA. | |
| Interventions | The participants were randomly assigned to two groups. Timing of commencement of treatment: 3 weeks after liver transplantation. | |
| Outcomes | The outcomes reported were virological response, histological response, and adverse effects. | |
| Notes | ||
| Risk of bias | ||
| Bias | Authors' judgement | Support for judgement |
| Blinding? | High risk | |
| Incomplete outcome data addressed? | High risk | Comment: Fibrosis and activity scores reported only in 12 and 11 patients in the intervention and control groups respectively. |
| Free of selective reporting? | High risk | Comment: Important primary outcomes were not reported. |
| Free from academic bias? | Low risk | Comment: No previous published report of the same intervention by the author. |
| Free from source of funding bias? | High risk | Quote: 'Supported by a grant from Roche Laboratories Inc., Nutley, NJ' |
| Methods | Randomised clinical trial | |
| Participants | Country: USA. | |
| Interventions | The participants were randomly assigned to two groups. Timing of commencement of treatment: 10 to 26 weeks after liver transplantation. | |
| Outcomes | The outcomes reported were virological response and adverse effects. | |
| Notes | Reason for post‐randomisation drop‐outs not stated. Although the authors did not include the patients for analysis, the drop‐out patients were included for virological response outcomes on a poor outcome basis. | |
| Risk of bias | ||
| Bias | Authors' judgement | Support for judgement |
| Blinding? | High risk | |
| Incomplete outcome data addressed? | High risk | Comment: Post‐randomisation dropouts could be related to outcomes. |
| Free of selective reporting? | Unclear risk | Comment: Important primary outcomes were not reported. |
| Free from academic bias? | Low risk | Comment: No previous published report of the same intervention by the author. |
| Free from source of funding bias? | High risk | Quote: 'Grant/Research Support: Roche'. |
| Methods | Randomised clinical trial | |
| Participants | Country: USA. | |
| Interventions | The participants were randomly assigned to three groups. Timing of commencement of treatment: reperfusion of graft during liver transplantation. | |
| Outcomes | The outcomes reported were re‐transplantation, virological response, and adverse events. | |
| Notes | ||
| Risk of bias | ||
| Bias | Authors' judgement | Support for judgement |
| Blinding? | High risk | |
| Incomplete outcome data addressed? | Low risk | Comment: There were no post‐randomisation drop‐outs. |
| Free of selective reporting? | High risk | Comment: Important primary outcomes were not reported. |
| Free from academic bias? | Low risk | Comment: No previous published report of the same intervention by the author. |
| Free from source of funding bias? | High risk | Quote: 'C.V.S. (one of the authors) is an employee of Nabi Biopharmaceuticals'. |
| Methods | Randomised clinical trial | |
| Participants | Country: Italy. | |
| Interventions | The participants were randomly assigned to three groups. Timing of commencement of treatment: within 4 weeks after liver transplantation. | |
| Outcomes | The outcomes reported were virological response and graft rejection. | |
| Notes | ||
| Risk of bias | ||
| Bias | Authors' judgement | Support for judgement |
| Blinding? | High risk | |
| Incomplete outcome data addressed? | Low risk | Comment: There were no post‐randomisation drop‐outs. |
| Free of selective reporting? | High risk | Comment: Important primary outcomes were not reported. |
| Free from academic bias? | Low risk | Comment: No previous published report of the same intervention by the author. |
| Methods | Randomised clinical trial | |
| Participants | Country: USA. | |
| Interventions | The participants were randomly assigned to two groups. Timing of commencement of treatment: 2 to 4 weeks after liver transplantation. | |
| Outcomes | The outcomes reported were virological response and adverse effects. | |
| Notes | ||
| Risk of bias | ||
| Bias | Authors' judgement | Support for judgement |
| Blinding? | High risk | |
| Free of selective reporting? | High risk | Comment: Important primary outcomes were not reported. |
| Free from academic bias? | Low risk | Comment: No previous published report of the same intervention by the author. |
| Methods | Randomised clinical trial | |
| Participants | Country: USA/ Israel. | |
| Interventions | The participants were randomly assigned to three groups. Timing of commencement of treatment: anhepatic phase of liver transplantation. | |
| Outcomes | The outcomes reported were patient survival, virological response and cessation of therapy. | |
| Notes | ||
| Risk of bias | ||
| Bias | Authors' judgement | Support for judgement |
| Blinding? | Low risk | Quote: 'This was a multicenter, randomised, double‐blind, placebo‐controlled, dose‐escalation trial'. |
| Incomplete outcome data addressed? | Low risk | Comment: There were no post‐randomisation drop‐outs. |
| Free of selective reporting? | High risk | Comment: Important primary outcomes were not reported. |
| Free from academic bias? | Low risk | Comment: No previous published report of the same intervention by the author. |
| Free from source of funding bias? | High risk | Quote: 'Supported by XTL Biopharmaceuticals Ltd., the developer of HCV‐AbXTL68'. |
| Methods | Randomised clinical trial | |
| Participants | Country: USA, Israel. | |
| Interventions | The participants were randomly assigned to two groups. Timing of commencement of treatment: within 2 weeks after liver transplantation. | |
| Outcomes | The outcomes reported were survival, re‐transplantation, time to recurrence of viral hepatitis. | |
| Notes | Reasons for post‐randomisation drop‐out: Low WBC (3); adjuvant chemotherapy (1); refusal to enter (1). | |
| Risk of bias | ||
| Bias | Authors' judgement | Support for judgement |
| Blinding? | High risk | Quote: 'Protocol biopsies were also reviewed by three pathologists blinded to study group'. |
| Incomplete outcome data addressed? | High risk | Comment: Post‐randomisation drop‐outs could be related to the outcomes. |
| Free of selective reporting? | Unclear risk | Comment: Important primary outcomes were not reported. |
| Free from academic bias? | Low risk | Comment: No previous published report of the same intervention by the author. |
| Free from source of funding bias? | High risk | Quote: 'Supported in part by Ortho Biotech, Raritan, NJ'. |
| Methods | Randomised clinical trial | |
| Participants | Country: USA. | |
| Interventions | The participants were randomly assigned to two groups. Timing of commencement of treatment: 2 to 6 weeks after liver transplantation. | |
| Outcomes | The outcomes reported were virological response and adverse effects. | |
| Notes | ||
| Risk of bias | ||
| Bias | Authors' judgement | Support for judgement |
| Blinding? | High risk | |
| Incomplete outcome data addressed? | Low risk | Comment: There were no post‐randomisation drop‐outs. |
| Free of selective reporting? | High risk | Comment: Important primary outcomes were not reported. |
| Free from academic bias? | Low risk | Comment: No previous published report of the same intervention by the author. |
| Free from source of funding bias? | High risk | Quote: 'The study was supported by Fugisawa Healthcare, Inc., and the UCSF Liver Center P30 DK26743 Clinical and Translational Core'. |
| Methods | Randomised clinical trial | |
| Participants | Country: USA. | |
| Interventions | The participants were randomly assigned to two groups. Timing of commencement of treatment: 2 weeks after liver transplantation. | |
| Outcomes | The outcomes reported were patient survival, re‐transplantation, recurrence, and adverse effects. | |
| Notes | ||
| Risk of bias | ||
| Bias | Authors' judgement | Support for judgement |
| Blinding? | High risk | |
| Incomplete outcome data addressed? | Low risk | Comment: There were no post‐randomisation drop‐outs. |
| Free of selective reporting? | Low risk | Comment: Important primary outcomes were reported. |
| Free from academic bias? | Low risk | Comment: No previous published report of the same intervention by the author. |
| Methods | Randomised clinical trial | |
| Participants | Country: Canada. | |
| Interventions | The participants were randomly assigned to three groups. Timing of commencement of treatment: anhepatic phase of liver transplantation. | |
| Outcomes | The outcome reported was virological response. | |
| Notes | ||
| Risk of bias | ||
| Bias | Authors' judgement | Support for judgement |
| Blinding? | Low risk | Quote: 'Twenty‐six HCV‐RNA positive OLT candidates were randomly assigned at the time of transplantation to one of three treatment schedules in a double‐blind fashion'. |
| Free of selective reporting? | High risk | Comment: Important primary outcomes were not reported. |
| Free from academic bias? | Low risk | Comment: No previous published report of the same intervention by the author. |
Characteristics of excluded studies [ordered by study ID]
Ir a:
| Study | Reason for exclusion |
| Not a randomised clinical trial. | |
| Not a randomised clinical trial. | |
| Comment on a trial of antiviral therapy in patients with recurrent HCV infection after liver transplantation. | |
| Not a randomised clinical trial. | |
| Not a randomised clinical trial. | |
| Not a randomised clinical trial. | |
| Editorial. | |
| Review. | |
| Not a randomised clinical trial. | |
| Editorial. | |
| Comments on trial in patients with recurrent HCV infection after liver transplantation. | |
| Comment on a trial of antiviral therapy in patients with recurrent HCV infection after liver transplantation. |
Data and analyses
| Outcome or subgroup title | No. of studies | No. of participants | Statistical method | Effect size |
| 1 90‐day mortality Show forest plot | 3 | Risk Ratio (M‐H, Fixed, 95% CI) | Subtotals only | |
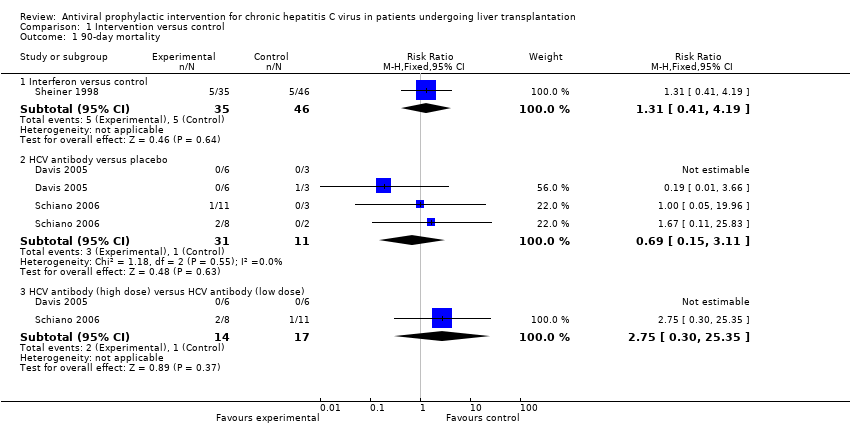
| Analysis 1.1  Comparison 1 Intervention versus control, Outcome 1 90‐day mortality. | ||||
| 1.1 Interferon versus control | 1 | 81 | Risk Ratio (M‐H, Fixed, 95% CI) | 1.31 [0.41, 4.19] |
| 1.2 HCV antibody versus placebo | 2 | 42 | Risk Ratio (M‐H, Fixed, 95% CI) | 0.69 [0.15, 3.11] |
| 1.3 HCV antibody (high dose) versus HCV antibody (low dose) | 2 | 31 | Risk Ratio (M‐H, Fixed, 95% CI) | 2.75 [0.30, 25.35] |
| 2 Mortality at maximal follow‐up Show forest plot | 3 | Risk Ratio (M‐H, Fixed, 95% CI) | Subtotals only | |
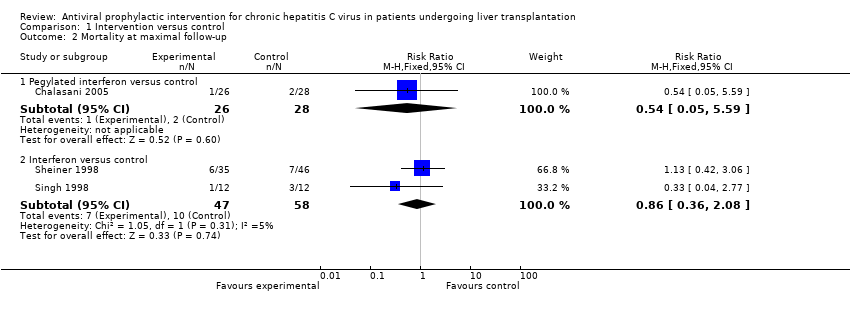
| Analysis 1.2  Comparison 1 Intervention versus control, Outcome 2 Mortality at maximal follow‐up. | ||||
| 2.1 Pegylated interferon versus control | 1 | 54 | Risk Ratio (M‐H, Fixed, 95% CI) | 0.54 [0.05, 5.59] |
| 2.2 Interferon versus control | 2 | 105 | Risk Ratio (M‐H, Fixed, 95% CI) | 0.86 [0.36, 2.08] |
| 3 Mortality (hazard ratio) Show forest plot | 1 | Hazard Ratio (Fixed, 95% CI) | Subtotals only | |
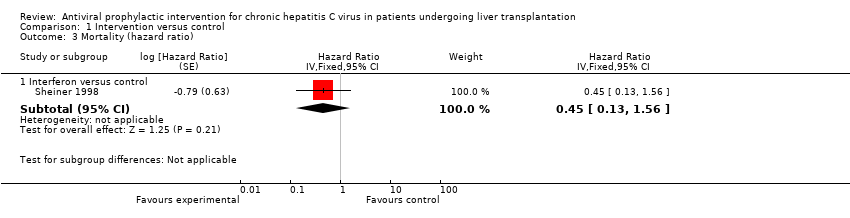
| Analysis 1.3  Comparison 1 Intervention versus control, Outcome 3 Mortality (hazard ratio). | ||||
| 3.1 Interferon versus control | 1 | Hazard Ratio (Fixed, 95% CI) | 0.45 [0.13, 1.56] | |
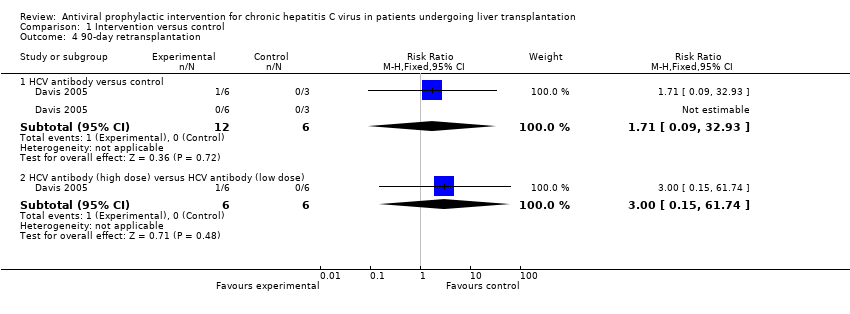
| 4 90‐day retransplantation Show forest plot | 1 | Risk Ratio (M‐H, Fixed, 95% CI) | Subtotals only | |
| Analysis 1.4  Comparison 1 Intervention versus control, Outcome 4 90‐day retransplantation. | ||||
| 4.1 HCV antibody versus control | 1 | 18 | Risk Ratio (M‐H, Fixed, 95% CI) | 1.71 [0.09, 32.93] |
| 4.2 HCV antibody (high dose) versus HCV antibody (low dose) | 1 | 12 | Risk Ratio (M‐H, Fixed, 95% CI) | 3.0 [0.15, 61.74] |
| 5 Re‐transplantation at maximal follow‐up Show forest plot | 2 | Risk Ratio (M‐H, Fixed, 95% CI) | Subtotals only | |
| Analysis 1.5  Comparison 1 Intervention versus control, Outcome 5 Re‐transplantation at maximal follow‐up. | ||||
| 5.1 Interferon versus control | 2 | 105 | Risk Ratio (M‐H, Fixed, 95% CI) | 1.17 [0.22, 6.20] |
| 6 Graft rejection requiring re‐transplantation Show forest plot | 1 | Risk Ratio (M‐H, Fixed, 95% CI) | Subtotals only | |
| Analysis 1.6  Comparison 1 Intervention versus control, Outcome 6 Graft rejection requiring re‐transplantation. | ||||
| 6.1 Interferon versus control | 1 | 31 | Risk Ratio (M‐H, Fixed, 95% CI) | 0.0 [0.0, 0.0] |
| 6.2 Interferon and ribavirin versus control | 1 | 32 | Risk Ratio (M‐H, Fixed, 95% CI) | 0.0 [0.0, 0.0] |
| 6.3 Ribavirin and interferon versus interferon | 1 | 43 | Risk Ratio (M‐H, Fixed, 95% CI) | 0.0 [0.0, 0.0] |
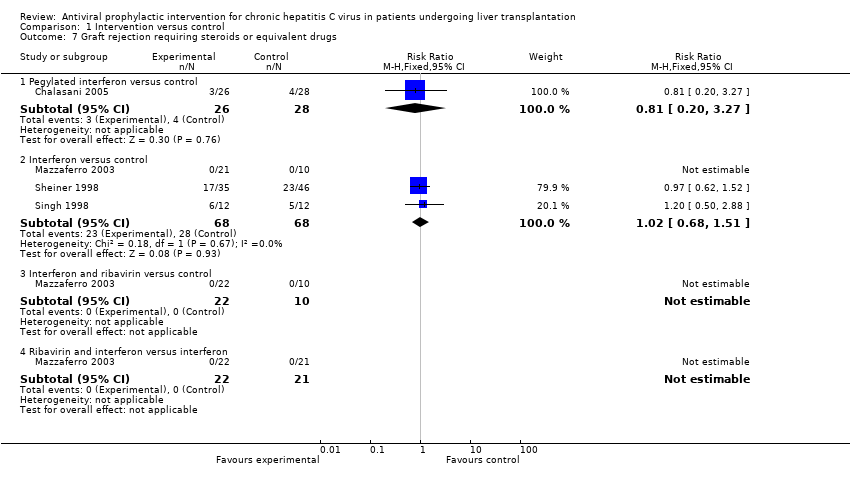
| 7 Graft rejection requiring steroids or equivalent drugs Show forest plot | 4 | Risk Ratio (M‐H, Fixed, 95% CI) | Subtotals only | |
| Analysis 1.7  Comparison 1 Intervention versus control, Outcome 7 Graft rejection requiring steroids or equivalent drugs. | ||||
| 7.1 Pegylated interferon versus control | 1 | 54 | Risk Ratio (M‐H, Fixed, 95% CI) | 0.81 [0.20, 3.27] |
| 7.2 Interferon versus control | 3 | 136 | Risk Ratio (M‐H, Fixed, 95% CI) | 1.02 [0.68, 1.51] |
| 7.3 Interferon and ribavirin versus control | 1 | 32 | Risk Ratio (M‐H, Fixed, 95% CI) | 0.0 [0.0, 0.0] |
| 7.4 Ribavirin and interferon versus interferon | 1 | 43 | Risk Ratio (M‐H, Fixed, 95% CI) | 0.0 [0.0, 0.0] |
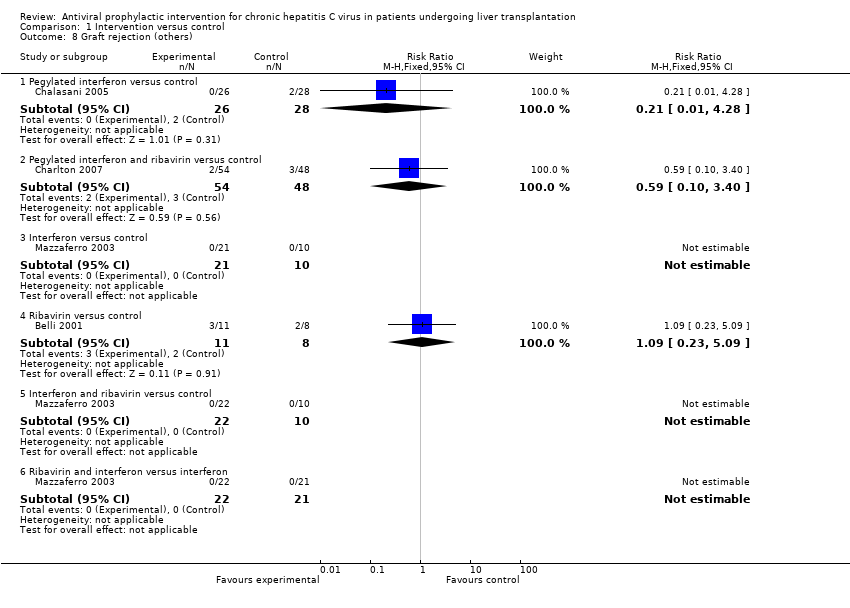
| 8 Graft rejection (others) Show forest plot | 4 | Risk Ratio (M‐H, Fixed, 95% CI) | Subtotals only | |
| Analysis 1.8  Comparison 1 Intervention versus control, Outcome 8 Graft rejection (others). | ||||
| 8.1 Pegylated interferon versus control | 1 | 54 | Risk Ratio (M‐H, Fixed, 95% CI) | 0.21 [0.01, 4.28] |
| 8.2 Pegylated interferon and ribavirin versus control | 1 | 102 | Risk Ratio (M‐H, Fixed, 95% CI) | 0.59 [0.10, 3.40] |
| 8.3 Interferon versus control | 1 | 31 | Risk Ratio (M‐H, Fixed, 95% CI) | 0.0 [0.0, 0.0] |
| 8.4 Ribavirin versus control | 1 | 19 | Risk Ratio (M‐H, Fixed, 95% CI) | 1.09 [0.23, 5.09] |
| 8.5 Interferon and ribavirin versus control | 1 | 32 | Risk Ratio (M‐H, Fixed, 95% CI) | 0.0 [0.0, 0.0] |
| 8.6 Ribavirin and interferon versus interferon | 1 | 43 | Risk Ratio (M‐H, Fixed, 95% CI) | 0.0 [0.0, 0.0] |
| 9 Cessation of treatment Show forest plot | 5 | Risk Ratio (M‐H, Fixed, 95% CI) | Subtotals only | |
| Analysis 1.9  Comparison 1 Intervention versus control, Outcome 9 Cessation of treatment. | ||||
| 9.1 Pegylated interferon versus control | 1 | 54 | Risk Ratio (M‐H, Fixed, 95% CI) | 0.96 [0.44, 2.11] |
| 9.2 Interferon versus control | 1 | 81 | Risk Ratio (M‐H, Fixed, 95% CI) | 27.42 [1.66, 452.50] |
| 9.3 Ribavirin versus control | 1 | 19 | Risk Ratio (M‐H, Fixed, 95% CI) | 2.25 [0.10, 49.04] |
| 9.4 HCV antibody versus placebo | 2 | 42 | Risk Ratio (M‐H, Fixed, 95% CI) | 2.49 [0.52, 11.98] |
| 9.5 HCV antibody (high dose) versus HCV antibody (low dose) | 2 | 31 | Risk Ratio (M‐H, Fixed, 95% CI) | 1.97 [0.60, 6.45] |
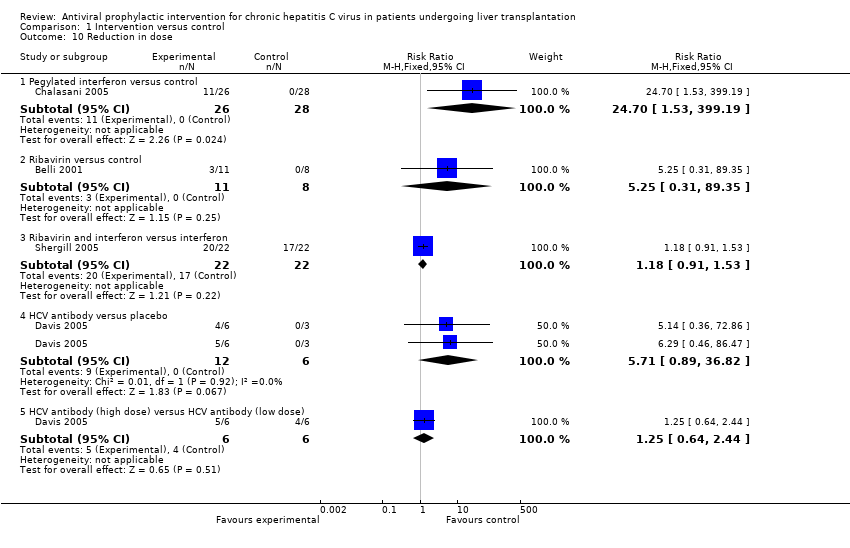
| 10 Reduction in dose Show forest plot | 4 | Risk Ratio (M‐H, Fixed, 95% CI) | Subtotals only | |
| Analysis 1.10  Comparison 1 Intervention versus control, Outcome 10 Reduction in dose. | ||||
| 10.1 Pegylated interferon versus control | 1 | 54 | Risk Ratio (M‐H, Fixed, 95% CI) | 24.70 [1.53, 399.19] |
| 10.2 Ribavirin versus control | 1 | 19 | Risk Ratio (M‐H, Fixed, 95% CI) | 5.25 [0.31, 89.35] |
| 10.3 Ribavirin and interferon versus interferon | 1 | 44 | Risk Ratio (M‐H, Fixed, 95% CI) | 1.18 [0.91, 1.53] |
| 10.4 HCV antibody versus placebo | 1 | 18 | Risk Ratio (M‐H, Fixed, 95% CI) | 5.71 [0.89, 36.82] |
| 10.5 HCV antibody (high dose) versus HCV antibody (low dose) | 1 | 12 | Risk Ratio (M‐H, Fixed, 95% CI) | 1.25 [0.64, 2.44] |
| 11 Anaemia Show forest plot | 4 | Risk Ratio (M‐H, Fixed, 95% CI) | Subtotals only | |
| Analysis 1.11  Comparison 1 Intervention versus control, Outcome 11 Anaemia. | ||||
| 11.1 Pegylated interferon versus control | 1 | 54 | Risk Ratio (M‐H, Fixed, 95% CI) | 0.43 [0.09, 2.03] |
| 11.2 Pegylated interferon and ribavirin versus control | 1 | 102 | Risk Ratio (M‐H, Fixed, 95% CI) | 8.0 [1.05, 60.86] |
| 11.3 Ribavirin versus control | 1 | 19 | Risk Ratio (M‐H, Fixed, 95% CI) | 6.75 [0.41, 110.01] |
| 11.4 Interferon and ribavirin versus control | 1 | 32 | Risk Ratio (M‐H, Fixed, 95% CI) | 13.64 [0.88, 210.72] |
| 12 Leukopenia Show forest plot | 2 | Risk Ratio (M‐H, Fixed, 95% CI) | Subtotals only | |
| Analysis 1.12  Comparison 1 Intervention versus control, Outcome 12 Leukopenia. | ||||
| 12.1 Pegylated interferon versus control | 1 | 54 | Risk Ratio (M‐H, Fixed, 95% CI) | 1.29 [0.45, 3.73] |
| 12.2 Interferon versus control | 1 | 24 | Risk Ratio (M‐H, Fixed, 95% CI) | 5.0 [0.27, 94.34] |
| 13 Renal failure Show forest plot | 1 | Risk Ratio (M‐H, Fixed, 95% CI) | Subtotals only | |
| Analysis 1.13  Comparison 1 Intervention versus control, Outcome 13 Renal failure. | ||||
| 13.1 Pegylated interferon versus control | 1 | 54 | Risk Ratio (M‐H, Fixed, 95% CI) | 0.43 [0.09, 2.03] |
| 14 Depression Show forest plot | 2 | Risk Ratio (M‐H, Fixed, 95% CI) | Subtotals only | |
| Analysis 1.14  Comparison 1 Intervention versus control, Outcome 14 Depression. | ||||
| 14.1 Pegylated interferon versus control | 1 | 54 | Risk Ratio (M‐H, Fixed, 95% CI) | 1.79 [0.48, 6.77] |
| 14.2 Pegylated interferon and ribavirin versus control | 1 | 102 | Risk Ratio (M‐H, Fixed, 95% CI) | 0.0 [0.0, 0.0] |
| 15 Rapid virological response Show forest plot | 2 | Risk Ratio (M‐H, Fixed, 95% CI) | Subtotals only | |
| Analysis 1.15  Comparison 1 Intervention versus control, Outcome 15 Rapid virological response. | ||||
| 15.1 Pegylated interferon versus control | 1 | 54 | Risk Ratio (M‐H, Fixed, 95% CI) | 0.89 [0.76, 1.03] |
| 15.2 Pegylated interferon and ribavirin versus control | 1 | 115 | Risk Ratio (M‐H, Fixed, 95% CI) | 0.93 [0.86, 1.01] |
| 16 Early virological response Show forest plot | 2 | Risk Ratio (M‐H, Fixed, 95% CI) | Subtotals only | |
| Analysis 1.16  Comparison 1 Intervention versus control, Outcome 16 Early virological response. | ||||
| 16.1 Pegylated interferon versus control | 1 | 54 | Risk Ratio (M‐H, Fixed, 95% CI) | 0.85 [0.71, 1.01] |
| 16.2 Pegylated interferon and ribavirin versus control | 1 | 115 | Risk Ratio (M‐H, Fixed, 95% CI) | 0.84 [0.72, 0.98] |
| 17 End of treatment virological response Show forest plot | 4 | Risk Ratio (M‐H, Fixed, 95% CI) | Subtotals only | |
| Analysis 1.17  Comparison 1 Intervention versus control, Outcome 17 End of treatment virological response. | ||||
| 17.1 Pegylated interferon versus control | 1 | 54 | Risk Ratio (M‐H, Fixed, 95% CI) | 0.85 [0.71, 1.01] |
| 17.2 Interferon versus control | 1 | 81 | Risk Ratio (M‐H, Fixed, 95% CI) | 0.63 [0.39, 1.04] |
| 17.3 Ribavirin and interferon versus interferon | 1 | 44 | Risk Ratio (M‐H, Fixed, 95% CI) | 0.81 [0.63, 1.03] |
| 17.4 HCV antibody versus placebo | 1 | 18 | Risk Ratio (M‐H, Fixed, 95% CI) | 1.0 [0.74, 1.35] |
| 17.5 HCV antibody (high dose) versus HCV antibody (low dose) | 1 | 12 | Risk Ratio (M‐H, Fixed, 95% CI) | 1.0 [0.75, 1.34] |
| 18 Sustained virological response Show forest plot | 8 | Risk Ratio (M‐H, Fixed, 95% CI) | Subtotals only | |
| Analysis 1.18  Comparison 1 Intervention versus control, Outcome 18 Sustained virological response. | ||||
| 18.1 Pegylated interferon versus control | 1 | 54 | Risk Ratio (M‐H, Fixed, 95% CI) | 0.92 [0.81, 1.05] |
| 18.2 Pegylated interferon and ribavirin versus control | 1 | 115 | Risk Ratio (M‐H, Fixed, 95% CI) | 0.82 [0.71, 0.96] |
| 18.3 Interferon versus control | 2 | 55 | Risk Ratio (M‐H, Fixed, 95% CI) | 0.99 [0.70, 1.39] |
| 18.4 Ribavirin versus control | 1 | 32 | Risk Ratio (M‐H, Fixed, 95% CI) | 0.85 [0.56, 1.30] |
| 18.5 Interferon and ribavirin versus control | 1 | 32 | Risk Ratio (M‐H, Fixed, 95% CI) | 0.94 [0.73, 1.22] |
| 18.6 Ribavirin and interferon versus interferon | 1 | 43 | Risk Ratio (M‐H, Fixed, 95% CI) | 0.84 [0.59, 1.20] |
| 18.7 HCV antibody versus placebo | 3 | 58 | Risk Ratio (M‐H, Fixed, 95% CI) | 1.0 [0.84, 1.19] |
| 18.8 HCV antibody (high dose) versus HCV antibody (low dose) | 3 | 40 | Risk Ratio (M‐H, Fixed, 95% CI) | 1.0 [0.85, 1.17] |
| 19 Virological titre at maximal follow‐up Show forest plot | 1 | Mean Difference (IV, Fixed, 95% CI) | Subtotals only | |
| Analysis 1.19  Comparison 1 Intervention versus control, Outcome 19 Virological titre at maximal follow‐up. | ||||
| 19.1 Pegylated interferon versus control | 1 | 54 | Mean Difference (IV, Fixed, 95% CI) | 0.20 [‐1.35, 1.75] |
| 20 Recurrence (hazard ratio) Show forest plot | 2 | Hazard Ratio (Fixed, 95% CI) | Subtotals only | |
| Analysis 1.20  Comparison 1 Intervention versus control, Outcome 20 Recurrence (hazard ratio). | ||||
| 20.1 Interferon versus control | 2 | Hazard Ratio (Fixed, 95% CI) | 0.87 [0.61, 1.24] | |
| 21 Fibrosis worsening Show forest plot | 1 | Risk Ratio (M‐H, Fixed, 95% CI) | Subtotals only | |
| Analysis 1.21  Comparison 1 Intervention versus control, Outcome 21 Fibrosis worsening. | ||||
| 21.1 HCV antibody versus placebo | 1 | 18 | Risk Ratio (M‐H, Fixed, 95% CI) | 0.86 [0.17, 4.43] |
| 21.2 HCV antibody (high dose) versus HCV antibody (low dose) | 1 | 12 | Risk Ratio (M‐H, Fixed, 95% CI) | 0.33 [0.02, 6.86] |
| 22 Fibrosis score at maximal follow‐up Show forest plot | 1 | Mean Difference (IV, Fixed, 95% CI) | Subtotals only | |
| Analysis 1.22  Comparison 1 Intervention versus control, Outcome 22 Fibrosis score at maximal follow‐up. | ||||
| 22.1 Pegylated interferon versus control | 1 | 54 | Mean Difference (IV, Fixed, 95% CI) | ‐0.50 [‐1.21, 0.21] |
| 23 Activity worsening Show forest plot | 2 | Risk Ratio (M‐H, Fixed, 95% CI) | Subtotals only | |
| Analysis 1.23  Comparison 1 Intervention versus control, Outcome 23 Activity worsening. | ||||
| 23.1 Ribavirin versus control | 1 | 19 | Risk Ratio (M‐H, Fixed, 95% CI) | 1.09 [0.67, 1.78] |
| 23.2 HCV antibody versus placebo | 1 | 18 | Risk Ratio (M‐H, Fixed, 95% CI) | 1.75 [0.51, 5.98] |
| 23.3 HCV antibody (high dose) versus HCV antibody (low dose) | 1 | 12 | Risk Ratio (M‐H, Fixed, 95% CI) | 1.33 [0.50, 3.55] |
| 24 Activity score at maximal follow‐up Show forest plot | 1 | Mean Difference (IV, Fixed, 95% CI) | Subtotals only | |
| Analysis 1.24  Comparison 1 Intervention versus control, Outcome 24 Activity score at maximal follow‐up. | ||||
| 24.1 Pegylated interferon versus control | 1 | 54 | Mean Difference (IV, Fixed, 95% CI) | ‐1.70 [‐4.06, 0.66] |


Methodological quality graph: review authors' judgements about each methodological quality item presented as percentages across all included studies.
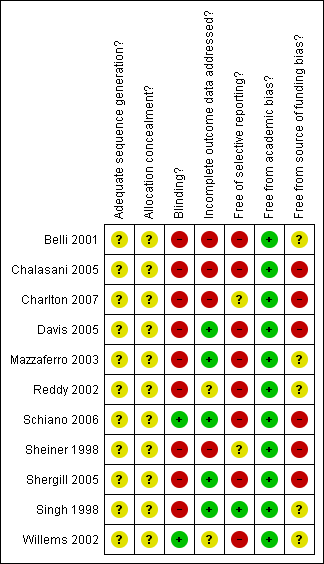
Methodological quality summary: review authors' judgements about each methodological quality item for each included study.
Comparison 1 Intervention versus control, Outcome 1 90‐day mortality.
Comparison 1 Intervention versus control, Outcome 2 Mortality at maximal follow‐up.
Comparison 1 Intervention versus control, Outcome 3 Mortality (hazard ratio).
Comparison 1 Intervention versus control, Outcome 4 90‐day retransplantation.

Comparison 1 Intervention versus control, Outcome 5 Re‐transplantation at maximal follow‐up.

Comparison 1 Intervention versus control, Outcome 6 Graft rejection requiring re‐transplantation.
Comparison 1 Intervention versus control, Outcome 7 Graft rejection requiring steroids or equivalent drugs.
Comparison 1 Intervention versus control, Outcome 8 Graft rejection (others).

Comparison 1 Intervention versus control, Outcome 9 Cessation of treatment.
Comparison 1 Intervention versus control, Outcome 10 Reduction in dose.
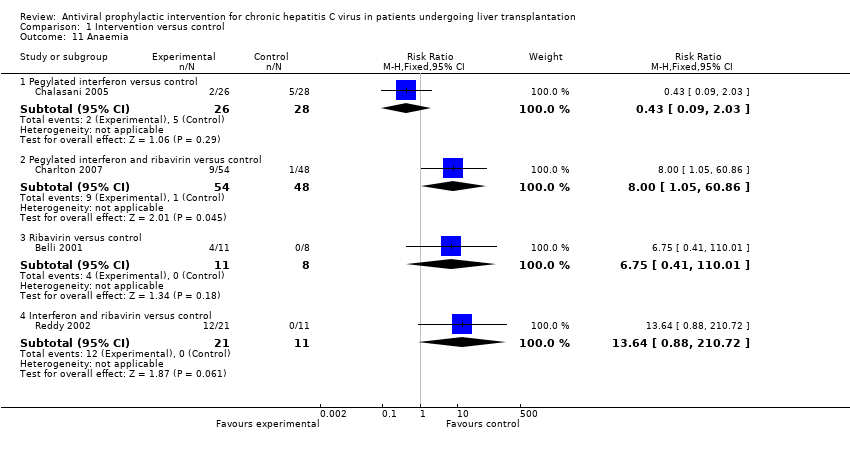
Comparison 1 Intervention versus control, Outcome 11 Anaemia.
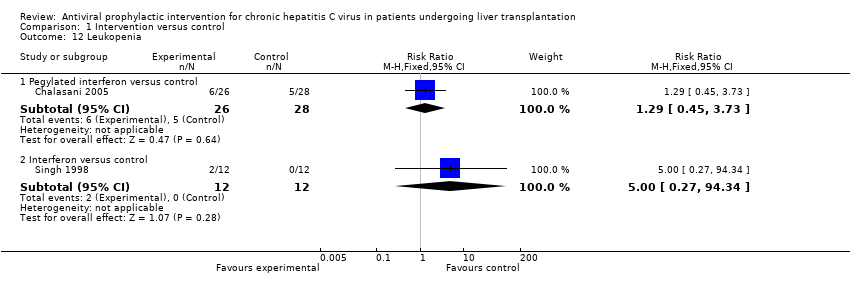
Comparison 1 Intervention versus control, Outcome 12 Leukopenia.
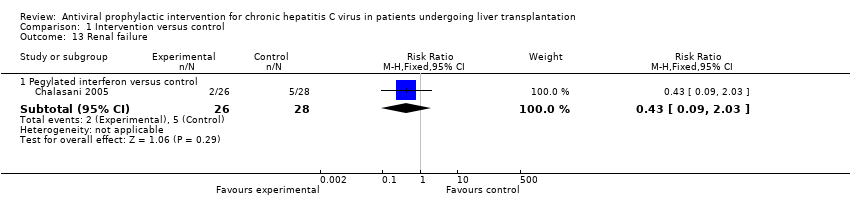
Comparison 1 Intervention versus control, Outcome 13 Renal failure.

Comparison 1 Intervention versus control, Outcome 14 Depression.
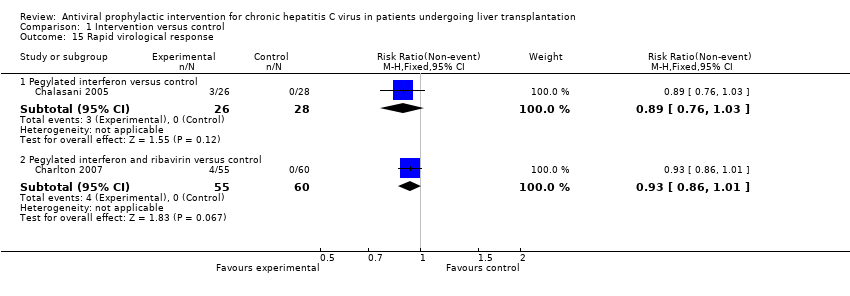
Comparison 1 Intervention versus control, Outcome 15 Rapid virological response.
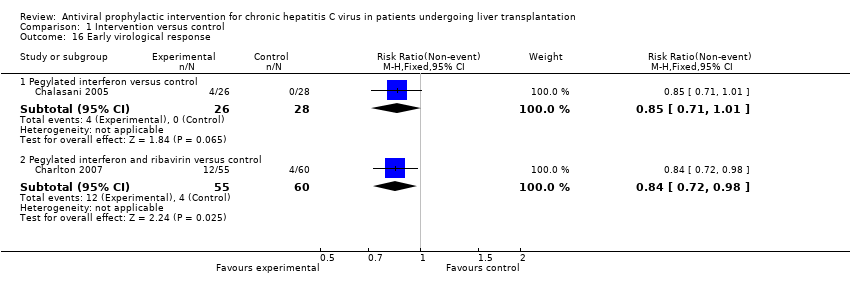
Comparison 1 Intervention versus control, Outcome 16 Early virological response.

Comparison 1 Intervention versus control, Outcome 17 End of treatment virological response.

Comparison 1 Intervention versus control, Outcome 18 Sustained virological response.

Comparison 1 Intervention versus control, Outcome 19 Virological titre at maximal follow‐up.

Comparison 1 Intervention versus control, Outcome 20 Recurrence (hazard ratio).

Comparison 1 Intervention versus control, Outcome 21 Fibrosis worsening.
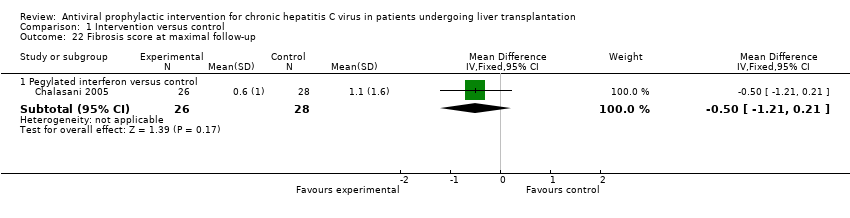
Comparison 1 Intervention versus control, Outcome 22 Fibrosis score at maximal follow‐up.
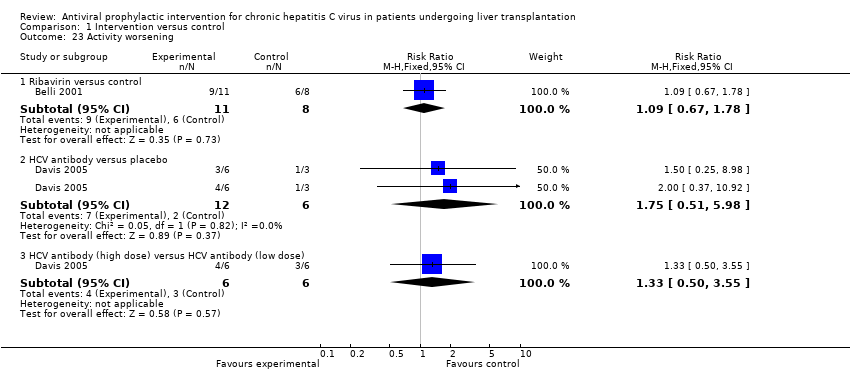
Comparison 1 Intervention versus control, Outcome 23 Activity worsening.

Comparison 1 Intervention versus control, Outcome 24 Activity score at maximal follow‐up.
| Outcome or subgroup title | No. of studies | No. of participants | Statistical method | Effect size |
| 1 90‐day mortality Show forest plot | 3 | Risk Ratio (M‐H, Fixed, 95% CI) | Subtotals only | |
| 1.1 Interferon versus control | 1 | 81 | Risk Ratio (M‐H, Fixed, 95% CI) | 1.31 [0.41, 4.19] |
| 1.2 HCV antibody versus placebo | 2 | 42 | Risk Ratio (M‐H, Fixed, 95% CI) | 0.69 [0.15, 3.11] |
| 1.3 HCV antibody (high dose) versus HCV antibody (low dose) | 2 | 31 | Risk Ratio (M‐H, Fixed, 95% CI) | 2.75 [0.30, 25.35] |
| 2 Mortality at maximal follow‐up Show forest plot | 3 | Risk Ratio (M‐H, Fixed, 95% CI) | Subtotals only | |
| 2.1 Pegylated interferon versus control | 1 | 54 | Risk Ratio (M‐H, Fixed, 95% CI) | 0.54 [0.05, 5.59] |
| 2.2 Interferon versus control | 2 | 105 | Risk Ratio (M‐H, Fixed, 95% CI) | 0.86 [0.36, 2.08] |
| 3 Mortality (hazard ratio) Show forest plot | 1 | Hazard Ratio (Fixed, 95% CI) | Subtotals only | |
| 3.1 Interferon versus control | 1 | Hazard Ratio (Fixed, 95% CI) | 0.45 [0.13, 1.56] | |
| 4 90‐day retransplantation Show forest plot | 1 | Risk Ratio (M‐H, Fixed, 95% CI) | Subtotals only | |
| 4.1 HCV antibody versus control | 1 | 18 | Risk Ratio (M‐H, Fixed, 95% CI) | 1.71 [0.09, 32.93] |
| 4.2 HCV antibody (high dose) versus HCV antibody (low dose) | 1 | 12 | Risk Ratio (M‐H, Fixed, 95% CI) | 3.0 [0.15, 61.74] |
| 5 Re‐transplantation at maximal follow‐up Show forest plot | 2 | Risk Ratio (M‐H, Fixed, 95% CI) | Subtotals only | |
| 5.1 Interferon versus control | 2 | 105 | Risk Ratio (M‐H, Fixed, 95% CI) | 1.17 [0.22, 6.20] |
| 6 Graft rejection requiring re‐transplantation Show forest plot | 1 | Risk Ratio (M‐H, Fixed, 95% CI) | Subtotals only | |
| 6.1 Interferon versus control | 1 | 31 | Risk Ratio (M‐H, Fixed, 95% CI) | 0.0 [0.0, 0.0] |
| 6.2 Interferon and ribavirin versus control | 1 | 32 | Risk Ratio (M‐H, Fixed, 95% CI) | 0.0 [0.0, 0.0] |
| 6.3 Ribavirin and interferon versus interferon | 1 | 43 | Risk Ratio (M‐H, Fixed, 95% CI) | 0.0 [0.0, 0.0] |
| 7 Graft rejection requiring steroids or equivalent drugs Show forest plot | 4 | Risk Ratio (M‐H, Fixed, 95% CI) | Subtotals only | |
| 7.1 Pegylated interferon versus control | 1 | 54 | Risk Ratio (M‐H, Fixed, 95% CI) | 0.81 [0.20, 3.27] |
| 7.2 Interferon versus control | 3 | 136 | Risk Ratio (M‐H, Fixed, 95% CI) | 1.02 [0.68, 1.51] |
| 7.3 Interferon and ribavirin versus control | 1 | 32 | Risk Ratio (M‐H, Fixed, 95% CI) | 0.0 [0.0, 0.0] |
| 7.4 Ribavirin and interferon versus interferon | 1 | 43 | Risk Ratio (M‐H, Fixed, 95% CI) | 0.0 [0.0, 0.0] |
| 8 Graft rejection (others) Show forest plot | 4 | Risk Ratio (M‐H, Fixed, 95% CI) | Subtotals only | |
| 8.1 Pegylated interferon versus control | 1 | 54 | Risk Ratio (M‐H, Fixed, 95% CI) | 0.21 [0.01, 4.28] |
| 8.2 Pegylated interferon and ribavirin versus control | 1 | 102 | Risk Ratio (M‐H, Fixed, 95% CI) | 0.59 [0.10, 3.40] |
| 8.3 Interferon versus control | 1 | 31 | Risk Ratio (M‐H, Fixed, 95% CI) | 0.0 [0.0, 0.0] |
| 8.4 Ribavirin versus control | 1 | 19 | Risk Ratio (M‐H, Fixed, 95% CI) | 1.09 [0.23, 5.09] |
| 8.5 Interferon and ribavirin versus control | 1 | 32 | Risk Ratio (M‐H, Fixed, 95% CI) | 0.0 [0.0, 0.0] |
| 8.6 Ribavirin and interferon versus interferon | 1 | 43 | Risk Ratio (M‐H, Fixed, 95% CI) | 0.0 [0.0, 0.0] |
| 9 Cessation of treatment Show forest plot | 5 | Risk Ratio (M‐H, Fixed, 95% CI) | Subtotals only | |
| 9.1 Pegylated interferon versus control | 1 | 54 | Risk Ratio (M‐H, Fixed, 95% CI) | 0.96 [0.44, 2.11] |
| 9.2 Interferon versus control | 1 | 81 | Risk Ratio (M‐H, Fixed, 95% CI) | 27.42 [1.66, 452.50] |
| 9.3 Ribavirin versus control | 1 | 19 | Risk Ratio (M‐H, Fixed, 95% CI) | 2.25 [0.10, 49.04] |
| 9.4 HCV antibody versus placebo | 2 | 42 | Risk Ratio (M‐H, Fixed, 95% CI) | 2.49 [0.52, 11.98] |
| 9.5 HCV antibody (high dose) versus HCV antibody (low dose) | 2 | 31 | Risk Ratio (M‐H, Fixed, 95% CI) | 1.97 [0.60, 6.45] |
| 10 Reduction in dose Show forest plot | 4 | Risk Ratio (M‐H, Fixed, 95% CI) | Subtotals only | |
| 10.1 Pegylated interferon versus control | 1 | 54 | Risk Ratio (M‐H, Fixed, 95% CI) | 24.70 [1.53, 399.19] |
| 10.2 Ribavirin versus control | 1 | 19 | Risk Ratio (M‐H, Fixed, 95% CI) | 5.25 [0.31, 89.35] |
| 10.3 Ribavirin and interferon versus interferon | 1 | 44 | Risk Ratio (M‐H, Fixed, 95% CI) | 1.18 [0.91, 1.53] |
| 10.4 HCV antibody versus placebo | 1 | 18 | Risk Ratio (M‐H, Fixed, 95% CI) | 5.71 [0.89, 36.82] |
| 10.5 HCV antibody (high dose) versus HCV antibody (low dose) | 1 | 12 | Risk Ratio (M‐H, Fixed, 95% CI) | 1.25 [0.64, 2.44] |
| 11 Anaemia Show forest plot | 4 | Risk Ratio (M‐H, Fixed, 95% CI) | Subtotals only | |
| 11.1 Pegylated interferon versus control | 1 | 54 | Risk Ratio (M‐H, Fixed, 95% CI) | 0.43 [0.09, 2.03] |
| 11.2 Pegylated interferon and ribavirin versus control | 1 | 102 | Risk Ratio (M‐H, Fixed, 95% CI) | 8.0 [1.05, 60.86] |
| 11.3 Ribavirin versus control | 1 | 19 | Risk Ratio (M‐H, Fixed, 95% CI) | 6.75 [0.41, 110.01] |
| 11.4 Interferon and ribavirin versus control | 1 | 32 | Risk Ratio (M‐H, Fixed, 95% CI) | 13.64 [0.88, 210.72] |
| 12 Leukopenia Show forest plot | 2 | Risk Ratio (M‐H, Fixed, 95% CI) | Subtotals only | |
| 12.1 Pegylated interferon versus control | 1 | 54 | Risk Ratio (M‐H, Fixed, 95% CI) | 1.29 [0.45, 3.73] |
| 12.2 Interferon versus control | 1 | 24 | Risk Ratio (M‐H, Fixed, 95% CI) | 5.0 [0.27, 94.34] |
| 13 Renal failure Show forest plot | 1 | Risk Ratio (M‐H, Fixed, 95% CI) | Subtotals only | |
| 13.1 Pegylated interferon versus control | 1 | 54 | Risk Ratio (M‐H, Fixed, 95% CI) | 0.43 [0.09, 2.03] |
| 14 Depression Show forest plot | 2 | Risk Ratio (M‐H, Fixed, 95% CI) | Subtotals only | |
| 14.1 Pegylated interferon versus control | 1 | 54 | Risk Ratio (M‐H, Fixed, 95% CI) | 1.79 [0.48, 6.77] |
| 14.2 Pegylated interferon and ribavirin versus control | 1 | 102 | Risk Ratio (M‐H, Fixed, 95% CI) | 0.0 [0.0, 0.0] |
| 15 Rapid virological response Show forest plot | 2 | Risk Ratio (M‐H, Fixed, 95% CI) | Subtotals only | |
| 15.1 Pegylated interferon versus control | 1 | 54 | Risk Ratio (M‐H, Fixed, 95% CI) | 0.89 [0.76, 1.03] |
| 15.2 Pegylated interferon and ribavirin versus control | 1 | 115 | Risk Ratio (M‐H, Fixed, 95% CI) | 0.93 [0.86, 1.01] |
| 16 Early virological response Show forest plot | 2 | Risk Ratio (M‐H, Fixed, 95% CI) | Subtotals only | |
| 16.1 Pegylated interferon versus control | 1 | 54 | Risk Ratio (M‐H, Fixed, 95% CI) | 0.85 [0.71, 1.01] |
| 16.2 Pegylated interferon and ribavirin versus control | 1 | 115 | Risk Ratio (M‐H, Fixed, 95% CI) | 0.84 [0.72, 0.98] |
| 17 End of treatment virological response Show forest plot | 4 | Risk Ratio (M‐H, Fixed, 95% CI) | Subtotals only | |
| 17.1 Pegylated interferon versus control | 1 | 54 | Risk Ratio (M‐H, Fixed, 95% CI) | 0.85 [0.71, 1.01] |
| 17.2 Interferon versus control | 1 | 81 | Risk Ratio (M‐H, Fixed, 95% CI) | 0.63 [0.39, 1.04] |
| 17.3 Ribavirin and interferon versus interferon | 1 | 44 | Risk Ratio (M‐H, Fixed, 95% CI) | 0.81 [0.63, 1.03] |
| 17.4 HCV antibody versus placebo | 1 | 18 | Risk Ratio (M‐H, Fixed, 95% CI) | 1.0 [0.74, 1.35] |
| 17.5 HCV antibody (high dose) versus HCV antibody (low dose) | 1 | 12 | Risk Ratio (M‐H, Fixed, 95% CI) | 1.0 [0.75, 1.34] |
| 18 Sustained virological response Show forest plot | 8 | Risk Ratio (M‐H, Fixed, 95% CI) | Subtotals only | |
| 18.1 Pegylated interferon versus control | 1 | 54 | Risk Ratio (M‐H, Fixed, 95% CI) | 0.92 [0.81, 1.05] |
| 18.2 Pegylated interferon and ribavirin versus control | 1 | 115 | Risk Ratio (M‐H, Fixed, 95% CI) | 0.82 [0.71, 0.96] |
| 18.3 Interferon versus control | 2 | 55 | Risk Ratio (M‐H, Fixed, 95% CI) | 0.99 [0.70, 1.39] |
| 18.4 Ribavirin versus control | 1 | 32 | Risk Ratio (M‐H, Fixed, 95% CI) | 0.85 [0.56, 1.30] |
| 18.5 Interferon and ribavirin versus control | 1 | 32 | Risk Ratio (M‐H, Fixed, 95% CI) | 0.94 [0.73, 1.22] |
| 18.6 Ribavirin and interferon versus interferon | 1 | 43 | Risk Ratio (M‐H, Fixed, 95% CI) | 0.84 [0.59, 1.20] |
| 18.7 HCV antibody versus placebo | 3 | 58 | Risk Ratio (M‐H, Fixed, 95% CI) | 1.0 [0.84, 1.19] |
| 18.8 HCV antibody (high dose) versus HCV antibody (low dose) | 3 | 40 | Risk Ratio (M‐H, Fixed, 95% CI) | 1.0 [0.85, 1.17] |
| 19 Virological titre at maximal follow‐up Show forest plot | 1 | Mean Difference (IV, Fixed, 95% CI) | Subtotals only | |
| 19.1 Pegylated interferon versus control | 1 | 54 | Mean Difference (IV, Fixed, 95% CI) | 0.20 [‐1.35, 1.75] |
| 20 Recurrence (hazard ratio) Show forest plot | 2 | Hazard Ratio (Fixed, 95% CI) | Subtotals only | |
| 20.1 Interferon versus control | 2 | Hazard Ratio (Fixed, 95% CI) | 0.87 [0.61, 1.24] | |
| 21 Fibrosis worsening Show forest plot | 1 | Risk Ratio (M‐H, Fixed, 95% CI) | Subtotals only | |
| 21.1 HCV antibody versus placebo | 1 | 18 | Risk Ratio (M‐H, Fixed, 95% CI) | 0.86 [0.17, 4.43] |
| 21.2 HCV antibody (high dose) versus HCV antibody (low dose) | 1 | 12 | Risk Ratio (M‐H, Fixed, 95% CI) | 0.33 [0.02, 6.86] |
| 22 Fibrosis score at maximal follow‐up Show forest plot | 1 | Mean Difference (IV, Fixed, 95% CI) | Subtotals only | |
| 22.1 Pegylated interferon versus control | 1 | 54 | Mean Difference (IV, Fixed, 95% CI) | ‐0.50 [‐1.21, 0.21] |
| 23 Activity worsening Show forest plot | 2 | Risk Ratio (M‐H, Fixed, 95% CI) | Subtotals only | |
| 23.1 Ribavirin versus control | 1 | 19 | Risk Ratio (M‐H, Fixed, 95% CI) | 1.09 [0.67, 1.78] |
| 23.2 HCV antibody versus placebo | 1 | 18 | Risk Ratio (M‐H, Fixed, 95% CI) | 1.75 [0.51, 5.98] |
| 23.3 HCV antibody (high dose) versus HCV antibody (low dose) | 1 | 12 | Risk Ratio (M‐H, Fixed, 95% CI) | 1.33 [0.50, 3.55] |
| 24 Activity score at maximal follow‐up Show forest plot | 1 | Mean Difference (IV, Fixed, 95% CI) | Subtotals only | |
| 24.1 Pegylated interferon versus control | 1 | 54 | Mean Difference (IV, Fixed, 95% CI) | ‐1.70 [‐4.06, 0.66] |