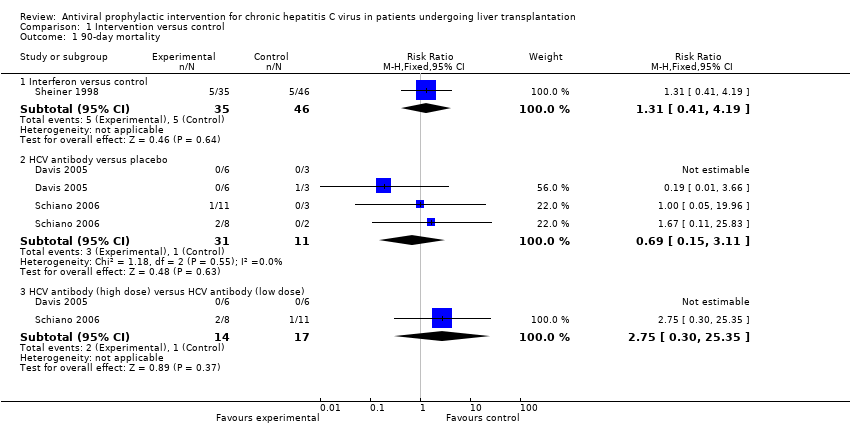
| 1 90‐day mortality Show forest plot | 3 | | Risk Ratio (M‐H, Fixed, 95% CI) | Subtotals only |
|
| 1.1 Interferon versus control | 1 | 81 | Risk Ratio (M‐H, Fixed, 95% CI) | 1.31 [0.41, 4.19] |
| 1.2 HCV antibody versus placebo | 2 | 42 | Risk Ratio (M‐H, Fixed, 95% CI) | 0.69 [0.15, 3.11] |
| 1.3 HCV antibody (high dose) versus HCV antibody (low dose) | 2 | 31 | Risk Ratio (M‐H, Fixed, 95% CI) | 2.75 [0.30, 25.35] |
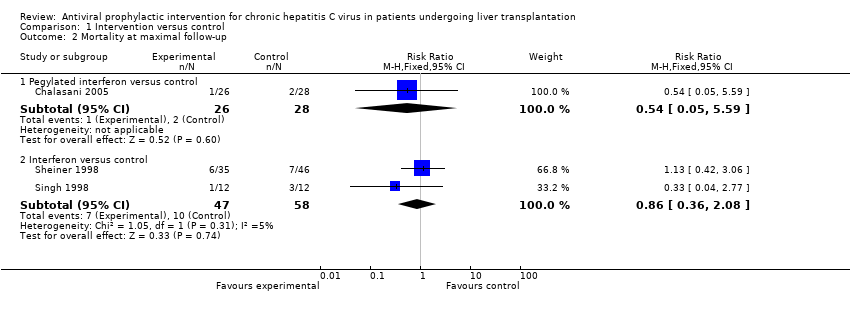
| 2 Mortality at maximal follow‐up Show forest plot | 3 | | Risk Ratio (M‐H, Fixed, 95% CI) | Subtotals only |
|
| 2.1 Pegylated interferon versus control | 1 | 54 | Risk Ratio (M‐H, Fixed, 95% CI) | 0.54 [0.05, 5.59] |
| 2.2 Interferon versus control | 2 | 105 | Risk Ratio (M‐H, Fixed, 95% CI) | 0.86 [0.36, 2.08] |
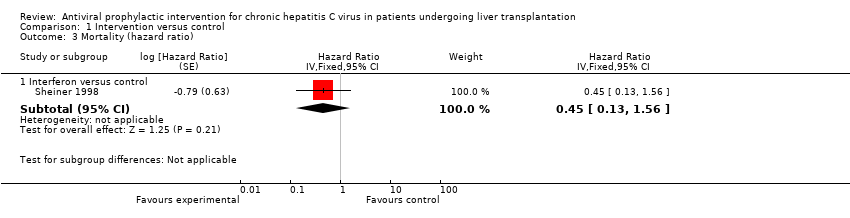
| 3 Mortality (hazard ratio) Show forest plot | 1 | | Hazard Ratio (Fixed, 95% CI) | Subtotals only |
|
| 3.1 Interferon versus control | 1 | | Hazard Ratio (Fixed, 95% CI) | 0.45 [0.13, 1.56] |
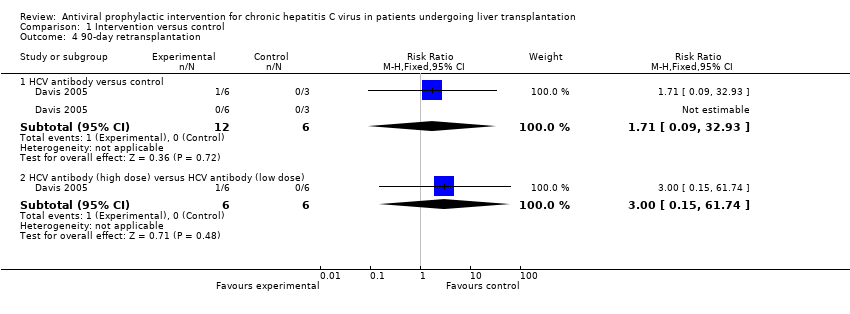
| 4 90‐day retransplantation Show forest plot | 1 | | Risk Ratio (M‐H, Fixed, 95% CI) | Subtotals only |
|
| 4.1 HCV antibody versus control | 1 | 18 | Risk Ratio (M‐H, Fixed, 95% CI) | 1.71 [0.09, 32.93] |
| 4.2 HCV antibody (high dose) versus HCV antibody (low dose) | 1 | 12 | Risk Ratio (M‐H, Fixed, 95% CI) | 3.0 [0.15, 61.74] |
| 5 Re‐transplantation at maximal follow‐up Show forest plot | 2 | | Risk Ratio (M‐H, Fixed, 95% CI) | Subtotals only |
|
| 5.1 Interferon versus control | 2 | 105 | Risk Ratio (M‐H, Fixed, 95% CI) | 1.17 [0.22, 6.20] |
| 6 Graft rejection requiring re‐transplantation Show forest plot | 1 | | Risk Ratio (M‐H, Fixed, 95% CI) | Subtotals only |
|
| 6.1 Interferon versus control | 1 | 31 | Risk Ratio (M‐H, Fixed, 95% CI) | 0.0 [0.0, 0.0] |
| 6.2 Interferon and ribavirin versus control | 1 | 32 | Risk Ratio (M‐H, Fixed, 95% CI) | 0.0 [0.0, 0.0] |
| 6.3 Ribavirin and interferon versus interferon | 1 | 43 | Risk Ratio (M‐H, Fixed, 95% CI) | 0.0 [0.0, 0.0] |
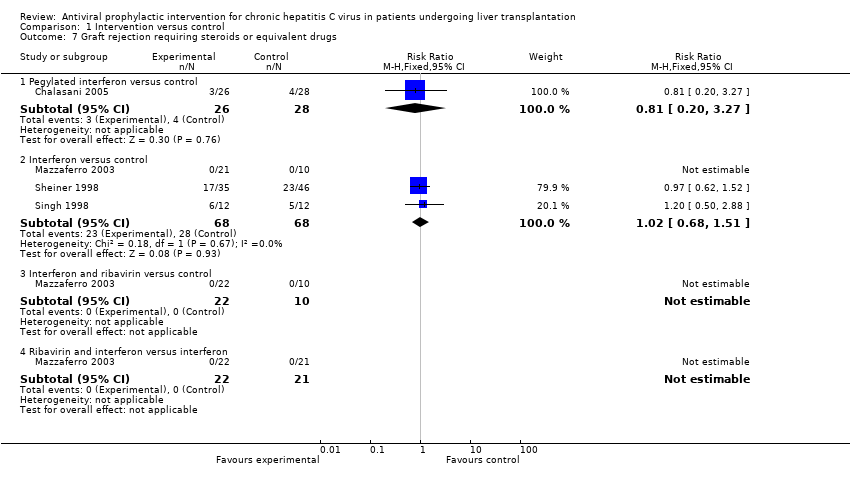
| 7 Graft rejection requiring steroids or equivalent drugs Show forest plot | 4 | | Risk Ratio (M‐H, Fixed, 95% CI) | Subtotals only |
|
| 7.1 Pegylated interferon versus control | 1 | 54 | Risk Ratio (M‐H, Fixed, 95% CI) | 0.81 [0.20, 3.27] |
| 7.2 Interferon versus control | 3 | 136 | Risk Ratio (M‐H, Fixed, 95% CI) | 1.02 [0.68, 1.51] |
| 7.3 Interferon and ribavirin versus control | 1 | 32 | Risk Ratio (M‐H, Fixed, 95% CI) | 0.0 [0.0, 0.0] |
| 7.4 Ribavirin and interferon versus interferon | 1 | 43 | Risk Ratio (M‐H, Fixed, 95% CI) | 0.0 [0.0, 0.0] |
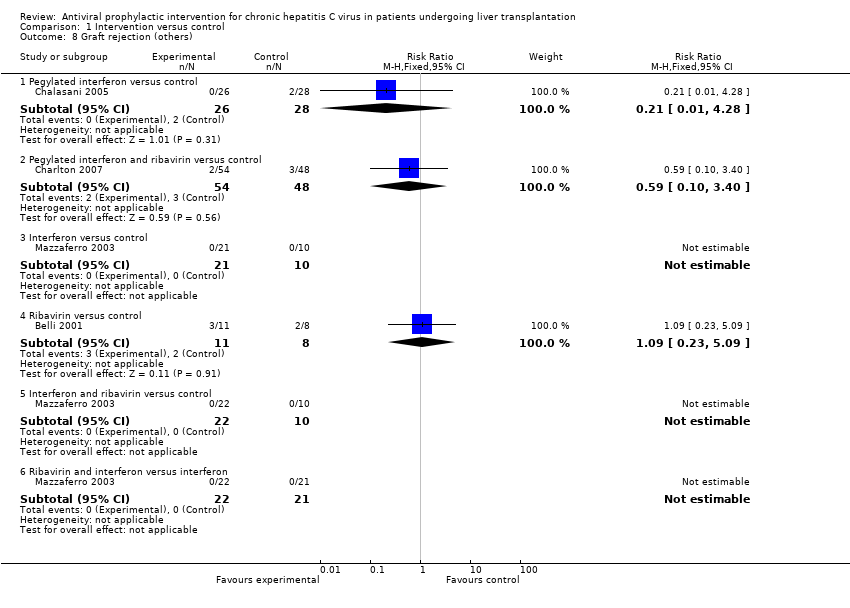
| 8 Graft rejection (others) Show forest plot | 4 | | Risk Ratio (M‐H, Fixed, 95% CI) | Subtotals only |
|
| 8.1 Pegylated interferon versus control | 1 | 54 | Risk Ratio (M‐H, Fixed, 95% CI) | 0.21 [0.01, 4.28] |
| 8.2 Pegylated interferon and ribavirin versus control | 1 | 102 | Risk Ratio (M‐H, Fixed, 95% CI) | 0.59 [0.10, 3.40] |
| 8.3 Interferon versus control | 1 | 31 | Risk Ratio (M‐H, Fixed, 95% CI) | 0.0 [0.0, 0.0] |
| 8.4 Ribavirin versus control | 1 | 19 | Risk Ratio (M‐H, Fixed, 95% CI) | 1.09 [0.23, 5.09] |
| 8.5 Interferon and ribavirin versus control | 1 | 32 | Risk Ratio (M‐H, Fixed, 95% CI) | 0.0 [0.0, 0.0] |
| 8.6 Ribavirin and interferon versus interferon | 1 | 43 | Risk Ratio (M‐H, Fixed, 95% CI) | 0.0 [0.0, 0.0] |
| 9 Cessation of treatment Show forest plot | 5 | | Risk Ratio (M‐H, Fixed, 95% CI) | Subtotals only |
|
| 9.1 Pegylated interferon versus control | 1 | 54 | Risk Ratio (M‐H, Fixed, 95% CI) | 0.96 [0.44, 2.11] |
| 9.2 Interferon versus control | 1 | 81 | Risk Ratio (M‐H, Fixed, 95% CI) | 27.42 [1.66, 452.50] |
| 9.3 Ribavirin versus control | 1 | 19 | Risk Ratio (M‐H, Fixed, 95% CI) | 2.25 [0.10, 49.04] |
| 9.4 HCV antibody versus placebo | 2 | 42 | Risk Ratio (M‐H, Fixed, 95% CI) | 2.49 [0.52, 11.98] |
| 9.5 HCV antibody (high dose) versus HCV antibody (low dose) | 2 | 31 | Risk Ratio (M‐H, Fixed, 95% CI) | 1.97 [0.60, 6.45] |
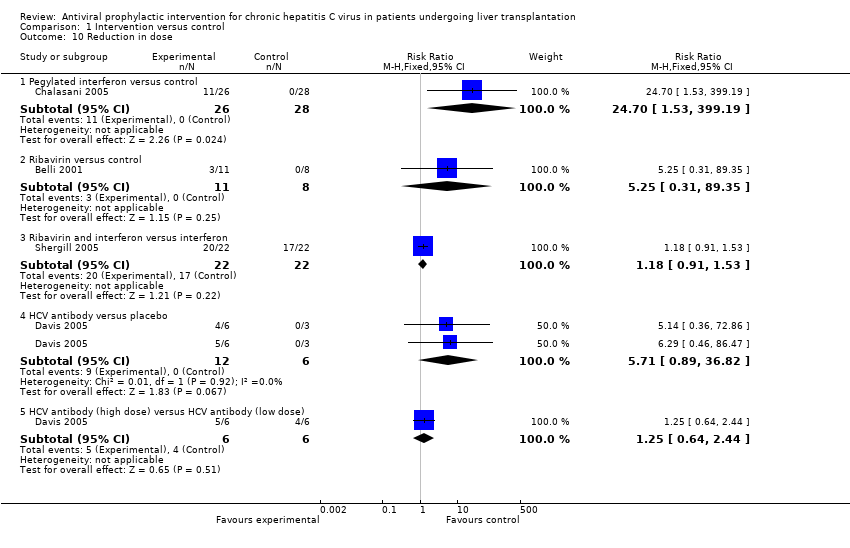
| 10 Reduction in dose Show forest plot | 4 | | Risk Ratio (M‐H, Fixed, 95% CI) | Subtotals only |
|
| 10.1 Pegylated interferon versus control | 1 | 54 | Risk Ratio (M‐H, Fixed, 95% CI) | 24.70 [1.53, 399.19] |
| 10.2 Ribavirin versus control | 1 | 19 | Risk Ratio (M‐H, Fixed, 95% CI) | 5.25 [0.31, 89.35] |
| 10.3 Ribavirin and interferon versus interferon | 1 | 44 | Risk Ratio (M‐H, Fixed, 95% CI) | 1.18 [0.91, 1.53] |
| 10.4 HCV antibody versus placebo | 1 | 18 | Risk Ratio (M‐H, Fixed, 95% CI) | 5.71 [0.89, 36.82] |
| 10.5 HCV antibody (high dose) versus HCV antibody (low dose) | 1 | 12 | Risk Ratio (M‐H, Fixed, 95% CI) | 1.25 [0.64, 2.44] |
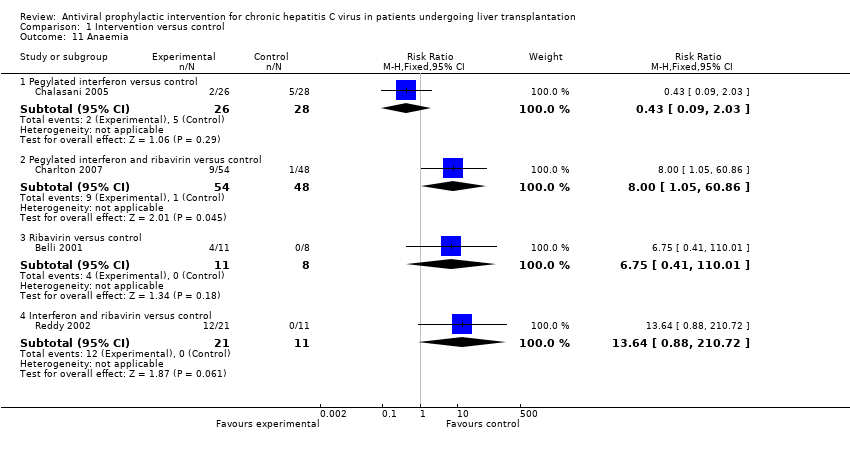
| 11 Anaemia Show forest plot | 4 | | Risk Ratio (M‐H, Fixed, 95% CI) | Subtotals only |
|
| 11.1 Pegylated interferon versus control | 1 | 54 | Risk Ratio (M‐H, Fixed, 95% CI) | 0.43 [0.09, 2.03] |
| 11.2 Pegylated interferon and ribavirin versus control | 1 | 102 | Risk Ratio (M‐H, Fixed, 95% CI) | 8.0 [1.05, 60.86] |
| 11.3 Ribavirin versus control | 1 | 19 | Risk Ratio (M‐H, Fixed, 95% CI) | 6.75 [0.41, 110.01] |
| 11.4 Interferon and ribavirin versus control | 1 | 32 | Risk Ratio (M‐H, Fixed, 95% CI) | 13.64 [0.88, 210.72] |
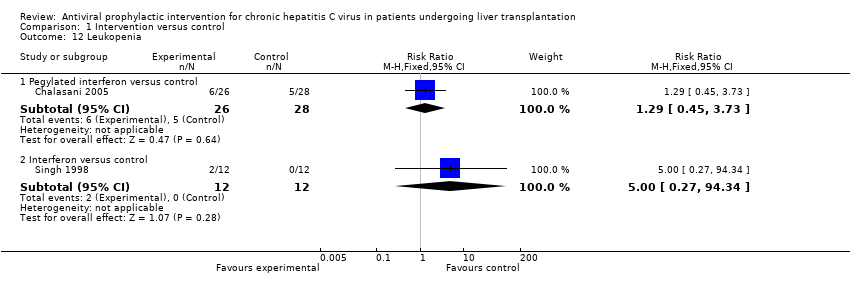
| 12 Leukopenia Show forest plot | 2 | | Risk Ratio (M‐H, Fixed, 95% CI) | Subtotals only |
|
| 12.1 Pegylated interferon versus control | 1 | 54 | Risk Ratio (M‐H, Fixed, 95% CI) | 1.29 [0.45, 3.73] |
| 12.2 Interferon versus control | 1 | 24 | Risk Ratio (M‐H, Fixed, 95% CI) | 5.0 [0.27, 94.34] |
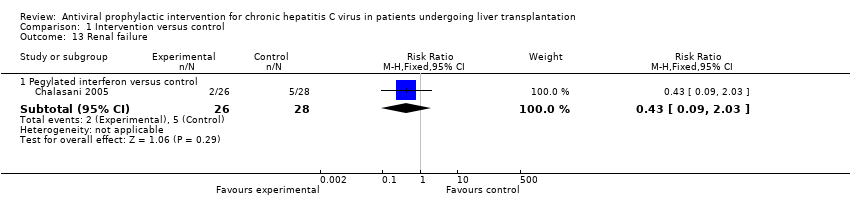
| 13 Renal failure Show forest plot | 1 | | Risk Ratio (M‐H, Fixed, 95% CI) | Subtotals only |
|
| 13.1 Pegylated interferon versus control | 1 | 54 | Risk Ratio (M‐H, Fixed, 95% CI) | 0.43 [0.09, 2.03] |
| 14 Depression Show forest plot | 2 | | Risk Ratio (M‐H, Fixed, 95% CI) | Subtotals only |
|
| 14.1 Pegylated interferon versus control | 1 | 54 | Risk Ratio (M‐H, Fixed, 95% CI) | 1.79 [0.48, 6.77] |
| 14.2 Pegylated interferon and ribavirin versus control | 1 | 102 | Risk Ratio (M‐H, Fixed, 95% CI) | 0.0 [0.0, 0.0] |
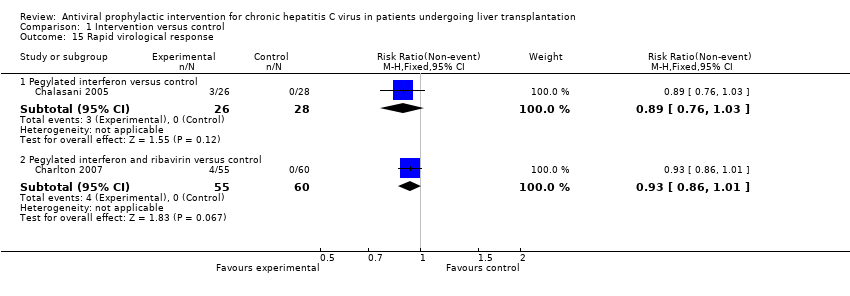
| 15 Rapid virological response Show forest plot | 2 | | Risk Ratio (M‐H, Fixed, 95% CI) | Subtotals only |
|
| 15.1 Pegylated interferon versus control | 1 | 54 | Risk Ratio (M‐H, Fixed, 95% CI) | 0.89 [0.76, 1.03] |
| 15.2 Pegylated interferon and ribavirin versus control | 1 | 115 | Risk Ratio (M‐H, Fixed, 95% CI) | 0.93 [0.86, 1.01] |
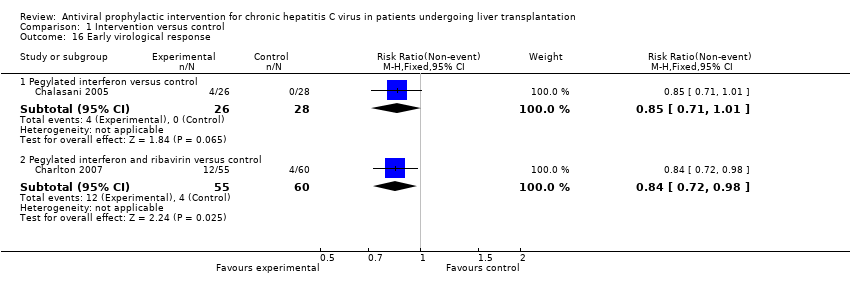
| 16 Early virological response Show forest plot | 2 | | Risk Ratio (M‐H, Fixed, 95% CI) | Subtotals only |
|
| 16.1 Pegylated interferon versus control | 1 | 54 | Risk Ratio (M‐H, Fixed, 95% CI) | 0.85 [0.71, 1.01] |
| 16.2 Pegylated interferon and ribavirin versus control | 1 | 115 | Risk Ratio (M‐H, Fixed, 95% CI) | 0.84 [0.72, 0.98] |
| 17 End of treatment virological response Show forest plot | 4 | | Risk Ratio (M‐H, Fixed, 95% CI) | Subtotals only |
|
| 17.1 Pegylated interferon versus control | 1 | 54 | Risk Ratio (M‐H, Fixed, 95% CI) | 0.85 [0.71, 1.01] |
| 17.2 Interferon versus control | 1 | 81 | Risk Ratio (M‐H, Fixed, 95% CI) | 0.63 [0.39, 1.04] |
| 17.3 Ribavirin and interferon versus interferon | 1 | 44 | Risk Ratio (M‐H, Fixed, 95% CI) | 0.81 [0.63, 1.03] |
| 17.4 HCV antibody versus placebo | 1 | 18 | Risk Ratio (M‐H, Fixed, 95% CI) | 1.0 [0.74, 1.35] |
| 17.5 HCV antibody (high dose) versus HCV antibody (low dose) | 1 | 12 | Risk Ratio (M‐H, Fixed, 95% CI) | 1.0 [0.75, 1.34] |
| 18 Sustained virological response Show forest plot | 8 | | Risk Ratio (M‐H, Fixed, 95% CI) | Subtotals only |
|
| 18.1 Pegylated interferon versus control | 1 | 54 | Risk Ratio (M‐H, Fixed, 95% CI) | 0.92 [0.81, 1.05] |
| 18.2 Pegylated interferon and ribavirin versus control | 1 | 115 | Risk Ratio (M‐H, Fixed, 95% CI) | 0.82 [0.71, 0.96] |
| 18.3 Interferon versus control | 2 | 55 | Risk Ratio (M‐H, Fixed, 95% CI) | 0.99 [0.70, 1.39] |
| 18.4 Ribavirin versus control | 1 | 32 | Risk Ratio (M‐H, Fixed, 95% CI) | 0.85 [0.56, 1.30] |
| 18.5 Interferon and ribavirin versus control | 1 | 32 | Risk Ratio (M‐H, Fixed, 95% CI) | 0.94 [0.73, 1.22] |
| 18.6 Ribavirin and interferon versus interferon | 1 | 43 | Risk Ratio (M‐H, Fixed, 95% CI) | 0.84 [0.59, 1.20] |
| 18.7 HCV antibody versus placebo | 3 | 58 | Risk Ratio (M‐H, Fixed, 95% CI) | 1.0 [0.84, 1.19] |
| 18.8 HCV antibody (high dose) versus HCV antibody (low dose) | 3 | 40 | Risk Ratio (M‐H, Fixed, 95% CI) | 1.0 [0.85, 1.17] |
| 19 Virological titre at maximal follow‐up Show forest plot | 1 | | Mean Difference (IV, Fixed, 95% CI) | Subtotals only |
|
| 19.1 Pegylated interferon versus control | 1 | 54 | Mean Difference (IV, Fixed, 95% CI) | 0.20 [‐1.35, 1.75] |
| 20 Recurrence (hazard ratio) Show forest plot | 2 | | Hazard Ratio (Fixed, 95% CI) | Subtotals only |
|
| 20.1 Interferon versus control | 2 | | Hazard Ratio (Fixed, 95% CI) | 0.87 [0.61, 1.24] |
| 21 Fibrosis worsening Show forest plot | 1 | | Risk Ratio (M‐H, Fixed, 95% CI) | Subtotals only |
|
| 21.1 HCV antibody versus placebo | 1 | 18 | Risk Ratio (M‐H, Fixed, 95% CI) | 0.86 [0.17, 4.43] |
| 21.2 HCV antibody (high dose) versus HCV antibody (low dose) | 1 | 12 | Risk Ratio (M‐H, Fixed, 95% CI) | 0.33 [0.02, 6.86] |
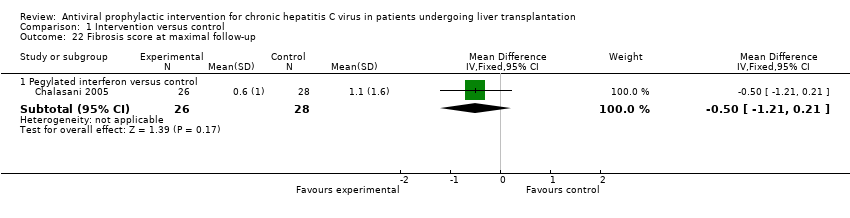
| 22 Fibrosis score at maximal follow‐up Show forest plot | 1 | | Mean Difference (IV, Fixed, 95% CI) | Subtotals only |
|
| 22.1 Pegylated interferon versus control | 1 | 54 | Mean Difference (IV, Fixed, 95% CI) | ‐0.50 [‐1.21, 0.21] |
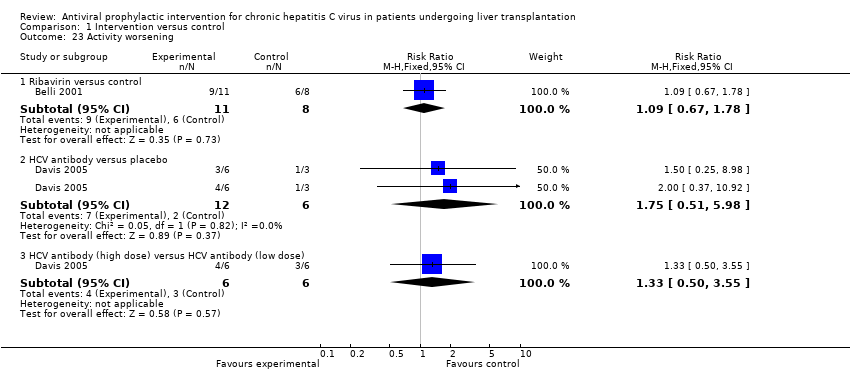
| 23 Activity worsening Show forest plot | 2 | | Risk Ratio (M‐H, Fixed, 95% CI) | Subtotals only |
|
| 23.1 Ribavirin versus control | 1 | 19 | Risk Ratio (M‐H, Fixed, 95% CI) | 1.09 [0.67, 1.78] |
| 23.2 HCV antibody versus placebo | 1 | 18 | Risk Ratio (M‐H, Fixed, 95% CI) | 1.75 [0.51, 5.98] |
| 23.3 HCV antibody (high dose) versus HCV antibody (low dose) | 1 | 12 | Risk Ratio (M‐H, Fixed, 95% CI) | 1.33 [0.50, 3.55] |
| 24 Activity score at maximal follow‐up Show forest plot | 1 | | Mean Difference (IV, Fixed, 95% CI) | Subtotals only |
|
| 24.1 Pegylated interferon versus control | 1 | 54 | Mean Difference (IV, Fixed, 95% CI) | ‐1.70 [‐4.06, 0.66] |