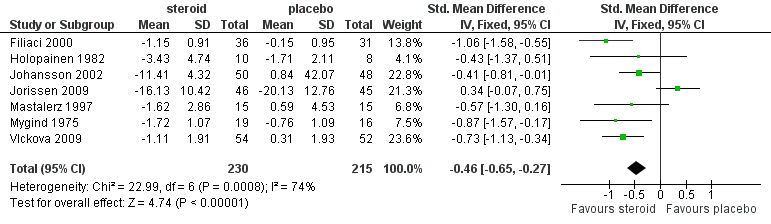
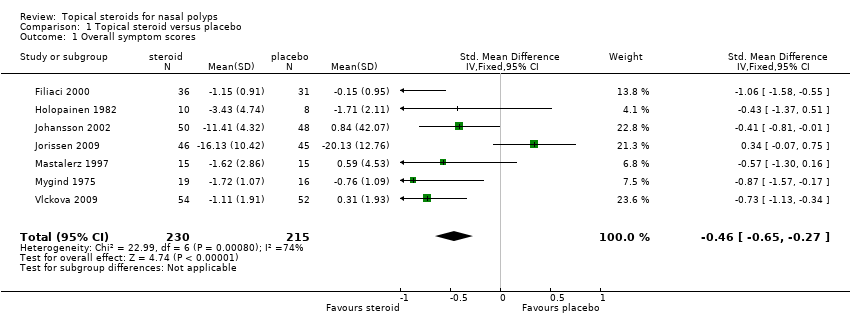
| 1 Overall symptom scores Show forest plot | 7 | 445 | Std. Mean Difference (IV, Fixed, 95% CI) | ‐0.46 [‐0.65, ‐0.27] |
|
| 2 Overall symptom scores by sinus surgery status Show forest plot | 7 | 445 | Std. Mean Difference (IV, Fixed, 95% CI) | ‐0.46 [‐0.65, ‐0.27] |
|
| 2.1 Patients with sinus surgery | 4 | 250 | Std. Mean Difference (IV, Fixed, 95% CI) | ‐0.32 [‐0.58, ‐0.07] |
| 2.2 Patients without sinus surgery | 3 | 195 | Std. Mean Difference (IV, Fixed, 95% CI) | ‐0.64 [‐0.93, ‐0.35] |
| 3 Overall symptom scores by topical delivery methods Show forest plot | 7 | 445 | Std. Mean Difference (IV, Fixed, 95% CI) | ‐0.46 [‐0.65, ‐0.27] |
|
| 3.1 Nasal spray | 5 | 343 | Std. Mean Difference (IV, Fixed, 95% CI) | ‐0.32 [‐0.53, ‐0.10] |
| 3.2 Nasal aerosol | 1 | 35 | Std. Mean Difference (IV, Fixed, 95% CI) | ‐0.87 [‐1.57, ‐0.17] |
| 3.3 Nasal turbuhaler | 1 | 67 | Std. Mean Difference (IV, Fixed, 95% CI) | ‐1.06 [‐1.58, ‐0.55] |
| 4 Overall symptom scores by polyp severity Show forest plot | 7 | 445 | Std. Mean Difference (IV, Fixed, 95% CI) | ‐0.46 [‐0.65, ‐0.27] |
|
| 4.1 Patients with small size polyps | 2 | 124 | Std. Mean Difference (IV, Fixed, 95% CI) | ‐0.69 [‐1.05, ‐0.33] |
| 4.2 Patients with large size polyps | 1 | 35 | Std. Mean Difference (IV, Fixed, 95% CI) | ‐0.87 [‐1.57, ‐0.17] |
| 4.3 Patients with all size polyps | 4 | 286 | Std. Mean Difference (IV, Fixed, 95% CI) | ‐0.32 [‐0.56, ‐0.08] |
| 5 Overall symptom scores by steroid agent Show forest plot | 7 | 445 | Std. Mean Difference (IV, Fixed, 95% CI) | ‐0.46 [‐0.65, ‐0.27] |
|
| 5.1 Budesonide | 3 | 183 | Std. Mean Difference (IV, Fixed, 95% CI) | ‐0.63 [‐0.93, ‐0.33] |
| 5.2 Mometasone furoate | 1 | 91 | Std. Mean Difference (IV, Fixed, 95% CI) | 0.34 [‐0.07, 0.75] |
| 5.3 Fluticasone propionate | 2 | 136 | Std. Mean Difference (IV, Fixed, 95% CI) | ‐0.70 [‐1.04, ‐0.35] |
| 5.4 Beclomethasone dipropionate | 1 | 35 | Std. Mean Difference (IV, Fixed, 95% CI) | ‐0.87 [‐1.57, ‐0.17] |
| 6 Overall symptom scores by quality of studies Show forest plot | 7 | 445 | Std. Mean Difference (IV, Fixed, 95% CI) | ‐0.46 [‐0.65, ‐0.27] |
|
| 6.1 Studies with high quality | 6 | 415 | Std. Mean Difference (IV, Fixed, 95% CI) | ‐0.45 [‐0.65, ‐0.26] |
| 6.2 Studies with medium quality | 1 | 30 | Std. Mean Difference (IV, Fixed, 95% CI) | ‐0.57 [‐1.30, 0.16] |
| 7 Proportion of responders (overall improvement in symptom) Show forest plot | 4 | 234 | Risk Ratio (M‐H, Fixed, 95% CI) | 1.71 [1.29, 2.26] |
|
| 8 Change in nasal obstruction score Show forest plot | 7 | 482 | Std. Mean Difference (IV, Fixed, 95% CI) | ‐0.81 [‐1.01, ‐0.62] |
|
| 9 Change in nasal obstruction score by sinus surgery status Show forest plot | 7 | 482 | Std. Mean Difference (IV, Fixed, 95% CI) | ‐0.81 [‐1.01, ‐0.62] |
|
| 9.1 Patients with sinus surgery | 7 | 482 | Std. Mean Difference (IV, Fixed, 95% CI) | ‐0.81 [‐1.01, ‐0.62] |
| 9.2 Patients without sinus surgery | 0 | 0 | Std. Mean Difference (IV, Fixed, 95% CI) | 0.0 [0.0, 0.0] |
| 10 Change in nasal obstruction score by topical delivery method Show forest plot | 7 | 482 | Std. Mean Difference (IV, Fixed, 95% CI) | ‐0.81 [‐1.01, ‐0.62] |
|
| 10.1 Nasal drop | 3 | 223 | Std. Mean Difference (IV, Fixed, 95% CI) | 1.00 [‐1.28, ‐0.71] |
| 10.2 Nasal spray | 3 | 186 | Std. Mean Difference (IV, Fixed, 95% CI) | ‐0.90 [‐1.21, ‐0.59] |
| 10.3 Nasal aerosol | 1 | 73 | Std. Mean Difference (IV, Fixed, 95% CI) | ‐0.16 [‐0.62, 0.30] |
| 11 Change in nasal obstruction score by polyp severity Show forest plot | 7 | 482 | Std. Mean Difference (IV, Fixed, 95% CI) | ‐0.81 [‐1.01, ‐0.62] |
|
| 11.1 Patients with small size polyps | 2 | 213 | Std. Mean Difference (IV, Fixed, 95% CI) | ‐0.94 [‐1.23, ‐0.65] |
| 11.2 Patients with large size polyps | 0 | 0 | Std. Mean Difference (IV, Fixed, 95% CI) | 0.0 [0.0, 0.0] |
| 11.3 Patients with all size polyps | 5 | 269 | Std. Mean Difference (IV, Fixed, 95% CI) | ‐0.71 [‐0.97, ‐0.46] |
| 12 Change in nasal obstruction score by steroid agent Show forest plot | 7 | 482 | Std. Mean Difference (IV, Fixed, 95% CI) | ‐0.81 [‐1.01, ‐0.62] |
|
| 12.1 Fluticasone propionate | 4 | 332 | Std. Mean Difference (IV, Fixed, 95% CI) | ‐0.81 [‐1.04, ‐0.58] |
| 12.2 Flunisolide | 1 | 41 | Std. Mean Difference (IV, Fixed, 95% CI) | ‐2.04 [‐2.81, ‐1.27] |
| 12.3 Budesonide | 2 | 109 | Std. Mean Difference (IV, Fixed, 95% CI) | ‐0.50 [‐0.89, ‐0.11] |
| 13 Change in nasal obstruction score by quality of studies Show forest plot | 7 | 482 | Std. Mean Difference (IV, Fixed, 95% CI) | ‐0.81 [‐1.01, ‐0.62] |
|
| 13.1 Studies with high quality | 5 | 344 | Std. Mean Difference (IV, Fixed, 95% CI) | ‐1.19 [‐1.43, ‐0.96] |
| 13.2 Studies with medium quality | 2 | 138 | Std. Mean Difference (IV, Fixed, 95% CI) | ‐0.04 [‐0.38, 0.29] |
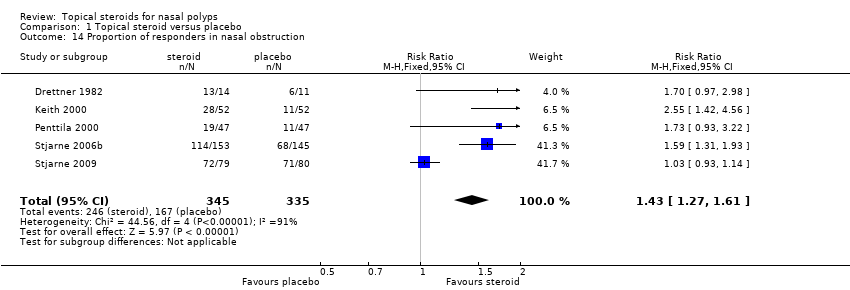
| 14 Proportion of responders in nasal obstruction Show forest plot | 5 | 680 | Risk Ratio (M‐H, Fixed, 95% CI) | 1.43 [1.27, 1.61] |
|
| 15 Polyp score Show forest plot | 3 | 202 | Std. Mean Difference (IV, Fixed, 95% CI) | ‐0.49 [‐0.77, ‐0.21] |
|
| 16 Polyp score by sinus surgery status Show forest plot | 3 | 202 | Std. Mean Difference (IV, Fixed, 95% CI) | ‐0.49 [‐0.77, ‐0.21] |
|
| 16.1 Patients with sinus surgery | 2 | 104 | Std. Mean Difference (IV, Fixed, 95% CI) | ‐0.81 [‐1.21, ‐0.41] |
| 16.2 Patients without sinus surgery | 1 | 98 | Std. Mean Difference (IV, Fixed, 95% CI) | ‐0.17 [‐0.57, 0.22] |
| 17 Polyp score by topical delivery methods Show forest plot | 3 | 202 | Std. Mean Difference (IV, Fixed, 95% CI) | ‐0.49 [‐0.77, ‐0.21] |
|
| 17.1 Nasal spray | 2 | 139 | Std. Mean Difference (IV, Fixed, 95% CI) | ‐0.36 [‐0.70, ‐0.02] |
| 17.2 Nasal aerosol | 1 | 63 | Std. Mean Difference (IV, Fixed, 95% CI) | ‐0.78 [‐1.30, ‐0.27] |
| 18 Change in polyp score Show forest plot | 3 | 237 | Std. Mean Difference (IV, Fixed, 95% CI) | ‐0.73 [1.00, ‐0.46] |
|
| 19 Change in polyp score by sinus surgery status Show forest plot | 3 | 237 | Std. Mean Difference (IV, Fixed, 95% CI) | ‐0.73 [1.00, ‐0.46] |
|
| 19.1 Patients with sinus surgery | 2 | 144 | Std. Mean Difference (IV, Fixed, 95% CI) | ‐1.19 [‐1.54, ‐0.83] |
| 19.2 Patients without sinus surgery | 1 | 93 | Std. Mean Difference (IV, Fixed, 95% CI) | ‐0.13 [‐0.53, 0.28] |
| 20 Proportion of responders (reduction in polyp size) Show forest plot | 8 | 785 | Risk Ratio (M‐H, Fixed, 95% CI) | 2.09 [1.65, 2.64] |
|
| 21 Proportion of responders (reduction in polyp size) by sinus surgery status Show forest plot | 8 | 785 | Risk Ratio (M‐H, Fixed, 95% CI) | 2.09 [1.65, 2.64] |
|
| 21.1 Patients with sinus surgery | 4 | 325 | Risk Ratio (M‐H, Fixed, 95% CI) | 3.22 [2.10, 4.93] |
| 21.2 Patients without surgery | 4 | 460 | Risk Ratio (M‐H, Fixed, 95% CI) | 1.63 [1.23, 2.17] |
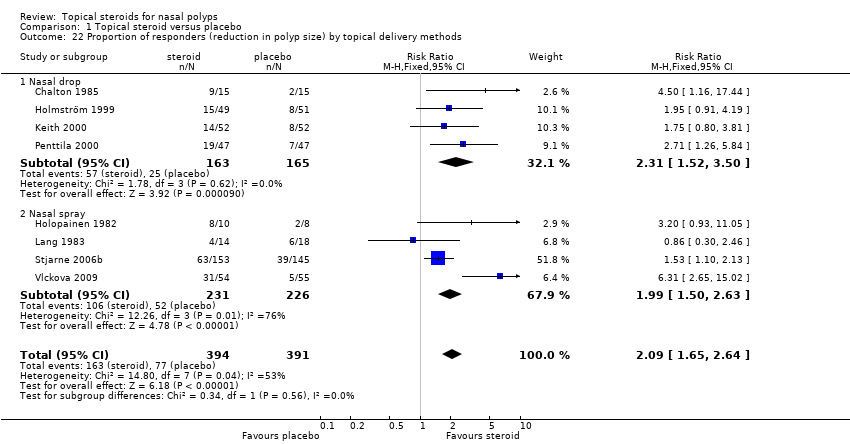
| 22 Proportion of responders (reduction in polyp size) by topical delivery methods Show forest plot | 8 | 785 | Risk Ratio (M‐H, Fixed, 95% CI) | 2.09 [1.65, 2.64] |
|
| 22.1 Nasal drop | 4 | 328 | Risk Ratio (M‐H, Fixed, 95% CI) | 2.31 [1.52, 3.50] |
| 22.2 Nasal spray | 4 | 457 | Risk Ratio (M‐H, Fixed, 95% CI) | 1.99 [1.50, 2.63] |
| 23 Proportion of responders (reduction in polyp size) by polyp severity Show forest plot | 8 | 785 | Risk Ratio (M‐H, Fixed, 95% CI) | 2.09 [1.65, 2.64] |
|
| 23.1 Patients with small size polyps | 6 | 457 | Risk Ratio (M‐H, Fixed, 95% CI) | 2.59 [1.83, 3.65] |
| 23.2 Patients with all size polyps | 2 | 328 | Risk Ratio (M‐H, Fixed, 95% CI) | 1.67 [1.22, 2.30] |
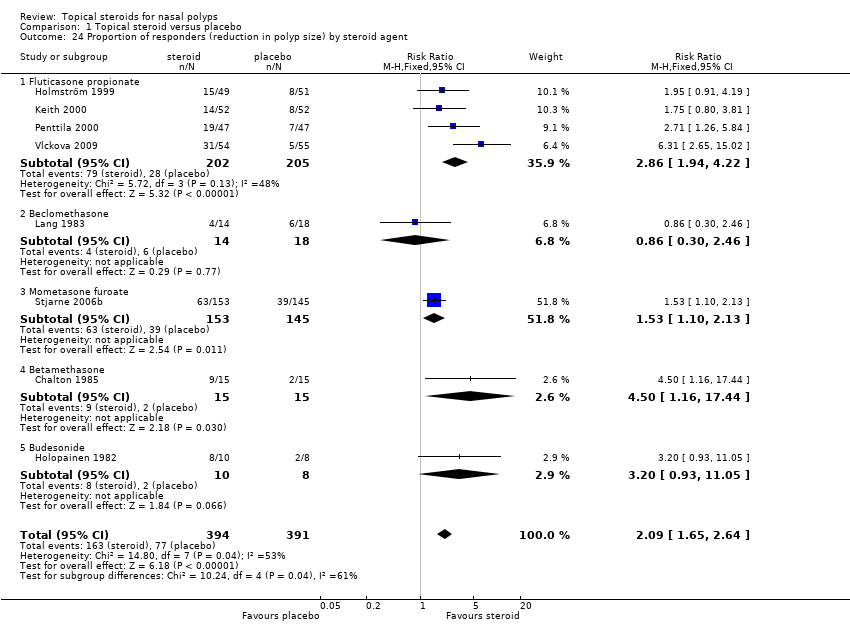
| 24 Proportion of responders (reduction in polyp size) by steroid agent Show forest plot | 8 | 785 | Risk Ratio (M‐H, Fixed, 95% CI) | 2.09 [1.65, 2.64] |
|
| 24.1 Fluticasone propionate | 4 | 407 | Risk Ratio (M‐H, Fixed, 95% CI) | 2.86 [1.94, 4.22] |
| 24.2 Beclomethasone | 1 | 32 | Risk Ratio (M‐H, Fixed, 95% CI) | 0.86 [0.30, 2.46] |
| 24.3 Mometasone furoate | 1 | 298 | Risk Ratio (M‐H, Fixed, 95% CI) | 1.53 [1.10, 2.13] |
| 24.4 Betamethasone | 1 | 30 | Risk Ratio (M‐H, Fixed, 95% CI) | 4.5 [1.16, 17.44] |
| 24.5 Budesonide | 1 | 18 | Risk Ratio (M‐H, Fixed, 95% CI) | 3.2 [0.93, 11.05] |
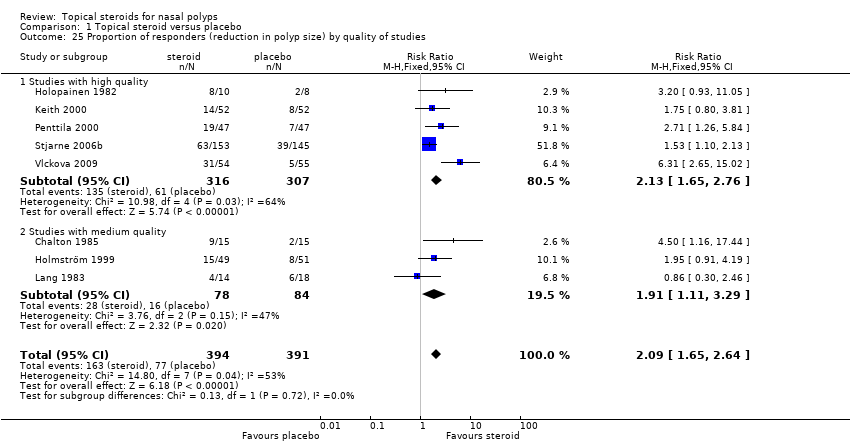
| 25 Proportion of responders (reduction in polyp size) by quality of studies Show forest plot | 8 | 785 | Risk Ratio (M‐H, Fixed, 95% CI) | 2.09 [1.65, 2.64] |
|
| 25.1 Studies with high quality | 5 | 623 | Risk Ratio (M‐H, Fixed, 95% CI) | 2.13 [1.65, 2.76] |
| 25.2 Studies with medium quality | 3 | 162 | Risk Ratio (M‐H, Fixed, 95% CI) | 1.91 [1.11, 3.29] |
| 26 Polyp recurrence after surgery Show forest plot | 6 | 437 | Risk Ratio (M‐H, Fixed, 95% CI) | 0.59 [0.45, 0.79] |
|
| 27 Polyp recurrence after surgery by quality of studies Show forest plot | 6 | 437 | Risk Ratio (M‐H, Fixed, 95% CI) | 0.59 [0.45, 0.79] |
|
| 27.1 Studies with high quality | 2 | 200 | Risk Ratio (M‐H, Fixed, 95% CI) | 0.68 [0.47, 0.98] |
| 27.2 Studies with medium or low quality | 4 | 237 | Risk Ratio (M‐H, Fixed, 95% CI) | 0.51 [0.33, 0.79] |
| 28 Peak nasal inspiratory flow Show forest plot | 7 | 587 | Mean Difference (IV, Fixed, 95% CI) | 22.04 [13.29, 30.80] |
|
| 29 Olfactory score Show forest plot | 1 | 109 | Mean Difference (IV, Fixed, 95% CI) | ‐0.45 [‐0.64, ‐0.26] |
|
| 30 Peak nasal inspiratory flow by topical delivery methods Show forest plot | 7 | 676 | Mean Difference (IV, Fixed, 95% CI) | 23.18 [15.24, 31.12] |
|
| 30.1 Nasal drop | 1 | 54 | Mean Difference (IV, Fixed, 95% CI) | 50.0 [‐5.42, 105.42] |
| 30.2 Nasal spray | 6 | 622 | Mean Difference (IV, Fixed, 95% CI) | 22.62 [14.60, 30.64] |
| 31 Change in nasal airflow Show forest plot | 3 | 204 | Std. Mean Difference (IV, Fixed, 95% CI) | ‐0.57 [‐0.85, ‐0.29] |
|
| 32 Proportion of responders (improvement in airflow) Show forest plot | 2 | 66 | Risk Ratio (M‐H, Fixed, 95% CI) | 1.91 [1.13, 3.22] |
|
| 33 Change in CT score Show forest plot | 1 | 54 | Mean Difference (IV, Fixed, 95% CI) | ‐1.02 [‐3.31, 1.27] |
|
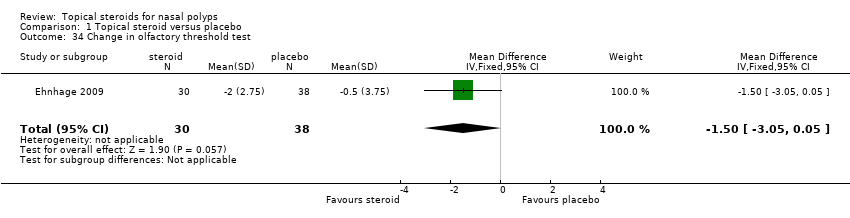
| 34 Change in olfactory threshold test Show forest plot | 1 | 68 | Mean Difference (IV, Fixed, 95% CI) | ‐1.5 [‐3.05, 0.05] |
|
| 35 Proportion of responders (improvement in olfaction‐subjective) Show forest plot | 1 | 298 | Risk Ratio (M‐H, Fixed, 95% CI) | 1.66 [1.15, 2.40] |
|
| 36 Peak nasal inspiratory flow by sinus surgery status Show forest plot | 7 | 587 | Mean Difference (IV, Fixed, 95% CI) | 22.04 [13.29, 30.80] |
|
| 36.1 Patients with sinus surgery | 4 | 214 | Mean Difference (IV, Fixed, 95% CI) | 24.01 [9.85, 38.17] |
| 36.2 Patients without sinus surgery | 3 | 373 | Mean Difference (IV, Fixed, 95% CI) | 20.83 [9.69, 31.97] |
| 37 Quality of life (SF36) Physical component summary Show forest plot | 1 | 68 | Mean Difference (IV, Fixed, 95% CI) | ‐2.0 [‐6.39, 2.39] |
|
| 38 Quality of life (SF36) Mental component summary Show forest plot | 1 | 68 | Mean Difference (IV, Fixed, 95% CI) | ‐5.0 [‐9.31, ‐0.69] |
|
| 39 Drop‐outs Show forest plot | | | Other data | No numeric data |
|
| 40 Adverse events Show forest plot | | | Other data | No numeric data |
|
| 41 Overall symptom scores by source of funding Show forest plot | 7 | 445 | Std. Mean Difference (IV, Fixed, 95% CI) | ‐0.46 [‐0.65, ‐0.27] |
|
| 41.1 Industry sponsored | 4 | 254 | Std. Mean Difference (IV, Fixed, 95% CI) | ‐0.21 [‐0.46, 0.04] |
| 41.2 Sponsored by other sources | 3 | 191 | Std. Mean Difference (IV, Fixed, 95% CI) | ‐0.81 [‐1.11, ‐0.52] |
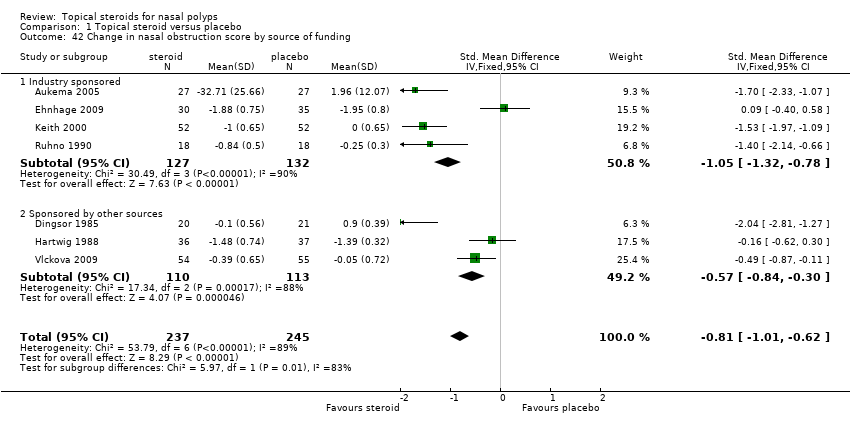
| 42 Change in nasal obstruction score by source of funding Show forest plot | 7 | 482 | Std. Mean Difference (IV, Fixed, 95% CI) | ‐0.81 [‐1.01, ‐0.62] |
|
| 42.1 Industry sponsored | 4 | 259 | Std. Mean Difference (IV, Fixed, 95% CI) | ‐1.05 [‐1.32, ‐0.78] |
| 42.2 Sponsored by other sources | 3 | 223 | Std. Mean Difference (IV, Fixed, 95% CI) | ‐0.57 [‐0.84, ‐0.30] |
| 43 Proportion of responders (reduction in polyp size) by source of funding Show forest plot | 8 | 785 | Risk Ratio (M‐H, Fixed, 95% CI) | 2.09 [1.65, 2.64] |
|
| 43.1 Industry sponsored | 3 | 496 | Risk Ratio (M‐H, Fixed, 95% CI) | 1.71 [1.29, 2.27] |
| 43.2 Sponsored by other sources | 5 | 289 | Risk Ratio (M‐H, Fixed, 95% CI) | 3.02 [1.97, 4.61] |
| 44 Overall symptom scores (post hoc) Show forest plot | 7 | 445 | Std. Mean Difference (IV, Random, 95% CI) | ‐0.52 [‐0.91, ‐0.12] |
|
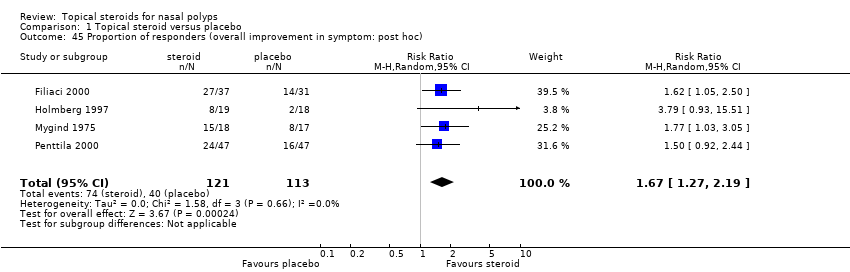
| 45 Proportion of responders (overall improvement in symptom: post hoc) Show forest plot | 4 | 234 | Risk Ratio (M‐H, Random, 95% CI) | 1.67 [1.27, 2.19] |
|
| 46 Proportion of responders (reduction in polyp size: post hoc) Show forest plot | 8 | 785 | Risk Ratio (M‐H, Random, 95% CI) | 2.23 [1.48, 3.36] |
|