Early additional food and fluids for healthy breastfed full‐term infants
Información
- DOI:
- https://doi.org/10.1002/14651858.CD006462.pub3Copiar DOI

- Base de datos:
-
- Cochrane Database of Systematic Reviews
- Versión publicada:
-
- 25 noviembre 2014see what's new
- Tipo:
-
- Intervention
- Etapa:
-
- Review
- Grupo Editorial Cochrane:
-
Grupo Cochrane de Embarazo y parto
- Copyright:
-
- Copyright © 2014 The Cochrane Collaboration. Published by John Wiley & Sons, Ltd.
Cifras del artículo
Altmetric:
Citado por:
Autores
Contributions of authors
Previous version of the review
Sharon Remmington conceived the review and with Tracey Remmington wrote the protocol. Genevieve Becker joined the team after the protocol was published. Tracey Remmington co‐ordinated the review and with Sharon Remmington screened the search results. All authors extracted the data. Tracey Remmington and Sharon Remmington appraised the quality of papers and Tracey Remmington entered data and led the analysis. Sharon Remmington and Tracey Remmington wrote the first draft and Genevieve Becker wrote the subsequent drafts with inputs from Tracey Remmington. All authors reviewed the final draft (Becker 2011).
Current version of the review
Genevieve Becker co‐ordinated the review update. Genevieve Becker and Tracey Remmington assessed study eligibility independently extracted data and entered data. Genevieve Becker wrote the first draft with input from Tracey Remmington.
Sources of support
Internal sources
-
Unit for Health Services Research and International Health, WHO Collaborating Centre for Maternal and Child Health, Institute for Maternal and Child Health, IRCCS Burlo Garofolo, Trieste, Italy.
For part of the time of this update, G Becker was employed by the Unit for Health Services Research and International Health with time allocated to work on this review.
External sources
-
No sources of support supplied
Declarations of interest
None known.
Acknowledgements
We are grateful to Sharon Remmington for her contribution to the initial version of this review (Becker 2011).
We are grateful to the study authors and their colleagues who provided further information, and to those people who noticed the requests and directed us to additional studies and ways of contacting authors.
Thanks are also due to Sonja Henderson (previous Managing Editor), Frances Kellie (Managing Editor), and Leanne Jones (Associate Editor), over the years of this review and their colleagues in the Review Group office of the Cochrane Pregnancy and Childbirth Group.
As part of the pre‐publication editorial process, this review has been commented on by two peers (an editor and referee who is external to the editorial team), a member of the Pregnancy and Childbirth Group's international panel of consumers and the Group's Statistical Adviser (2011).
Version history
| Published | Title | Stage | Authors | Version |
| 2016 Aug 30 | Early additional food and fluids for healthy breastfed full‐term infants | Review | Hazel A Smith, Genevieve E Becker | |
| 2014 Nov 25 | Early additional food and fluids for healthy breastfed full‐term infants | Review | Genevieve E Becker, Tracey Remmington | |
| 2011 Dec 07 | Early additional food and fluids for healthy breastfed full‐term infants | Review | Genevieve E Becker, Sharon Remmington, Tracey Remmington | |
| 2007 Apr 18 | Early additional food and fluids for healthy breastfed full‐term infants | Protocol | Sharon Remmington, Tracey Remmington | |
Differences between protocol and review
We updated the Background section and refocused to reflect exclusive breastfeeding as the norm and supplementation as an intervention, as well as more justification for the outcomes selected for examination.
Outcomes as listed in the protocol amended to (primary) physiological jaundice, absence or presence, and if present, duration (days), and (secondary) phototherapy in hospital or home setting if required, absence or presence, and if present, duration (days). This was changed in recognition that some participants are likely not to be jaundiced or to need phototherapy.
We have updated the methods in accordance with the updated Cochrane Handbook for Systematic Reviews of Interventions (Higgins 2011).
Notes
In the next update, we will consider an amendment to the stated outcome of "Weight change" to change to "Measures of growth and development" so as to include measures such as height, head circumference, and developmental aspects that may be included in trials. We will also consider amendment of the outcome "Maternal self‐confidence in breastfeeding" to "Confidence in breastfeeding" in order to include trials that examined confidence of fathers and other family members or those with significant influence on the mother.
Keywords
MeSH
Medical Subject Headings (MeSH) Keywords
- *Breast Feeding [statistics & numerical data];
- *Dietary Supplements [adverse effects];
- Dietary Carbohydrates [administration & dosage, adverse effects];
- Drinking Water [administration & dosage, adverse effects];
- Glucose [administration & dosage];
- Infant Food [*adverse effects];
- Randomized Controlled Trials as Topic;
- Term Birth;
- Time Factors;
Medical Subject Headings Check Words
Humans; Infant; Infant, Newborn;
PICO

Methodological quality graph: review authors' judgements about each methodological quality item presented as percentages across all included studies.
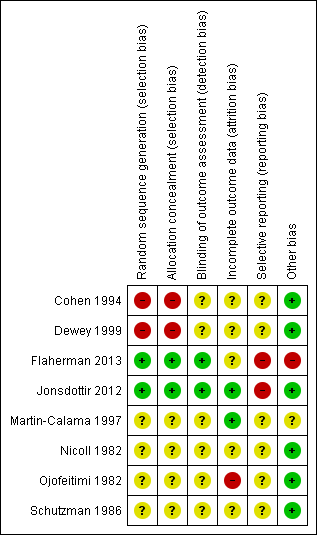
'Risk of bias' summary: review authors' judgements about each risk of bias item for each included study.
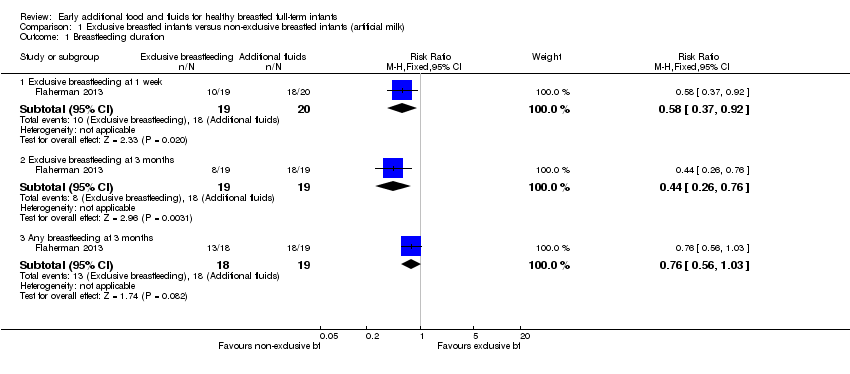
Comparison 1 Exclusive breastfed infants versus non‐exclusive breastfed infants (artificial milk), Outcome 1 Breastfeeding duration.

Comparison 1 Exclusive breastfed infants versus non‐exclusive breastfed infants (artificial milk), Outcome 2 Incidence of fever.

Comparison 1 Exclusive breastfed infants versus non‐exclusive breastfed infants (artificial milk), Outcome 3 Maternal self‐confidence.

Comparison 2 Exclusive breastfed infants versus non‐exclusive breastfed infants (water), Outcome 1 Breastfeeding duration.

Comparison 2 Exclusive breastfed infants versus non‐exclusive breastfed infants (water), Outcome 2 Maximum temperature (ºC).

Comparison 2 Exclusive breastfed infants versus non‐exclusive breastfed infants (water), Outcome 3 Minimum temperature (ºC).

Comparison 2 Exclusive breastfed infants versus non‐exclusive breastfed infants (water), Outcome 4 Episodes of hypoglycaemia (glycaemia < 2.2 mmol/l).

Comparison 2 Exclusive breastfed infants versus non‐exclusive breastfed infants (water), Outcome 5 Mean capillary blood glucose levels of infants (mmol/l).

Comparison 2 Exclusive breastfed infants versus non‐exclusive breastfed infants (water), Outcome 6 Weight change (g).

Comparison 2 Exclusive breastfed infants versus non‐exclusive breastfed infants (water), Outcome 7 Weight loss (%).
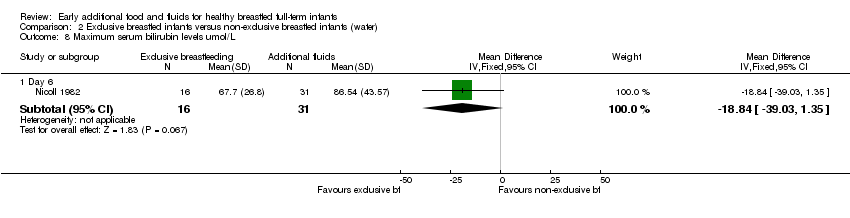
Comparison 2 Exclusive breastfed infants versus non‐exclusive breastfed infants (water), Outcome 8 Maximum serum bilirubin levels umol/L.

Comparison 3 Exclusive breastfed infants versus non‐exclusive breastfed infants (foods), Outcome 1 Fever (% of days).

Comparison 3 Exclusive breastfed infants versus non‐exclusive breastfed infants (foods), Outcome 2 Cough (% of days).
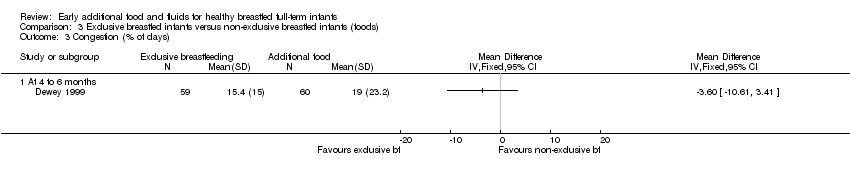
Comparison 3 Exclusive breastfed infants versus non‐exclusive breastfed infants (foods), Outcome 3 Congestion (% of days).
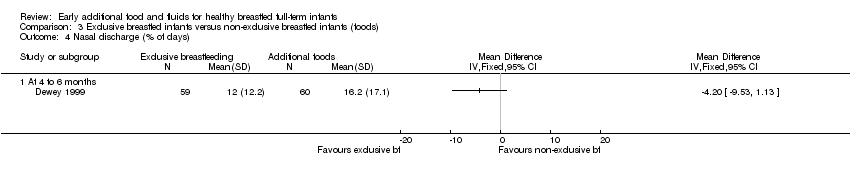
Comparison 3 Exclusive breastfed infants versus non‐exclusive breastfed infants (foods), Outcome 4 Nasal discharge (% of days).

Comparison 3 Exclusive breastfed infants versus non‐exclusive breastfed infants (foods), Outcome 5 Hoarseness (% of days).
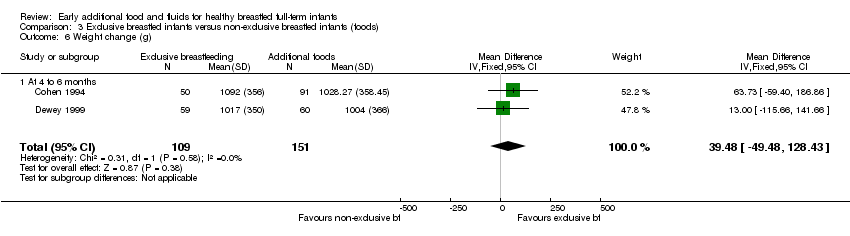
Comparison 3 Exclusive breastfed infants versus non‐exclusive breastfed infants (foods), Outcome 6 Weight change (g).

Comparison 3 Exclusive breastfed infants versus non‐exclusive breastfed infants (foods), Outcome 7 Weight change (z score).
| % of mothers who continued either exclusive or partial breastfeeding | Exclusive breastfeeding on day 1‐3 group (non‐glucose water) (n = 87) | Glucose water on day 1‐3 (n = 83) |
| At 4 weeks | 93% | 77% |
| At 8 weeks | 81% | 64% |
| At 12 weeks | 75% | 51% |
| At 16 weeks | 67% | 43% |
| At 20 weeks | 57% | 40% |
| These figures were estimated from a graph (Figure 2) on page 212 of the Martin‐Calama 1997 paper. | ||
| Outcome or subgroup title | No. of studies | No. of participants | Statistical method | Effect size |
| 1 Breastfeeding duration Show forest plot | 1 | Risk Ratio (M‐H, Fixed, 95% CI) | Subtotals only | |
| 1.1 Exclusive breastfeeding at 1 week | 1 | 39 | Risk Ratio (M‐H, Fixed, 95% CI) | 0.58 [0.37, 0.92] |
| 1.2 Exclusive breastfeeding at 3 months | 1 | 38 | Risk Ratio (M‐H, Fixed, 95% CI) | 0.44 [0.26, 0.76] |
| 1.3 Any breastfeeding at 3 months | 1 | 37 | Risk Ratio (M‐H, Fixed, 95% CI) | 0.76 [0.56, 1.03] |
| 2 Incidence of fever Show forest plot | 1 | 38 | Risk Ratio (M‐H, Fixed, 95% CI) | 1.5 [0.28, 7.99] |
| 3 Maternal self‐confidence Show forest plot | 1 | 39 | Mean Difference (IV, Fixed, 95% CI) | 0.10 [‐0.34, 0.54] |
| Outcome or subgroup title | No. of studies | No. of participants | Statistical method | Effect size |
| 1 Breastfeeding duration Show forest plot | 1 | Risk Ratio (M‐H, Fixed, 95% CI) | Subtotals only | |
| 1.1 At 4 weeks | 1 | 170 | Risk Ratio (M‐H, Fixed, 95% CI) | 1.21 [1.06, 1.38] |
| 1.2 At 8 weeks | 1 | 170 | Risk Ratio (M‐H, Fixed, 95% CI) | 1.26 [1.04, 1.53] |
| 1.3 At 12 weeks | 1 | 170 | Risk Ratio (M‐H, Fixed, 95% CI) | 1.48 [1.16, 1.89] |
| 1.4 At 16 weeks | 1 | 170 | Risk Ratio (M‐H, Fixed, 95% CI) | 1.54 [1.15, 2.05] |
| 1.5 At 20 weeks | 1 | 170 | Risk Ratio (M‐H, Fixed, 95% CI) | 1.45 [1.05, 1.99] |
| 2 Maximum temperature (ºC) Show forest plot | 1 | Mean Difference (IV, Fixed, 95% CI) | Subtotals only | |
| 2.1 At 72 hours | 1 | 170 | Mean Difference (IV, Fixed, 95% CI) | 0.10 [0.01, 0.19] |
| 3 Minimum temperature (ºC) Show forest plot | 1 | Mean Difference (IV, Fixed, 95% CI) | Subtotals only | |
| 3.1 At 72 hours | 1 | 170 | Mean Difference (IV, Fixed, 95% CI) | 0.10 [0.02, 0.18] |
| 4 Episodes of hypoglycaemia (glycaemia < 2.2 mmol/l) Show forest plot | 1 | Risk Ratio (M‐H, Fixed, 95% CI) | Subtotals only | |
| 4.1 At 6 hours of life | 1 | 170 | Risk Ratio (M‐H, Fixed, 95% CI) | 2.39 [0.48, 11.96] |
| 4.2 At 12 hours of life | 1 | 170 | Risk Ratio (M‐H, Fixed, 95% CI) | 14.32 [0.83, 246.80] |
| 4.3 At 24 hours of life | 1 | 170 | Risk Ratio (M‐H, Fixed, 95% CI) | 0.64 [0.11, 3.71] |
| 4.4 At 48 hours of life | 1 | 170 | Risk Ratio (M‐H, Fixed, 95% CI) | 2.86 [0.30, 26.97] |
| 5 Mean capillary blood glucose levels of infants (mmol/l) Show forest plot | 1 | Mean Difference (IV, Fixed, 95% CI) | Subtotals only | |
| 5.1 At 6 hours of life | 1 | 170 | Mean Difference (IV, Fixed, 95% CI) | ‐0.29 [‐0.56, ‐0.02] |
| 5.2 At 12 hours of life | 1 | 170 | Mean Difference (IV, Fixed, 95% CI) | ‐0.47 [‐0.70, ‐0.24] |
| 5.3 At 24 hours of life | 1 | 170 | Mean Difference (IV, Fixed, 95% CI) | ‐0.34 [‐0.60, ‐0.08] |
| 5.4 At 48 hours of life | 1 | 170 | Mean Difference (IV, Fixed, 95% CI) | ‐0.24 [‐0.51, 0.03] |
| 6 Weight change (g) Show forest plot | 1 | Mean Difference (IV, Fixed, 95% CI) | Subtotals only | |
| 6.1 At 6 hours of life | 1 | 170 | Mean Difference (IV, Fixed, 95% CI) | 7.0 [0.76, 13.24] |
| 6.2 At 12 hours of life | 1 | 170 | Mean Difference (IV, Fixed, 95% CI) | 11.5 [1.71, 21.29] |
| 6.3 At 24 hours of life | 1 | 170 | Mean Difference (IV, Fixed, 95% CI) | 13.40 [0.43, 26.37] |
| 6.4 At 48 hours of life | 1 | 170 | Mean Difference (IV, Fixed, 95% CI) | 32.5 [12.91, 52.09] |
| 6.5 At 72 hours of life | 1 | 170 | Mean Difference (IV, Fixed, 95% CI) | ‐3.0 [‐26.83, 20.83] |
| 7 Weight loss (%) Show forest plot | 1 | Mean Difference (IV, Fixed, 95% CI) | Subtotals only | |
| 7.1 Day 3 | 1 | 47 | Mean Difference (IV, Fixed, 95% CI) | 1.03 [‐0.18, 2.24] |
| 7.2 Day 5 | 1 | 47 | Mean Difference (IV, Fixed, 95% CI) | 0.20 [‐1.18, 1.58] |
| 8 Maximum serum bilirubin levels umol/L Show forest plot | 1 | Mean Difference (IV, Fixed, 95% CI) | Subtotals only | |
| 8.1 Day 6 | 1 | 47 | Mean Difference (IV, Fixed, 95% CI) | ‐18.84 [‐39.03, 1.35] |
| Outcome or subgroup title | No. of studies | No. of participants | Statistical method | Effect size |
| 1 Fever (% of days) Show forest plot | 1 | Mean Difference (IV, Fixed, 95% CI) | Totals not selected | |
| 1.1 4 to 6 months | 1 | Mean Difference (IV, Fixed, 95% CI) | 0.0 [0.0, 0.0] | |
| 2 Cough (% of days) Show forest plot | 1 | Mean Difference (IV, Fixed, 95% CI) | Totals not selected | |
| 2.1 At 4 to 6 months | 1 | Mean Difference (IV, Fixed, 95% CI) | 0.0 [0.0, 0.0] | |
| 3 Congestion (% of days) Show forest plot | 1 | Mean Difference (IV, Fixed, 95% CI) | Totals not selected | |
| 3.1 At 4 to 6 months | 1 | Mean Difference (IV, Fixed, 95% CI) | 0.0 [0.0, 0.0] | |
| 4 Nasal discharge (% of days) Show forest plot | 1 | Mean Difference (IV, Fixed, 95% CI) | Totals not selected | |
| 4.1 At 4 to 6 months | 1 | Mean Difference (IV, Fixed, 95% CI) | 0.0 [0.0, 0.0] | |
| 5 Hoarseness (% of days) Show forest plot | 1 | Mean Difference (IV, Fixed, 95% CI) | Totals not selected | |
| 5.1 At 4 to 6 months | 1 | Mean Difference (IV, Fixed, 95% CI) | 0.0 [0.0, 0.0] | |
| 6 Weight change (g) Show forest plot | 2 | 260 | Mean Difference (IV, Fixed, 95% CI) | 39.48 [‐49.48, 128.43] |
| 6.1 At 4 to 6 months | 2 | 260 | Mean Difference (IV, Fixed, 95% CI) | 39.48 [‐49.48, 128.43] |
| 7 Weight change (z score) Show forest plot | 1 | Mean Difference (IV, Fixed, 95% CI) | Totals not selected | |
| 7.1 4 to 6 months | 1 | Mean Difference (IV, Fixed, 95% CI) | 0.0 [0.0, 0.0] | |