Alimentos y líquidos adicionales tempranos para recién nacidos a término sanos que reciben lactancia materna
Resumen
Antecedentes
Las organizaciones de salud recomiendan la lactancia materna exclusiva durante seis meses. Sin embargo, la adición de otros líquidos o alimentos antes de los seis meses es común en muchos países. Recientemente, las investigaciones han sugerido que la introducción de alimentos sólidos alrededor de los cuatro meses de edad mientras el bebé sigue con lactancia materna es más protectora contra el desarrollo de alergias alimentarias en comparación con la lactancia materna exclusiva durante seis meses. Otros estudios han demostrado que los riesgos asociados a la lactancia materna no exclusiva dependen del tipo de alimento o líquido adicional que se administre. Dados estos antecedentes, se consideró que era importante actualizar la versión anterior de esta revisión para incorporar los últimos hallazgos de los estudios que examinan la lactancia materna exclusiva en comparación con la no exclusiva.
Objetivos
Evaluar los efectos beneficiosos y perjudiciales de los alimentos o líquidos adicionales para los lactantes sanos a término y examinar el momento adecuado y el tipo de alimentos o líquidos adicionales.
Métodos de búsqueda
Se hicieron búsquedas en el registro de ensayos del Grupo Cochrane de Embarazo y Parto (Cochrane Pregnancy and Childbirth Group) (1 marzo 2016) y en las listas de referencias de todos los artículos relevantes recuperados.
Criterios de selección
Ensayos controlados aleatorizados o cuasialeatorizados en lactantes con menos de seis meses de vida que compararon la lactancia materna exclusiva versus lactancia materna con cualquier alimento o líquido adicional.
Obtención y análisis de los datos
Dos autores de la revisión de forma independiente evaluaron los ensayos para la inclusión y el riesgo de sesgo, extrajeron los datos y verificaron su exactitud. Dos autores de la revisión evaluaron la calidad de la evidencia mediante los criterios GRADE.
Resultados principales
Se incluyeron 11 ensayos (2542 lactantes/madres asignados al azar). Nueve ensayos (2226 analizados) proporcionaron datos sobre los resultados de interés para esta revisión. La variación de las medidas de resultado y los puntos temporales dificultó la agrupación de los resultados de los ensayos. Los datos sólo pudieron combinarse en un metaanálisis para un resultado principal (duración de la lactancia) y uno secundario (cambio de peso). Ninguno de los ensayos informó sobre la ictericia fisiológica. La mortalidad infantil sólo se informó en un ensayo.
En la mayoría de los ensayos más antiguos, la descripción de los métodos de estudio fue inadecuada para evaluar el riesgo de sesgo. La mayoría de los estudios que se pudo evaluar mostraron un alto riesgo de otros sesgos y más de la mitad tenían un alto riesgo de sesgo de selección.
El suministro de leche artificial a los lactantes, en comparación con la lactancia materna exclusiva, no afectó las tasas de lactancia materna al alta hospitalaria (riesgo relativo (RR) 1,02; intervalo de confianza (IC) del 95%: 0,97 a 1,08; un ensayo, 100 lactantes; evidencia de calidad baja). A los tres meses, los lactantes que recibieron leche artificial tuvieron tasas más altas de cualquier tipo de lactancia materna en comparación con los lactantes con lactancia materna exclusiva (RR 1,21; IC del 95%: 1,05 a 1,41; dos ensayos, 137 lactantes; evidencia de calidad baja). Los lactantes a los que se les administró leche artificial en los primeros días después del nacimiento antes de amamantarlos tuvieron menos "síntomas obvios o probables" de alergia en comparación con los lactantes alimentados exclusivamente con leche materna (RR 0,56; IC del 95%: 0,35 a 0,91; un ensayo, 207 lactantes; evidencia de calidad muy baja). No se encontraron diferencias en la confianza materna cuando se compararon los lactantes con lactancia materna no exclusiva que recibieron leche artificial con los lactantes con lactancia materna exclusiva (diferencia de medias (DM) 0,10; IC del 95%: ‐0,34 a 0,54; un estudio, 39 lactantes; evidencia de calidad baja). Las tasas de lactancia materna fueron más bajas en el grupo de lactancia materna no exclusiva en comparación con el grupo de lactancia materna exclusiva a las cuatro, ocho, 12 (RR 0,68, IC del 95%: 0,53 a 0,87; un ensayo, 170 lactantes; evidencia de calidad baja), 16 y 20 semanas.
El agregado de agua con glucosa dio lugar a menos episodios de hipoglucemia (por debajo de 2,2 mmol/l) en comparación con el grupo de lactancia materna exclusiva, informado a las 12 horas (RR 0,07, IC del 95%: 0,00 a 1,20; un ensayo, 170 lactantes; evidencia de calidad muy baja), pero ninguna diferencia significativa a las 24 horas (RR 1,57, IC del 95%: 0,27 a 9,17; un ensayo, 170 lactantes; evidencia de calidad muy baja). La pérdida de peso fue menor en los lactantes que recibieron agua glucosilada adicional (un ensayo, 170 lactantes) a las seis, 12, 24 y 48 horas de vida (DM ‐32,50 g, IC del 95%: ‐52,09 a ‐12,91; evidencia de calidad baja) en comparación con los lactantes alimentados exclusivamente con leche materna, pero no se observaron diferencias entre los grupos a las 72 horas de vida (DM 3,00 g, IC del 95%: ‐20,83 a 26,83; evidencia de calidad muy baja). En otro ensayo con los brazos de agua y agua con glucosa combinados (un ensayo, 47 lactantes), no se encontraron diferencias significativas en la pérdida de peso entre el grupo de líquidos adicionales y el grupo de lactancia materna exclusiva, ya sea en el día tres o en el día cinco (DM ‐1,03%, IC del 95%: ‐2,24 a 0,18; evidencia de muy baja calidad) y (DM ‐0,20%, IC del 95%: ‐0,86 a 0,46; evidencia de calidad muy baja).
En un ensayo se informó de la mortalidad infantil y no se produjeron muertes en ninguno de los dos grupos (1162 lactantes). La introducción temprana de alimentos potencialmente alergénicos, en comparación con la lactancia materna exclusiva, no redujo el riesgo de "alergia alimentaria" a uno o más de estos alimentos entre uno y tres años de edad (RR 0,80; IC del 95%: 0,51 a 1.25; 1162 niños), el eccema visible a los 12 meses estratificado por el eccema visible en el momento de la inscripción (RR 0,86; IC del 95%: 0,51 a 1,44; 284 niños), o las reacciones al síndrome de enterocolitis inducida por las proteínas alimentarias (RR 2,00; IC del 95%: 0,18 a 22,04; 1303 niños) (todas la evidencia de calidad moderada). Los lactantes que recibieron alimentos adicionales a partir de los cuatro meses no mostraron diferencias en el aumento de peso del lactante (g) de 16 a 26 semanas en comparación con la lactancia materna exclusiva hasta los seis meses (DM ‐39,48; IC del 95%: ‐128,43 a 49,48; dos ensayos, 260 niños; evidencia de baja calidad) o en las puntuaciones z del peso (DM ‐0,01; IC del 95%: ‐0,15 a 0,13; un ensayo, 100 niños; evidencia de calidad moderada).
Conclusiones de los autores
No se encontró evidencia de beneficio para los recién nacidos en cuanto a la duración de la lactancia materna por el uso breve de agua adicional o agua con glucosa. La calidad de la evidencia sobre la suplementación con fórmula no era suficiente para sugerir un cambio en la práctica de la lactancia materna exclusiva. En el caso de los niños de cuatro a seis meses, no se encontró evidencia de beneficio de los alimentos adicionales ni riesgos relacionados con la morbilidad o el cambio de peso. La mayoría de los estudios mostraron un alto riesgo de otros sesgos y la mayoría de los resultados se basaron en evidencia de baja calidad, lo que significó que no se pudieron evaluar plenamente los beneficios o daños de los suplementos ni determinar el impacto del momento adecuado y el tipo de suplemento
No se encontró ninguna evidencia que no esté de acuerdo con la actual recomendación internacional de que los niños sanos se alimenten exclusivamente con leche materna durante los primeros seis meses.
PICO
Resumen en términos sencillos
Alimentos y líquidos adicionales tempranos para recién nacidos a término sanos que reciben lactancia materna
¿Cuál es el problema?
A nivel internacional, se recomienda la lactancia materna exclusiva durante los primeros seis meses de vida, pero la práctica de dar a los lactantes otros líquidos y/o alimentos antes de los seis meses es común en muchos países y comunidades.
¿Por qué es esto importante?
Dado que muchos lactantes no se alimentan exclusivamente de leche materna durante seis meses, es importante examinar los posibles beneficios o riesgos asociados con la administración a los lactantes de líquidos distintos de la leche materna o de alimentos complementarios en los primeros seis meses después del nacimiento.
¿Qué evidencia se encontró?
Esta revisión incluye 11 ensayos controlados aleatorizados con 2542 lactantes.
El hecho de dar a los bebés pequeñas cantidades de leche artificial durante unos pocos días después del nacimiento, además de la lactancia materna, no afectó al número de bebés con lactancia al alta hospitalaria, aunque sí aumentó ligeramente la probabilidad de cualquier lactancia materna a los tres meses. No hubo diferencias en el nivel de confianza materna entre los grupos. El uso de leche artificial antes de la lactancia materna tuvo un ligero efecto protector contra los síntomas de la alergia a los 18 meses de edad en comparación con la lactancia materna exclusiva, sin embargo, en el ensayo no se realizaron retos de diagnóstico ni otras pruebas para confirmar los síntomas de la alergia observados y, por lo tanto, se requiere precaución en la interpretación.
La probabilidad de que los lactantes siguieran con lactancia materna era mayor en el grupo de lactancia materna exclusiva que en el grupo al que se le proporcionó agua adicional o agua con glucosa en los primeros días después del nacimiento. No hubo evidencia de beneficios relacionados con los niveles de glucosa, la temperatura, la pérdida de peso de los recién nacidos que recibieron lactancia materna y a los que se les dio agua adicional o agua con glucosa.
Los lactantes que recibieron alimentos complementarios entre los cuatro y los seis meses de edad no mostraron un riesgo reducido de alergias alimentarias, eccema o reacciones al síndrome de enterocolitis inducida por las proteínas alimentarias. No hubo diferencias entre los primeros alimentos complementarios y los grupos de lactancia materna exclusiva en cuanto al porcentaje de días de tos, congestión, secreción nasal y ronquera, fiebre, deficiencia de hierro o aumento de peso.
¿Qué significa esto?
Esta revisión no encontró evidencia suficiente para estar en desacuerdo con la recomendación de la Organización Mundial de la Salud y otras organizaciones internacionales de salud de que, como política general, se debe recomendar la lactancia materna exclusiva, sin alimentos ni líquidos adicionales, durante los primeros seis meses después del nacimiento.
Authors' conclusions
Summary of findings
| Non‐exclusive breastfeeding (artificial milk) versus exclusive breastfeeding | ||||||
| Patient or population: healthy breastfeeding full‐term infants | ||||||
| Outcomes | Anticipated absolute effects* (95% CI) | Relative effect | № of participants | Quality of the evidence | Comments | |
| Risk with exclusive breastfeeding infants | Risk with non‐exclusive breastfeeding infants (artificial milk) | |||||
| Any breastfeeding at discharge | Study population | RR 1.02 (0.97 to 1.08) | 100 | ⊕⊕⊝⊝ | ||
| 980 per 1000 | 1000 per 1000 (951 to 1000) | |||||
| Any breastfeeding at 3 months | Study population | RR 1.21 | 137 | ⊕⊕⊝⊝ | ||
| 765 per 1000 | 925 per 1000 | |||||
| Infant morbidity ‐ allergy symptoms ‐ Infants with allergy symptoms at 18 months of age | Study population | RR 0.56 | 207 | ⊕⊝⊝⊝ | ||
| 327 per 1000 | 183 per 1000 | |||||
| Weight change | This outcome was not reported. | |||||
| Maternal self‐confidence Modified breastfeeding self‐efficacy score at 1 week. Items rated on a scale from 1 (“Strongly Disagree”) to 5 (“Strongly Agree”), with positive scores associated with increased breastfeeding self‐efficacy. | The mean maternal self‐confidence was 3.9 units (SD 0.7) n = 20 | The mean maternal self‐confidence in the artificial milk group was 0.1 units higher on a 5‐point scale (95% CI 0.34 lower to 0.54 higher) | ‐ | 39 | ⊕⊕⊝⊝ | Modified breastfeeding self‐efficacy score at 1 week. Items rated on a scale from 1 (“Strongly Disagree”) to 5 (“Strongly Agree”) with higher scores associated with more breastfeeding self‐efficacy |
| *The risk in the intervention group (and its 95% confidence interval) is based on the assumed risk in the comparison group and the relative effect of the intervention (and its 95% CI). | ||||||
| GRADE Working Group grades of evidence | ||||||
| 1 Control group had low adherence to the study protocol (‐1). 2 We are unsure of the impact of the recruitment of only infants with greater than or equal to 5% weight loss as 5% is within normal expected range. 3 Wide confidence intervals crossing the line of no effect and small sample size (‐1). 4 1 trial had baseline imbalances in multiparity. 5 Evidence based on small sample size (‐1). 6 Confidence intervals crossing the line of no difference and small sample size (‐1). 7 1 trial with quasi‐random sequence generation, baseline imbalances for family history of allergy, 1 infant was changed from its allocated group due to family history of allergy, unclear if exclusive breastfeeding group received water or colostrum in the first 48 hours, high number of outcome assessors working independently and diagnosis of allergy was based on clinical criteria with no diagnostic testing | ||||||
| Non‐exclusive breastfeeding (water or glucose water) versus exclusive breastfeeding | ||||||
| Patient or population: healthy breastfeeding full‐term infants | ||||||
| Outcomes | Anticipated absolute effects* (95% CI) | Relative effect | № of participants | Quality of the evidence | Comments | |
| Risk with exclusive breastfeeding infants | Risk with non‐exclusive breastfeeding infants (water) | |||||
| Any breastfeeding at 12 weeks | Study population | RR 0.68 | 170 | ⊕⊕⊝⊝ | Estimated from the graph the percentage of mothers breastfeeding at each time period (see Table 1). | |
| 747 per 1000 | 508 per 1000 | |||||
| Hypoglycaemia episodes at 12 hours of life (glycaemia < 2.2 mmol/L) | Study population | RR 0.07 (0.00 to 1.20) | 170 | ⊕⊝⊝⊝ | Trialists used a cut‐off point as serum glucose less than 2.2 mmol/L whereas some researchers define a lower cut‐off level (1.7 mmol/L). Trialists report there was no case of serum glucose levels under 1.7 mmol/L in either of the 2 groups and no cases presented hypoglycaemic symptoms. | |
| 80 per 1000 | 6 per 1000 | |||||
| Hypoglycaemia episodes at 24 hours of life (glycaemia < 2.2 mmol/L) | Study population | RR 1.57 | 170 | ⊕⊝⊝⊝ | Trialists used a cut‐off point as serum glucose less than 2.2 mmol/L whereas some researchers define a lower cut‐off level (1.7 mmol/L). Trialists report there was no case of serum glucose levels under 1.7 mmol/L in either of the 2 groups and no cases presented hypoglycaemic symptoms. | |
| 23 per 1000 | 36 per 1000 | |||||
| Weight change (loss) (g) at 48 hours | The mean weight loss (g) at 48 hours was 197.8 g (SD 73.2) | Infants with additional fluids (water) were on average (MD) 32.5 g heavier (less weight lost) (CI 12.91 g heavier to 52.09 g heavier) | ‐ | 170 | ⊕⊕⊝⊝ | This mean difference of 32.5 g is not clinically meaningful. |
| Weight change (loss) (g) at 72 hours | The mean weight loss (g) at 72 hours was 141.9 g (SD 89.1) | Infants with additional fluids (water) were on average (MD) 3 g lighter (more weight lost) (CI 26.83 g lighter to 20.83 heavier) | ‐ | 170 | ⊕⊝⊝⊝ | |
| Weight loss (%) day 3 (percentage of birthweight) | The mean weight loss (%) day 3 was 6% of birthweight | Infants with additional fluids (water) lost on average (MD) 1.03% less of their birthweight (CI 2.24% less to 0.18% more weight lost) | ‐ | 47 | ⊕⊝⊝⊝ | We combined the glucose and water supplement arms of the Nicoll 1982 trial. |
| Weight loss (%) day 5 (percentage of birthweight) | The mean weight loss (%) day 5 was 4.3% of birthweight | Infants with additional fluids (water) lost on average (MD) 0.2% less of their birthweight (CI 0.86% less to 0.46% more weight lost) | ‐ | 47 | ⊕⊝⊝⊝ | We combined the glucose and water supplement arms of the Nicoll 1982 trial. |
| Confidence in breastfeeding (maternal or of those influencing the mother) | This outcome was not reported. | |||||
| *The risk in the intervention group (and its 95% confidence interval) is based on the assumed risk in the comparison group and the relative effect of the intervention (and its 95% CI). | ||||||
| GRADE Working Group grades of evidence | ||||||
| 1 1 trial with no information on sequence generation or allocation concealment (‐1). 2 Evidence based on small sample size (‐1). 3 Wide confidence intervals crossing the line of no effect and small sample size (‐2). 4 Few events | ||||||
| Non‐exclusive breastfeeding (foods) versus exclusive breastfeeding | ||||||
| Patient or population: healthy breastfeeding full‐term infants | ||||||
| Outcomes | Anticipated absolute effects* (95% CI) | Relative effect | № of participants | Quality of the evidence | Comments | |
| Risk with Exclusive breastfeeding infants | Risk with non‐exclusive breastfeeding infants (foods) | |||||
| Duration of breastfeeding (at different time points) | This outcome was not reported in a format that could be analysed. | |||||
| Fever (% of days) ‐ 4 to 6 months | The mean fever (% of days) ‐ 4 to 6 months was 8% days (SD 7.2) | Infants with additional foods had a fever on average 0.7% of days lower (CI 3.4% fewer to 2% more days) | ‐ | 119 | ⊕⊕⊝⊝ | |
| “Food allergy” to 1 or more foods between 1 to 3 years of age | Study population | RR 0.80 | 1162 | ⊕⊕⊕⊝ | There was low adherence to the protocol in the intervention group | |
| 71 per 1000 | 56 per 1000 | |||||
| Visible eczema at 12‐month visit stratified by visible eczema at enrolment | Study population | RR 0.86 | 284 | ⊕⊕⊕⊝ | There was low adherence to the protocol in the intervention group | |
| 182 per 1000 | 156 per 1000 | |||||
| Food protein enterocolitis syndrome positive response to challenge (number of children) | Study population | RR 2.00 | 1303 | ⊕⊕⊕⊝ | There was low adherence to the protocol in the intervention group | |
| 2 per 1000 | 3 per 1000 | |||||
| Weight change (gain) (g) ‐ 4 to 6 months | The mean weight change (gain) (g) at 4 to 6 months was 1054 g | Infants with additional foods gained on average (MD) 39.48 g less weight (CI 128.43 g less to 49.48 g more weight gain) | ‐ | 260 | ⊕⊕⊝⊝ | |
| Weight change (z score) as standard deviations of an overall population distribution of infant weight gain at 4 ‐ 6 months | The mean weight change (z score) was 0.01 standard deviations less weight gained | The mean weight change for infants with additional foods was 0.01 standard deviations less weight gained (0.15 standard deviations less weight gained to 0.13 standard deviations more weight gained) | ‐ | 100 | ⊕⊕⊕⊝ | The differences in weight change from 4 to 6 months are negligible between the groups |
| Confidence in breastfeeding (maternal or of those influencing the mother) | This outcome was not reported in a format that could be analysed. | |||||
| *The risk in the intervention group (and its 95% confidence interval) is based on the assumed risk in the comparison group and the relative effect of the intervention (and its 95% CI). | ||||||
| GRADE Working Group grades of evidence | ||||||
| 1 Quasi‐random sequence generation (by week of birth) (‐1). 2 Wide confidence interval crossing the line of no effect and small sample size (‐1). 3 Estimate based on small sample size (‐1). | ||||||
Background
Human milk for human babies is the biological norm. It has long been recognised as both the unequalled way of providing all the nutritional, immunological and psychological requirements that a healthy, term infant needs to thrive, and important to the health and well‐being of the mother. Reviews of studies in both economically advantaged and disadvantaged settings have shown short‐term and long‐term risks to the child and to the mother from not breastfeeding (Chen 2004; Horta 2013a; Ip 2007; Kramer 2012; Leon‐Cava 2002; Victora 2016).
Description of the condition
Exclusive breastfeeding is defined as an infant's consumption of human milk with no supplementation of any type, including no water, juice, non‐human milk or foods, although medicines, vitamins and minerals are allowed (WHO 2008). A review of interventions in 42 developing countries estimated that exclusive breastfeeding for six months and continued breastfeeding for the first year of life could prevent 13% of the over 10 million deaths per annum of children less than five years old. Breastfeeding is identified as the single most important preventative intervention in saving such lives (Black 2013; Jones 2003). Compared to exclusive breastfeeding, the risks from partial or non‐exclusive breastfeeding have been recognised for many years, including a higher rate of infant morbidity and mortality from diarrhoea and respiratory illness (Arifeen 2001; Brown 1989; Chantry 2006; Feachem 1984; Horta 2013b; Kramer 2003; Quigley 2007; Talayero 2006; Victora 2016; Wilson 1998). Non‐exclusive breastfeeding may result in an earlier return of the mother's fertility and a shorter inter‐birth interval (WHO 1999).
International actions work to improve the health of children and their mothers through the promotion of exclusive breastfeeding. The Baby Friendly Hospital Initiative (BFHI) is a global programme started in 1989 to protect and support exclusive breastfeeding through improvement of healthcare practices that affect infant feeding. It has an assessment criterion of 'Give newborn infants no food or drink other than breast milk unless medically indicated' (UNICEF/WHO 2009). In 2002, the World Health Assembly, supported by many national and international health associations, reiterated the importance of exclusive breastfeeding in the Global Strategy for Infant and Young Child Feeding. Their previous recommendation for exclusive breastfeeding for "four to six months" was amended to state that as a global public health recommendation, infants should be exclusively breastfeeding for the first six months of life and thereafter breastfeeding continued up to two years of age or beyond with the addition of adequate and safe complementary foods (WHO 2003).
From the data in the World Health Organization (WHO) Global Data Bank on Infant and Young Child Feeding 2009, it is estimated that only 38% of infants are exclusively breastfeeding for the first six months. There are indications that in many countries exclusive breastfeeding, though still low, has increased in the last decade (WHO 2014).
Supplementary feedings are classified as feeds provided in place of breastfeeding. These may include artificial baby milk, glucose water, teas, water or complementary semi‐solid or solid) foods. Thus, any foods or fluids given before six months, the recommended duration of exclusive breastfeeding, are therefore defined as supplementary (AAP 2012; ABM 2009).
Studies on early additional fluids or foods tend to involve either additional fluids in the early weeks or the addition of foods at four to six months of age. Numerous health services, personal, socioeconomic and cultural factors influence the decision to supplement human milk. These factors include:
-
pre‐lacteal feeds may be given in the belief that colostrum is harmful, or to clean the infant's gut (Davies‐Adetugbo 1997);
-
early additional fluids are more likely following caesarean section (Ladomenou 2007), if hospital practices separate mother and infant at birth (Gagnon 2005; Kurinij 1991), or if the hospital does not follow practices in accordance with the WHO/UNICEF Baby Friendly Hospital Initiative (AAP 2012; Biro 2011);
-
additional fluids or foods may be given in the belief they will reduce maternal fatigue, by health workers (Cloherty 2004; Gagnon 2005), and by family members (Cohen 1999);
-
lack of health worker time to assist breastfeeding (Furber 2006; Gagnon 2005);
-
additional fluids or foods as the solution to the perception that the baby is unsettled due to low milk supply (Akuse 2002; Blomquist 1994; Gagnon 2005; Graffy 1992; Nicoll 1982), or to make the baby sleep longer;
-
maternal unrealistic expectations of newborn behaviour, difficulty in caring for a newborn, or other maternal concerns, and fluids other than mother's milk is seen as the solution to difficulties (DaMota 2012; Wagner 2013);
-
weight charts that are based on formula‐fed infants or cultural beliefs about infant growth may imply that breastfeeding infants are underweight and additional fluids or foods are given in the belief they will result in higher weight gain that is thought to be beneficial (Sachs 2006; Vail 2015);
-
additional fluids are given in a belief that they will prevent dehydration, hypoglycaemia and neonatal jaundice (Akuse 2002; Nicoll 1982; Stewart 2015);
-
early introduction of allergenic foods in the belief this may reduce the incidence of later food allergy (Perkin 2016);
-
early maternal return to employment and lack of facilities in the workplace to breastfeed (Gielen 1991; Ladomenou 2007), and mothers perceive disapproval from society of breastfeeding outside her home (Bai 2009);
-
marketing of formula that suggests mother's milk is insufficient (Chezem 1998; Yee 2007);
-
translation of research into practice, even with the provision of information and development of professional guidelines (ABM 2011), is sometimes met with barriers and delays (Brodribb 2008; Brodribb 2011).
Additional foods or fluids may be needed for medical reasons in specific situations related to the infant or mother. This review deals with the healthy, term infant and does not address individual needs or treatment in medical conditions. This review does not examine the use of oral sucrose solution for pain management in infants, oral probiotics, or interventions that provide promotion, education or support for increasing exclusive breastfeeding prevalence or duration.
How the intervention might work
Effects of early additional foods or fluids
It is difficult to obtain robust evidence about the effect of early additional foods and fluids (supplementation) on full‐term, healthy, babies due in part to problems in the consistency of breastfeeding definitions (Labbok 2012), and of normal early neonatal weight change (Thulier 2016), poor research design (McNiel 2010; Renfrew 2007), publication bias (Boyle 2016), changes in composition of artificial milks over time,and the belief that supplementation is a routine acceptable practice, not an intervention, and thus does not need to be noted (Martin‐Calama 1997; Mulford 1995). Early additional foods and fluids or exclusive breastfeeding may potentially affect the duration of breastfeeding, the infant immune system, infant morbidity and mortality, maternal infant bonding, as well as infant growth and development, length of postnatal hospital stay, physiological jaundice, maternal self‐confidence and confidence in breastfeeding of those who influence the mother. Healthcare economics, family poverty, environmental burden and human development potential are also affected by the value put on exclusive breastfeeding (Rollins 2016).
Effect on duration of breastfeeding
Observational studies and surveys have found associations between early additional foods and fluids and shorter duration of breastfeeding (Blomquist 1994; Chantry 2014; Giovannini 2005; Hornell 2001; Kurinij 1991). The effect of early additional foods and fluids on reducing breastfeeding duration may include decreased milk production due to reduced removal of milk from the breast; difficulties in developing effective breastfeeding skills when the newborn infant is also feeding from a bottle and artificial teat which may result in low infant weight gain; or maternal sore nipples and breasts; all of which may result in early cessation of breastfeeding, as well as reduced maternal confidence in the ability to successfully breastfeed and the reinforcement of a negative belief that human milk is insufficient for an infant. Qualitative studies in the UK (Cloherty 2004; Furber 2006) have indicated that, despite their awareness of policies supporting exclusive breastfeeding, some midwives think that providing an occasional formula supplement in hospital may give the mother an opportunity to rest and be more likely to continue to breastfeed, thus an aid to longer duration.
Effect on infant morbidity and mortality
As mentioned earlier, infant mortality and morbidity may be affected by the addition of other fluids or foods to the infant in the first six months. The effect of early additional foods and fluids on infant morbidity and mortality may be related to a single factor or a combination of factors, including incorrectly prepared early additional foods and fluids, contamination of the fluid or food or the device used to give it (Horman 2010; Renfrew 2008; WHO 2007); receiving a reduced amount of the anti‐infective nutrients in human milk (Ballard 2013); the effect of the non‐human milk on the infant's developing immune and digestive systems; or other reasons (Turin 2014). Longer‐term indications of morbidity related to immune reactions may include eczema and other skin conditions, asthma and digestive‐related conditions (Horta 2013a; Ip 2007). Short‐term indications of possible morbidity include hypo‐ or hyperthermia, hypo‐ or hyperglycaemia, diarrhoea, respiratory symptoms and otitis media (Horta 2013b; Kramer 2012; Victora 2016). An increased or reduced temperature may indicate an infection or other immune reaction. Normal temperature range is considered 36 to 38 degrees Celsius (97 to 100.4 degrees Fahrenheit). The advent of cot‐side testing of blood glucose in the early 1970s led to attempts to define a level of asymptomatic hypoglycaemia that could be classified as a risk level, in the belief that treating at this level would reduce the risk of symptomatic hypoglycaemia occurring (Williams/WHO 1997). These older studies and textbooks were likely to use formula‐fed infants as the norm and consider the values found in healthy breastfeeding infants as low. Transient hypoglycaemia is now understood as a normal adaptive response to the establishment of ex‐utero feeding (ABM 2014), though extended hypoglycaemia may be an indication of illness. There is no agreed definition of hypoglycaemia as the value varies with the infant's maturity, pathology, clinical signs and method of testing. A suggested range of values considered as hypoglycaemia are between 30 and 50 mg/dL (1.7 to 2.8 mmol/L) (Wright 2006); however, older studies may use different values. Feeding healthy infants cow's milk formula in an attempt to raise their blood glucose levels to an unphysiological high level introduces non‐human milk proteins, which may result in immunological reactions, possible bacterial contaminants and reduce the appetite of the infant to feed at the breast. Glucose water has additional risks from providing fewer calories than a similar volume of milk, thus filling the infant's stomach while providing insufficient nutrients. This increases the risks of hypoglycaemia and poor weight gain. There is no evidence that high blood glucose levels are of benefit to the infant, and high levels may affect the metabolic response, with later effects on risks of obesity and diabetes. Diarrhoea may indicate an infection or an intolerance to foreign proteins or carbohydrates in non‐milk feeds. As normal stools of a breastfeeding infant are much looser than the stools of a cow's milk formula‐fed infant this makes the definition of diarrhoea open to interpretation. Breastfeeding provides for optimal immune system functioning and thus the level of respiratory infections and otitis media occurrences can indicate if there is an effect on the immune system.
Effect on physiological jaundice
Babies are born with fetal red blood cells which are no longer needed and must be metabolised and excreted. Bilirubin is a product of this breakdown, released in the blood stream and ultimately excreted in the baby's stool. A newborn’s serum bilirubin level normally rises from birth until the third or fourth day postpartum and a significant proportion will have total serum bilirubin concentrations greater than 5.0 mg/dL (86 umol/L) while remaining healthy. This is termed physiological jaundice (ABM 2009). Ineffective feeding and thus reduced calorie intake can increase bilirubin levels (De Carvalho 1981; Yamauchi 1990). The normal initial fluid loss in newborn infants and situations of ineffective feeding leading to dehydration may lead to a belief that fluid supplements will prevent dehydration and jaundice, though the replacement of milk with water will further reduce the infant's calorie intake and has not been shown to reduce bilirubin levels (De Carvalho 1981; Houston 1984; Nicoll 1982). The replacement of breastfeeding with formula has been tested as a treatment to reduce high levels of serum bilirubin (Amato 1985; Osborn 1985), which may have led some health workers to use supplements to prevent high levels of bilirubin occurring (Akuse 2002).
Effect on infant growth and development
Weight loss in the newborn represents mainly fluid loss but may also involve loss of fat stores during the establishment of feeding (Wright 2004). A breastfeeding baby will commonly lose up to 5% to 7% in the first few days with no adverse effects (Thulier 2016). There may be a fear that the baby will become dehydrated until breastfeeding is established, and such babies are supplemented with water, glucose or artificial milk. Water, and glucose in particular, have no or little calorific value and may cause a baby to be full but remain deficient in calorific intake. Supplementation in such instances, as well as interfering with breastfeeding, will in fact contribute to further weight loss in the early postpartum period (Glover 1990). Evidence from studies in tropical climates demonstrate that breastfeeding babies will not become dehydrated if allowed to fully breastfeed on demand (Almroth 1990).
The WHO published comprehensive infant growth charts developed from data on breastfeeding infants (De Onis 2004). This long‐term multi‐centre study indicated that previous charts were likely to have categorised healthy breastfeeding infants as underweight, which may have contributed to the addition of foods and fluids before six months of age. Additional foods and fluids above the nutritional needs of the infant may result in the infant becoming overweight. Early introduction of complementary foods to breastfeeding infants is likely to result in less breast milk consumed, which may affect nutritional and immune status (Heinig 1993).
Confidence in breastfeeding
Antenatal or early postnatal breastfeeding self‐efficacy of the mother is associated with more exclusive breastfeeding and longer duration of breastfeeding (Blyth 2004; Noel‐Weiss 2006). If the mother or family members, health workers or others with influence on the mother have low confidence in the ability to breastfeed or the adequacy of mother's milk, this may lead to artificial formula supplementation and maternal feelings of failure (Hoddinott 1999; Wagner 2013). For the older infant, the decision to add formula or complementary foods may affect the duration of breastfeeding. Hornell suggests that formula given by bottle, because the mother perceived that she did not have sufficient milk, may reduce the duration of breastfeeding more so than complementary foods that are added because the mother thought the infant had reached an appropriate age (Hornell 2001).
Why it is important to do this review
Despite many years of widespread recommendations to support exclusive breastfeeding for four and more recently six months, common practice does not appear to reflect these recommendations suggesting there are perceived benefits from early additional fluids or foods. Given the potential risks from additional fluids or foods, this review aims to summarise the existing evidence on the effects of early additional food and fluids for breastfeeding full‐term infants.
Objectives
The main objective of the review was to assess the benefits and harms of additional foods and fluids for full‐term healthy breastfeeding infants. We also aimed to determine what impact the timing (during early phase of initiation of breastfeeding versus later on for maintenance) and type (water, artificial milk, foods) of additional foods and fluids had on these infants.
Methods
Criteria for considering studies for this review
Types of studies
Randomised or quasi‐randomised controlled trials (RCTs).
Types of participants
Full‐term (that is 37 to 42 completed weeks' gestation (singleton or multiple births)) breastfeeding infants up to the age of six months (the currently recommended age after which complementary foods should commence), or the mothers of these infants.
Types of interventions
Breastfeeding with any additional food or fluids (once or more) in the first six months versus exclusive breastfeeding (as defined in the trial).
Types of outcome measures
Primary outcomes
-
Duration of breastfeeding
-
Incidence of infant morbidity, for example, hypo‐ or hyperthermia, hypo‐ or hyperglycaemia, gastro‐intestinal infection, ear infection, asthma, eczema or other allergy (depending on how defined in individual trials)
-
Infant mortality (at discharge, 28 days, or one year)
-
Physiological jaundice, absence or presence, and if present, duration (days) (as defined in the Background)
Secondary outcomes
-
Measures of weight, growth and development (as defined by trial authors)
-
Duration of hospital stay (days)
-
Confidence in breastfeeding, for example of mothers, fathers, health workers or others with significant influence on the feeding of the infant (however assessed in individual trials)
-
Maximum serum bilirubin levels
-
Phototherapy in hospital or home setting if required, absence or presence, and if present, duration (days)
Search methods for identification of studies
The following methods section of this review is based on a standard template used by Cochrane Pregnancy and Childbirth.
Electronic searches
We searched the Cochrane Pregnancy and Childbirth Group’s Trials Register by contacting their Information Specialist (1 March 2016).
The Register is a database containing over 22,000 reports of controlled trials in the field of pregnancy and childbirth. For full search methods used to populate the Pregnancy and Childbirth Group’s Trials Register including the detailed search strategies for CENTRAL, MEDLINE, Embase and CINAHL; the list of handsearched journals and conference proceedings, and the list of journals reviewed via the current awareness service, please follow this link to the editorial information about the Cochrane Pregnancy and Childbirth Group in theCochrane Library and select the ‘Specialized Register ’ section from the options on the left side of the screen.
Briefly, the Cochrane Pregnancy and Childbirth Group’s Trials Register is maintained by their Information Specialist and contains trials identified from:
-
monthly searches of the Cochrane Central Register of Controlled Trials (CENTRAL);
-
weekly searches of MEDLINE (Ovid);
-
weekly searches of Embase (Ovid);
-
monthly searches of CINAHL (EBSCO);
-
handsearches of 30 journals and the proceedings of major conferences;
-
weekly current awareness alerts for a further 44 journals plus monthly BioMed Central email alerts.
Search results are screened by two people and the full text of all relevant trial reports identified through the searching activities described above is reviewed. Based on the intervention described, each trial report is assigned a number that corresponds to a specific Pregnancy and Childbirth Group review topic (or topics), and is then added to the Register. The Information Specialist searches the Register for each review using this topic number rather than keywords. This results in a more specific search set which has been fully accounted for in the relevant review sections (Included studies; Excluded studies; Ongoing studies).
Searching other resources
We examined reference lists of all relevant retrieved papers to identify further studies.
We did not apply any language, geographic or date restrictions. For non‐English articles, we reviewed the abstract and if RCT and the intervention or outcome was mentioned in the abstract we arranged further translation.
Data collection and analysis
For methods used in the previous versions of this review, seeBecker 2011 and Becker 2014.
For this update, the following methods were used for assessing the reports that were identified as a result of the updated search.
The following methods section of this review is based on a standard template used by the Cochrane Pregnancy and Childbirth Group.
Selection of studies
Both review authors independently applied the inclusion criteria to all potential trials. We performed this without blinding. Two trials were discussed with a member of the Cochrane Pregnancy and Childbirth Group editorial office to assist in reaching agreement.
Data extraction and management
Both review authors independently extracted the data (using a customised data extraction form) and assessed the risk of bias of the selected trials. We resolved any disagreements through discussion. Both authors entered data into Review Manager software (RevMan 2014).
Assessment of risk of bias in included studies
Both review authors assessed each trial using a simple form and followed the domain‐based evaluation as described in the Cochrane Handbook for Systematic Reviews of Interventions (Higgins 2011).
We also reported on whether the investigators had performed a sample‐size calculation.
We compared assessments and resolved any inconsistencies by discussion.
(1) Random sequence generation (checking for possible selection bias)
We described for each included study the method used to generate the allocation sequence in sufficient detail to allow an assessment of whether it should produce comparable groups.
We assessed the method as:
-
low risk of bias (any truly random process, e.g. random number table; computer random number generator);
-
high risk of bias (any non‐random process, e.g. odd or even date of birth; hospital or clinic record number);
-
unclear risk of bias.
(2) Allocation concealment (checking for possible selection bias)
We described for each included study the method used to conceal allocation to interventions prior to assignment and assessed whether intervention allocation could have been foreseen in advance of, or during recruitment, or changed after assignment.
We assessed the methods as:
-
low risk of bias (e.g. telephone or central randomisation; consecutively numbered sealed opaque envelopes);
-
high risk of bias (open random allocation; unsealed or non‐opaque envelopes, alternation; date of birth);
-
unclear risk of bias.
(3.1) Blinding of participants and personnel (checking for possible performance bias)
Given the nature of the interventions, blinding was generally not possible for participants and caregivers and so this was graded as an unclear risk of bias in this review.
(3.2) Blinding of outcome assessment (checking for possible detection bias)
We described for each included study the methods used, if any, to blind outcome assessors from knowledge of which intervention a participant received. We assessed blinding separately for different outcomes or classes of outcomes.
We assessed the methods used to blind outcome assessment as:
-
low, high or unclear risk of bias.
(4) Incomplete outcome data (checking for possible attrition bias due to the amount, nature and handling of incomplete outcome data)
We described for each included study, and for each outcome or class of outcomes, the completeness of data including attrition and exclusions from the analysis. We stated whether attrition and exclusions were reported and the numbers included in the analysis at each stage (compared with the total randomised participants), reasons for attrition or exclusion where reported, and whether missing data were balanced across groups or were related to outcomes. Where sufficient information was reported, or could be supplied by the trial authors, we planned to re‐include missing data in the analyses which we undertook.
We assessed methods as:
-
low risk of bias (e.g. no missing outcome data; missing outcome data balanced across groups);
-
high risk of bias (e.g. numbers or reasons for missing data imbalanced across groups; ‘as treated’ analysis done with substantial departure of intervention received from that assigned at randomisation);
-
unclear risk of bias.
(5) Selective reporting (checking for reporting bias)
We described for each included study how we investigated the possibility of selective outcome reporting bias and what we found.
We assessed the methods as:
-
low risk of bias (where it was clear that all of the study’s pre‐specified outcomes and all expected outcomes of interest to the review were reported);
-
high risk of bias (where not all the study’s pre‐specified outcomes were reported; one or more reported primary outcomes were not pre‐specified; outcomes of interest were reported incompletely and so could not be used; study fails to include results of a key outcome that would have been expected to have been reported);
-
unclear risk of bias.
(6) Other bias (checking for bias due to problems not covered by (1) to (5) above)
We described for each included study any important concerns we had about other possible sources of bias.
(7) Overall risk of bias
We made explicit judgements about whether studies were at high risk of bias, according to the criteria given in the Handbook (Higgins 2011). With reference to (1) to (6) above, we planned to assess the likely magnitude and direction of the bias and whether we considered it is likely to impact on the findings. In future updates, we will explore the impact of the level of bias through undertaking sensitivity analyses ‐ seeSensitivity analysis.
Assessment of the quality of the evidence using the GRADE approach
For this update, the quality of the evidence was assessed using the GRADE approach as outlined in the GRADE handbook. We produced separate GRADE 'Summary of findings' tables summarising evidence for our three comparisons of: 1. non‐exclusive breastfeeding (with artificial milk) versus exclusive breastfeeding; 2. non‐exclusive breastfeeding (with water or glucose water) versus exclusive breastfeeding; and 3. non‐exclusive breastfeeding (with additional foods) versus exclusive breastfeeding. Due to few trials with limited outcome data for the primary and secondary outcomes specified in this review, our 'Summary of findings' tables report different outcomes for different comparisons. We have not downgraded any evidence for lack of blinding (performance bias) and assessed the quality of the body of evidence relating to the following outcomes listed below:
-
duration of breastfeeding (at different time points);
-
infant morbidity (including: allergy related, hypoglycaemia, fever);
-
weight change (at different time points);
-
confidence in breastfeeding (maternal or of those influencing the mother).
We used the GRADEpro Guideline Development Tool to import data from Review Manager 5.3 (RevMan 2014) in order to create 'Summary of findings’ tables. A summary of the intervention effect and a measure of quality for each of the above outcomes were produced using the GRADE approach. The GRADE approach uses five considerations (study limitations, consistency of effect, imprecision, indirectness and publication bias) to assess the quality of the body of evidence for each outcome. The evidence can be downgraded from 'high quality' by one level for serious (or by two levels for very serious) limitations, depending on assessments for risk of bias, indirectness of evidence, serious inconsistency, imprecision of effect estimates or potential publication bias.
Measures of treatment effect
Dichotomous data
For dichotomous data, we present results as summary risk ratio (RR) with 95% confidence intervals, where appropriate.
Continuous data
For continuous outcomes, we recorded either the mean relative change from baseline for each group or mean post‐treatment or post‐intervention values and standard deviation. When standard errors were reported we converted these to standard deviations (as with Nicoll 1982). We calculated a pooled estimate of treatment effect by calculating the mean difference (MD).
Unit of analysis issues
The protocol for this review does not include cross‐over trials or cluster‐randomised trials. For studies that had multi‐intervention arms, we first assessed which groups were relevant to this review and the appropriate method of analysis. If groups were similar, e.g. water and glucose water, then we combined the groups. If we found that more than two comparison groups were applicable, then we entered data as a single pair‐wise comparison into RevMan 2014. In instances in which there were more than two groups to be compared, we took measures to avoid double counting or inappropriate totaling.
Dealing with missing data
We planned to enter the data on the number of participants by allocated treated group, irrespective of compliance and whether or not the participant was later thought to be ineligible or otherwise excluded from treatment or follow‐up in order to allow an intention‐to‐treat analysis. However, this was not always possible, as for example, within some included trials, mothers who ceased to comply during the trial were excluded from the analysis (these trial authors did not provide outcome data on the full allocated group).
Assessment of heterogeneity
In future updates, when a sufficient number of trials are included in a meta‐analysis, we plan to assess statistical heterogeneity in each meta‐analysis using the Tau², I² and Chi² statistics. We will regard heterogeneity as substantial if an I² is greater than 30% and either a Tau² is greater than zero, or there is a low P value (less than 0.10) in the Chi² test for heterogeneity.
Assessment of reporting biases
In future updates of this review, if there are 10 or more studies in a meta‐analysis, we will investigate reporting biases (such as publication bias) using funnel plots. We will assess funnel plot asymmetry visually. If asymmetry is suggested by a visual assessment, we will perform exploratory analyses to investigate it.
Data synthesis
We carried out statistical analysis using the Review Manager software (RevMan 2014). We used fixed‐effect meta‐analysis for combining data where it was reasonable to assume that studies were estimating the same underlying treatment effect: i.e. where trials were examining the same intervention, and we judged the trials’ populations and methods to be sufficiently similar. In future updates, if there is clinical heterogeneity sufficient to expect that the underlying treatment effects differ between trials, or if we detect substantial statistical heterogeneity, we will use random‐effects meta‐analysis to produce an overall summary, if an average treatment effect across trials is considered clinically meaningful. We will treat the random‐effects summary as the average of the range of possible treatment effects and we will discuss the clinical implications of treatment effects differing between trials. If the average treatment effect is not clinically meaningful, we will not combine trials.
Where multiple time points have been reported within the included trial reports we have clearly reported when measurements were taken by the primary investigators during the trial, what measurements were reported within the published paper and what data we are reporting in the review.
Subgroup analysis and investigation of heterogeneity
When more data are included in the review, if we identify substantial heterogeneity, we will investigate it using subgroup analyses and sensitivity analyses.
In future updates of this review we plan to carry out the following subgroup analysis:
-
timing of supplementation: given at early phase of initiation of breastfeeding (neonatal period ‐ up to and including the first four weeks of life) compared with later on; for maintenance (after neonatal period) ‐ (relating to primary outcomes (1), (2) and (3);
-
type of supplementation: water/ formula/glucose/food compared with each other ‐ (relating to primary outcomes (1), (2) and (3);
-
geographical location: trials conducted in disadvantaged populations versus trials in advantaged populations ‐ (relating to primary outcomes (2) and (3)).
We will assess subgroup differences by interaction tests available within RevMan (RevMan 2014). We will report the results of subgroup analyses quoting the Chi² statistic and P value, and the interaction test I² value.
Sensitivity analysis
When sufficient trials are included in the review, for primary outcomes only, we plan to perform a sensitivity analysis based on the risk of bias of the trials, including and excluding quasi‐randomised trials.
Results
Description of studies
Results of the search
See: Figure 1.
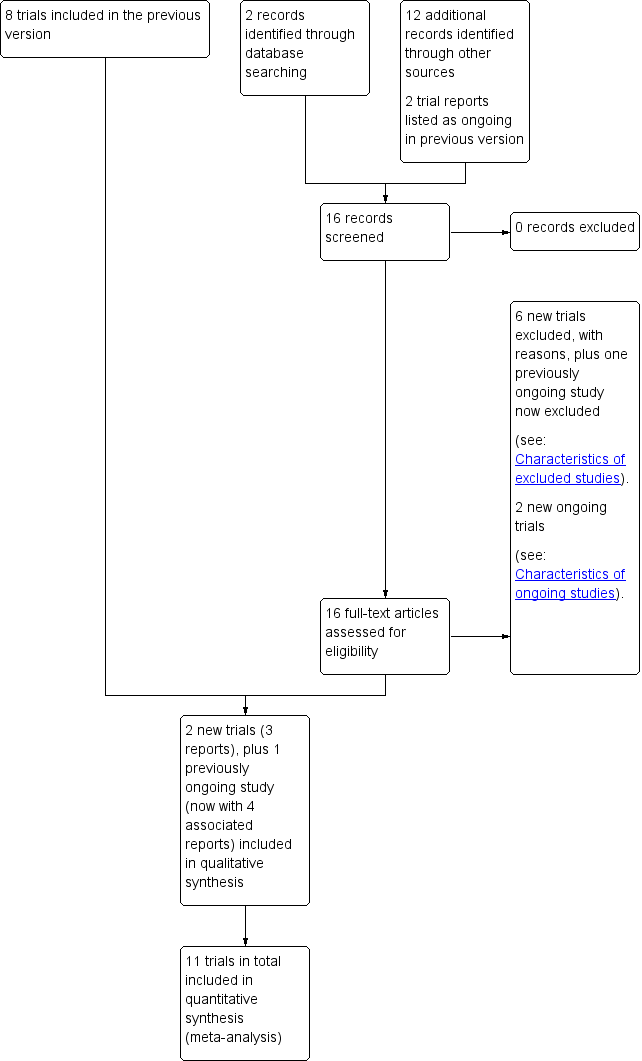
Study flow diagram.
An updated search in March 2016 retrieved 14 reports. We included two new trials (three reports) (Lindfors 1988; Straňák 2016). We also included another trial (four reports) previously listed as an ongoing study (Perkin 2016).
We identified two new ongoing trials (Flaherman 2014; Kair 2014).
We excluded six newly identified studies (Cameron 2015; de Jong 1998; Du Toit 2015; Juvonen 1996; Kimani‐Murage 2013; Saarinen 1999), plus one previously ongoing study (Flaherman 2011).
Included studies
This review now includes 11 trials, in which a total of 2542 breastfeeding infants or their mothers were randomised (seeCharacteristics of included studies table). Four of the trials have multiple references; the Cohen trial has been reported in five individual papers, the Dewey trial in four, and the Jonsdottir in five plus a PhD thesis, Perkin (EAT trial) has published three papers at time of this review (Cohen 1994; Dewey 1999; Jonsdottir 2012; Perkin 2016), and two papers for Lindfors 1988. For each of the remaining six trials there is one paper published on each (Flaherman 2013; Martin‐Calama 1997; Nicoll 1982; Ojofeitimi 1982; Schutzman 1986; Straňák 2016).
Setting
Two trials were carried out in San Pedro Sula, Honduras (Cohen 1994; Dewey 1999) (these were associated trials); one in each of Teruel, Spain (Martin‐Calama 1997); Ile‐Ife, Nigeria (Ojofeitimi 1982); Philadelphia, USA (Schutzman 1986); London, UK (Nicoll 1982); San Francisco, USA (Flaherman 2013); Danderyd, Sweden (Lindfors 1988); Czech Republic (Straňák 2016); one across seven centres in Iceland (Jonsdottir 2012), and one trial including children across England and Wales (Perkin 2016).
Interventions
Seven trials were carried out in the first few days after birth and compared exclusive breastfeeding versus additional water and/or glucose water in four trials (Martin‐Calama 1997; Nicoll 1982; Ojofeitimi 1982; Schutzman 1986), and the addition of formula in three trials (Flaherman 2013; Lindfors 1988; Straňák 2016). One two‐arm trial compared a 'glucose water' group (who received 5% glucose ad libitum from a bottle for the first three days of life in addition to breastfeeding), to a 'non‐glucose water' group (who did not receive any alternative fluid to human milk) (Martin‐Calama 1997). In a further two‐arm trial, one group received glucose water feedings and the other colostrum (Ojofeitimi 1982). Another two‐arm trial compared exclusive on‐demand breastfeeding versus on‐demand breastfeeding plus additional water where the choice of sterile water or 5% glucose water was left to the mother (Schutzman 1986). A three‐arm trial compared an additional water group versus a non‐supplement group versus a glucose supplement group (Nicoll 1982). One two‐armed trial compared formula use before commencing breastfeeding with exclusive breastfeeding from birth (Lindfors 1988), and two similar trials compared exclusive breastfeeding versus breastfeeding plus a specific amount of formula added at specific intervals (Flaherman 2013; Straňák 2016).
Four trials compared continued exclusive breastfeeding to six months versus complementary feeding plus breastfeeding from three to six months (Cohen 1994; Dewey 1999; Jonsdottir 2012; Perkin 2016). One three‐arm trial included an exclusive breastfeeding group versus a complementary foods group, with the introduction of complementary foods at 16 weeks, with ad libitum breastfeeding; or complementary foods and maintenance (SF‐M), with the introduction of complementary foods at 16 weeks with maintenance of pre‐intervention breastfeeding frequency (Cohen 1994). Two two‐armed trials compared a group of continued exclusive breastfeeding to six months versus complementary feeding ( plus breastfeeding from four to six months (Dewey 1999; Jonsdottir 2012). In the Dewey trial it was stated that mothers were encouraged to maintain baseline (16‐week) breastfeeding frequency (Dewey 1999). The EAT Study (Enquiring About Tolerance) examined whether the early introduction of specific foods from three months of age plus continued breastfeeding in previously exclusively breastfeeding infants would prevent food allergies compared to levels in infants who were exclusively breastfeeding for approximately six months (Perkin 2016).
Outcomes
Outcomes (unless otherwise indicated) were to be measured at hospital discharge, three months and six months. We stated in the protocol that if outcome data were recorded at other time periods, we would consider examining these as well. Therefore, we have presented data for these other time periods that were reported.
Both of the included three‐arm trials reported data for secondary outcomes 'weight change'; Nicoll also reported on 'maximum serum bilirubin levels' (Cohen 1994; Nicoll 1982). For each trial, we decided to combine the data for both of the supplemented interventions (water and glucose groups for the Nicoll trial; complementary foods and complementary foods with maintenance for the Cohen trial) into single intervention groups (supplemented group) to enable us to present these data within the analyses. In order to convert the sample sizes, means and standard deviations, we used the formulae as presented in the Handbook (Higgins 2011).
For the Martin‐Calama trial and the outcome 'duration of breastfeeding' we estimated from the graph the percentage of mothers breastfeeding at each time period (seeTable 1), and calculated the number of women breastfeeding at each time period from these estimates, which enabled us to enter data on this outcome into the analysis.
| % of mothers who continued either exclusive or partial breastfeeding | Exclusive breastfeeding on day 1‐3 group (non‐glucose water) (n = 87) | Glucose water on day 1‐3 (n = 83) |
| At 4 weeks | 93% | 77% |
| At 8 weeks | 81% | 64% |
| At 12 weeks | 75% | 51% |
| At 16 weeks | 67% | 43% |
| At 20 weeks | 57% | 40% |
These figures were estimated from a graph (Figure 2) on page 212 of the Martin‐Calama 1997 paper.
The primary outcome 'incidence of morbidity' was considered to include trial outcomes related to any allergic symptoms including symptoms of food protein intolerances, as well as hypoglycaemia, fever, upper respiratory illness, anaemia. The secondary outcome of 'weight change' was broadened in this update to include measures of weight, growth and development, and 'maternal confidence' was broadened to include confidence in breastfeeding of mothers, fathers, health workers or others with significant influence on the feeding of the infant.
The nine included trials which provided data for analysis (n = 2226) reported on one (Flaherman 2013; Lindfors 1988) or two of the four primary outcomes (Cohen 1994; Dewey 1999; Martin‐Calama 1997; Perkin 2016; Straňák 2016), and/or one (Flaherman 2013; Jonsdottir 2012) or two of the five secondary outcomes (Cohen 1994; Dewey 1999; Martin‐Calama 1997; Nicoll 1982).
Two of the included trials did not report any data that were eligible for inclusion in the review (Ojofeitimi 1982; Schutzman 1986). In the Ojofeitimi trial, bacterial counts in fluids (colostrum and glucose water) and stools were reported, but no actual data on morbidity were reported (Ojofeitimi 1982). The outcome in the Schutzman trial was "arrival of true milk" (Schutzman 1986). As it is over 20 years since these two studies were published, we concluded that it was not feasible to seek further data from the trial authors.
Excluded studies
We excluded 30 trials from the review (see the Characteristics of excluded studies table). We excluded 18 because, on closer inspection, we identified that there was no exclusively breastfeeding group (Bannert 1995; Corchia 1985; Cronenwett 1992; de Jong 1998; Du Toit 2015; French 2012; Gray‐Donald 1985; Juvonen 1996; Kearney 1990; Ly 2006; Rosegger 1985; Rosegger 1986; Sachdev 1991; Schiess 2010; Schmitz 1992; Schubiger 1997; Simondon 1996; Ziegler 2011). We excluded four trials that included only preterm infants (Collins 2004; Howard 2003; Marinelli 2001; Mosley 2001), two trials that compared regimens of the iron‐containing foods used (Krebs 2013; Olaya 2013), and one trial protocol that was to examine treatment of a condition (Flaherman 2011). We assessed two trials, which on closer inspection, we considered as not being randomised or quasi‐randomised (De Carvalho 1981; Saarinen 1999). Three trials related to effects of counselling in preventing the introduction of other foods or fluids before six months (de Oliveira 2012: Cameron 2015; Kimani‐Murage 2013).
Risk of bias in included studies
We assessed each trial for risk of bias as outlined in the Methods section. We have presented summary descriptions of the assessments on the risk of bias in Figure 2 and Figure 3, and provided details of the assessment for each trial in Characteristics of included studies.

Methodological quality graph: review authors' judgements about each methodological quality item presented as percentages across all included studies.

'Risk of bias' summary: review authors' judgements about each risk of bias item for each included study.
Allocation
We assessed sequence generation and concealment of allocation as low risk in three trials (Flaherman 2013; Jonsdottir 2012; Straňák 2016); high risk in three trials (Cohen 1994; Dewey 1999; Lindfors 1988); and of unclear risk in four trials (Martin‐Calama 1997; Nicoll 1982; Ojofeitimi 1982; Schutzman 1986). Perkin 2016 was assessed as low risk for sequence generation and unclear risk for concealment of allocation.
Blinding
Given the nature of the interventions blinding was not possible for participants and caregivers. As a result we graded all studies as having an unclear risk for performance bias. There was no information provided by six of the included trials with regards to whether outcome assessors were blinded or not (Cohen 1994; Dewey 1999; Martin‐Calama 1997; Nicoll 1982; Ojofeitimi 1982; Schutzman 1986). Therefore, we assessed these six trials as having an unclear risk of detection bias. For the Jonsdottir trial, while nurses who collected data on complementary food intakes and anthropometric outcomes were not blinded to participant group status, those who undertook all mass spectrometric analyses and isotopic modelling were blinded, therefore we considered this study as having a low risk of detection bias (Jonsdottir 2012). A blinded research assistant assessed outcome data for the Straňák and Flaherman trials, which we assessed as having a low risk (Flaherman 2013; Straňák 2016). Perkin 2016 replied to our query that the outcome assessors were not blinded however that outcome was based on strict set objectivity measures of allergic sensitivity, thus this was rated at low risk of detection bias.
Lindfors 1988 reported that all paediatricians who assessed for allergy symptoms when infants were 18 months old "were unaware of the feeding regimen" however they “scrutinized the history, and then filled in a detailed form concerning feeding” and this may have resulted in the group allocation being disclosed; therefore the study was graded as high risk.
Incomplete outcome data
Five studies clearly documented reasons for any incomplete outcome data and therefore, we assessed these as having a low risk of bias for this domain (Jonsdottir 2012; Lindfors 1988; Martin‐Calama 1997; Perkin 2016; Straňák 2016). Three of these trials ((Jonsdottir 2012; Martin‐Calama 1997; Straňák 2016) reported similar dropout rates between treatment groups. Lindfors reported numbers lost to follow‐up at each stage with low loss over five years and similar loss in both groups.
We assessed five trials as having an unclear risk of bias (Cohen 1994; Dewey 1999; Flaherman 2013; Nicoll 1982; Schutzman 1986). The published data from the Cohen and Dewey trials report analyses based on compliance with allocation, not intention‐to‐treat (Cohen 1994; Dewey 1999). For the Cohen trial, the dropout rate differed significantly between treatment groups, for the randomised controlled part of the Dewey trial, dropout rates between treatment groups were not balanced and there were significant differences in some patient characteristics, for this domain we therefore assessed these two trials as having an unclear risk of bias. A further trial reported that a high percentage of mother/baby pairs defaulted and were replaced by further randomised pairs in one of the three arms of the trial, we therefore also assessed this as having an unclear risk of bias (Nicoll 1982). No reference to dropouts was reported in Schutzman 1986, while in Flaherman 2013 information on missing data was not clearly reported.
In the Ojofeitimi trial, participation was voluntary, and those mothers who failed to adhere were excluded from the trial (42%); we therefore assessed this trial as having a high risk of bias for this domain (Ojofeitimi 1982).
Selective reporting
Seven studies reported data on all the outcomes mentioned in the 'Methods' section of their articles (Cohen 1994; Dewey 1999; Lindfors 1988; Martin‐Calama 1997;Nicoll 1982; Ojofeitimi 1982; Schutzman 1986), though not at all the time periods were mentioned. We did not retrieve any of the protocols or raw data of these trials and thus did not identify whether outcomes other than those reported within the papers were collected but not reported on. We have therefore assessed this domain as having an unclear risk of bias for these trials.
One study (Straňák 2016) measured and recorded clinical outcomes that were not pre‐determined as study outcomes in the registered protocol and we marked this study as having an unclear risk of bias.
The Flaherman and Jonsdottir trials were registered trials with protocols available (Flaherman 2013; Jonsdottir 2012). The protocol for the Flaherman trial referred to outcomes of weight nadir and maternal satisfaction, which are not referred to in the published trial report, and the introduction to the report refers to effect on infant weight, however only loss is reported, not any weight gain. The protocol for the Jonsdottir trial referred to secondary outcomes of upper respiratory infections and diarrhoeal episodes, although in one of the published references to this study (Wells 2012) it states "Finally, our study was designed to evaluate growth and energy intake and not other issues such as development of dietary preferences, mineral status, or effects on health such as diarrhoea and allergy". We therefore assessed these two trials as having a high risk of bias for this domain. For Perkin 2016 there was a protocol published, very extensive appendices on‐line with additional data and additional publications are planned to report further on outcomes, thus we assessed this study as low risk of reporting bias.
Other potential sources of bias
Two studies (Dewey 1999; Jonsdottir 2012) were assessed as being low risk for other sources of potential biases. Two studies were graded as having a unclear risk. In one trial, telephone follow‐up at five months was used to collect data on the exclusiveness and duration of breastfeeding during the previous 20 weeks, which could be a possible source of recall bias and lack of consensus to what is considered a risk level of low serum glucose in the first few days after birth (Martin‐Calama 1997); there was low adherence to the study protocol in the intervention group in the other study (Perkin 2016).
The remaining seven studies were all graded as high risk for other sources of potential biases. Flaherman 2013 and Straňák 2016 were graded as high risk due to their inclusion criteria of weight loss of ≥ 5% in the first few days after birth, though this is well within the range of normality. This may have influenced those involved to consider there was a problem with exclusive breastfeeding when there was not and result in overuse of formula supplementation. The publications from both studies reported no direction given as to how often to give the supplement beyond "after each breastfeed". Further communication with the Straňák team provided the information that the supplement was given on a three‐hourly schedule; feeding to a schedule could conflict with the protocol of feeding in response to baby signs (demand feeding) and this might limit the number of breastfeeds. With both studies, the supplement was given by oral syringe and the infant was not able to refuse the supplement if already content with the amount of breast milk consumed. Additional information also clarified that definitions used for exclusive breastfeeding at a time point related to the previous 24 hours only and thus giving a different result than if the definition used was the time since birth as per WHO definitions. In Flaherman 2013 at the start of the intervention, of those replying (15% did not reply), 47% of the formula supplementation group and 32% of the exclusive breastfeeding group had previously planned to use infant formula in addition to breastfeeding, which may have affected their motivation to comply with the allocation. Compliance with allocation is not reported. Other variables known to effect exclusive breastfeeding and weight change, such as birth practices, information and support, feeding in response to infant cues ("demand feeding") and skilled assistance, were not included. Though the effect on weight is an outcome of the Flaherman trial, the trial did not include a weighing protocol and relied on weights routinely collected, which varied as to what time points these were collected (additional information from trialist). Lindfors 1988 referred to infants being breastfeed “when the mother's breast milk production started” with no information if this meant colostrum or Lactogenesis II and if the infants in the breastfeeding group might have received water/glucose water if mother's milk was not expected to be present for a few days. There was a high number of outcome assessors working independently and diagnosis of allergy was based on clinical criteria with no laboratory testing at 18 months. For these reasons Lindfors 1988 was graded as high risk for other bias.
Most older studies (Cohen 1994; Lindfors 1988; Nicoll 1982; Ojofeitimi 1982; Schutzman 1986) did not demonstrate any evidence of undertaking a power calculation to determine their sample size and were rated as high risk for bias. Flaherman 2013 states: "The sample size was chosen as a pilot to demonstrate feasibility".
Effects of interventions
See: Summary of findings for the main comparison Non‐exclusive breastfeeding (artificial milk) versus exclusive breastfeeding; Summary of findings 2 Non‐exclusive breastfeeding (water or glucose water) versus exclusive breastfeeding; Summary of findings 3 Non‐exclusive breastfeeding (foods) versus exclusive breastfeeding
We included 11 trials (n = 2542 randomised infants or their mothers). The variation in use of outcome measures and time points in different trials made it difficult to pool results from trials. Nine trials (n = 2226) provided data on outcomes of interest to this review. Data could only be combined in a meta‐analysis for one primary outcome (breastfeeding duration) (Flaherman 2013; Straňák 2016) and one secondary outcome (weight change) for two studies (Cohen 1994; Dewey 1999). None of the included studies reported on physiological jaundice, absence or presence, and if present, duration (days) (as defined in the Background). Only one trial reported on infant mortality (Perkin 2016). The trials that provided outcome data compared exclusively breastfeeding infants with breastfeeding infants who were provided with additional artificial milk (Flaherman 2013; Lindfors 1988; Straňák 2016), glucose water/water (Martin‐Calama 1997; Nicoll 1982) or complementary foods (Cohen 1994; Dewey 1999; Jonsdottir 2012; Perkin 2016).
See summary of findings Table for the main comparison; summary of findings Table 2; summary of findings Table 3 for the quality of evidence for each of the three main comparisons.
Non‐exclusive breastfeeding infants (artificial milk) versus exclusive breastfeeding infant (comparison 1)
Primary outcomes
1. Duration of breastfeeding
This outcome was reported in two trials (139 pairs analysed) (Flaherman 2013; Straňák 2016).The Flaherman and Straňák trials used a similar protocol to compare non‐exclusively breastfeeding infants who were provided with artificial milk in the first few days after birth with exclusively breastfeeding infants. The intervention of additional artificial milk did not effect the number of infants with any breastfeeding at hospital discharge (risk ratio (RR) 1.02, 95% confidence interval (CI) 0.97 to 1.08; participants = 100; low‐quality evidence) and the intervention resulted in a marginally higher number with exclusive breastfeeding in the 24 hours prior to discharge (RR 1.11, 95% CI 1.00 to 1.24; participants = 100) Straňák 2016. The results from a similar intervention by Flaherman 2013 indicated the additional artificial milk intervention resulted in a marginally higher number with exclusive breastfeeding in the 24 hours prior to data collection at one week (RR 1.71, 95% CI 1.09 to 2.68; participants = 39). Both trials (Flaherman 2013; Straňák 2016) measured the method of feeding at three months which combined results indicated the group fed additional artificial milk in hospital were more likely to be exclusive breastfeeding in the previous 24 hours (RR 1.43, 95% CI 1.15 to 1.77; participants = 138), and more likely at three months to have any breastfeeding in the previous 24 hours (RR 1.21, 95% CI 1.05 to 1.41; participants = 137; low‐quality evidence) (Analysis 1.1).
Adherence to protocol was low among the exclusive breastfeeding group. Flaherman 2013 reported that during the first week after birth, newborn infants assigned to additional artificial milk intervention received 116 + 110 mL artificial milk, and controls (exclusive breastfeeding) received 262 + 411 mL; intervention period began at 24 to 48 hours until 72 to 106 hours of age. Straňák 2016 reported that “Only 11 out of 50 (22%) infants in the control group were exclusively breastfeeding during hospitalisation”; the total control group (exclusively breastfeeding) received 475 mL of artificial milk feeds and the study group received 400 mL of artificial milk additional feeds.
2. Incidence of infant morbidity
Flaherman 2013 and Lindfors 1988 examined the effect of non‐exclusive breastfeeding with artificial milk to exclusive breastfeeding in the first few days after birth on the incidence of fever (Analysis 1.3) and allergy symptoms (Analysis 1.2), respectively.
The use of additional artificial milk had no effect on the incidence of fever (RR 1.06, 95% CI 0.83 to 1.36; participants = 28), but did show a protective effect against "obvious or probable symptoms" of allergy at 18 months of age (RR 0.56, 95% 0.35 to 0.91; participants = 207; very low‐quality evidence) compared to exclusive breastfeeding. It should be noted that the trialists reported that no diagnostic challenges or other tests were performed to confirm the allergy symptoms (Lindfors 1988).
Secondary outcomes
1. Confidence in breastfeeding
The intervention of supplementation with artificial milk in the first few days after birth showed no difference in maternal confidence measured by a modified breastfeeding self‐efficacy score at week one (mean difference (MD) 0.10, 95% CI ‐0.34 to 0.54; participants = 39; low‐quality evidence) (Flaherman 2013) (Analysis 1.4). The modified breastfeeding self‐efficacy score consists of Items rated on a scale from 1 (“Strongly Disagree”) to 5 (“Strongly Agree”), with higher scores associated with increased breastfeeding self‐efficacy.
2. Phototherapy in hospital or home setting if required, absence or presence, and if present, duration (days)
The intervention of additional artificial milk in the first few days after birth did not show an effect on the incidence of requiring phototherapy; one incidence of phototherapy in the control group was reported as lasting 48 hours and none reported in the intervention group (RR 0.33, 95% CI 0.01 to 7.99; participants = 100) (Straňák 2016) (Analysis 1.5).
The following secondary outcomes were not reported in the trials: measures of weight, growth and development, duration of hospital stay and maximum serum bilirubin levels.
Non‐exclusive breastfeeding (water or glucose water) versus exclusive breastfeeding infants (comparison 2)
Primary outcomes
1. Duration of breastfeeding
Martin‐Calama 1997 (n = 170) compared breastfeeding infants who were provided with additional glucose water versus exclusively breastfeeding infants. Breastfeeding duration was evaluated at four, eight, 12, 16 and 20 weeks (and presented as a graph). We have estimated from the graph the percentage of mothers breastfeeding at each time period (see Table 1) and calculated the number breastfeeding at each time period from these estimates. The additional glucose water did not improve the number of infants breastfeeding. The likelihood of infants continuing to breastfeed was lower in the non‐exclusive breastfeeding (additional glucose water) group across all five time periods (participants = 170): at four weeks (RR 0.83, 95% CI 0.73 to 0.94); at eight weeks (RR 0.79, 95% CI 0.65 to 0.96); at 12 weeks (RR 0.68, 95% CI 0.53 to 0.87; low‐quality evidence); at 16 weeks (RR 0.65, 95% CI 0.49 to 0.87); and at 20 weeks (RR 0.69, 95% CI 0.50 to 0.95) (Analysis 2.1). We do note that the trial authors report that this difference had disappeared at the end of 20 weeks, which is not the case in our analysis.
2. Incidence of infant morbidity
Hypothermia or hyperthermia
The addition of glucose water to breastfeeding babies did not show any clinically significant difference in infants' mean maximum temperature and mean minimum rectal temperatures measured at 72 hours of age by Martin‐Calama 1997 (170 infants analysed); mean difference in the maximum temperature (degrees Celcius) (MD ‐0.10, 95% CI ‐0.19 to ‐0.01) and minimum temperature (MD ‐0.10, 95% CI ‐0.18 to ‐0.02), respectively (Analysis 2.2; Analysis 2.3). The trial author states that three infants (1%, all in the exclusively breastfeeding group) had a temperature exceeding 38 degrees C (the level generally accepted as fever) and does not report any occurrences of hypothermia of clinical concern.
Hypoglycaemia or hyperglycaemia
The addition of glucose water resulted in a lower number of episodes of hypoglycaemia in the glucose water group compared to the exclusive breastfeeding group. The difference was originally lower at 12 hours (RR 0.07, 95% CI 0.00 to 1.20; participants = 170; very low‐quality evidence) with no significant difference reported at six hours (RR 0.42, 95% CI 0.08 to 2.10; participants = 170), at 24 hours (RR 1.57, 95% CI 0.27 to 9.17; participants = 170; very low‐quality evidence), or at 48 hours (RR 0.35, 95% CI 0.04 to 3.29; participants = 170) Martin‐Calama 1997 (Analysis 2.4). Trialists used a cut‐off point as serum glucose less than 2.2 mmol/L and they point out that there is no consensus on the risk level and some researchers define a lower cut‐off level (1.7 mmol/L). Overall, the number of episodes was low and trialists report there was no case of serum glucose levels under 1.7 mmol/L in either of the two groups and no cases presented hypoglycaemic symptoms.
The addition of glucose water to healthy full‐term breastfeeding infants marginally increased the mean serum (capillary) glucose level (mmol/L) in the glucose water group compared to the exclusive breastfeeding group, measured at six hours after birth (MD 0.29, 95% CI 0.02 to 0.56; participants = 170), 12 hours (MD 0.47, 95% CI 0.24 to 0.70) and 24 hours (MD 0.34, 95% CI 0.08 to 0.60) though the difference was no longer evident at 48 hours (MD 0.24, 95% CI ‐0.03 to 0.51) Martin‐Calama 1997 (Analysis 2.5).
Secondary outcomes
1. Measures of weight, growth and development
It is common for infants to lose some weight in the first 48 hours after birth as excess fluid is shed. The addition of glucose water to breastfeeding babies showed a reduced weight loss (grams (g)) in the intervention group compared to exclusively breastfeeding babies, measured at six hours (MD ‐7.00 g, 95% CI ‐13.24 to ‐0.76; participants = 170); 12 hours (MD ‐11.50 g, 95% CI ‐21.29 to ‐1.71; participants = 170); 24 hours (MD ‐13.40 g, 95% CI ‐26.37 to ‐0.43; participants = 170); and at 48 hours (MD ‐32.50 g, 95% CI ‐52.09 to ‐12.91; participants = 170; low‐quality evidence), respectively. However, at 72 hours, there was no significant difference between the groups in infant weight loss (MD 3.00 g, 95% CI ‐20.83 to 26.83; participants = 170; very low‐quality evidence) (Analysis 2.6). The trialists report that "weight loss did not exceed 7% in either group" (Martin‐Calama 1997).
The percentage weight loss was reported on day three and five for each of the three groups. The authors state that the percentage weight loss on day three was significantly lower in the additional glucose water group compared to the exclusive breastfeeding group and the water supplemented group (presumed by trial authors to be due to marginally greater hydration), the authors also state that this difference was not apparent by day five. When we analysed the data from the glucose water and the water groups as one intervention arm, and compared this to the exclusive breastfeeding group, we found no significant difference in weight loss between the combined supplemented group and the exclusive breastfeeding group on either day three or day five (MD ‐1.03%, 95% CI ‐2.24 to 0.18; participants = 47; very low‐quality evidence) and (MD ‐0.20%, 95% CI ‐0.86 to 0.46; very low‐quality evidence), respectively (Nicoll 1982) (Analysis 2.7).
2. Maximum serum bilirubin levels
One three‐arm trial (Nicoll 1982) compared additional water or additional glucose water with exclusive breastfeeding in the first few days after birth and we have presented data for the additional fluids groups combined. The mean plasma bilirubin levels on day six (µmol/L) was higher in the additional water and the glucose water groups combined compared to the exclusively breastfeeding group (MD 18.84, 95% CI ‐1.35 to 39.03; participants = 47) (Analysis 2.8). A table in the published trial report shows the plasma bilirubin levels across the three groups as mean (SE) additional water 93.5 µmol/L (13.8), glucose water 80.8(8.8), and exclusive breastfeeding 67.7(6.7), all well within the clinical low‐risk zone that extends to 222 µmol/L at 144 hours (six days) (American Academy of Pediatrics).
The following secondary outcomes were not reported in the trials: duration of hospital stay, confidence in breastfeeding and phototherapy in hospital or home setting.
Non‐exclusive breastfeeding infants (foods) versus exclusive breastfeeding infants (comparison 3)
Primary outcomes
1. Duration of breastfeeding
Among these older infants, Perkin 2016 (participants = 1162) reports in their published appendix that the median duration of any breastfeeding was similar in both groups, 50.2 weeks in the standard group (exclusive breastfeeding) and 49 weeks in the early introduction of potential allergenic foods intervention group.
Jonsdottir 2012 (participants = 100) retrospectively collected information on total duration of breastfeeding for all infants. However, we are unable to present these data as they were combined with data from an additional cohort of infants from a separate national prospective study.
2. Incidence of infant morbidity
Fever
The addition of complementary foods to infants at four months versus six months showed no evidence of difference in the reported prevalence (percentage of days) of fever in infants aged from 16 to 26 weeks (MD ‐0.70 day, 95% CI ‐3.40 to 2.00; participants = 119; low‐quality evidence) (Dewey 1999) (Analysis 3.1).
Upper respiratory illness
The prevalence (percentage of days) of cough, congestion, nasal discharge and hoarseness in breastfeeding infants receiving additional foods from four months versus exclusive breastfeeding to six months was reported from 16 to 26 weeks (Dewey 1999). There was no difference between groups in the percentage of days with cough (MD 3.10, 95% CI ‐4.52 to 10.72; participants = 119) (Analysis 3.2); with congestion (MD 3.60, 95% CI ‐3.41 to 10.61; participants = 119) (Analysis 3.3); with nasal discharge (MD 4.20, 95% CI ‐1.13 to 9.53; participants = 119) (Analysis 3.4); with hoarseness (MD 0.10, 95% CI ‐1.84 to 2.04; participants = 119) (Analysis 3.5).
In one trial, Cohen (participants = 141) reported narratively (no data provided) that upper respiratory illness was relatively uncommon; the prevalence was approximately 4% of days between 16 and 26 weeks. The trial authors reported that the additional food group had a lower prevalence of respiratory illness than the exclusively breastfeeding group which reflected a difference in coughs. When fever accompanied a respiratory illness (less than 1% of days), there was no difference in prevalence among groups (Cohen 1994).
Diarrhoea
Breastfeeding infants receiving additional foods from four months versus exclusive breastfeeding to six months was reported from 16 to 26 weeks, participants = 119 (Dewey 1999). The trial authors used a nonparametric test for non‐normally distributed data when analysing this outcome, therefore we have not entered it into the RevMan analysis. They report that the prevalence of diarrhoea (defined by the researchers as more than three liquid stools per day) was less common in the additional foods group (percentage of days, mean (SD), 2.8% (5.4%) versus 5.4% (8.5%) in the complementary food group). The report states: "The difference was marginally significant (1.4% +/‐ 3.0% in the additional foods group compared with 2.9% +/‐ 5.0% in the exclusive breastfeeding group) when diarrhoea was defined as more than five liquid stools per day. The difference in proportion of days with diarrhoea was due to a difference in the number of episodes (no data provided), not to the duration of episodes" (Dewey 1999).
Cohen (participants = 141 pairs) did not report any morbidity data but narratively reported that diarrhoea was relatively uncommon, with a prevalence of approximately 4% of days between 16 and 26 weeks and that morbidity from diarrhoeal disease was similar among groups (Cohen 1994).
Allergies
Early introduction of potentially allergenic foods was not found to reduce the risk of "food allergy" to one or more of these foods between one to three years of age compared to the group exclusively breastfeeding to about six months (RR 0.80, 95% CI 0.51 to 1.25; participants = 1162; moderate‐quality evidence) (Analysis 3.6). Nor was the early introduction of these foods found to reduce the risk of visible eczema at 12 months stratified by visible eczema at enrolment (at three months of age) (RR 0.86, 95% CI 0.51 to 1.44; participants = 284; moderate‐quality evidence) (Analysis 3.7). Food protein‐induced enterocolitis syndrome reactions were reported by families for 10 children and on food challenge, three children were reported with positive reactions, one in the early allergen foods and two in the control group (RR 2.00, 95% CI 0.18 to 22.04; participants = 1303; moderate‐quality evidence) (Analysis 3.8) (Perkin 2016) (Tables S6 and S9 in study appendix).
Anaemia
Jonsdottir measured iron deficiency anaemia (the criteria for iron‐deficiency anaemia (IDA) required that all three indicators met the following cut‐off points: haemoglobin (Hb), 105 g/L, mean cell volume (MCV), 74 fl, and complementary food (CF), 12 mg/L) (Jonsdottir 2012). Two infants had iron deficiency anaemia (one in the exclusive breastfeeding group, one in the early complementary foods group). No significant differences were reported between groups in iron deficiency with or without anaemia.
3. Infant mortality (at discharge, 28 days or one year)
One of the included studies reported on this outcome with no deaths occurring in either group (Perkin 2016).
Secondary outcomes
1. Measures of weight, growth and development
Breastfeeding infants receiving additional foods from four months showed no clinically meaningful difference in infant weight gain (g) from 16 to 26 weeks compared to exclusive breastfeeding to six months (MD ‐39.48 g, 95% CI ‐128.43 to 49.48; participants = 260; low‐quality evidence) (Analysis 3.9) (Cohen 1994; Dewey 1999), or using infant weights calculated as z scores (World Health Organization), (MD ‐0.01 SD, 95% CI ‐0.15 to 0.13; participants = 100; moderate‐quality evidence) (Jonsdottir 2012) (Analysis 3.10). Furthermore, Jonsdottir 2012 reported that the introduction of complementary foods at four months did not affect the prevalence of overweight children at 18 months (P = 0.74) or 29 to 38 months of age (P = 0.36).
2. Confidence in breastfeeding
As part of the larger study of mothers of low birthweight infants in Honduras (Dewey 1999), the mothers' reactions to attempting to breastfeed exclusively for four or six months and the obstacles they encountered were explored using interviews, focus groups and views of the field workers (Cohen 1999). The study authors narratively reported that at two weeks 87% of the mothers said that they were confident in their ability/desire to breastfeed exclusively, rising to 96% to 97% at eight to 12 weeks, with those who did not maintain exclusive breastfeeding being less confident. Confidence is not reported by the groups of exclusive breastfeeding to six months and additional foods from four months.
There may be a lack of confidence in exclusive breastfeeding for six months and later outcomes. A higher number of parents in the exclusive breastfeeding group expressed concerns about their child's development or behavioural status at 18 months (44% exclusive breastfeeding group versus 17% complementary foods group), though the difference was not significant when adjusted for baseline differences (P = 0.08); and at 30 to 35 months (19% exclusive breastfeeding group versus 2% complementary foods group), which remained significant after adjustment (P = 0.03), however no significant inter‐group differences in the children's developmental measures were found (Jonsdottir 2012).
The following secondary outcomes were not reported in the trials: duration of hospital stay,maximum serum bilirubin levels and phototherapy in hospital or home setting.
Discussion
This review now includes 11 trials in which a total of 2542 healthy breastfeeding infants or their mothers were randomised. There are two time periods in this review. Seven trials related to the first few days after birth and the intervention of additional water, glucose or artificial formula compared with exclusive breastfeeding, with two taking place in the USA and one in each of Spain, Nigeria, Sweden, the UK and the Czech Republic. Four trials focused on three‐ to six‐month‐old infants and the intervention of additional foods from three or four months compared with exclusive breastfeeding until six months, with two related trials carried out in Honduras, and one in each of Iceland and the UK, two in the USA, two in the UK and one in each of Spain, Nigeria, Sweden and the Czech Republic.
The trials were very variable in size and showed high heterogeneity, as would be expected due to differences among the trials' interventions and measures of outcomes. The trials extend over a long time span and practices considered normal care in the past, such as additional water in the first few days or additional foods before six months, have been shown not to be best practice. They are included in this review as these older practices still are seen in some places or these beliefs affect information given by those advising new mothers. Care needs to be taken with interpretation of studies where definitions of exclusive breastfeeding were unclear, varied within the trial report, and differed from WHO definitions. Except for the two trials related to allergy, trials were short term and this may mask effects of the interventions on later health.
The control group is healthy infants exclusively breastfeeding to six months of age.
Summary of main results
Additional artifical milk formula to breastfeeding babies in the first few days after birth
In two trials with a similar protocol, giving infants 10 mL of hydrolysed formula via feeding syringe according to a schedule after feeding at the breast in the first few days did not effect the number of infants with any breastfeeding at hospital discharge. although it did show a marginally higher number with exclusive breastfeeding in the 24 hours prior to discharge and in the 24 hours prior to data collection at one week and at three months. Some of the main quality concerns of these two trials include the apparent willingness of the women to be assigned to either exclusive breastfeeding or to supplement breastfeeding, which calls into question what information they had on the value of exclusive breastfeeding and potential increased risks of ill health associated with not exclusively breastfeeding; the use of 5% weight loss as a risk and the entry criteria for the trial, which is within the normal limits of neonatal weight loss; that the control group of exclusively breastfeeding infants were reported as receiving higher amounts of artifical milk during the trial period than the intervention group arising from maternal request and raises questions about what support was available for mothers to achieve exclusive breastfeeding; as well as varying definitions of exclusive breastfeeding. There was no difference in maternal perception of their breastfeeding self‐efficacy between the exclusive breastfeeding and the additional artificial formula groups when assessed at one week, which does not appear to support one trial investigators' statement that the intervention of scheduled supplementation would reduce maternal concerns. The intervention of additional artificial milk in the first few days after birth did not show an effect on the incidence of requiring phototherapy. In another study, the finding that cows' milk artificial formula in the first few days before commencing exclusive breastfeeding showed results that indicated these children were less likely to show "obvious or probable symptoms" of allergy (atopic eczema, wheezing, urticaria, gastrointestinal (GI) allergy or multiple allergies) at 18 months should be interpreted cautiously as artificial formula composition changes frequently and formula used in a trial in 1988 may differ considerably from those currently available. The intervention was only for two to three days immediately after birth and many other variables could affect later allergic signs, as well as the lack of diagnostic challenges or other tests performed to confirm that the reported signs of allergy were clinically confirmed.
Additional water or glucose water to breastfeeding babies in the first few days after birth
Trials giving additional water or glucose water to breastfeeding babies in the first few days after birth did not provide evidence that the practice was of benefit to the newborn infant as regards the incidence of fever (the difference of 0.1 degree is likely not to be at a clinically significant level) or effect the risk of bilirubin levels reaching a level needing clinical treatment. Newborn weight change showed, by day three, no significant differences between groups. As might be expected, serum glucose levels were marginally higher in the infants who received glucose supplements in the first 24 hours, though there was no significant difference at 48 hours and there was no evidence of beneficial difference shown in the number of episodes of hypoglycaemia in the first 48 hours. In interpreting the results, there may be the assumption that higher glucose levels are better and thus the exclusively breastfeeding infant is possibly at risk; similarly that higher weight gain is beneficial. However, it could be interpreted that non‐exclusively breastfeeding infants with higher glucose levels and weight gains are the infants at possible risk, particularly in relation to longer‐term health outcomes related to obesity and diabetes. One trial showed possible risk in that the additional fluids may contribute to a reduction in the duration of breastfeeding as well as highlighting the cost to the hospital involved in giving additional fluids to infants who will not benefit from these fluids. This trial highlighted concerns about the quantity of glucose water used, up to 70 mL/kg/day, when given based on the mother's or staff perception of the need for the supplement as giving large amounts of water/glucose water may displace nutrients that would be provided by milk resulting in increased weight loss/low weight increase.
Additional foods started at three to four months of age
Starting additional foods early did not show significant difference from the exclusively breastfeeding as regards weight gain; incidence of fever; upper respiratory symptoms of cough, congestion, nasal discharge or hoarseness; or iron deficiency with or without anaemia, during the trial period (up to six months of age). The percentage of days that infants 16 to 26 weeks old had diarrhoea (reported by mother and defined as more than three liquid stools/day) was higher in the exclusive breastfeeding than the additional foods groups in one trial though not in the other trial by the same group. The trialists highlight that the infants in the additional foods groups received commercially prepared jars of food and that the more normal situation of using home‐prepared foods from the local culture, with a potentially higher bacterial load, might have shown a higher prevalence of diarrhoea. The trialists also discuss how differences in definitions of diarrhoea may affect their conclusions. Breastfeeding infants normally have stools that are more frequent and softer than infants who are fed on cow's milk feeds or complementary foods. The definition of what is considered abnormal can affect the interpretation of the findings. Relying on maternal diagnosis of infant illness and maternal recall of any illness over the previous three weeks may result in recall bias.
In one trial, parents in the group exclusively breastfeeding for six months had significantly more concerns about their child's development or behavioural status at 18 months and at 30 to 35 months, despite developmental tests showing no differences between groups. Reasons for the parental concern are not discussed and mention is made by the trial investigator of low iron levels contributing to developmental delay, though neither iron deficiency anaemia or developmental delay was found among the children. Expressing this link in the research raises a question: are parents and health workers as well as researchers receiving information from commercial marketing that implies exclusively breastfeeding for six months could result in lack of iron and later developmental concerns?
A recent large trial included in this review examined the effect of early addition to breastfeeding infants of six potentially allergenic foods (from three months of age) on the incidence of food allergy, eczema and food protein enterocolitis syndrome, among many other outcomes. The results, analysed as intention‐to‐treat, showed no difference between the groups in the duration of any breastfeeding or for any of the allergy outcomes. Only 43% adhered to the complex intervention protocol and a per‐protocol analysis indicated the intervention reduced the incidence of allergy. Debate within the allergy research community is continuing including, if there are previous family experiences of allergy, do parents attribute minor behaviours of the infant to allergic reactions and avoid giving the foods, are some of the foods too difficult for immature oral‐motor skills, and how much can the protocol vary and still be effective (Wong 2016)?
Overall completeness and applicability of evidence
We applied standard Cochrane methods for our searches, examined references cited in trials, searched for additional publication by previously included trialists, and contacted authors of recent trials for further information and unpublished data to include. Both review authors are employed in areas related to this topic and likely to be aware of research so we are confident this review is a comprehensive representation of the existing body of literature. This topic experiences widespread debate currently, and over past decades and more trials might be expected, however ethical concerns about reducing an infant's acces to their mother's milk or adding a non‐human milk protein into a newborn baby's system make these trials difficult to undertake. Past research findings resulted in internationally recognised guidelines for practice clearly supporting exclusive breastfeeding for the first six months and thus funders, parents and research review boards may be hesitant about involvement in trials contrary to these guidelines.
One included study from 1982 (no data for inclusion) examined the effect on intestinal bacteria of the newborn infant of additional glucose water versus exclusive colostrum. It is surprising that more recent trials were not found on the effect of additional fluids and foods versus exclusive breastfeeding on the infant microbiota and effects on later health.
The studies reviewed came from a wide range of countries and are published in English. Breastmilk is readily available and does not involve additional resources such as electricity or technology, or the costs associated with purchasing alternative fluids and food. Evidence not part of the topic of this review indicates there may be negative effects of early additional of non‐human fluids which may have illness‐associated costs. One older study in this review mentioned the cost of the early fluids additional to mother's milk and one study referred to possible concerns from contamination of the intervention fluids and foods. The costs and safety of interventions are important to include in determining the suitability of an intervention.
Quality of the evidence
The evidence for the comparison of additional early artificial milk versus exclusive breastfeeding was graded as a having a low quality of evidence for any breastfeeding at discharge and three months, maternal self‐confidence and very low quality of evidence for allergy symptoms for reasons including unclear definitions of supplement feeds, uncertainty of the impact of recruiting infants with a 5% or greater weight loss and small sample size.
The evidence for the comparison of additional early water or glucose water versus exclusive breastfeeding had low quality of evidence for any breastfeeding at 12 months and weight change at 48 hours of life because of lack of information on sequence generation or allocation concealment and small sample size. The evidence for the comparison of additional early water or glucose water versus exclusive breastfeeding had very low quality of evidence for hypoglycaemia at 12 and 24 hours of life, weight change at 72 hours of life and weight loss (%) at three and five days of age because of one trial with no information on sequence generation or allocation concealment and wide confidence intervals or confidence intervals meeting the line of no effect.
The evidence for the comparison of early additional foods versus exclusive breastfeeding had a low quality of evidence for fever and mean weight change at four to six months due to quasi‐random sequence generation, small sample size and wide confidence interval crossing the line of no effect. The remaining outcomes (weight change expressed as a z‐score at four to six months, food allergy at one to three years, visible eczema at 12 months (stratified by visible eczema at enrolment) and food protein enterocolitis syndrome) were graded as having moderate quality of evidence because of wide confidence interval crossing the line of no effect and small sample size.
We did not downgrade any of studies for performance bias as due to the nature of the interventions blinding would not have been possible. See summary of findings Table for the main comparison; summary of findings Table 2; summary of findings Table 3 for further details.
We assessed each of the 11 studies for risk of bias and found that over half of the studies (n = 7) had a high risk of other biases. We were unable to assess eight studies for selection bias. All but one study (Perkin 2016) achieved the same grade for both random sequence generation and allocation concealment, which are both markers for selection bias. Three studies each were assessed as being low (Flaherman 2013; Jonsdottir 2012; Straňák 2016) and high (Cohen 1994; Dewey 1999; Lindfors 1988) risk for selection bias, and we could not evaluate four trials (Martin‐Calama 1997; Nicoll 1982; Ojofeitimi 1982; Schutzman 1986) for selection bias. Further details are listed in the 'Risk of bias' tables (Characteristics of included studies) and summary graphs of methodological quality (Figure 2; Figure 3).
Three of the 11 included studies provided no information on funding sources in their published papers (Martin‐Calama 1997; Ojofeitimi 1982; Schutzman 1986). Support from, or a financial relationship with an infant food manufacturer, or their marketing body, was declared in five trials (Cohen 1994; Flaherman 2013; Jonsdottir 2012; Nicoll 1982; Perkin 2016). The non‐standard intervention artifical milk was supplied in pre‐filled syringes though it is not stated if these were provided by the manufacturers (Flaherman 2013). Sources of non‐commercial support were declared by seven trials (Cohen 1994; Dewey 1999; Flaherman 2013; Jonsdottir 2012; Lindfors 1988; Perkin 2016; Straňák 2016).
Potential biases in the review process
We applied a search strategy to identify all potential trials. However, although we identified 11 trials, we were unable to extract several relevant outcome data pre‐specified in our protocol. Some of these outcome measures were most likely not ascertained during the trial; however, others could have been collected but not reported. For the studies over 10 years since publication we did not contact the primary investigators to obtain any additional data.
Otherwise, to minimise bias, we followed the methodology for systematic reviews outlined in theCochrane Handbook for Systematic Reviews of Interventions (Higgins 2011) and customised to this review as described in Methods.
Agreements and disagreements with other studies or reviews
This review did not find any disagreements with the Cochrane review by Kramer which included both observational studies and randomised controlled trials examining exclusive breastfeeding versus earlier introduction of complementary foods (Kramer 2012). This Kramer review formed the basis for the World Health Organization recommendations, and thus numerous other recommendations, that exclusive breastfeeding is recommended for the first six months after birth. A review to systematically evaluate the effect of additional fluids or feedings during the first days of life on the overall breastfeeding duration and rate of exclusive breastfeeding among healthy infants was conducted in 2006 (Szajewska 2006). The Szajewska 2006 review only included one of the trials (Martin‐Calama 1997) eligible for inclusion in this Cochrane review and concluded that there is insufficient evidence to form conclusions about the effect of brief exposure to additional food or fluids or both on infant health and the duration of breastfeeding.
This review found potential disagreement with the World Health Organization recommendations, and thus numerous other recommendations, in respect of early additional artifical milks versus exclusive breastfeeding. The findings from two trials with the same protocol (Flaherman 2013;Straňák 2016) present data that would be in disagreement with findings of many other studies (such as those cited in the Background). We found quality concerns in these two trials, as outlined in the review, and we could not recommend that guidance or practice be altered based on their findings.

Study flow diagram.

Methodological quality graph: review authors' judgements about each methodological quality item presented as percentages across all included studies.

'Risk of bias' summary: review authors' judgements about each risk of bias item for each included study.
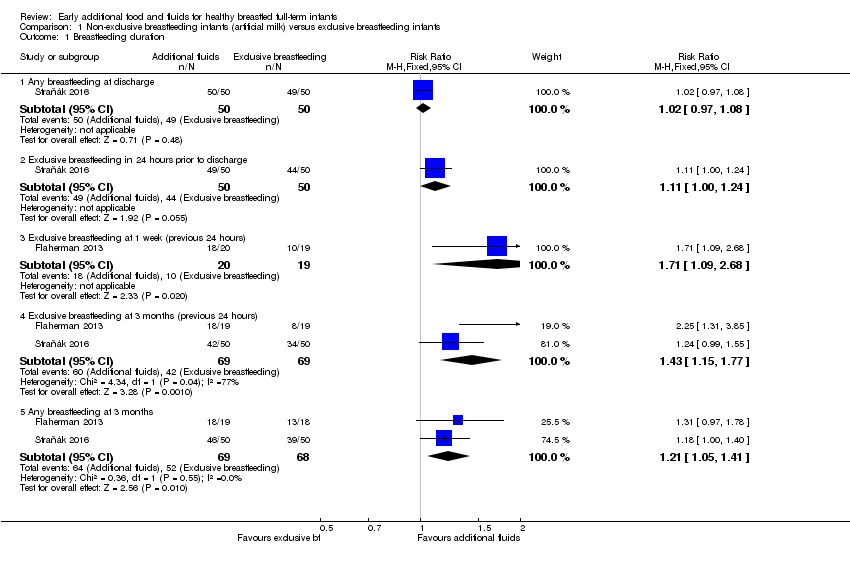
Comparison 1 Non‐exclusive breastfeeding infants (artificial milk) versus exclusive breastfeeding infants, Outcome 1 Breastfeeding duration.

Comparison 1 Non‐exclusive breastfeeding infants (artificial milk) versus exclusive breastfeeding infants, Outcome 2 Allergy symptoms.
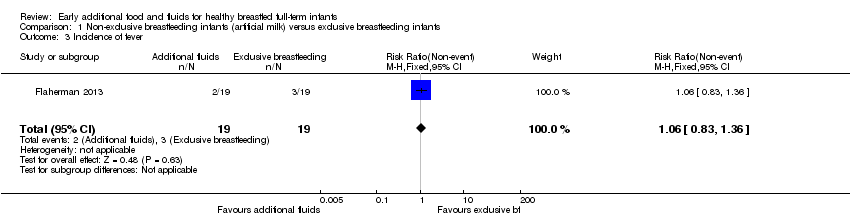
Comparison 1 Non‐exclusive breastfeeding infants (artificial milk) versus exclusive breastfeeding infants, Outcome 3 Incidence of fever.

Comparison 1 Non‐exclusive breastfeeding infants (artificial milk) versus exclusive breastfeeding infants, Outcome 4 Maternal self‐confidence ‐ Modified breastfeeding self‐efficacy score at 1 week.

Comparison 1 Non‐exclusive breastfeeding infants (artificial milk) versus exclusive breastfeeding infants, Outcome 5 Phototherapy in hospital or home.

Comparison 2 Non‐exclusive breastfeeding infants (water) versus exclusive breastfeeding infants, Outcome 1 Breastfeeding duration.

Comparison 2 Non‐exclusive breastfeeding infants (water) versus exclusive breastfeeding infants, Outcome 2 Maximum temperature (ºC).

Comparison 2 Non‐exclusive breastfeeding infants (water) versus exclusive breastfeeding infants, Outcome 3 Minimum temperature (ºC).

Comparison 2 Non‐exclusive breastfeeding infants (water) versus exclusive breastfeeding infants, Outcome 4 Episodes of hypoglycaemia (glycaemia < 2.2 mmol/L).

Comparison 2 Non‐exclusive breastfeeding infants (water) versus exclusive breastfeeding infants, Outcome 5 Mean capillary blood glucose levels of infants (mmol/L).

Comparison 2 Non‐exclusive breastfeeding infants (water) versus exclusive breastfeeding infants, Outcome 6 Weight change (loss) (g).

Comparison 2 Non‐exclusive breastfeeding infants (water) versus exclusive breastfeeding infants, Outcome 7 Weight loss (%).

Comparison 2 Non‐exclusive breastfeeding infants (water) versus exclusive breastfeeding infants, Outcome 8 Maximum serum bilirubin levels umol/L.

Comparison 3 Non‐exclusive breastfeeding infants (foods) versus exclusive breastfeeding infants, Outcome 1 Fever (% of days).

Comparison 3 Non‐exclusive breastfeeding infants (foods) versus exclusive breastfeeding infants, Outcome 2 Cough (% of days).
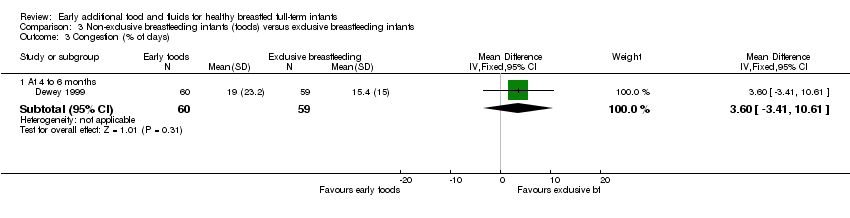
Comparison 3 Non‐exclusive breastfeeding infants (foods) versus exclusive breastfeeding infants, Outcome 3 Congestion (% of days).

Comparison 3 Non‐exclusive breastfeeding infants (foods) versus exclusive breastfeeding infants, Outcome 4 Nasal discharge (% of days).
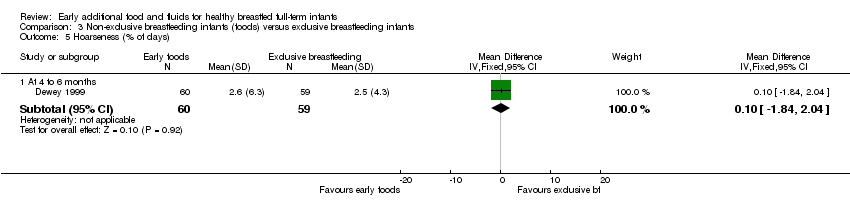
Comparison 3 Non‐exclusive breastfeeding infants (foods) versus exclusive breastfeeding infants, Outcome 5 Hoarseness (% of days).

Comparison 3 Non‐exclusive breastfeeding infants (foods) versus exclusive breastfeeding infants, Outcome 6 “Food allergy” to one or more foods between 1‐3 years of age.

Comparison 3 Non‐exclusive breastfeeding infants (foods) versus exclusive breastfeeding infants, Outcome 7 Visible eczema at 12‐month visit stratified by visible eczema at enrolment.

Comparison 3 Non‐exclusive breastfeeding infants (foods) versus exclusive breastfeeding infants, Outcome 8 Food protein enterocolitis syndrome positive response to challenge (number of children).

Comparison 3 Non‐exclusive breastfeeding infants (foods) versus exclusive breastfeeding infants, Outcome 9 Weight change (gain) (g).

Comparison 3 Non‐exclusive breastfeeding infants (foods) versus exclusive breastfeeding infants, Outcome 10 Weight change (z score).
| Non‐exclusive breastfeeding (artificial milk) versus exclusive breastfeeding | ||||||
| Patient or population: healthy breastfeeding full‐term infants | ||||||
| Outcomes | Anticipated absolute effects* (95% CI) | Relative effect | № of participants | Quality of the evidence | Comments | |
| Risk with exclusive breastfeeding infants | Risk with non‐exclusive breastfeeding infants (artificial milk) | |||||
| Any breastfeeding at discharge | Study population | RR 1.02 (0.97 to 1.08) | 100 | ⊕⊕⊝⊝ | ||
| 980 per 1000 | 1000 per 1000 (951 to 1000) | |||||
| Any breastfeeding at 3 months | Study population | RR 1.21 | 137 | ⊕⊕⊝⊝ | ||
| 765 per 1000 | 925 per 1000 | |||||
| Infant morbidity ‐ allergy symptoms ‐ Infants with allergy symptoms at 18 months of age | Study population | RR 0.56 | 207 | ⊕⊝⊝⊝ | ||
| 327 per 1000 | 183 per 1000 | |||||
| Weight change | This outcome was not reported. | |||||
| Maternal self‐confidence Modified breastfeeding self‐efficacy score at 1 week. Items rated on a scale from 1 (“Strongly Disagree”) to 5 (“Strongly Agree”), with positive scores associated with increased breastfeeding self‐efficacy. | The mean maternal self‐confidence was 3.9 units (SD 0.7) n = 20 | The mean maternal self‐confidence in the artificial milk group was 0.1 units higher on a 5‐point scale (95% CI 0.34 lower to 0.54 higher) | ‐ | 39 | ⊕⊕⊝⊝ | Modified breastfeeding self‐efficacy score at 1 week. Items rated on a scale from 1 (“Strongly Disagree”) to 5 (“Strongly Agree”) with higher scores associated with more breastfeeding self‐efficacy |
| *The risk in the intervention group (and its 95% confidence interval) is based on the assumed risk in the comparison group and the relative effect of the intervention (and its 95% CI). | ||||||
| GRADE Working Group grades of evidence | ||||||
| 1 Control group had low adherence to the study protocol (‐1). 2 We are unsure of the impact of the recruitment of only infants with greater than or equal to 5% weight loss as 5% is within normal expected range. 3 Wide confidence intervals crossing the line of no effect and small sample size (‐1). 4 1 trial had baseline imbalances in multiparity. 5 Evidence based on small sample size (‐1). 6 Confidence intervals crossing the line of no difference and small sample size (‐1). 7 1 trial with quasi‐random sequence generation, baseline imbalances for family history of allergy, 1 infant was changed from its allocated group due to family history of allergy, unclear if exclusive breastfeeding group received water or colostrum in the first 48 hours, high number of outcome assessors working independently and diagnosis of allergy was based on clinical criteria with no diagnostic testing | ||||||
| Non‐exclusive breastfeeding (water or glucose water) versus exclusive breastfeeding | ||||||
| Patient or population: healthy breastfeeding full‐term infants | ||||||
| Outcomes | Anticipated absolute effects* (95% CI) | Relative effect | № of participants | Quality of the evidence | Comments | |
| Risk with exclusive breastfeeding infants | Risk with non‐exclusive breastfeeding infants (water) | |||||
| Any breastfeeding at 12 weeks | Study population | RR 0.68 | 170 | ⊕⊕⊝⊝ | Estimated from the graph the percentage of mothers breastfeeding at each time period (see Table 1). | |
| 747 per 1000 | 508 per 1000 | |||||
| Hypoglycaemia episodes at 12 hours of life (glycaemia < 2.2 mmol/L) | Study population | RR 0.07 (0.00 to 1.20) | 170 | ⊕⊝⊝⊝ | Trialists used a cut‐off point as serum glucose less than 2.2 mmol/L whereas some researchers define a lower cut‐off level (1.7 mmol/L). Trialists report there was no case of serum glucose levels under 1.7 mmol/L in either of the 2 groups and no cases presented hypoglycaemic symptoms. | |
| 80 per 1000 | 6 per 1000 | |||||
| Hypoglycaemia episodes at 24 hours of life (glycaemia < 2.2 mmol/L) | Study population | RR 1.57 | 170 | ⊕⊝⊝⊝ | Trialists used a cut‐off point as serum glucose less than 2.2 mmol/L whereas some researchers define a lower cut‐off level (1.7 mmol/L). Trialists report there was no case of serum glucose levels under 1.7 mmol/L in either of the 2 groups and no cases presented hypoglycaemic symptoms. | |
| 23 per 1000 | 36 per 1000 | |||||
| Weight change (loss) (g) at 48 hours | The mean weight loss (g) at 48 hours was 197.8 g (SD 73.2) | Infants with additional fluids (water) were on average (MD) 32.5 g heavier (less weight lost) (CI 12.91 g heavier to 52.09 g heavier) | ‐ | 170 | ⊕⊕⊝⊝ | This mean difference of 32.5 g is not clinically meaningful. |
| Weight change (loss) (g) at 72 hours | The mean weight loss (g) at 72 hours was 141.9 g (SD 89.1) | Infants with additional fluids (water) were on average (MD) 3 g lighter (more weight lost) (CI 26.83 g lighter to 20.83 heavier) | ‐ | 170 | ⊕⊝⊝⊝ | |
| Weight loss (%) day 3 (percentage of birthweight) | The mean weight loss (%) day 3 was 6% of birthweight | Infants with additional fluids (water) lost on average (MD) 1.03% less of their birthweight (CI 2.24% less to 0.18% more weight lost) | ‐ | 47 | ⊕⊝⊝⊝ | We combined the glucose and water supplement arms of the Nicoll 1982 trial. |
| Weight loss (%) day 5 (percentage of birthweight) | The mean weight loss (%) day 5 was 4.3% of birthweight | Infants with additional fluids (water) lost on average (MD) 0.2% less of their birthweight (CI 0.86% less to 0.46% more weight lost) | ‐ | 47 | ⊕⊝⊝⊝ | We combined the glucose and water supplement arms of the Nicoll 1982 trial. |
| Confidence in breastfeeding (maternal or of those influencing the mother) | This outcome was not reported. | |||||
| *The risk in the intervention group (and its 95% confidence interval) is based on the assumed risk in the comparison group and the relative effect of the intervention (and its 95% CI). | ||||||
| GRADE Working Group grades of evidence | ||||||
| 1 1 trial with no information on sequence generation or allocation concealment (‐1). 2 Evidence based on small sample size (‐1). 3 Wide confidence intervals crossing the line of no effect and small sample size (‐2). 4 Few events | ||||||
| Non‐exclusive breastfeeding (foods) versus exclusive breastfeeding | ||||||
| Patient or population: healthy breastfeeding full‐term infants | ||||||
| Outcomes | Anticipated absolute effects* (95% CI) | Relative effect | № of participants | Quality of the evidence | Comments | |
| Risk with Exclusive breastfeeding infants | Risk with non‐exclusive breastfeeding infants (foods) | |||||
| Duration of breastfeeding (at different time points) | This outcome was not reported in a format that could be analysed. | |||||
| Fever (% of days) ‐ 4 to 6 months | The mean fever (% of days) ‐ 4 to 6 months was 8% days (SD 7.2) | Infants with additional foods had a fever on average 0.7% of days lower (CI 3.4% fewer to 2% more days) | ‐ | 119 | ⊕⊕⊝⊝ | |
| “Food allergy” to 1 or more foods between 1 to 3 years of age | Study population | RR 0.80 | 1162 | ⊕⊕⊕⊝ | There was low adherence to the protocol in the intervention group | |
| 71 per 1000 | 56 per 1000 | |||||
| Visible eczema at 12‐month visit stratified by visible eczema at enrolment | Study population | RR 0.86 | 284 | ⊕⊕⊕⊝ | There was low adherence to the protocol in the intervention group | |
| 182 per 1000 | 156 per 1000 | |||||
| Food protein enterocolitis syndrome positive response to challenge (number of children) | Study population | RR 2.00 | 1303 | ⊕⊕⊕⊝ | There was low adherence to the protocol in the intervention group | |
| 2 per 1000 | 3 per 1000 | |||||
| Weight change (gain) (g) ‐ 4 to 6 months | The mean weight change (gain) (g) at 4 to 6 months was 1054 g | Infants with additional foods gained on average (MD) 39.48 g less weight (CI 128.43 g less to 49.48 g more weight gain) | ‐ | 260 | ⊕⊕⊝⊝ | |
| Weight change (z score) as standard deviations of an overall population distribution of infant weight gain at 4 ‐ 6 months | The mean weight change (z score) was 0.01 standard deviations less weight gained | The mean weight change for infants with additional foods was 0.01 standard deviations less weight gained (0.15 standard deviations less weight gained to 0.13 standard deviations more weight gained) | ‐ | 100 | ⊕⊕⊕⊝ | The differences in weight change from 4 to 6 months are negligible between the groups |
| Confidence in breastfeeding (maternal or of those influencing the mother) | This outcome was not reported in a format that could be analysed. | |||||
| *The risk in the intervention group (and its 95% confidence interval) is based on the assumed risk in the comparison group and the relative effect of the intervention (and its 95% CI). | ||||||
| GRADE Working Group grades of evidence | ||||||
| 1 Quasi‐random sequence generation (by week of birth) (‐1). 2 Wide confidence interval crossing the line of no effect and small sample size (‐1). 3 Estimate based on small sample size (‐1). | ||||||
| % of mothers who continued either exclusive or partial breastfeeding | Exclusive breastfeeding on day 1‐3 group (non‐glucose water) (n = 87) | Glucose water on day 1‐3 (n = 83) |
| At 4 weeks | 93% | 77% |
| At 8 weeks | 81% | 64% |
| At 12 weeks | 75% | 51% |
| At 16 weeks | 67% | 43% |
| At 20 weeks | 57% | 40% |
| These figures were estimated from a graph (Figure 2) on page 212 of the Martin‐Calama 1997 paper. | ||
| Outcome or subgroup title | No. of studies | No. of participants | Statistical method | Effect size |
| 1 Breastfeeding duration Show forest plot | 2 | Risk Ratio (M‐H, Fixed, 95% CI) | Subtotals only | |
| 1.1 Any breastfeeding at discharge | 1 | 100 | Risk Ratio (M‐H, Fixed, 95% CI) | 1.02 [0.97, 1.08] |
| 1.2 Exclusive breastfeeding in 24 hours prior to discharge | 1 | 100 | Risk Ratio (M‐H, Fixed, 95% CI) | 1.11 [1.00, 1.24] |
| 1.3 Exclusive breastfeeding at 1 week (previous 24 hours) | 1 | 39 | Risk Ratio (M‐H, Fixed, 95% CI) | 1.71 [1.09, 2.68] |
| 1.4 Exclusive breastfeeding at 3 months (previous 24 hours) | 2 | 138 | Risk Ratio (M‐H, Fixed, 95% CI) | 1.43 [1.15, 1.77] |
| 1.5 Any breastfeeding at 3 months | 2 | 137 | Risk Ratio (M‐H, Fixed, 95% CI) | 1.21 [1.05, 1.41] |
| 2 Allergy symptoms Show forest plot | 1 | Risk Ratio (M‐H, Fixed, 95% CI) | Subtotals only | |
| 2.1 Infants with allergy symptoms at 18 months of age | 1 | 207 | Risk Ratio (M‐H, Fixed, 95% CI) | 0.56 [0.35, 0.91] |
| 3 Incidence of fever Show forest plot | 1 | 38 | Risk Ratio (M‐H, Fixed, 95% CI) | 1.06 [0.83, 1.36] |
| 4 Maternal self‐confidence ‐ Modified breastfeeding self‐efficacy score at 1 week Show forest plot | 1 | 39 | Mean Difference (IV, Fixed, 95% CI) | 0.10 [‐0.34, 0.54] |
| 5 Phototherapy in hospital or home Show forest plot | 1 | 100 | Risk Ratio (M‐H, Fixed, 95% CI) | 0.33 [0.01, 7.99] |
| Outcome or subgroup title | No. of studies | No. of participants | Statistical method | Effect size |
| 1 Breastfeeding duration Show forest plot | 1 | Risk Ratio (M‐H, Fixed, 95% CI) | Subtotals only | |
| 1.1 Any breastfeeding at 4 weeks | 1 | 170 | Risk Ratio (M‐H, Fixed, 95% CI) | 0.83 [0.73, 0.94] |
| 1.2 Any breastfeeding at 8 weeks | 1 | 170 | Risk Ratio (M‐H, Fixed, 95% CI) | 0.79 [0.65, 0.96] |
| 1.3 Any breastfeeding at 12 weeks | 1 | 170 | Risk Ratio (M‐H, Fixed, 95% CI) | 0.68 [0.53, 0.87] |
| 1.4 Any breastfeeding at 16 weeks | 1 | 170 | Risk Ratio (M‐H, Fixed, 95% CI) | 0.65 [0.49, 0.87] |
| 1.5 Any breastfeeding at 20 weeks | 1 | 170 | Risk Ratio (M‐H, Fixed, 95% CI) | 0.69 [0.50, 0.95] |
| 2 Maximum temperature (ºC) Show forest plot | 1 | Mean Difference (IV, Fixed, 95% CI) | Subtotals only | |
| 2.1 At 72 hours | 1 | 170 | Mean Difference (IV, Fixed, 95% CI) | ‐0.10 [‐0.19, ‐0.01] |
| 3 Minimum temperature (ºC) Show forest plot | 1 | Mean Difference (IV, Fixed, 95% CI) | Subtotals only | |
| 3.1 At 72 hours | 1 | 170 | Mean Difference (IV, Fixed, 95% CI) | ‐0.10 [‐0.18, ‐0.02] |
| 4 Episodes of hypoglycaemia (glycaemia < 2.2 mmol/L) Show forest plot | 1 | Risk Ratio (M‐H, Fixed, 95% CI) | Subtotals only | |
| 4.1 At 6 hours of life | 1 | 170 | Risk Ratio (M‐H, Fixed, 95% CI) | 0.42 [0.08, 2.10] |
| 4.2 At 12 hours of life | 1 | 170 | Risk Ratio (M‐H, Fixed, 95% CI) | 0.07 [0.00, 1.20] |
| 4.3 At 24 hours of life | 1 | 170 | Risk Ratio (M‐H, Fixed, 95% CI) | 1.57 [0.27, 9.17] |
| 4.4 At 48 hours of life | 1 | 170 | Risk Ratio (M‐H, Fixed, 95% CI) | 0.35 [0.04, 3.29] |
| 5 Mean capillary blood glucose levels of infants (mmol/L) Show forest plot | 1 | Mean Difference (IV, Random, 95% CI) | Subtotals only | |
| 5.1 At 6 hours of life | 1 | 170 | Mean Difference (IV, Random, 95% CI) | 0.29 [0.02, 0.56] |
| 5.2 At 12 hours of life | 1 | 170 | Mean Difference (IV, Random, 95% CI) | 0.47 [0.24, 0.70] |
| 5.3 At 24 hours of life | 1 | 170 | Mean Difference (IV, Random, 95% CI) | 0.34 [0.08, 0.60] |
| 5.4 At 48 hours of life | 1 | 170 | Mean Difference (IV, Random, 95% CI) | 0.24 [‐0.03, 0.51] |
| 6 Weight change (loss) (g) Show forest plot | 1 | Mean Difference (IV, Fixed, 95% CI) | Subtotals only | |
| 6.1 At 6 hours of life | 1 | 170 | Mean Difference (IV, Fixed, 95% CI) | ‐7.0 [‐13.24, ‐0.76] |
| 6.2 At 12 hours of life | 1 | 170 | Mean Difference (IV, Fixed, 95% CI) | ‐11.5 [‐21.29, ‐1.71] |
| 6.3 At 24 hours of life | 1 | 170 | Mean Difference (IV, Fixed, 95% CI) | ‐13.40 [‐26.37, ‐0.43] |
| 6.4 At 48 hours of life | 1 | 170 | Mean Difference (IV, Fixed, 95% CI) | ‐32.5 [‐52.09, ‐12.91] |
| 6.5 At 72 hours of life | 1 | 170 | Mean Difference (IV, Fixed, 95% CI) | 3.0 [‐20.83, 26.83] |
| 7 Weight loss (%) Show forest plot | 1 | Mean Difference (IV, Fixed, 95% CI) | Subtotals only | |
| 7.1 Day 3 | 1 | 47 | Mean Difference (IV, Fixed, 95% CI) | ‐1.03 [‐2.24, 0.18] |
| 7.2 Day 5 | 1 | 47 | Mean Difference (IV, Fixed, 95% CI) | ‐0.20 [‐0.86, 0.46] |
| 8 Maximum serum bilirubin levels umol/L Show forest plot | 1 | Mean Difference (IV, Fixed, 95% CI) | Subtotals only | |
| 8.1 Day 6 | 1 | 47 | Mean Difference (IV, Fixed, 95% CI) | 18.84 [‐1.35, 39.03] |
| Outcome or subgroup title | No. of studies | No. of participants | Statistical method | Effect size |
| 1 Fever (% of days) Show forest plot | 1 | Mean Difference (IV, Fixed, 95% CI) | Subtotals only | |
| 1.1 4 to 6 months | 1 | 119 | Mean Difference (IV, Fixed, 95% CI) | ‐0.70 [‐3.40, 2.00] |
| 2 Cough (% of days) Show forest plot | 1 | Mean Difference (IV, Fixed, 95% CI) | Subtotals only | |
| 2.1 At 4 to 6 months | 1 | 119 | Mean Difference (IV, Fixed, 95% CI) | 3.10 [‐4.52, 10.72] |
| 3 Congestion (% of days) Show forest plot | 1 | Mean Difference (IV, Fixed, 95% CI) | Subtotals only | |
| 3.1 At 4 to 6 months | 1 | 119 | Mean Difference (IV, Fixed, 95% CI) | 3.60 [‐3.41, 10.61] |
| 4 Nasal discharge (% of days) Show forest plot | 1 | Mean Difference (IV, Fixed, 95% CI) | Subtotals only | |
| 4.1 At 4 to 6 months | 1 | 119 | Mean Difference (IV, Fixed, 95% CI) | 4.20 [‐1.13, 9.53] |
| 5 Hoarseness (% of days) Show forest plot | 1 | Mean Difference (IV, Fixed, 95% CI) | Subtotals only | |
| 5.1 At 4 to 6 months | 1 | 119 | Mean Difference (IV, Fixed, 95% CI) | 0.10 [‐1.84, 2.04] |
| 6 “Food allergy” to one or more foods between 1‐3 years of age Show forest plot | 1 | 1162 | Risk Ratio (M‐H, Fixed, 95% CI) | 0.80 [0.51, 1.25] |
| 7 Visible eczema at 12‐month visit stratified by visible eczema at enrolment Show forest plot | 1 | 284 | Risk Ratio (M‐H, Fixed, 95% CI) | 0.86 [0.51, 1.44] |
| 8 Food protein enterocolitis syndrome positive response to challenge (number of children) Show forest plot | 1 | 1303 | Risk Ratio (M‐H, Fixed, 95% CI) | 2.00 [0.18, 22.04] |
| 9 Weight change (gain) (g) Show forest plot | 2 | Mean Difference (IV, Fixed, 95% CI) | Subtotals only | |
| 9.1 At 4 to 6 months | 2 | 260 | Mean Difference (IV, Fixed, 95% CI) | ‐39.48 [‐128.43, 49.48] |
| 10 Weight change (z score) Show forest plot | 1 | Mean Difference (IV, Fixed, 95% CI) | Subtotals only | |
| 10.1 4 to 6 months | 1 | 100 | Mean Difference (IV, Fixed, 95% CI) | ‐0.01 [‐0.15, 0.13] |