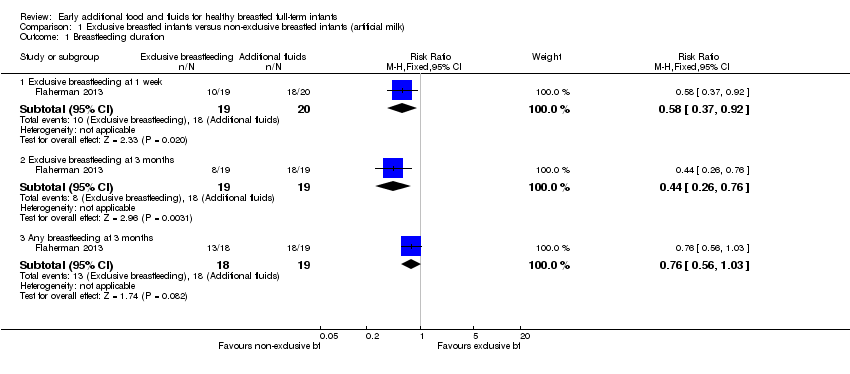
| 1 Breastfeeding duration Show forest plot | 1 | | Risk Ratio (M‐H, Fixed, 95% CI) | Subtotals only |
|
| 1.1 At 4 weeks | 1 | 170 | Risk Ratio (M‐H, Fixed, 95% CI) | 1.21 [1.06, 1.38] |
| 1.2 At 8 weeks | 1 | 170 | Risk Ratio (M‐H, Fixed, 95% CI) | 1.26 [1.04, 1.53] |
| 1.3 At 12 weeks | 1 | 170 | Risk Ratio (M‐H, Fixed, 95% CI) | 1.48 [1.16, 1.89] |
| 1.4 At 16 weeks | 1 | 170 | Risk Ratio (M‐H, Fixed, 95% CI) | 1.54 [1.15, 2.05] |
| 1.5 At 20 weeks | 1 | 170 | Risk Ratio (M‐H, Fixed, 95% CI) | 1.45 [1.05, 1.99] |
| 2 Maximum temperature (ºC) Show forest plot | 1 | | Mean Difference (IV, Fixed, 95% CI) | Subtotals only |
|
| 2.1 At 72 hours | 1 | 170 | Mean Difference (IV, Fixed, 95% CI) | 0.10 [0.01, 0.19] |
| 3 Minimum temperature (ºC) Show forest plot | 1 | | Mean Difference (IV, Fixed, 95% CI) | Subtotals only |
|
| 3.1 At 72 hours | 1 | 170 | Mean Difference (IV, Fixed, 95% CI) | 0.10 [0.02, 0.18] |
| 4 Episodes of hypoglycaemia (glycaemia < 2.2 mmol/l) Show forest plot | 1 | | Risk Ratio (M‐H, Fixed, 95% CI) | Subtotals only |
|
| 4.1 At 6 hours of life | 1 | 170 | Risk Ratio (M‐H, Fixed, 95% CI) | 2.39 [0.48, 11.96] |
| 4.2 At 12 hours of life | 1 | 170 | Risk Ratio (M‐H, Fixed, 95% CI) | 14.32 [0.83, 246.80] |
| 4.3 At 24 hours of life | 1 | 170 | Risk Ratio (M‐H, Fixed, 95% CI) | 0.64 [0.11, 3.71] |
| 4.4 At 48 hours of life | 1 | 170 | Risk Ratio (M‐H, Fixed, 95% CI) | 2.86 [0.30, 26.97] |
| 5 Mean capillary blood glucose levels of infants (mmol/l) Show forest plot | 1 | | Mean Difference (IV, Fixed, 95% CI) | Subtotals only |
|
| 5.1 At 6 hours of life | 1 | 170 | Mean Difference (IV, Fixed, 95% CI) | ‐0.29 [‐0.56, ‐0.02] |
| 5.2 At 12 hours of life | 1 | 170 | Mean Difference (IV, Fixed, 95% CI) | ‐0.47 [‐0.70, ‐0.24] |
| 5.3 At 24 hours of life | 1 | 170 | Mean Difference (IV, Fixed, 95% CI) | ‐0.34 [‐0.60, ‐0.08] |
| 5.4 At 48 hours of life | 1 | 170 | Mean Difference (IV, Fixed, 95% CI) | ‐0.24 [‐0.51, 0.03] |
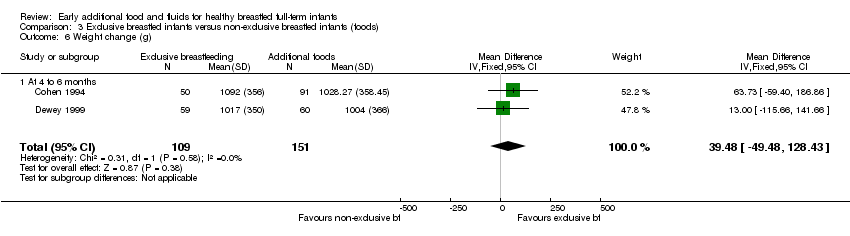
| 6 Weight change (g) Show forest plot | 1 | | Mean Difference (IV, Fixed, 95% CI) | Subtotals only |
|
| 6.1 At 6 hours of life | 1 | 170 | Mean Difference (IV, Fixed, 95% CI) | 7.0 [0.76, 13.24] |
| 6.2 At 12 hours of life | 1 | 170 | Mean Difference (IV, Fixed, 95% CI) | 11.5 [1.71, 21.29] |
| 6.3 At 24 hours of life | 1 | 170 | Mean Difference (IV, Fixed, 95% CI) | 13.40 [0.43, 26.37] |
| 6.4 At 48 hours of life | 1 | 170 | Mean Difference (IV, Fixed, 95% CI) | 32.5 [12.91, 52.09] |
| 6.5 At 72 hours of life | 1 | 170 | Mean Difference (IV, Fixed, 95% CI) | ‐3.0 [‐26.83, 20.83] |
| 7 Weight loss (%) Show forest plot | 1 | | Mean Difference (IV, Fixed, 95% CI) | Subtotals only |
|
| 7.1 Day 3 | 1 | 47 | Mean Difference (IV, Fixed, 95% CI) | 1.03 [‐0.18, 2.24] |
| 7.2 Day 5 | 1 | 47 | Mean Difference (IV, Fixed, 95% CI) | 0.20 [‐1.18, 1.58] |
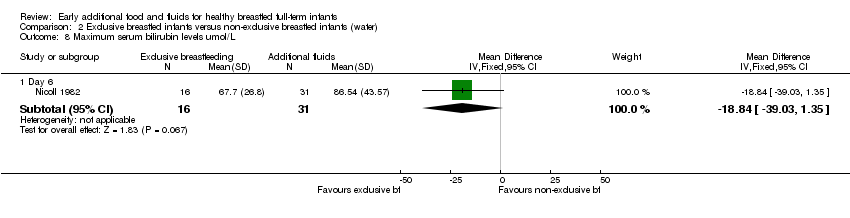
| 8 Maximum serum bilirubin levels umol/L Show forest plot | 1 | | Mean Difference (IV, Fixed, 95% CI) | Subtotals only |
|
| 8.1 Day 6 | 1 | 47 | Mean Difference (IV, Fixed, 95% CI) | ‐18.84 [‐39.03, 1.35] |