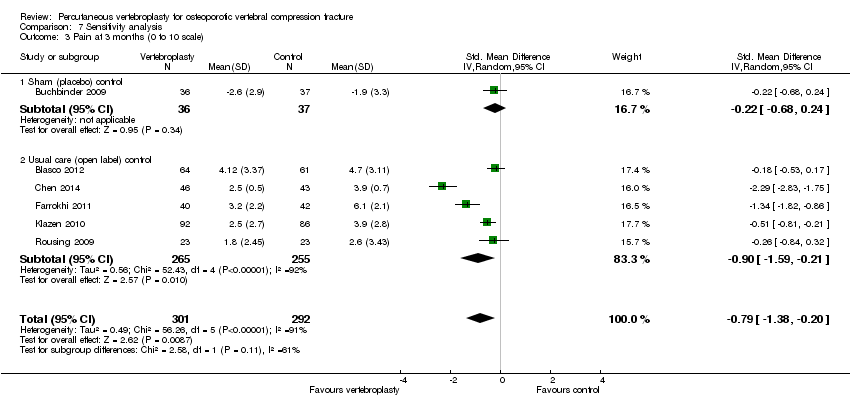
| 1 Pain (0 to 10 point scale) Show forest plot | 2 | | Mean Difference (IV, Random, 95% CI) | Subtotals only |
|
| 1.1 1 to 2 weeks | 2 | 205 | Mean Difference (IV, Random, 95% CI) | 0.12 [‐0.65, 0.88] |
| 1.2 1 month | 2 | 201 | Mean Difference (IV, Random, 95% CI) | ‐0.66 [‐1.48, 0.15] |
| 1.3 3 months | 1 | 73 | Mean Difference (IV, Random, 95% CI) | ‐0.70 [‐2.12, 0.72] |
| 1.4 6 months | 1 | 71 | Mean Difference (IV, Random, 95% CI) | ‐0.30 [‐1.84, 1.24] |
| 1.5 12 months | 1 | 67 | Mean Difference (IV, Random, 95% CI) | ‐0.5 [‐1.82, 0.82] |
| 1.6 24 months | 1 | 57 | Mean Difference (IV, Random, 95% CI) | ‐1.1 [‐2.68, 0.48] |
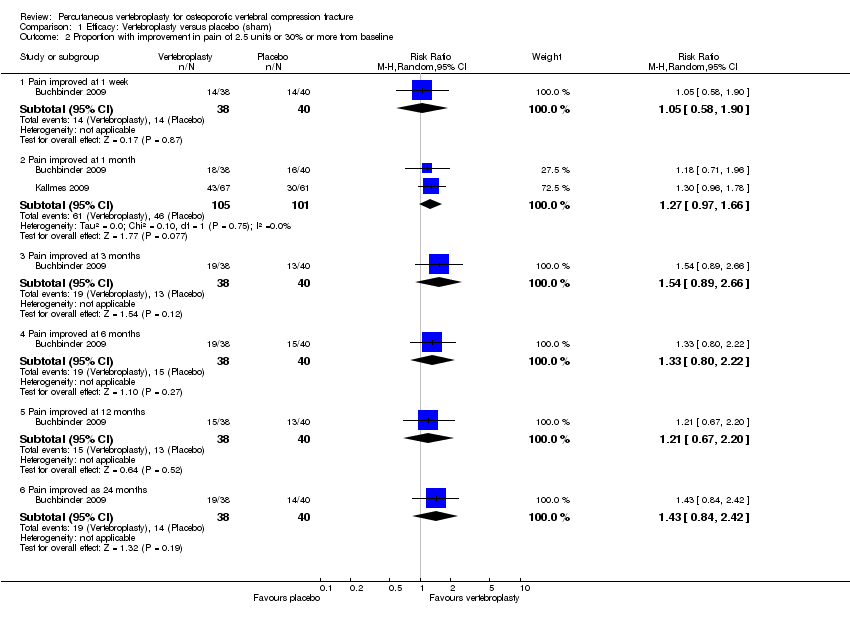
| 2 Proportion with improvement in pain of 2.5 units or 30% or more from baseline Show forest plot | 2 | | Risk Ratio (M‐H, Random, 95% CI) | Subtotals only |
|
| 2.1 Pain improved at 1 week | 1 | 78 | Risk Ratio (M‐H, Random, 95% CI) | 1.05 [0.58, 1.90] |
| 2.2 Pain improved at 1 month | 2 | 206 | Risk Ratio (M‐H, Random, 95% CI) | 1.27 [0.97, 1.66] |
| 2.3 Pain improved at 3 months | 1 | 78 | Risk Ratio (M‐H, Random, 95% CI) | 1.54 [0.89, 2.66] |
| 2.4 Pain improved at 6 months | 1 | 78 | Risk Ratio (M‐H, Random, 95% CI) | 1.33 [0.80, 2.22] |
| 2.5 Pain improved at 12 months | 1 | 78 | Risk Ratio (M‐H, Random, 95% CI) | 1.21 [0.67, 2.20] |
| 2.6 Pain improved as 24 months | 1 | 78 | Risk Ratio (M‐H, Random, 95% CI) | 1.43 [0.84, 2.42] |
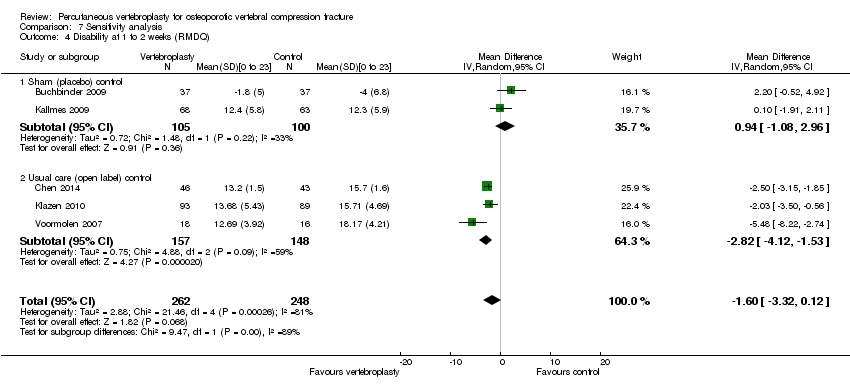
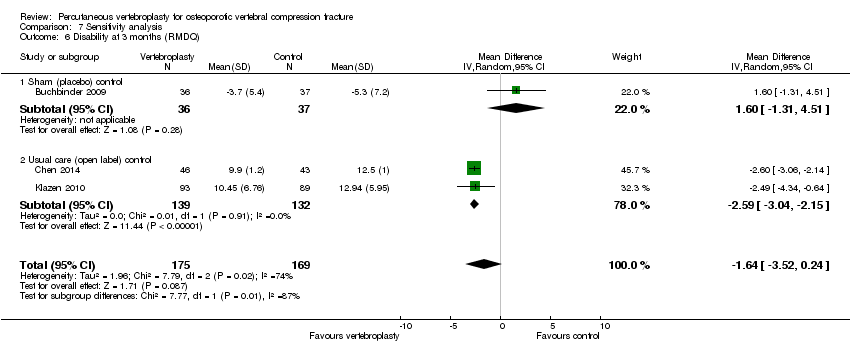
| 3 Disability (RMDQ) Show forest plot | 2 | | Mean Difference (IV, Random, 95% CI) | Subtotals only |
|
| 3.1 1 to 2 weeks | 2 | 190 | Mean Difference (IV, Random, 95% CI) | 0.82 [‐1.13, 2.78] |
| 3.2 1 month | 2 | 187 | Mean Difference (IV, Random, 95% CI) | ‐1.09 [‐2.94, 0.76] |
| 3.3 3 months | 1 | 59 | Mean Difference (IV, Random, 95% CI) | 1.60 [‐1.66, 4.86] |
| 3.4 6 months | 1 | 59 | Mean Difference (IV, Random, 95% CI) | ‐0.40 [‐3.36, 2.56] |
| 3.5 12 months | 1 | 48 | Mean Difference (IV, Random, 95% CI) | 0.60 [‐3.02, 4.22] |
| 3.6 24 months | 1 | 43 | Mean Difference (IV, Random, 95% CI) | 0.10 [‐3.67, 3.87] |
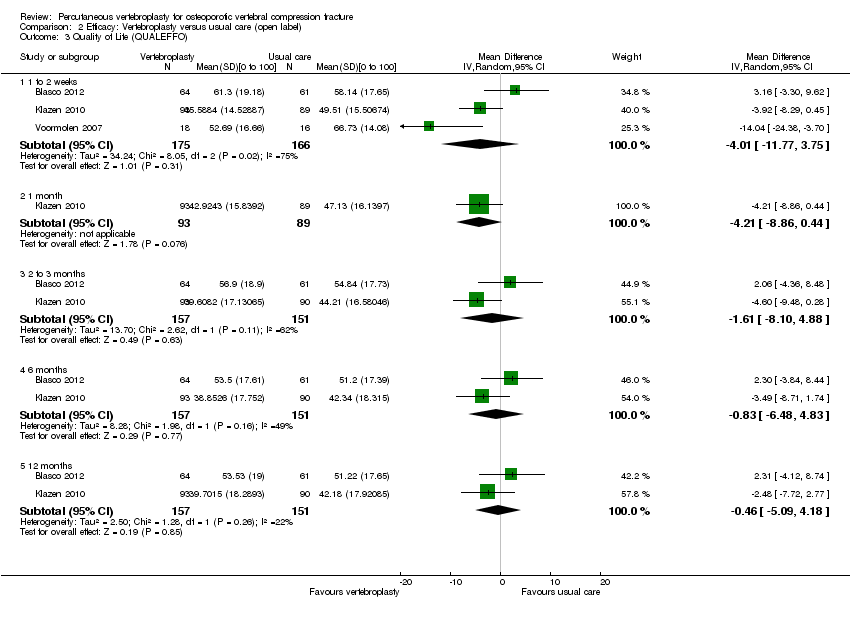
| 4 Quality of life (QUALEFFO) [0 to 100] Show forest plot | 1 | | Mean Difference (IV, Random, 95% CI) | Totals not selected |
|
| 4.1 1 week | 1 | | Mean Difference (IV, Random, 95% CI) | 0.0 [0.0, 0.0] |
| 4.2 1 month | 1 | | Mean Difference (IV, Random, 95% CI) | 0.0 [0.0, 0.0] |
| 4.3 3 months | 1 | | Mean Difference (IV, Random, 95% CI) | 0.0 [0.0, 0.0] |
| 4.4 6 months | 1 | | Mean Difference (IV, Random, 95% CI) | 0.0 [0.0, 0.0] |
| 4.5 12 months | 1 | | Mean Difference (IV, Random, 95% CI) | 0.0 [0.0, 0.0] |
| 4.6 24 months | 1 | | Mean Difference (IV, Random, 95% CI) | 0.0 [0.0, 0.0] |
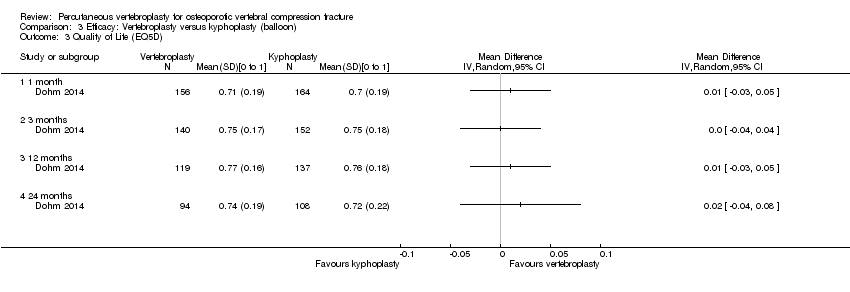
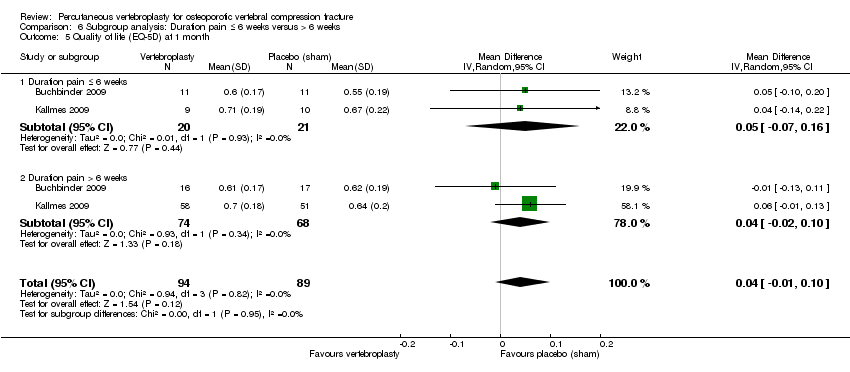
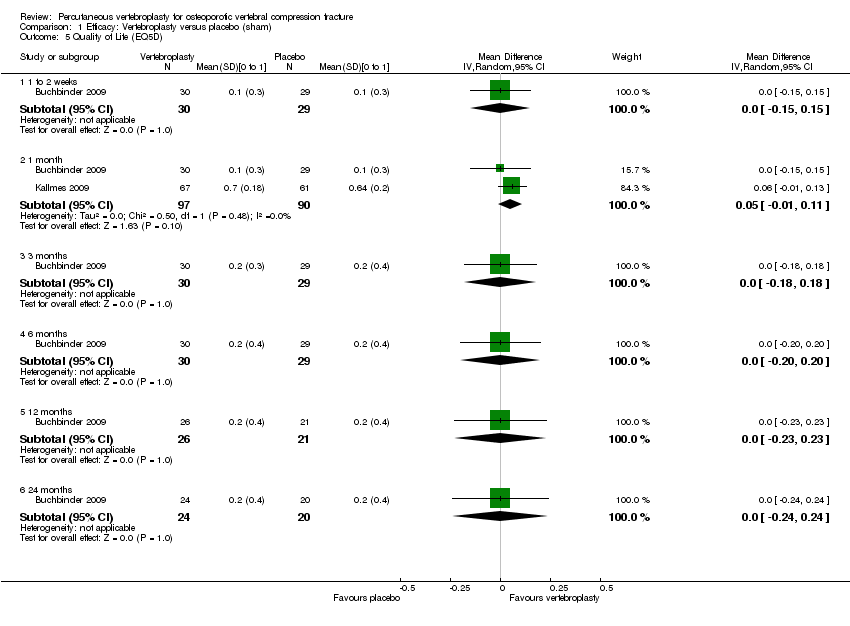
| 5 Quality of Life (EQ5D) Show forest plot | 2 | | Mean Difference (IV, Random, 95% CI) | Subtotals only |
|
| 5.1 1 to 2 weeks | 1 | 59 | Mean Difference (IV, Random, 95% CI) | 0.0 [‐0.15, 0.15] |
| 5.2 1 month | 2 | 187 | Mean Difference (IV, Random, 95% CI) | 0.05 [‐0.01, 0.11] |
| 5.3 3 months | 1 | 59 | Mean Difference (IV, Random, 95% CI) | 0.0 [‐0.18, 0.18] |
| 5.4 6 months | 1 | 59 | Mean Difference (IV, Random, 95% CI) | 0.0 [‐0.20, 0.20] |
| 5.5 12 months | 1 | 47 | Mean Difference (IV, Random, 95% CI) | 0.0 [‐0.23, 0.23] |
| 5.6 24 months | 1 | 44 | Mean Difference (IV, Random, 95% CI) | 0.0 [‐0.24, 0.24] |
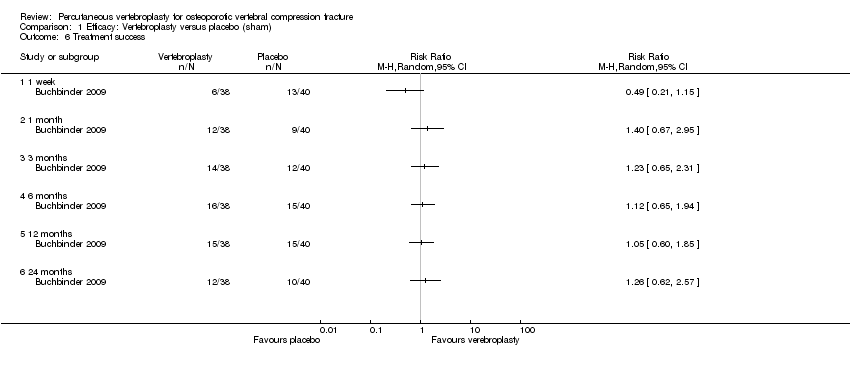
| 6 Treatment success Show forest plot | 1 | | Risk Ratio (M‐H, Random, 95% CI) | Totals not selected |
|
| 6.1 1 week | 1 | | Risk Ratio (M‐H, Random, 95% CI) | 0.0 [0.0, 0.0] |
| 6.2 1 month | 1 | | Risk Ratio (M‐H, Random, 95% CI) | 0.0 [0.0, 0.0] |
| 6.3 3 months | 1 | | Risk Ratio (M‐H, Random, 95% CI) | 0.0 [0.0, 0.0] |
| 6.4 6 months | 1 | | Risk Ratio (M‐H, Random, 95% CI) | 0.0 [0.0, 0.0] |
| 6.5 12 months | 1 | | Risk Ratio (M‐H, Random, 95% CI) | 0.0 [0.0, 0.0] |
| 6.6 24 months | 1 | | Risk Ratio (M‐H, Random, 95% CI) | 0.0 [0.0, 0.0] |


![Comparison 1 Efficacy: Vertebroplasty versus placebo (sham), Outcome 4 Quality of life (QUALEFFO) [0 to 100].](/es/cdsr/doi/10.1002/14651858.CD006349.pub2/media/CDSR/CD006349/rel0002/CD006349/image_n/nCD006349-CMP-001-04.png)

![Comparison 2 Efficacy: Vertebroplasty versus usual care (open label), Outcome 2 Disability (RMDQ [0 to 24] or ODI [0 to 100]).](/es/cdsr/doi/10.1002/14651858.CD006349.pub2/media/CDSR/CD006349/rel0002/CD006349/image_n/nCD006349-CMP-002-02.png)