Vertebroplastia percutánea para la fractura vertebral osteoporótica por compresión
Resumen
Antecedentes
La vertebroplastia percutánea se utiliza ampliamente para tratar las fracturas vertebrales osteoporóticas dolorosas agudas y subagudas, aunque ensayos controlados con placebo recientes han cuestionado su valor.
Objetivos
Resumir las pruebas disponibles con respecto a los efectos beneficiosos y perjudiciales de la vertebroplastia para el tratamiento de las fracturas vertebrales osteoporóticas.
Métodos de búsqueda
Se hicieron búsquedas en CENTRAL, MEDLINE y EMBASE hasta noviembre 2014. También se revisaron las listas de referencias de artículos de revisión, ensayos y registros de ensayos para identificar otros ensayos potencialmente relevantes.
Criterios de selección
Se incluyeron los ensayos controlados aleatorios y cuasialeatorios (ECA) que reclutaron adultos con fracturas vertebrales osteoporóticas dolorosas de cualquier duración y que compararon vertebroplastia con placebo (simulado), atención habitual u otra intervención. Como es menos proclive al sesgo, la comparación primaria fue la vertebroplastia comparada con placebo. Los resultados principales fueron dolor general medio, discapacidad, calidad de vida específica de la enfermedad y relacionada con la salud general, éxito del tratamiento informado por el paciente, nuevas fracturas vertebrales sintomáticas y número de otros eventos adversos graves.
Obtención y análisis de los datos
Al menos dos autores de la revisión, de forma independiente, seleccionaron los ensayos para la inclusión, extrajeron los datos, realizaron una evaluación del riesgo de sesgo y evaluaron la calidad del conjunto de pruebas para los principales resultados mediante GRADE.
Resultados principales
Se incluyeron 11 ECA y un ensayo controlado cuasialeatorio realizado en varios países. Dos ensayos compararon vertebroplastia con placebo (209 participantes asignados al azar), seis compararon vertebroplastia con atención habitual (566 participantes asignados al azar) y cuatro compararon vertebroplastia con cifoplastia (545 participantes asignados al azar). Los tamaños de los ensayos variaron de 34 a 404 participantes, en su mayoría los participantes fueron mujeres, la media de la edad varió entre 63,3 y 80 años y la duración media de los síntomas varió desde una semana a más de seis meses.
Los dos ensayos controlados con placebo se consideraron con riesgo general bajo de sesgo, mientras que los otros ensayos incluidos en general se consideraron con alto riesgo de sesgo a través de un rango de criterios, debido de manera más importante a la falta de cegamiento de los participantes y el personal del estudio.
En comparación con placebo, hubo pruebas de calidad moderada a partir de dos ensayos de que la vertebroplastia no proporciona efectos beneficiosos demostrables con respecto al dolor, la discapacidad, la calidad de vida específica de la enfermedad o general o al éxito del tratamiento. Al mes, el dolor medio (en una escala de 0 a 10, puntuaciones mayores indican más dolor) fue 5 puntos con placebo y 0,7 puntos mejor (1,5 mejor a 0,15 peor) con vertebroplastia, una reducción absoluta del dolor del 7% (15% mejor a 1,5% peor) y una reducción relativa del 10% (21% mejor a 2% peor) (dos ensayos, 201 participantes). Al mes, la discapacidad media medida por el Roland Morris Disability Questionnaire (rango de la escala: 0 a 23, puntuaciones mayores indican peor discapacidad) fue 13,6 puntos en el grupo placebo y 1,1 puntos mejor (2,9 mejor a 0,8 peor) en el grupo de vertebroplastia, mejoría absoluta de la discapacidad del 4,8% (12,8% mejor a 3,3% peor), cambio relativo 6,3% mejor (17,0% mejor a 4,4% peor) (dos ensayos, 201 participantes).
Al mes, la calidad de vida específica de la enfermedad medida por el QUALEFFO (escala 0 a 100, puntuaciones mayores que indican peor calidad de vida) fue 2,4 puntos en el grupo placebo y 0,40 puntos peor (4,58 mejor a 5,38 peor) en el grupo de vertebroplastia, cambio absoluto: 0,4% peor (5% peor a 5% mejor), cambio relativo 0,7% peor (9% peor a 8% mejor (según un ensayo, 73 participantes). Al mes, la calidad de vida general medida por el EQ5D (0 = muerte a 1 = salud perfecta, puntuaciones mayores indican mayor calidad de vida) al mes fue 0,27 puntos en el grupo placebo y 0,05 puntos mejor (0,01 peor a 0,11 mejor) en el grupo de vertebroplastia, mejoría absoluta en la calidad de vida del 5% (1% peor a 11% mejor), cambio relativo 18% mejor (4% peor a 39% mejor) (dos ensayos, 201 participantes). Según un ensayo (78 participantes) al mes 9/40 pacientes (ó 225 por 1000) percibieron que el tratamiento tuvo éxito en el grupo placebo en comparación con 12/38 (OR 315 por 1000; rango: 150 a 664) en el grupo de vertebroplastia, CR 1,40 (IC del 95%: 0,67 a 2,95), diferencia de riesgos absoluta 9% más éxito informado (11% menos a 29% más); cambio relativo 40% más éxito informado (33% menos a 195% más).
Según las pruebas de calidad moderada de tres ensayos (uno con placebo, dos con atención habitual, 281 participantes) con hasta 12 meses de seguimiento, no hay certeza con respecto a si la vertebroplastia aumenta el riesgo de nuevas fracturas vertebrales sintomáticas (28/143 observado en el grupo de vertebroplastia en comparación con 19/138 en el grupo control; CR 1,47 (IC del 95%: 0,39 a 5,50).
De manera similar, según las pruebas de calidad moderada de dos ensayos controlados con placebo (209 participantes), no hay certeza acerca del riesgo exacto de otros eventos adversos (3/106 se observaron en el grupo de vertebroplastia en comparación con 3/103 en el grupo placebo; CR 1,01 [IC del 95%: 0,21 a 4,85]). En particular, los eventos adversos graves informados con la vertebroplastia incluyeron osteomielitis, compresión de la médula, lesión del saco tecal e insuficiencia respiratoria.
Los análisis de subgrupos proporcionan pruebas limitadas de que los efectos no difirieron según la duración del dolor ≤ seis semanas versus > seis semanas. La inclusión de los datos de los seis ensayos que compararon vertebroplastia con atención habitual en los análisis de sensibilidad modificaron de forma inconsistente los resultados primarios, y todos los análisis combinados mostraron heterogeneidad significativa a considerable.
Conclusiones de los autores
A partir de pruebas de calidad moderada, esta revisión no apoya la función de la vertebroplastia para tratar las fracturas vertebrales osteoporóticas en la práctica habitual. No se encontraron efectos beneficiosos importantes clínicamente demostrables en comparación con un procedimiento simulado y los análisis de subgrupos indicaron que los resultados no difirieron según la duración del dolor ≤ seis semanas versus > seis semanas. Los análisis de sensibilidad confirmaron que es probable que los ensayos abiertos que compararon vertebroplastia con atención habitual hayan sobrestimado cualquier efecto beneficioso de la vertebroplastia. La corrección de estos sesgos probablemente acercaría cualquier efecto beneficioso observado con la vertebroplastia hacia el valor nulo, lo que coincide con los resultados de los ensayos controlados con placebo.
Después de la vertebroplastia se han observado numerosos eventos adversos graves. Sin embargo, debido al escaso número de eventos no es posible estar seguros acerca de si la vertebroplastia provoca o no un aumento clínicamente importante en el riesgo de nuevas fracturas vertebrales sintomáticas u otros eventos adversos graves. A los pacientes se les debe informar acerca de la falta de pruebas de alta calidad que apoyen un efecto beneficioso de la vertebroplastia y la posibilidad de efectos perjudiciales.
PICO
Resumen en términos sencillos
Vertebroplastia para las fracturas vertebrales osteoporóticas por compresión
Antecedentes
La osteoporosis se caracteriza por huesos delgados y frágiles. Las fracturas vertebrales osteoporóticas por compresión son fracturas por traumatismo mínimo de los huesos (vértebras) vertebrales (columna). Pueden causar discapacidad y dolor intenso.
La vertebroplastia incluye la inyección de cemento de clase médica en una vértebra fracturada a través de una aguja insertada en la piel, bajo sedación ligera o anestesia general. El cemento se endurece en el espacio óseo para formar un molde interno.
Características de los estudios
Esta revisión Cochrane está actualizada hasta noviembre 2014. Los estudios compararon vertebroplastia versus placebo (ningún cemento inyectado) (dos estudios, 209 participantes asignados al azar); atención habitual (seis estudios, 566 participantes asignados al azar); y cifoplastia (similar, pero antes de inyectar el cemento se expande un balón en la vértebra fracturada; cuatro estudios, 545 participantes asignados al azar). En su mayoría los participantes fueron mujeres con edades entre 63,3 y 80 años y la duración de los síntomas varió desde una semana a > seis meses. El informe se limitó a la comparación principal, en este caso vertebroplastia versus un procedimiento simulado.
Resultados clave
En comparación con un procedimiento placebo (falso), los pacientes sometidos a vertebroplastia no difirieron en los siguientes resultados al mes:
Mejoría del 7% (15% mejor a 1,5% peor) ó 0,7 puntos (1,5 mejor a 0,15 peor) en una escala de 0 a 10 puntos.
• Los pacientes sometidos a vertebroplastia calificaron el dolor en 4,3 puntos.
• Los pacientes sometidos a un procedimiento placebo (falso) calificaron el dolor en 5 puntos.
Mejoría del 5% (13% mejor a 3% peor) o 1,1 puntos (2,9 mejor a 0,8 peor) en una escala de 0 a 23 puntos.
• Los pacientes sometidos a vertebroplastia calificaron la discapacidad en 12,5 puntos.
• Los pacientes sometidos a un procedimiento placebo (falso) calificaron el dolor en 13,6 puntos.
Empeoramiento del 0,4% (5% peor a 5% mejor) o 0,4 puntos peor (5,4 peor a 4,6 mejor) en una escala de 0 a 100 puntos.
.• Los pacientes sometidos a vertebroplastia calificaron la calidad de vida relacionada con la fractura en 2,8 puntos.
• Los pacientes sometidos a un procedimiento placebo (falso) valoraron la calidad de vida relacionada con la fractura en 2,4 puntos.
Mejoría del 5% (1% peor a 11% mejor) ó 0,05 unidades (0,01 peor a 0,11 mejor) en una escala de 0 = muerte a 1 = salud perfecta.
• Los pacientes sometidos a vertebroplastia valoraron la calidad de vida general en 0,32 puntos.
• Los pacientes sometidos a un procedimiento placebo (falso) valoraron la calidad de vida general en 0,27 puntos.
9% más pacientes calificaron el tratamiento como un éxito (11% menos a 29% más) o nueve pacientes más de 100.
• 32 de 100 pacientes informaron éxito del tratamiento con vertebroplastia.
• 23 de 100 pacientes informaron éxito del tratamiento con un procedimiento placebo (falso).
6% más nuevas fracturas con vertebroplastia (2% menos a 14% más) o seis pacientes más de 100.
• 20 de 100 pacientes tuvieron una nueva fractura con vertebroplastia.
• 14 de 100 pacientes tuvieron una nueva fractura con un procedimiento placebo (falso) o atención habitual.
No más pacientes (4% menos a 4% más) presentaron eventos adversos graves con vertebroplastia; cambio relativo 1% más (79% menos a 385% más).
• 29 de 100 pacientes informaron efectos secundarios con vertebroplastia.
• 28 de 100 pacientes informaron efectos secundarios con un procedimiento placebo (falso).
Calidad de la evidencia
Pruebas de calidad moderada indican que la vertebroplastia no proporciona más efectos beneficiosos clínicamente importantes que un procedimiento placebo (falso). La calidad se disminuyó de alta a moderada debido al escaso número de ensayos y participantes. Pruebas de calidad moderada mantienen la incertidumbre acerca del efecto de la vertebroplastia sobre el riesgo de nuevas fracturas vertebrales u otros eventos adversos graves en comparación con placebo. Estudios de investigación adicionales pueden cambiar estas estimaciones del efecto.
Los eventos adversos graves que pueden ocurrir incluyen compresión de la médula espinal o de raíces nerviosas debido a la pérdida de cemento, émbolos de cemento en los pulmones y los grandes vasos, fracturas de costilla, osteomielitis, embolia grasa, lesión del saco tecal, complicaciones anestésicas y muerte.
Conclusiones de los autores
Summary of findings
| Vertebroplasty for osteoporotic vertebral compression fracture | ||||||
| Patient or population: people with osteoporotic vertebral compression fracture | ||||||
| Outcomes | Illustrative comparative risks* (95% CI) | Relative effect | No of Participants | Quality of the evidence | Comments | |
| Assumed risk | Corresponding risk | |||||
| Sham1 | Vertebroplasty | |||||
| Pain | The mean pain in the control groups was | The mean pain in the intervention groups was | 201 | ⊕⊕⊕⊝ | Absolute change 7% better (15% better to 1.5% worse); relative change 10% better (21% better to 2% worse); NNTB n/a2,3 | |
| Disability (Roland‐Morris Disability Questionnaire) | The mean disability in the control groups was | The mean disability in the intervention groups was | 201 | ⊕⊕⊕⊝ | Absolute change 4.8% better (12.8% better to 3.3% worse); relative change 6.3% better (17.0% better to 4.4% worse); NNTB n/a2,3 | |
| Disease‐specific quality of Life (QUALEFFO) | The mean quality of life (QUALEFFO) in the control groups was | The mean quality of life in the intervention groups was | 73 | ⊕⊕⊕⊝ | Absolute change 0.4% worse (5% worse to 5% better); relative change: 0.7% worse (9% worse to 8% better); NNT n/a2,3 | |
| Overall quality of Life (EQ5D) | The mean quality of life (EQ‐5D) in the control groups was | The mean quality of life in the intervention groups was | 201 | ⊕⊕⊕⊝ | Absolute change 5% better (1% worse to 11% better); relative change: 18% improvement (4% worse to 39% better); NNT n/a2,3 | |
| Participant global assessment of success (People perceived their pain as better) Follow‐up: 1 month | 225 per 1000 | 315 per 1000 | RR 1.40 | 78 | ⊕⊕⊕⊝ | Absolute risk difference 9% more reported success (11% fewer to 29% more); relative change 40% more reported success (33% fewer to 195% more); NNTB n/a2 |
| Incident vertebral fractures Follow‐up: 12 months | 138 per 1000 | 203 per 1000 | RR 1.47 | 281 | ⊕⊕⊕⊝ | Absolute difference 6% more new fractures with vertebroplasty (2% fewer to 14% more); relative difference 47% more (61% fewer to 450% more); NNTH n/a2 |
| Other serious adverse events | 28 per 1000 | 29 per 1000 | RR 1.01 | 209 | ⊕⊕⊕⊝ | Absolute difference no more events with vertebroplasty (4% fewer to 4% more); relative change 1% more (79% fewer to 385% more); NNTH n/a2 |
| *The basis for the assumed risk (e.g. the median control group risk across studies) is provided in footnotes. The corresponding risk (and its 95% confidence interval) is based on the assumed risk in the comparison group and the relative effect of the intervention (and its 95% CI). | ||||||
| GRADE Working Group grades of evidence | ||||||
| 1For incident vertebral fractures the comparison includes one sham trial and two trials that compared vertebroplasty versus usual care. 2 Number needed to treat to benefit (NNTB), or harm (NNTH) not applicable (n/a) when result is not statistically significant. NNT for dichotomous outcomes calculated using Cates NNT calculator (http://www.nntonline.net/visualrx/). NNT for continuous outcomes calculated using Wells Calculator (CMSG editorial office) 3 Relative changes calculated as absolute change (mean difference) divided by mean at baseline in the placebo group from Buchbinder 2009 (values were: 7.1 points on 0 to 10 point VAS pain; 17.3 points on 0 to 23 point Roland‐Morris Disability questionnaire; 0.28 points on EQ‐5D quality of life scale; 59.6 points on the QUALEFFO scale) 4 Downgraded due to imprecision: the 95% confidence intervals do not exclude a clinically important change (defined as 1.5 points on 0 to 10 point VAS pain scale; 2 to 3 points on the 0 to 23 point RDQ scale; 0.074 on the 0 to 1 EQ‐5D quality of life scale, and 10 points on the 0 to 100 QUALEFFO scale), or the total number of participants was small, from a single trial only 5 Total number of events small 6 Pooled both placebo and usual care comparisons in the safety analyses. | ||||||
Antecedentes
Descripción de la afección
Las fracturas vertebrales por compresión se encuentran entre el tipo más frecuente de fractura en los pacientes con osteoporosis (Ström 2011). La incidencia calculada informada de fracturas vertebrales osteoporóticas por compresión en los individuos de 50 años de edad o más es 307 por 100 000 años según un estudio alemán, con una tasa en las mujeres con edades entre 85 y 89 años casi ocho veces mayor que en las mujeres con edades entre 60 a 64 años (Hernlund 2013). El mismo estudio calculó que los costos directos asociados con una fractura vertebral osteoporótica nueva en el primer año después de su aparición son de aproximadamente 6490 euros, lo que significa que estas fracturas son costosas. Un estudio sueco calculó que el riesgo durante toda la vida de una fractura vertebral osteoporótica sintomática en una persona de 45 años de edad es del 15% para una mujer y del 8% para un hombre (Kanis 2000). En los EE.UU. se producen aproximadamente 750 000 fracturas vertebrales osteoporóticas nuevas cada año (Melton 1997).
Un estudio poblacional reciente que examinó las tendencias en la incidencia de fracturas con el transcurso del tiempo en el Condado de Olmstead, Minnesota, observó un aumento notable en la incidencia de fracturas vertebrales, desde 1989 a 1991 a 2009 a 2011, que se asoció con una evidente aparición más temprana de una fractura vertebral con el transcurso del tiempo (Amin 2014). La gran mayoría de estas fracturas (83,4%) se consideró osteoporótica, definida en el estudio como debida a un traumatismo no mayor que moderado (por convención, equivalente a una caída desde la altura de la posición de pie o menos). Aunque una parte del aumento observado se podría atribuir parcialmente a las fracturas vertebrales diagnosticadas de forma incidental, los hallazgos coinciden con un estudio holandés que observó un aumento en el número de visitas al departamento de urgencias debido a fracturas vertebrales osteoporóticas entre 1986 y 2008 debido a un aumento de las caídas entre las personas de edad más avanzada (Oudshoorn 2012). Los resultados también son consistentes con un estudio canadiense que observó una disminución en la tasa de todas las fracturas osteoporóticas por traumatismos leves durante 20 años desde 1986 a 2006 en la Provincia de Manitoba, excepto las fracturas vertebrales, que no descendieron de forma significativa en cualquiera de los sexos (Leslie 2011).
Las fracturas vertebrales osteoporóticas por compresión son una causa frecuente de dolor lumbar agudo y crónico en poblaciones de edad avanzada, aunque solamente cerca de un tercio de las deformidades vertebrales osteoporóticas radiográficas por compresión se presentan con dolor agudo. Las fracturas vertebrales osteoporóticas sintomáticas y asintomáticas pueden provocar deformidad significativa de la columna, limitación funcional, compromiso pulmonar y disminución de la calidad de vida. Se asocian con un mayor riesgo de fracturas vertebrales adicionales y un aumento de la mortalidad (Lau 2008).
Las opciones de tratamiento de las fracturas vertebrales osteoporóticas intensamente dolorosas son limitadas e incluyen la administración de analgesia adecuada, reposo en cama y fisioterapia, así como la evaluación y el tratamiento apropiados de la osteoporosis y los factores de riesgo de fracturas adicionales como la prevención de las caídas. Aunque la mayoría de las fracturas generalmente sanan en el transcurso de algunos meses, algunos pacientes presentan dolor persistente y discapacidad y requieren hospitalización, atención a largo plazo, o ambas (Kanis 1999).
Descripción de la intervención
La vertebroplastia percutánea se describió por primera vez en 1987 como un tratamiento para el angioma vertebral (Galibert 1987) y posteriormente se ha utilizado para tratar las fracturas vertebrales benignas y malignas. El procedimiento se puede realizar bajo sedación intravenosa o anestesia general por radiólogos intervencionistas, neurocirujanos o cirujanos ortopédicos. Bajo orientación con imaginología, con mayor frecuencia fluoroscopia, se inserta una aguja de gran calibre en el cuerpo vertebral afectado, generalmente por vía transpedicular, y se inyecta cemento óseo, generalmente polimetilmetacrilato (PMMA) (Hide 2004).
Los primeros estudios abiertos no controlados informaron de forma consistente mejorías notables inmediatas en el dolor y supuestamente los eventos adversos fueron poco frecuentes (Hochmuth 2006). A pesar de la falta de pruebas a partir de ensayos controlados aleatorios (ECA) de alta calidad que confirmaran los efectos beneficiosos, durante los últimos 20 años el procedimiento se ha incorporado a la atención estándar en muchas partes del mundo, y se reserva de forma más habitual para los pacientes en los que fracasa un período de tratamiento conservador. En los EE.UU. se han observado aumentos notables en el uso de la vertebroplastia durante los dos últimas décadas (Gray 2007a; Lad 2009; Leake 2011).
Los eventos adversos documentados que ocurren durante o después del procedimiento han incluido compresión de la médula debido a la expansión del cemento fuera del cuerpo vertebral, embolia pulmonar por cemento, infección, fracturas de costilla y nuevas fracturas vertebrales adyacentes o no adyacentes, osteolisis en el hueso que rodea el material inyectado y muerte (Leake 2011).
De qué manera podría funcionar la intervención
No se conoce el mecanismo por el cual la vertebroplastia percutánea se supone que alivia el dolor. Se han propuesto al menos tres mecanismos posibles: (1) estabilización mecánica del hueso fracturado; (2) destrucción térmica de las terminaciones nerviosas debido a la alta temperatura alcanzada durante la polimerización del cemento inyectado; y (3) destrucción química de las terminaciones nerviosas debido a la composición química del cemento (Belkoff 2001). En estudios post mortem se ha mostrado que la mezcla semisólida de PMMA restaura la fuerza y la rigidez de los cuerpos vertebrales (Belkoff 2001).
Por qué es importante realizar esta revisión
La vertebroplastia percutánea se ha adoptado ampliamente en la práctica clínica para tratar las fracturas vertebrales osteoporóticas por compresión dolorosas antes de contar con pruebas que apoyen su eficacia y seguridad a partir de ECA de alta calidad. El primer ECA de vertebroplastia en comparación con atención habitual se publicó en 2007 (Voormolen 2007). Desde entonces se han informado ECA adicionales, incluidos los dos primeros ensayos controlados con placebo publicados en 2009 (Buchbinder 2009; Kallmes 2009).
Aunque actualmente se han publicado numerosas revisiones sistemáticas o metanálisis de la vertebroplastia para las fracturas espinales osteoporóticas (Stevenson 2014; Anderson 2013; Liu 2013; Zhang 2013; Xing 2013; Ma 2012; Papanastassiou 2012; Shi 2012; Wang 2012; Zou 2012; Bliemel 2012; Robinson 2012; Han 2011; McGirt 2009; Lee 2009; Eck 2008; Gill 2007; Ploeg 2006; Taylor 2006; Hulme 2006; Trout 2006; Hochmuth 2006), han variado en los criterios de inclusión y el rigor metodológico y han presentado resultados contradictorios. Una revisión sistemática Cochrane que resuma las mejores pruebas disponibles sobre la eficacia y la seguridad de este procedimiento proporcionará información valiosa sobre la cual basar las decisiones clínicas y políticas.
Objetivos
Evaluar los efectos beneficiosos y perjudiciales de la vertebroplastia percutánea para tratar a los pacientes con fracturas vertebrales osteoporóticas por compresión.
Métodos
Criterios de inclusión de estudios para esta revisión
Tipos de estudios
Se incluyeron los ensayos controlados aleatorios (ECA) de cualquier diseño (p.ej. paralelo, alterno, factorial) y los ensayos clínicos controlados que utilizaron un método cuasialeatorio de asignación, como la alternancia o la fecha de nacimiento. Los informes de ensayos fueron elegibles independientemente del idioma o la fecha de publicación. Sólo se consideraron para inclusión los ensayos publicados como artículos completos o cuando había disponible un informe completo del ensayo.
Tipos de participantes
Se incluyeron los ensayos que reclutaron adultos con un diagnóstico de fractura/s vertebral/es osteoporótica/s por compresión de cualquier duración. El diagnóstico de osteoporosis se podría haber basado en la densitometría mineral ósea o en criterios explícitos de diagnóstico clínico tal como se definió en los estudios. Se excluyeron los ensayos que reclutaron participantes con fracturas vertebrales debido a otras causas como traumatismo importante y neoplasia maligna.
Tipos de intervenciones
Se incluyeron los ensayos que evaluaron la vertebroplastia percutánea, definida como la inyección percutánea de cemento óseo (generalmente polimetilmetacrilato [PMMA]) o sustancias similares en un cuerpo vertebral bajo orientación por imaginología.
Los comparadores podían ser cualquiera de los siguientes.
-
Placebo o procedimiento simulado
-
Atención habitual (mejor atención de apoyo)
-
Cifoplastia con balón (similar a una vertebroplastia percutánea, pero antes de la inyección de cemento en el hueso se inserta un balón en el cuerpo vertebral y se expande), u otros procedimientos similares
-
Tratamiento farmacológico (p.ej. calcitonina, bisfosfonatos, medicina complementaria)
-
Intervenciones no farmacológicas (p.ej. férula, fisioterapia o cirugía)
Tipos de medida de resultado
Resultados primarios
Los siguientes resultados fueron seleccionados como los más importantes.
-
Dolor general medio medido en una escala analógica visual (EAV) o una escala de calificación numérica (ECN)
-
Discapacidad medida por el Roland Morris Disability Questionnaire (RMDQ) u otra medida de discapacidad
-
Fractura vertebral o calidad de vida relacionada con la salud específica de la osteoporosis, p.ej. el Quality of Life Questionnaire of the European Foundation for Osteoporosis (QUALEFFO)
-
Calidad de vida relacionada con la salud general, p.ej. European Quality of Life with 5 Dimensions (EQ‐5D) o el cuestionario Assessment of Quality of Life (AQoL)
-
Éxito del tratamiento medido por una impresión global informada por el participante del cambio clínico (mucha o muchísima mejoría) o una medida similar
-
Nuevas (incidentes) fracturas vertebrales sintomáticas (el denominador fue el número de participantes, pero el numerador podría incluir más de una nueva fractura por participante)
-
Número de otros eventos adversos graves considerados debidos al procedimiento (p.ej. infección, complicaciones clínicas que aparecen debido a la pérdida de cemento)
Resultados secundarios
-
Proporción de participantes con mejoría del dolor en una magnitud clínicamente relevante, por ejemplo, mejoría de al menos 2,5 unidades o del 30% en una escala de 0 ó 1 a 10
-
Nuevas (incidentes) fracturas vertebrales radiográficas (el denominador fue el número de participantes, pero el numerador podría incluir más de una nueva fractura por participante)
-
Otros eventos adversos
Momento de la evaluación del resultado
Se extrajeron las medidas de resultado que evaluaron los beneficios del tratamiento (p.ej., dolor o función) en los siguiente puntos temporales:
-
una a dos semanas;
-
un mes;
-
dos a tres meses;
-
seis meses;
-
12 meses;
-
24 meses.
Si en un ensayo hubiera datos disponibles en múltiples puntos temporales de cada uno de los períodos anteriores (p.ej. a una y dos semanas), solamente se extraerían los datos del último punto temporal posible de cada período. Cuando estuvieron disponibles se extrajeron las nuevas fracturas vertebrales a los 12 y 24 meses. Se extrajeron otros eventos adversos en todos los puntos temporales.
Los resultados principales de la revisión se cotejaron en las tablas "Resumen de los hallazgos" que proporcionan información clave con respecto a la calidad de las pruebas y la magnitud y la precisión del efecto de las intervenciones. Se incluyeron los resultados principales (ver anteriormente) en las tablas "Resumen de los hallazgos" al mes para los resultados que evaluaron los efectos beneficiosos potenciales del tratamiento (dolor, discapacidad, fractura vertebral u osteoporosis, calidad de vida general y éxito de tratamiento), a los 12 meses para las nuevas fracturas vertebrales sintomáticas (la mayor cantidad de datos disponibles), y al mes para otros eventos adversos graves (que se consideró que estaban relacionados con el procedimiento).
Results
Description of studies
Results of the search
The search was conducted on the 12th November 2014.
The results of the search are presented in Figure 1. The search strategy identified more than 6000 records of which 31 were evaluated in full text to determine eligibility.

Study flow diagram.
There were 11 RCTs (Blasco 2012; Buchbinder 2009; Chen 2014; Dohm 2014; Farrokhi 2011; Kallmes 2009; Klazen 2010; Liu 2010; Rousing 2009; Vogl 2013; Voormolen 2007) and one quasi‐randomised trial (Endres 2012) that met inclusion criteria for this review. Six RCTs were registered in a trial registry (Blasco 2012; Buchbinder 2009; Dohm 2014; Farrokhi 2011; Kallmes 2009; Klazen 2010), although one was registered retrospectively (Farrokhi 2011). One RCT was stated to be registered on clinicaltrials.gov (NCT00576546) (Vogl 2013), but this could not be verified. No trial registration was found for the other five trials (Chen 2014; Endres 2012; Liu 2010; Rousing 2009; Voormolen 2007).
Three studies were excluded after full‐text assessment (Gilula 2013; Huang 2014; Yi 2014; ) see table of Characteristics of excluded studies).
An additional two papers were published protocols for RCTs (Longo 2010; (Firanescu 2011). Further details are unknown for one trial as we could not find any registration details (Longo 2010) (see table of Characteristics of ongoing studies), while the other one is reported to have been completed on clinicaltrials.gov as of 19 Nov 2014, but the results are not yet reported (see Characteristics of studies awaiting classification). An additional trial that appears to be unregistered has only been published as a conference abstract (Hao 2014) (also see Characteristics of studies awaiting classification).
Based upon a search of trial registries, we identified an additional five registered RCTs that are reported to have been completed but we were unable to find published results (Dolin 2003; Evans 2006; Laredo JD (OSTEO‐6); Laredo JD (STIC2); Sorensen 2005) (see table of Characteristics of studies awaiting classification). Another five registered RCTs are still recruiting participants (Carli D ('VERTOS V'); Clark W; Hansen EJ ('VOPE'); Nieuwenhuijse 2012; Sun 2012) and one registered RCT that is due to commence recruitment in 2015 (Zhao 2014) was also identified (see table of Characteristics of ongoing studies).
One additional registered trial is reported to have been suspended (Nakstad 2008) prior to completion (also see table of Characteristics of studies awaiting classification).
In summary, 11 RCTs and one quasi‐randomised trial have been included in this review, three studies were excluded, eight trials are awaiting classification, and seven trials are ongoing (including one that has not yet commenced).
Detailed descriptions of all unpublished trials that are either completed, suspended or ongoing are provided in either the table of Characteristics of studies awaiting classification or table of Characteristics of ongoing studies and a summary of all unpublished trials is provided in Table 1.
| Trial registration number | Principle Investigator/s and Country | Comparator/s | Main selection criteria | Registration date | Recruitment commenced | Status 24 November 2014 | Planned sample size | Final sample size |
| NCT01482793 | Clark W, Bird P Australia | Sham | Age > 60 years Fracture < 6 weeks | 28 Nov 2011 | Nov 2011 | Recruiting (last verified Nov 2011) | 120 | ‐ |
| NCT00749060 ‘OSTEO‐6’ | Laredo JD France | Kyphoplasty; Usual care with or without brace | Age ≥ 50 years Fracture < 6 weeks | 8 Sept 2008 | Dec 2007 | Completed June 2012; results unpublished | 300 | 48 |
| NCT00749086 ‘STIC2’ | Laredo JD France | Kyphoplasty | Age ≥ 50 years Fracture > 6 weeks | 8 Sept 2008 | Dec 2007 | Completed June 2012; results unpublished | 200 | 97 |
| NCT00635297 | Nakstad PH Norway | Vertebroplasty of fractured vertebra +/‐ additional vertebroplasty to adjacent vertebrae | Age > 50 years | 5 Mar 2008 | Apr 2008 | Suspended, reason not stated (last updated 2 Mar 2010) | 100 | ‐ |
| NCT00203554 | Sorensen L Denmark | Usual care | Fracture < 6 months | 16/09/2005 | Mar 2004 | Completed Jan 2008; results unpublished | 27 | 27 |
| ISRCTN14442024 (Also N0213112414) | Dolin, S UK | Usual care | Fracture > 4 weeks | 12 Sep 2003 | Nov 28 2005 | Completed (last updated 6 Feb 2014); results unpublished | Not provided | Not provided |
| chiCTR‐TRC‐14004835 | Zhao J, Liu B China | Ordinary vs high viscosity cement | Includes osteoporotic fractures, haemangiomas and metastatic disease | 23 Jun 2014 | Planned 1 Jan 2015 | Not yet recruiting | 100 | ‐ |
| NCT01677806 | Sun G China | Usual care | Age ≥ 50 years Fracture < 6 weeks | 23 Aug 2012 | Oct 2012 | Recruiting (last updated 7 Aug 2014) | 114 | ‐ |
| NCT01537770 (also EUCTR2010‐024050‐10‐DK ‘VOPE’ | Hansen EJ, Andersen MO, Rousing R, Tropp H Denmark | Lidocaine | Age > 50 years | 6 Jan 2011 | Feb 2012 | No longer recruiting (last updated 21 Oct 2014) | 80 | ‐ |
| NTR3282 | Nieuwenhuijse MJ Netherlands | Low vs high viscosity cement | ‐ | 14 Feb 2012 | Jan 2011 | Recruiting (last updated 21 July 2014) | 86 | ‐ |
| NCT01200277 ‘VERTOS IV’ | van Rooij HJ, De Vries J, Lohle PN Netherlands | Sham | Age ≥ 50 years Fracture ≤ 6 weeks | 7 Sept 2010 | Jan 2011 | Completed (last updated 19 Nov 2014) | 80 | ‐ |
| NCT00279877 | Evans A USA | Kyphoplasty | 18 Jan 2006 | May 2005 | Completed May 2011; results unpublished | 112 | Not provided | |
| Registration details not found. | Longo UG Italy | 3 weeks bed rest, rigid hyperextension corset, followed by 2‐3 months in a Cheneau brace (called ‘double‐blind) | Age ≥ 50 years | Trial registration not found | Unknown | Unknown (protocol published) | 200 | ‐ |
| NCT01963039 ‘VERTOS V’ | Carli D Netherlands | Sham | Age ≥ 50 years Fracture ≥ 12 weeks | 28 Aug 2013 | May 2013 | Recruiting (last updated Oct 2013)(protocol published) | 94 | ‐ |
| Registration details not found. Results published as conference abstract* | Hao, D, Guo, H, Wang, B, Wang X | Facet joint block | Age ≥55 years Fracture ≤ 8 weeks | Trial registration not found | Jan 2009 | Recruitment completed Jan 2013 | Not stated | 206 (100 in VP; 106 in facet block group) |
* Abstract reported that analysis favoured vertebroplasty at 1 day and 1 week for pain and disability measured by RMDQ and ODI but no between‐group differences at 1, 3, 6, 12 months for pain, RMDQ, ODI and SF‐36 function and SF‐36 physical and mental component scores. After 12 months follow‐up, there were 13 new fractures in the percutaneous vertebroplasty group and 11 new fractures in the facet joint block group. Abstract did not report method of randomisation, whether or not treatment allocation was concealed and whether or not participants and investigators were blinded to treatment allocation.
Included studies
A full description of all included trials is provided in the table of Characteristics of included studies and a summary of trial and participant characteristics is provided in Table 2.
| Study | Country | Treatment Groups | Mean age, yrs | Mean symptom duration | Mean (SD) baseline pain (0‐10 scale$) | Mean (SD) baseline RMDQ+ (0‐24 scale†) | Mean (SD) baseline QUALEFFO (0‐100 scale) | Procedures performed by | Mean (range) volume cement injected (mL) | Follow‐up |
| Spain | Vertebroplasty | 71.3 | 140.3 days | 7.2 (0.3) | ‐ | 65.2 (2.2) | Interventional radiologists | Not specified | 2 weeks, 2, 6, 12 months | |
| Usual care | 71.3 | 143.1 days | 6.3 (0.4) | ‐ | 59.2 (2.2) | |||||
| Australia | Vertebroplasty | 74.2 | 9 weeks^ | 7.4 (2.1) | 17.3 (2.8) | 56.9 (13.4) | Interventional radiologists | 2.8 (1.2 ‐ 5.5) | 1 week, 1, 3, 6, 12, 24 months | |
| Placebo | 78.9 | 9.5 weeks^ | 7.1 (2.3) | 17.3 (2.9) | 59.6 (17.1) | |||||
| China | Vertebroplasty | 64.6 | 31 weeks | 6.5 (0.9)& | 18.6 (1.8)#& | ‐ | Orthopaedic surgeons | 3.6 (3 ‐ 6) | 1 day, 1 week, 1, 3, 6, 12 months | |
| Usual care and brace | 66.5 | 29.5 weeks | 6.4 (0.9)& | 16.7 (1.3)#& | ‐ | |||||
| USA and Canada | Vertebroplasty | 75.7 | ‐¤ | ˜7.6µ | ‐ | ‐ | Interventional radiologists and neuroradiologists, orthopaedic surgeons, neuroradiologists | 4.0 (3.0 to 6.0)¢ | 7 days, 1, 3, 12 and 24 months | |
| Balloon kyphoplasty | 75.5 | ‐¤ | ˜7.6µ | ‐ | Not stated | 4.6 (3.4 to 6.0)¢ | ||||
| Germany | Vertebroplasty | 71.3 | ‐§ | 7.8 (0.9) | ‐ | ‐ | Orthopaedic surgeon | 3.1 (2 – 4) | Immediately, mean 5.8 months (range: 4 to 7) | |
| Balloon kyphoplasty | 63.3 | ‐§ | 9.0 (0.7) | ‐ | ‐ | Orthopaedic surgeon | 3.9 (3 – 5) | |||
| Shield kyphoplasty | 67.1 | ‐§ | 8.8 (1.5) | ‐ | ‐ | Orthopaedic surgeon | 4.6 (3 – 6) | |||
| Iran | Vertebroplasty | 72 | 27 weeks | 8.4 (1.6) | ‐ | ‐ | Neurosurgeons | 3.5 (1 ‐ 5.5) | 1 week, 2, 6, 12, 24, 36 months | |
| Usual care | 74 | 30 weeks | 7.2 (1.7) | ‐ | ‐ | |||||
| US, UK, Australia | Vertebroplasty | 73.4 | 16 weeks | 6.9 (2.0) | 16.6 (3.8) | ‐ | Interventional radiologists | 2.8 (1 ‐ 5.5)* | 3 days, 2 weeks, 1 month | |
| Placebo | 73.3 | 20 weeks | 7.2 (2.0) | 17.5 (4.1) | ‐ | |||||
| Netherlands, Belgium | Vertebroplasty | 75.2 | 29.3 days | 7.8 (1.5) | 18.6 (3.6)# | 58.7 (13.5) | Interventional radiologists | 4.1 (1 ‐ 9) | 1 day, 1 week, 1, 3, 6, 12 months | |
| Usual care | 75.4 | 26.8 days | 7.5 (1.6) | 17.2 (4.2)# | 54.7 (14.4) | |||||
| Taiwan | Vertebroplasty | 74.3 | 15.8 days | 7.9 (0.7) | ‐ | ‐ | Not stated | 4.9 (0.7) | 3 days, 6 months | |
| Balloon kyphoplasty | 72.3 | 17.0 days | 8.0 (0.8) | ‐ | ‐ | Not stated | 5.6 (0.6) | |||
| Denmark | Vertebroplasty | 80 | 8.4 days | 7.5 (2.0) | ‐ | ‐ | Orthopedic surgeons | Not specified | 3 months | |
| Usual care and brace | 80 | 6.7 days | 8.8 (1.2) | ‐ | ‐ | |||||
| Germany and USA | Vertebroplasty | 74 | ‐¥ | 8.5 (1.2) | ‐ | ‐ | Not stated | 4.0 (1.1) | 1 day, 3, 12 months | |
| Shield kyphoplasty | 80 | ‐¥ | 8.3 (1.1) | ‐ | ‐ | Not stated | 3.8 (0.7) | |||
| Netherlands | Vertebroplasty | 72 | 85 days | 7.1 (5 ‐ 9)+ | 15.7 (8‐24) | 60.0 (37 to 86)+ | Interventional radiologists | 3.2 (1.0 ‐ 5.0) | 2 weeks | |
| Usual care | 74 | 76 days | 7.6 (5‐10) | 17.8 (8‐22) | 60.7 (38 to 86) |
$1‐10 point scale used by Farrokhi 2011; +RMDQ: Roland Morris Disability Questionnaire; †modified RMDQ (0‐23 scale) used by Buchbinder 2009 and Kallmes 2009; ^ median duration of symptoms; ¤Not reported but symptom duration 6 months or less; µMean symptom duration reported graphically only; ¢Median and interquartile range;§Not reported but symptom duration 6 weeks or less; &Data only included for the 42/46 in VP group and 43/50 in the usual care group who completed 12‐month follow‐up in groups assigned to at baseline; #Disability significantly higher in the vertebroplasty group; *from n = 20 treated at Mayo (personal communication); ¥Not reported but at least 6 weeks of conservative treatment; +Only range provided.
Trial design
Two trials compared vertebroplasty with a sham procedure (Buchbinder 2009; Kallmes 2009), six trials compared vertebroplasty versus usual care/optimum pain management (Blasco 2012; Chen 2014; Farrokhi 2011; Klazen 2010; Rousing 2009; Voormolen 2007), while four trials compared vertebroplasty with different kyphoplasty techniques (Dohm 2014; Endres 2012; Liu 2010; Vogl 2013).
Trials were conducted in Australia (Buchbinder 2009), USA, Australia and UK (Kallmes 2009), the Netherlands (Klazen 2010; Voormolen 2007), Belgium Klazen 2010), Denmark (Rousing 2009), Iran (Farrokhi 2011), Spain (Blasco 2012), China (Chen 2014), Taiwan (Liu 2010), Germany (Endres 2012), USA and Canada (Dohm 2014), and Germany and the USA (Vogl 2013).
Trial duration varied from two weeks (Voormolen 2007) to three years (Farrokhi 2011). Five trials allowed cross‐over: Kallmes 2009 allowed blinded cross‐over to the alternate procedure at one month or later if adequate pain relief was not achieved; both Voormolen 2007 and Farrokhi 2011 allowed participants assigned to the control arm still in severe pain after two weeks to undergo vertebroplasty; and Blasco 2012 and Chen 2014 allowed participants in the conservative therapy group to be considered for vertebroplasty if there was no improvement in pain but the timing of this decision was not provided.
Trial participants
The 12 trials included 1458 randomised participants with trial sizes varying from 34 participants (Voormolen 2007) to 404 participants (Dohm 2014). In general, inclusion criteria for all trials were similar requiring a clinical history and imaging findings consistent with one or more acute osteoporotic vertebral fractures (see Characteristics of included studies table). Across all trials the majority of participants were female (see Table 2). Mean age of participants ranged between 63.3 and 80 years for the majority of trials but mean age was lower in Chen 2014 (mean age 65.5 years) and Endres 2012 (mean age 71.3, 63.3 and 67.1 years in the vertebroplasty, balloon and shield vertebroplasty groups respectively). Symptom duration varied across trials with mean duration ranging from around a week Rousing 2009 to more than six months Farrokhi 2011. Mean baseline pain and disability was also similar across trials although mean pain was below 7.0 in the usual care group of Blasco 2012 (mean 6.3), both arms of Chen 2014 (means 6.5 and 6.4 in the vertebroplasty and usual care arms respectively) and the vertebroplasty arm of Kallmes 2009 (mean 6.9).
Interventions
Details of interventions in each trial are presented in the Characteristics of included studies table. Vertebroplasty was performed by different specialists in the included trials: interventional radiologists in five trials (Blasco 2012; Buchbinder 2009; Kallmes 2009; Klazen 2010; Voormolen 2007), orthopaedic surgeons in three trials (Chen 2014; Endres 2012; Rousing 2009), neurosurgeons in one trial (Farrokhi 2011), a combination of interventional radiologists and neuroradiologists, orthopaedic surgeons and neurosurgeons in one trial (Dohm 2014), and the background of the interventionalist was not reported in two trials (Liu 2010; Vogl 2013). The procedure appeared to have been performed in a similar way across all trials. However in Dohm 2014, the majority of participants in both treatment arms (75.1% in the vertebroplasty group and 80.6% in the kyphoplasty group) had perioperative postural reduction in an attempt to correct vertebral deformity.
Mean cement volume ranged from 2.8 to 4.1 mL across six placebo and usual care controlled trials (Buchbinder 2009; Chen 2014; Farrokhi 2011; Kallmes 2009; Klazen 2010; Voormolen 2007) and was not specified in two trials (Blasco 2012; Rousing 2009). Mean cement volume ranged from 3.9 to 4.1 mL in the vertebroplasty groups compared with mean cement volume 3.8 to 5.6 mL in the kyphoplasty groups across three kyphoplasty controlled trials (Endres 2012; Liu 2010; Vogl 2013). Median cement volume was 4.0 mL in the vertebroplasty group compared with 4.6 mL in the kyphoplasty group in the fourth trial comparing vertebroplasty to kyphoplasty (Dohm 2014).
Two trials used a sham vertebroplasty control (Buchbinder 2009; Kallmes 2009). To simulate vertebroplasty in one trial, the same procedure as those in the vertebroplasty group was performed up to the insertion of the needle into the bone, at which point the vertebral body was gently tapped with a blunt stylet and bone cement was prepared to permeate the strong smell of the PMMA in the room (Buchbinder 2009). The sham procedure in the second placebo‐controlled trial was similar except that the vertebral body was not tapped with a blunt stylet (Kallmes 2009).
Six trials used variations on usual care as the comparator group (see Characteristics of included studies table). This included analgesics including acetaminophen, codeine, tramadol and/or opioids in all instances and these could be adjusted as needed. Three trials specified the use of non‐steroidal anti‐inflammatory drugs (NSAIDs) either in addition to analgesics or for those intolerant to opiate derivatives (Farrokhi 2011; Klazen 2010; Voormolen 2007). Two trials also prescribed calcitonin (Blasco 2012; Farrokhi 2011) and two also offered brace treatment (Chen 2014; Rousing 2009).
Four trials compared vertebroplasty with kyphoplasty (Dohm 2014; Endres 2012; Liu 2010; Vogl 2013). Dohm 2014, Liu 2010 and Endres 2012 compared vertebroplasty with balloon kyphoplasty. Endres 2012 also compared vertebroplasty with a shield kyphoplasty which instead of a balloon, uses specialised instrumentation to create a central cavity in the vertebral body and inserts a self‐expanding implant that controls the cement flow. Endres 2012 compared vertebroplasty with the same shield kyphoplasty.
Outcomes
Pain
All trials included at least one measure of pain, but its measurement varied across trials. Two trials specified pain over the preceding 24 hours (Farrokhi 2011; Kallmes 2009), one trial specified pain over the course of the previous week (Buchbinder 2009), and eight trials did not specify a time period (Blasco 2012; Chen 2014; Dohm 2014; Endres 2012; Klazen 2010; Liu 2010; Rousing 2009; Voormolen 2007. Vogl 2013 only reported baseline pain in their published trial report but measurement of pain (and disability assessed by the Oswestry Disability Index (ODI)) was referred to in a congress abstract of the same trial published in German; whether or not a time period was specified is not known.
Buchbinder 2009 measured overall pain, pain at rest and pain in bed at night, while Kallmes 2009 measured average back pain intensity. All remaining trials referred to pain or mean pain unqualified by additional descriptors.
All but two trials, included a measure of pain using either a 0 to 10 VAS or 0 to 10 numerical rating scale, although the descriptor for a score of 10 differed across trials (e.g. maximum pain (Blasco 2012), maximal imaginable pain (Buchbinder 2009), worst pain imaginable (Chen 2014), worst possible (Dohm 2014), pain as bad as could be (Kallmes 2009), worst pain ever (Klazen 2010), worse pain possible (Rousing 2009), worst pain in the patient's life (Voormolen 2007) and no descriptors specified (Liu 2010)). The pain scale investigated by Farrokhi 2011 measured pain on a 1 (no pain) to 10 (excruciating pain) VAS, while Endres 2012 did not specify the pain scale explicitly although it was likely to have been on a 0 to 100‐point scale (as mean baseline scores varied between 78.2 and 90).
Three trials also included a dichotomous measure of pain. Blasco 2012 measured the number of participants with moderate (pain ≥ 4) or severe (pain ≥ 7) pain at 12 months. Buchbinder 2009 reported the proportion of people with improvement of overall pain, pain at rest and pain in bed at night of ≥ 2.5 units as post‐hoc analyses performed at the request of the publishing journal (external reviewer request). Kallmes 2009 measured the proportion of participants with clinically important improvement in pain defined as at least 30% improvement.
Three trials also included other measures of pain. Kallmes 2009 included the Pain Frequency and Pain Bothersomeness Indices (each measured on a 0 to 4‐point scale, with higher scores indicating more severe pain). Klazen 2010 measured the number of pain‐free days (defined as days with a VAS score of three or lower) and Rousing 2009 included the Dallas Pain Questionnaire (DPQ), a 16‐item instrument that assesses four aspects of daily living affected by chronic back pain (day‐to‐day activities, work and leisure activities, anxiety and depression and social interest), measured as a percentage of pain interference in each of the four aspects (0% is no pain and 100% is pain all the time).
Disability
All except two trials (Blasco 2012; Liu 2010), included at least one measure of disability or function.
Five trials included the Roland Morris Disability Questionnaire (RMDQ) (Buchbinder 2009; Chen 2014; Kallmes 2009; Klazen 2010; Voormolen 2007), five trials included the ODI (Chen 2014; Dohm 2014; Endres 2012; Farrokhi 2011; Vogl 2013) (although no data were presented in Vogl 2013), and three trials included the physical function dimension of the SF‐36 (Dohm 2014; Kallmes 2009; Rousing 2009). In Dohm 2014, section 8, regarding sexual activity was removed from the ODI.
Kallmes 2009 also included the Study of Osteoporotic Fractures‐Activities of Daily Living (SOF‐ADL) scale and the proportion with clinically important improvement in disability (at least 30% improvement), while Rousing 2009 also included the Barthel Index and Farrokhi 2011 included ability to walk after one day.
Health‐related quality of life
All except five trials (Chen 2014; Endres 2012; Farrokhi 2011; Liu 2010; Vogl 2013), included a measure of health‐related quality of life.
Four trials included the Quality of Life Questionnaire of the European Foundation for Osteoporosis (QUALEFFO) (Blasco 2012; Buchbinder 2009; Klazen 2010; Voormolen 2007) as a vertebral fracture and/or osteoporosis‐specific measure.
Four trials included an overall measure of health‐related quality of life: two trials included the Mental Component Summary (MCS) subscale of the SF‐36 (Kallmes 2009; Rousing 2009), five trials included the European Quality of Life with 5 Dimensions (EQ‐5D) (Buchbinder 2009; Dohm 2014; Kallmes 2009; Klazen 2010; Rousing 2009) and one trial included the Assessment of Quality of Life (AQoL) (Buchbinder 2009).
Treatment success
Only one trial included a specific patient‐reported measure of treatment success. Buchbinder 2009 defined treatment success as 'moderately better' or 'a great deal better' for pain, fatigue and overall health on seven‐point ordinal scales, ranging from a 'great deal worse' to a 'great deal better'.
As described above, three trials included one or more investigator‐specified measures of treatment success as determined by the number of participants who achieved various thresholds of pain and/or disability improvement (Blasco 2012; Buchbinder 2009; Kallmes 2009).
Incident symptomatic and/or radiographically apparent vertebral fractures
Most trials recorded the occurrence of new symptomatic and/or radiologically apparent vertebral fractures.
Three trials reported the occurrence of both (Blasco 2012 up to 12 months; Buchbinder 2009 up to 24 months; Dohm 2014 up to 24 months).
Three trials reported new symptomatic vertebral fractures (Chen 2014 up to one year; Farrokhi 2011 up to 24 months); Voormolen 2007 up to two weeks) and two trials only reported occurrence of incident radiographic vertebral fractures (Klazen 2010 at one, three and 12 months; and Rousing 2009 at three and 12 months).
Liu 2010 reported new vertebral fractures but did not specify if they were symptomatic or only detected on imaging, and Vogl 2013 reported radiographic refractures and adjacent level fractures up to 12 months and whether or not these were symptomatic. Endres 2012 only reported upon new adjacent fractures up to six months, while Kallmes 2009 did not report occurrence of new vertebral fractures during the period of follow‐up.
Other adverse events
Adverse events, other than reporting of new symptomatic or asymptomatic vertebral fractures were variably reported across trials. Four trials made specific reference to presence/absence of other adverse events in both treated groups (Buchbinder 2009; Dohm 2014; Endres 2012; Kallmes 2009).
Blasco 2012 and Chen 2014 both reported on the presence/absence of clinical complications from cement leakage in the vertebroplasty‐treated group but did not report whether or not other adverse events occurred in either group; Farrokhi 2011, Klazen 2010 and Voormolen 2007 reported adverse events that occurred in the vertebroplasty‐treated group but did not report whether or not adverse events occurred in the usual care group. Rousing 2009 and Liu 2010 did not report presence/absence of other adverse events.
Excluded studies
One controlled trial was excluded because participants were not assigned treatment at random but rather the authors stated that a surgeon at the outpatient ward blindly chose one of three different treatment modalities (vertebroplasty, kyphoplasty or usual care) to ensure similar pre‐treatment age, symptoms, grade and level of spinal diseases among the patients (Yi 2014). In addition, the vertebroplasty and kyphoplasty groups were combined in the data analysis and separate data for the vertebroplasty group were not provided.
Another two trials were excluded as vertebroplasty was administered to both treatment groups, with a different cement type in each group (Gilula 2013; Huang 2014).
Risk of bias in included studies
Risk of bias assessment for each study is reported in the Characteristics of included studies table and summarised in Figure 2 and Figure 3.

Risk of bias summary: review authors' judgements about each risk of bias item for each included study.

Risk of bias summary: review authors' judgements about the risk of bias of the available evidence presented as percentages across all included studies.
Allocation
Two trials described adequate sequence generation and allocation concealment and were assessed as being at low risk of selection bias (Buchbinder 2009; Kallmes 2009). Dohm 2014 reported that randomisation was prepared by computer using a dynamic minimisation technique stratified by the number of prevalent vertebral fractures, aetiology and study centre, but treatment allocation was not concealed. Stratification by aetiology was unexplained as the selection criteria indicated that participants were included on the basis of osteoporotic fractures while fractures due to cancer and high‐energy trauma were excluded.
Two additional trials were also assessed as being at low risk of selection bias although allocation concealment was not explicitly reported (Farrokhi 2011; Klazen 2010). Farrokhi 2011 reported that the treatment assignment was kept in sealed envelopes. It is not clearly reported who prepared and opened the envelopes, but it is likely that allocation was concealed as they reported that neither the neurosurgeon (performing vertebroplasty) nor the physician (administering usual care) knew about the other study group and had no role in allocation. Klazen 2010 reported that an independent telephone operator allocated participants by telephone, therefore the allocation was likely concealed from the investigators.
Both Blasco 2012 and Liu 2010 reported that they prepared a computer‐generated random list but no information is provided regarding concealment of treatment allocation. Neither Chen 2014 nor Vogl 2013 described how randomisation was achieved or whether or not treatment allocation was concealed. In Rousing 2009, sealed envelopes containing the treatment allocation were prepared beforehand by the investigating surgeon and 'sorted randomly' and type of treatment was unknown to the patient and the investigators until after the patient had provided written consent. In Voormolen 2007, the patients were randomised in two groups by an independent central operator but no further information is provided regarding concealment of treatment allocation. Endres 2012 was assessed as being at high risk of selection bias with respect to random sequence generation as participants were reported to have been distributed quasi‐randomly into three groups and the method was not reported. It was judged to be at unclear risk of selection bias as the single investigator was not blinded to treatment allocation although participants were reported to be blinded and all procedures were performed under general anaesthesia.
Blinding
Two trials were judged to be at low risk of performance and detection bias for all clinical outcomes as they blinded participants and all study personnel other than the person performing the intervention (Buchbinder 2009; Kallmes 2009). However after the one month follow‐up, Kallmes 2009 was considered to be at high risk of performance bias because more participants in the placebo group crossed over (27/63, 36%) compared with the vertebroplasty group (8/68, 12%) by the three‐month follow‐up. Buchbinder 2009 was judged to be at high risk of bias for the one‐ and two‐year assessment of radiographically apparent incident fractures as it was not possible to blind radiologists to treatment allocation due to the opacity of the cement.
Seven trials were judged to be at high risk of performance and detection bias as participants and study personnel were aware of the treatment received (Blasco 2012; Chen 2014; Dohm 2014; Farrokhi 2011; Klazen 2010; Rousing 2009; Voormolen 2007). Liu 2010 was judged to be at unclear risk of detection bias for participant‐reported endpoints as it was unclear whether or not participants were blinded to treatment allocation. It was also judged to be at uncertain risk of bias for radiographic outcomes of vertebral height and kyphotic angle as while these were measured by technicians who were blinded to treatment allocation, it was not clear how variability of assessment was 'controlled via inter‐ and intra‐observer comparisons' (these outcomes were not reported in this review).
Vogl 2013 was judged to be at unclear risk of performance bias and low risk of detection bias for participant‐reported outcomes as participants were blinded to treatment allocation. However it was judged to be at high risk of detection bias for investigator‐reported outcomes as investigators were aware of treatment allocation. Endres 2012 was assessed as being at unclear risk of performance bias as participants, but not the single investigator, were blinded to treatment allocation, low risk of bias for self‐assessed outcomes as participants were blinded and another orthopaedic surgeon not involved in the primary surgery performed the final follow‐up, and high risk of bias for investigator‐reported outcomes as radiologic outcomes were analysed by the unblinded orthopaedic surgeon who performed all procedures as well as another radiologist (status of radiologist with respect to blinding not reported).
Incomplete outcome data
Three trials were assessed as at low risk for attrition bias (Buchbinder 2009; Farrokhi 2011; Kallmes 2009) while the others were either considered to be at unclear (Blasco 2012; Dohm 2014; Endres 2012; Klazen 2010; Liu 2010; Voormolen 2007) or high risk (Chen 2014; Rousing 2009; Vogl 2013).
Buchbinder 2009 had small and equal loss to follow‐up across treatment groups for shorter‐term benefit and safety outcomes although loss to follow‐up was greater when considering longer‐term outcomes. At two years, 29/38 (76%) and 28/40 (70%) had completed follow‐up in the vertebroplasty and sham groups respectively.
Kallmes 2009 had small and balanced loss to follow‐up across treatment groups up to one month.
Blasco 2012 was at unclear risk for attrition bias because while the proportion lost to follow‐up at 12 months was similar between groups (17/64 (27%) from the vertebroplasty group and 13/61 (21%) from the usual care group), the authors reported that the losses may not have been random, but related to worse pain in the usual care group.
Chen 2014 was judged to be at high risk of attrition bias as they performed a completers' analysis excluded 7/50 participants allocated to receive conservative care on the basis that four refused conservative treatment and decided to have vertebroplasty at the three‐month follow‐up and an additional three were lost to follow‐up. However while they stated that four participants in the vertebroplasty group were lost to follow‐up they appeared to include all 46 participants allocated to receive vertebroplasty in the analysis to 12 months.
Dohm 2014 had small and equal loss to follow‐up across treatment groups for shorter‐term efficacy and safety outcomes. However for the primary endpoints of new radiographic vertebral fracture at 12 and 24 months, loss to follow‐up was much greater. At 12 months 130/190 (68%) and 143/191 (75%) had completed follow‐up in the vertebroplasty and kyphoplasty groups respectively, while at 24 months complete follow‐up was 91/190 (48%) and 100/191 (52%) in the vertebroplasty and kyphoplasty groups respectively. While the reasons for loss to follow‐up were similar between groups, a higher proportion of those assigned to vertebroplasty (20/190; 11%) withdrew compared to the kyphoplasty group (11/191; 6%) and it is unclear if the reasons for withdrawal were systematically different.
In addition, seven participants who received vertebroplasty and four who received kyphoplasty underwent the alternate treatment for a subsequent vertebral fracture but the timing was not stated. An additional 70/88 (79.5%) participants with a new clinically recognised fracture underwent a subsequent vertebral augmentation during the trial ‐ it is implied that these participants received the same type of procedure as they had received as part of the trial. In all instances of spinal augmentation for a new vertebral fracture, the last observation before surgery was carried forward to later visits.
Endres 2012 was judged to be at unclear risk of attrition bias as data were unavailable for seven participants (two deaths and five participants who refused follow‐up although the treatment groups of these seven participants were not explicitly reported).
Klazen 2010 was judged to be at unclear risk of attrition bias as a greater number of participants completed one‐year follow‐up in the vertebroplasty group (86/101, 85%) compared with 77/101 (76%) in the usual care group and 15 (15%) participants in the usual care group received vertebroplasty.
Liu 2010 was judged to be at unclear risk for attrition bias because completeness of follow‐up was not explicitly reported.
Rousing 2009 was judged to be at high risk of attrition bias for several irregularities including failure to report baseline and follow‐up data for all participants.
Vogl 2013 was judged to be at high risk of attrition bias because of significant loss to follow‐up in both treatment arms (follow‐up complete at 12 months for 19 (68%) and 28 (57%) in the vertebroplasty and kyphoplasty groups respectively) and the reasons for missing data were not reported.
Voormolen 2007 was judged to be at unclear risk of bias as the treatment group of four participants excluded from the analysis due to refusal to complete two‐week follow‐up was not reported.
Selective reporting
Four trials were assessed as at low risk of reporting bias (Buchbinder 2009; Dohm 2014; Kallmes 2009; Klazen 2010), although Dohm 2014 included an additional outcome of time (in days) to new clinical vertebral fracture that was not pre‐specified.
Four trials were judged to be at unclear risk of bias because they did not appear to have been registered and did not publish a trial protocol (Chen 2014; Endres 2012; Liu 2010; Rousing 2009). In addition Chen 2014, only reported one‐day outcomes for mean pain.
Blasco 2012 was judged to be at unclear risk of reporting bias because adverse events were only reported for the vertebroplasty group and mean pain and quality of life and confidence intervals were reported graphically only. Voormolen 2007 was judged to be at unclear risk of bias because the number of participants with an incident clinical vertebral fracture was only reported for the vertebroplasty group and measures of variance were not reported for continuous outcomes.
Farrokhi 2011 was judged to be at unclear risk of reporting bias as it was unclear if any additional outcomes were measured and not reported.
Vogl 2013 was judged to be at high risk of report bias because in a published congress abstract of the same trial it was reported that pain intensity on a visual analogue scale (VAS) and disability assessed by the Oswestry Disability Index (ODI) were measured but only baseline pain was presented in the published paper. In addition the trial registration information could not be located.
Other potential sources of bias
No other sources of bias were detected for four trials (Blasco 2012; Buchbinder 2009; Kallmes 2009; Liu 2010).
Chen 2014 did not report on the number of 'prophylactic' vertebroplasties that were performed in the vertebroplasty group and did not specify a source of funding.
Dohm 2014 was sponsored by a device company which also contributed to study design, data monitoring, statistical analysis and reporting of results including manuscript authorship, paid for independent core laboratory and data safety‐monitoring board services, and terminated the study early.
Although Endres 2012 reported that there were no significant differences in baseline characteristics or planned vertebral treatment levels between treatment groups at baseline, participants in the vertebroplasty group appeared to be older on average than participants in the two other groups (71.3 versus 63.3 and 67.1 years in the balloon and shield vertebroplasty groups respectively). In addition, participants in the kyphoplasty groups also appeared to have worse pain and disability scores at baseline compared to the vertebroplasty group (vertebroplasty: 78.2 and 68.2; balloon kyphoplasty: 90.0 and 77.0; and shield kyphoplasty 88.16 and 75.7 respectively). They also did not state whether BioMedEs had any role in the study other than funding translation and copyediting.
Farrokhi 2011 noted that the trial was partially funded by Apadana Tajhizgostar Co., a distributor of medical devices, but its exact role in the trial was not explicitly reported.
Quality of life and disability were worse at baseline in the vertebroplasty group in Klazen 2010, which may have biased the results in favour of the vertebroplasty group. In addition, the role of COOK Medical (Bloomington, IN, USA), which provided an unrestricted grant, is not explicitly reported.
In the trial by Rousing 2009, baseline pain was higher in the usual care group (8.8 versus 7.5) and it was only measured in 17/24 and 19/25 participants in the usual care and vertebroplasty‐treated groups respectively. In addition, participants receiving usual care were hospitalised for longer (11.7 days versus 7.6 days); it is unclear if more pain medication and physiotherapy was offered, and how this would affect outcomes.
Vogl 2013 reported that Soteira Inc. (Natick, MA) funded the trial and provided the Cement Directed Kyphoplasty Systems but whether or not it had any other role in the trial was not explicitly reported.
In Voormolen 2007, eight participants withdrew after randomisation as they were not assigned to their preferred treatment (two in the vertebroplasty group and six in the usual care group). In addition, no specific source of funding was reported.
Effects of interventions
Benefits
1. Vertebroplasty versus placebo (sham)
The two placebo‐controlled trials were judged to be clinically homogenous with respect to baseline participant characteristics (see Table 2), allowing data to be pooled. The major outcomes for the primary comparison of vertebroplasty versus placebo (sham) is shown in summary of findings Table for the main comparison.
No between‐group differences in outcome were observed for any benefit outcome, with statistical heterogeneity considered not to be important (i.e. I2≤ 2%) for all pooled analyses, except for the one to two week pooled analysis for disability where the I2 was 33% indicating the presence of moderate statistical heterogeneity.
There was no significant between‐group differences with respect to mean pain at one to two weeks (205 participants) or one month (201 participants) based upon pooled data from the two placebo‐controlled trials (mean difference (MD) 0.12 [95% confidence interval (CI) ‐0.65 to 0.88] and MD ‐0.66 [95% CI ‐1.48 to 0.15] at one month respectively) (Analysis 1.1). At one month, mean pain was five points on a 0 to 10 scale with placebo and 0.7 points lower (1.5 lower to 0.15 higher) with vertebroplasty, an absolute pain reduction of 7% (15% better to 1.5% worse) and relative reduction of 10% (21% better to 2% worse) (summary of findings Table for the main comparison).
Based upon data from one trial (Buchbinder 2009), no between‐group differences in pain were observed up to 24 months follow‐up. There was also no between‐group differences in the proportion of participants who improved from baseline by 2.5 units or 30% or more at one month based upon data from two trials (61/105 versus 46/101 respectively, (risk ratio (RR) 1.27 [95% CI 0.97 to 1.66]) (Analysis 1.2).
There were no significant between‐group differences with respect to disability (both measured with the RMDQ [0 to 23 scale]) at one to two weeks (190 participants) or one month (187 participants) based upon pooled data from the two placebo‐controlled trials (MD 0.82 [95% CI ‐1.13 to 2.78] and MD ‐1.09 [95% CI ‐2.94 to 0.76] respectively)(Analysis 1.3). At one month, the mean RDMQ was 13.6 points in the placebo group and 1.1 points lower (2.94 lower to 0.76 higher) in the vertebroplasty group, an absolute improvement in disability of 4.8% (12.8% better to 3.3% worse) and relative improvement of 6.3% (17.0% better to 4.4% worse) (summary of findings Table for the main comparison). There was also no between‐group differences in RMDQ scores up to 24 months based upon data from one trial (Buchbinder 2009).
There was no significant differences between vertebroplasty and placebo with respect to vertebral fracture and/or osteoporosis‐specific health‐related quality of life measured by the QUALEFFO up to 24 months based upon data from one trial (73 participants) (Analysis 1.4), or in overall quality of life (measured with the EQ5D) based upon data from two trials (187 participants)(MD 0.05 [95% CI ‐0.01 to 0.11] at one month (Analysis 1.5), or up to 24 months based upon data from a single trial (Buchbinder 2009).
One trial found no between‐group difference in treatment success up to 24 months (Analysis 1.6).
2. Vertebroplasty versus usual care
The six trials that compared vertebroplasty with usual care included participants with similar levels of baseline pain and disability and gender distribution was also similar across trials (see Table 2). Although one trial included younger participants (Chen 2014), and the duration of symptoms varied from one week to six months, we judged that the trials were sufficiently clinically homogenous to allow data to be pooled. For analyses including Farrokhi 2011 we used SMD for pain as (Farrokhi 2011 used a 1 to 10 pain scale in comparison to all other trials that used a 0 to 10 pain scale), but back‐transformed the SMD to MD on a 0 to 10 scale by multiplying the SMD and 95% CIs by the standard deviation (SD) of pain at baseline from the control group of the Klazen 2010 trial (SD 1.6). For disability which included data for the RMDQ and ODI, we back‐transformed the SMD to MD on the RMDQ (0 to 24 scale) by multiplying the SMD and 95% CIs by the standard deviation (SD) of pain at baseline also from the control group of the Klazen 2010 trial (SD 4.2). In instances where analyses within a single data plot required a mix of MD and SMD analyses we have shown the SMD in the plots and present both the SMD and MD in the results. For clarity, we have indicated where the MD was back‐transformed from the SMD to MD (either because Farrokhi 2011 was included together with other trials in the same meta‐analysis for mean pain or because both RMDQ and ODI were included in the same meta‐analysis for disability).
Based upon data from up to five trials (520 participants), participants in the vertebroplasty group had greater improvement in mean pain compared with those in the usual care group at one to two weeks (five trials, 520 participants, SMD ‐1.07 [95% CI ‐2.01 to ‐0.14], back‐transformed MD ‐1.72 [95% CI ‐3.22 to ‐0.22]), one month (two trials, 277 participants, SMD ‐0.94 [95% CI ‐2.30 to 0.43], MD ‐1.75 [95% CI ‐2.92 to ‐0.58]), three months (five trials, 520 participants, SMD ‐0.90 [95% CI ‐1.59 to ‐0.21], back‐transformed MD ‐1.44 [95% CI ‐2.54 to ‐0.34]), six months (four trials, 466 participants, SMD ‐0.88 [95% CI ‐1.71 to ‐0.04], back‐transformed MD ‐1.41 [95% CI ‐2.74 to ‐0.06]) and 12 months (five trials, 505 participants, SMD ‐0.83 [95% CI ‐1.55 to ‐0.11], back‐transformed MD ‐1.33 [95% CI ‐2.48 to ‐0.18]) (Analysis 2.1). However there was considerable statistical heterogeneity across all pooled pain analyses with the I2 varying between 92% and 95%. Removing single trials from each analysis did not appreciably alter the results. At 24 months there was no between‐group difference in mean pain based upon one trial (77 participants, SMD ‐5.65 [95% CI ‐6.67 to ‐4.63], MD ‐0.45 [95% CI ‐0.90 to 0.01]).
There was no between‐group difference in the proportion of participants who reported moderate or severe residual pain at 12 months (vertebroplasty: 36% and 19%; usual care 34% and 18%, respectively) in one trial (Blasco 2012).
Based upon data from up to four trials (396 participants), improvement in disability also favoured the vertebroplasty group at one to two weeks (four trials, 387 participants, SMD ‐2.04 [95% CI ‐3.57 to ‐0.50], back‐transformed MD ‐8.57 [95% CI ‐15.00 to ‐2.10]), three months (four trials, 396 participants, SMD ‐1.90 [95% CI ‐3.76 to ‐0.04], back‐transformed MD ‐7.98 [95% CI ‐15.79 to ‐0.17]) and 24 months (one trial, 77 participants, SMD SMD ‐5.65 [95% CI ‐6.67 to ‐4.63], MD ‐12.00 [95% CI ‐12.94 to ‐11.06], but not one month (two trials, 271 participants, SMD ‐0.94 [95 CI ‐2.30 to 0.43], MD ‐2.05 [95% CI ‐2.56 to ‐1.54], six months (three trials, 354 participants, SMD ‐1.69 [95% CI ‐3.55 to 0.17], back‐transformed MD ‐7.10 [95% CI ‐14.91 to 0.18]) or 12 months (four trials, 389 participants, SMD ‐1.26 [95% CI ‐2.61 to 0.08], back‐transformed MD ‐5.29 [95% CI ‐10.96 to 0.76]). Significant statistical heterogeneity was also present for all analyses (I2 ranging from 96% to 98%).
There was no significant between‐group differences with respect to vertebral fracture or osteoporosis‐specific quality of life at any time point measured by the QUALEFFO, based upon data from up to three trials (one to two weeks: three trials, 341 participants, MD ‐4.01 [95% CI ‐11.77 to 3.75], one month: one trial, 182 participants, MD ‐4.21 [95% CI ‐8.86 to 0.44], three months: two trials, 308 participants, MD ‐1.61 [95% CI ‐8.10 to 4.88], six months: two trials, 308 participants, (MD ‐0.83 [95% CI ‐6.48 to 4.83], and 12 months: two trials, 308 participants, MD ‐0.46 [95% CI ‐5.09 to 4.18])(Analysis 2.3). Statistical heterogeneity varied from unimportant to considerable across different time points (I2 varying between 22% and 75%).
Overall quality of life measured by the EQ‐5D marginally favoured the vertebroplasty group at one to two weeks (one trial, 183 participants, MD 0.08 [95% CI 0.00 to 0.15]), one month (one trial, 183 participants, MD 0.09 [95% CI 0.01 to 0.16]), and three months (two trials, 215 participants, MD 0.10 [95% CI 0.00 to 0.20]), but not six months (one trial, 183 participants, MD 0.07 [95% CI ‐0.02 to 0.15]) or 12 months (two trials, 215 participants, MD 0.07 [95% CI ‐0.00 to 0.14])(Analysis 2.4). Statistical heterogeneity was unimportant for the pooled analyses (I2 0% to 22%). Treatment success was not reported in any of the trials comparing vertebroplasty with usual care.
3. Vertebroplasty versus kyphoplasty
No efficacy data relevant to this review could be extracted from Vogl 2013. The aim of this trial was to compare leakage rates between treatment groups and only vertebral height and wedge angle were measured as efficacy outcomes. Only one of the four trials reported an a priori sample size calculation (Dohm 2014). However this trial was terminated after recruiting 404 of the planned sample size of 1234 participants.
Based upon one trial (100 participants) (Liu 2010), there was no between‐group difference in pain three days following treatment with either vertebroplasty or balloon kyphoplasty (three‐day pain (SD) 0 to 10 point VAS scale: 2.3 (0.5) and 2.6 (0.6) respectively, MD ‐0.30 [95% CI ‐0.08 to ‐0.52], data not shown). Based upon data from two trials (141 participants) (Endres 2012; Liu 2010), there was no between‐group difference with respect to mean pain at six months following treatment with either vertebroplasty or balloon kyphoplasty (MD ‐0.08 [95% CI ‐0.41 to 0.24] (Analysis 3.1). This was consistent with the observed lack of between‐group difference in pain at two weeks, one, three, 12 and 24 months in Dohm 2014 (Analysis 3.1).
Based upon one trial (404 participants)(Dohm 2014), there was no between‐group difference in degree of improvement in disability at one, three, 12 or 24 months (Analysis 3.2). For example, at one month (mean (SD) ODI (0 to 100 scale, lower scores indicate less disability): vertebroplasty 34.6 (17.6), kyphoplasty: 36.2 (19.8), MD ‐1.60 [95% CI ‐5.70 to 2.50]). Based upon one trial (66 participants) (Endres 2012), the degree of improvement in disability at six months favoured balloon kyphoplasty over vertebroplasty (mean (SD) ODI: balloon kyphoplasty: 43.1 (19.5), vertebroplasty: 53.1 (8.5), MD ‐10.00 [95% CI ‐0.71 to ‐19.29], data not shown)), however at baseline, participants in the balloon kyphoplasty were more disabled (mean (SD) baseline ODI: 77.0 (4.2) compared with 68.2 (5.7) in the vertebroplasty group). No difference between vertebroplasty and shield kyphoplasty was observed (mean (SD) baseline and six‐month ODI in the shield kyphoplasty group: 75.7 (9.1) and 56.1 (7.6) respectively; MD ‐3.00 [95% CI ‐8.05 to 2.05], data not shown).
Based upon one trial (404 participants) (Dohm 2014), there was also no between‐group difference in degree of improvement in overall quality of life at one, three, 12 or 24 months (Analysis 3.3). For example, at one month (mean (SD) EQ‐5D: vertebroplasty 0.71 (0.19), kyphoplasty: 0.7 (0.19), MD 0.01 [95% CI ‐0.03 to 0.50]).
Harms
1. Vertebroplasty versus placebo (sham) or usual care
New clinically apparent and new radiographic fractures
Based upon three trials (control group was placebo for one trial and usual care for the other two trials), there were more new clinically apparent vertebral fractures at 12 months in the vertebroplasty group (28 fractures in 143 participants (19.6%)) in comparison with the control group (19 fractures in 138 participants (13.8%)), but this was not statistically significant (RR 1.47 [95% CI 0.39 to 5.50]). There was substantial statistical heterogeneity (I2 73%). Apart from different comparators, the trials also varied in terms of the age of participants (average age was younger in one trial) and symptom duration which varied from a mean of nine to 20 weeks.
There was no appreciable between‐group difference in numbers of clinically apparent vertebral fractures at 24 months (vertebroplasty: 15 fractures in 67 participants (22.4%), control: 19 fractures in 67 participants (28.4%); RR 0.54 [95% CI 0.09 to 3.38]), based upon two trials (control was placebo for one trial and usual care for one trial) (Analysis 4.1). There was also substantial heterogeneity for this analysis (I2 69%). Apart from different comparators, the trials only appeared to differ with respect to symptom duration of participants (median 9 to 9.5 weeks in one trial and mean 27 to 30 weeks in the other trial).
There were no between‐group differences in the number of new radiographic vertebral fractures at 12 months based upon four trials (vertebroplasty: 63 fractures in 205 participants (30.7%), control: 47 fractures in 192 participants (24.5%); RR 1.43 [95% CI 0.55, 3.74] (control was placebo in one trial and usual care in three trials), or 24 months based upon one placebo‐controlled trial (vertebroplasty: 17 fractures in 23 participants (73.9%), 10 fractures in 20 participants (50%); RR 1.48 [95% CI 0.90 to 2.44], (Analysis 4.2). There was considerable statistical heterogeneity in the 12‐month pooled analysis (I2 84%). Similar to the above analyses, other than the comparators, participants in the individual trials differed mainly with respect to symptom duration (ranging from mean duration of less than a week to 20 weeks).
Serious other adverse events
Only data from the two placebo‐controlled trials (Buchbinder 2009; Kallmes 2009) could be pooled. Based upon these trials, there were no significant between‐group differences in the number of serious other adverse events (vertebroplasty 3/106, placebo: 3/103; RR 1.01 [0.21 to 4.85]. However, several trials reported serious adverse events related to vertebroplasty.
Buchbinder 2009 reported that three participants reported new rib fractures (one in the vertebroplasty group and two in the placebo group) and one participant who received vertebroplasty developed an adjacent new fracture and osteomyelitis requiring surgical drainage and antibiotic therapy. Nine other adverse events were reported in the vertebroplasty group up to one month (chest pain (three participants), pain or burning in thigh or leg (three participants), tightness in the back or rib cage (one participant), stomach pain (one participant), increased pain or muscle cramping around puncture site (one participant)) compared to one in the placebo group (pain or burning in thigh or leg (one participant)).
Kallmes 2009 reported that one participant in the vertebroplasty group had an injury to the thecal sac during the procedure requiring hospitalisation while one participant in the placebo group was also hospitalised overnight due to tachycardia and rigors of unknown cause.
Klazen 2010 reported that two participants required atropine because of pain‐induced vasovagal reactions during the vertebroplasty procedure and a third participant developed an acute asthma exacerbation that led to stopping the procedure, although it was successfully completed one week later. These data could not be included in the pooled analysis as no adverse event data were reported for the usual care group. They also reported that asymptomatic cement leakage occurred in 97 of the 134 treated vertebrae (72%); most leakages were discal or into segmental veins and in one participant there was asymptomatic cement migration towards the lungs.
Voormolen 2007 reported that one participant in the usual care group who crossed over and received vertebroplasty after two weeks developed acute pain following the procedure due to an intrapedicular cement spur that broke upon manipulation by the bone biopsy needle causing a small cortical chip fracture at the medial border of the pedicle.
Farrokhi 2011 reported that one participant who received vertebroplasty developed severe right lower extremity pain and weakness due to epidural cement leakage which required immediate decompression through a bilateral laminectomy and evacuation of bone cement. After two months there was no radicular pain and the participant could walk unassisted. They reported that there were no instances of venous emboli or infection.
Blasco 2012 reported that asymptomatic cement leakage into the veins/discs during vertebroplasty occurred in 49% of procedures.
Chen 2014 reported that asymptomatic cement leakage occurred in 36 out of 69 (52%) treated vertebrae: intervertebral disc in eight participants (22%), puncture path in seven participants (19%), paravertebral space in nine participants (25%) and venous leakage in 12 particIpants (33%). There was asymptomatic cement migration into the venous system towards the lungs in two participants (2.9%).
2. Vertebroplasty versus kyphoplasty
New clinically apparent and radiographic fractures
Dohm 2014 reported 50/190 new clinically apparent vertebral fractures among participants who received vertebroplasty and 38/191 among those who received kyphoplasty over the course of the trial [RR 1.32 (95% CI 0.91 to 1.92]) (Analysis 5.1). Seventeen new clinical fractures were reported to have occurred within 30 days of vertebroplasty and nine within 30 days of kyphoplasty. One participant developed a new symptomatic vertebral fracture within two days of receiving vertebroplasty at the level below the procedure associated with inferior cement leakage, and it was considered to be possibly bone cement‐related.
Dohm 2014 reported no between‐group difference in new radiographic fractures at either 12 or 24 months following treatment with either vertebroplasty or kyphoplasty. At 12 months there were reported to be 57/131 new radiographic vertebral fractures in the vertebroplasty group and 50/140 in the kyphoplasty group (RR 1.22 [95% CI 0.91 to 1.64]). At 24 months there were reported to be 64/111 new radiographic vertebral fractures in the vertebroplasty group and 54/110 in the kyphoplasty group (RR 1.17 [95% CI 0.92 to 1.51]) (Analysis 5.2). The denominators reported in both these analyses differed from the numbers reported to have completed 12 and 24 month follow‐up in both groups according to the flow diagram in the published reported (130 and 91 participants in the vertebroplasty group and 143 and 100 in the kyphoplasty group respectively).
Endres 2012 reported that there were no adjacent vertebral fractures in any of the three treatment groups (vertebroplasty, balloon or shield kyphoplasty) up to six months.
Vogl 2013 reported that one participant in the shield kyphoplasty group experienced a symptomatic refracture at the treated level (and was retreated with vertebroplasty), while there were no refractures in the vertebroplasty group up to 12 months. They also reported that three adjacent level fractures were detected in one participant in the vertebroplasty group (3/39 levels treated, 7.7%) compared with two adjacent fractures in two participants (2/65 levels treated, 3.1%) in the kyphoplasty group up to 12 months.
Serious other adverse events
One trial reported serious other adverse events occurring with both vertebroplasty and kyphoplasty.
Dohm 2014 reported device/procedure/anaesthesia‐related (or possibly related) adverse events among 11 participants in the vertebroplasty group and 12 in the kyphoplasty group. Most of these occurred within 30 days of the procedures. Adverse events considered to be serious and related (or possibly related) to the anaesthesia included constipation (one kyphoplasty), procedural hypotension (one kyphoplasty), nausea/vomiting (one kyphoplasty), hypersensitivity (one vertebroplasty), postoperative change in mental status (one vertebroplasty), hallucination (one kyphoplasty), exacerbation chronic airways disease (one kyphoplasty), hypoxia (one vertebroplasty), and respiratory failure (one vertebroplasty). Adverse events considered serious and bone cement‐related (or possibly related) included symptomatic cement embolism (one in each group). Three participants in each group had procedural pain considered to be device‐related (or possible related) adverse events (4/4 and 2/3 were judged as serious events in the vertebroplasty and kyphoplasty groups respectively). Other adverse events reported to be considered serious and device‐related (or possible related) included spinal fracture (one kyphoplasty), symptomatic vertebral fracture (two vertebroplasty, one kyphoplasty) (the distinction between these two adverse events was not clear), back pain (three vertebroplasty, two kyphoplasty), arthralgia (one kyphoplasty) and muscle spasm (one kyphoplasty).
Additionally, one participant who received vertebroplasty developed implant site extravasation into the spinal canal considered non serious. A computed tomography (CT) scan demonstrated no significant canal stenosis and the participant required no medical intervention. One participant who received vertebroplasty also developed a haematoma, considered non serious and possibly related to the procedure as a result of lying prone on the operating table. No deaths were noted as device‐ or procedure‐related.
Endres 2012 reported that no clinically relevant adverse events were observed in any of the three treatment groups. No clinically relevant complications arose from cement leakage in any of the three treatment groups and there were no significant differences in cement leakage between groups (vertebroplasty: four lateral and four disc leakages; balloon kyphoplasty: three lateral and one disc; shield kyphoplasty: one disc).
Vogl 2013 reported that two participants treated with vertebroplasty and four treated with shield kyphoplasty died during the course of the trial from causes unrelated to the interventions. No clinically relevant complications (or symptoms) were reported to have arisen from cement leakage in either treatment group. Shield kyphoplasty was reported to have resulted in significantly fewer cement leaks overall (six levels had multiple leaks with 42 total leaks compared with 12 levels with multiple leaks, total 54 leaks in the vertebroplasty group, P value reported 0.0132) and cement leaks per level (data only showed graphically in percentages, P value 0.0012), compared with the vertebroplasty group.
Subgroup Analysis
Data from the two placebo‐controlled trials were available for subgroup analysis comparing participants with pain duration ≤ 6 weeks versus > 6 weeks. Duration of pain did not influence outcome. In particular no differences were observed for pain duration ≤ 6 weeks versus > 6 weeks with respect to pain at one to two weeks (Analysis 6.1) or one month (Analysis 6.2), disability at one to two weeks (Analysis 6.3) or one month (Analysis 6.4) or quality of life at one month (Analysis 6.5).
Sensitivity Analyses
Sensitivity analyses confirmed that results varied widely when open trials comparing vertebroplasty with usual care were included in the analysis. While there was no significant between‐group difference in pain at one to two weeks when the analysis included all trials combined (seven trials, 725 participants, SMD ‐0.43 [95% CI ‐0.91, 0.06], back‐transformed MD ‐0.69 [95% CI ‐1.46 to 0.10], I2 90%), the analysis favoured the vertebroplasty group for pain at one month (four trials, 478 participants, SMD ‐0.91 [95% CI ‐1.71, ‐0.12], I2 94% and MD ‐1.32 [95% CI ‐2.05 to ‐0.59], I2 74%) and three months (five trials, 593 participants, SMD ‐0.79 [95% CI ‐1.38 to ‐0.20], back‐transformed MD ‐1.26 [95% CI ‐2.21 to ‐0.32], I2 91%).
Analyses including all trials combined, disability favoured vertebroplasty over control at one month (MD ‐1.26 [95% CI ‐2.51, ‐0.00], four trials, 472 participants, I2 57%), but not at one to two weeks (MD ‐1.60 [95% CI ‐3.32, 0.12], five trials, 510 participants, I2 = 81%) or three months (MD ‐1.64 [95% CI ‐3.52, 0.24], four trials, 344 participants, I2 74%).
Discusión
Resumen de los resultados principales
En comparación con placebo (simulado), pruebas de calidad moderada a partir de dos ensayos (209 participantes asignados al azar) indican que la vertebroplastia no proporciona efectos beneficiosos clínicamente importantes con respecto al dolor, la discapacidad, la calidad de vida o el éxito de tratamiento hasta el mes (Resumen de los hallazgos para la comparación principal). Los análisis de subgrupos indicaron que los resultados no difirieron según la duración del dolor ≤ seis semanas versus > seis semanas, pero los pequeños tamaños de la muestra y el escaso número de estudios podrían haber limitado el poder de los análisis de subgrupos. La calidad de las pruebas se disminuyó de alta a moderada debido a la falta de precisión.
Según pruebas de calidad moderada de dos ensayos controlados con placebo y un ensayo con un comparador atención habitual (281 participantes), no hay certeza de si la vertebroplastia aumenta o no el riesgo de fracturas vertebrales sintomáticas incidentes hasta los 12 meses. El número total de eventos fue pequeño y los intervalos de confianza del 95% fueron suficientemente amplios para concluir que no se puede excluir un aumento del riesgo clínicamente importante.
De manera similar, según las pruebas de calidad moderada de dos ensayos controlados con placebo (209 participantes), no hay certeza acerca del riesgo exacto de otros eventos adversos graves por la misma razón. En particular, varios ensayos informaron eventos adversos graves relacionados con la vertebroplastia que incluyeron osteomielitis que requirió drenaje quirúrgico, fracturas de costilla y pedículo, lesión del saco tecal, reacciones vasovagales, exacerbación del asma aguda, compresión de la médula que requirió descompresión inmediata, hipoxia e insuficiencia respiratoria.
El resumen de los datos disponibles de seis ensayos que compararon la vertebroplastia con la atención habitual en un diseño abierto (566 participantes), generalmente favoreció a la vertebroplastia con respecto al dolor en todos los puntos temporales, pero favoreció de manera inconsistente a la vertebroplastia con respecto a la discapacidad (es decir, solamente de una a dos semanas, a los tres y 24 meses y no al mes, a los seis meses o a los 12 meses). Además, hubo considerable heterogeneidad estadística entre estos análisis, aunque se consideraron suficientemente homogéneos para permitir el agrupamiento. Los seis ensayos incluyeron participantes con niveles similares de dolor y discapacidad al inicio y en cuanto a la distribución de los géneros, aunque un ensayo incluyó participantes más jóvenes y la duración de los síntomas varió desde una semana a seis meses. La inclusión de estos datos en análisis de sensibilidad junto con los datos de ensayos controlados con placebo también alteró de forma inconsistente los resultados primarios a favor de la vertebroplastia para el dolor al mes y los tres meses, pero no de una a dos semanas y la discapacidad de una a dos semanas pero no al mes o los tres meses. Todos los análisis combinados mostraron heterogeneidad significativa a considerable.
El resumen de los datos disponibles de tres ensayos que compararon la vertebroplastia con cifoplastia con balón (545 participantes) indicó resultados similares con respecto al dolor hasta dos años después del tratamiento. Un ensayo no informó diferencias entre los grupos con respecto a la discapacidad hasta dos años después del tratamiento, mientras que los resultados superiores con respecto a la discapacidad a los seis meses con la cifoplastia informados por un segundo ensayo se podrían explicar por los desequilibrios iniciales. No se pudieron extraer datos de eficacia de un cuarto ensayo. No hubo diferencias detectables entre los grupos con respecto a las fracturas vertebrales radiográficas o sintomáticas incidentes, las fracturas adyacentes u otros eventos adversos graves.
Compleción y aplicabilidad general de las pruebas
Esta revisión estuvo limitada a las pruebas aportadas por 11 ensayos controlados aleatorios (ECA) publicados realizados en diversos países, para evaluar los efectos de la vertebroplastia en comparación con placebo (simulado) (dos ensayos), atención habitual (seis ensayos) o cifoplastia con balón o placa (tres ensayos).
Siete ECA que eran potencialmente elegibles para su inclusión en esta revisión no se incluyeron debido a que sus resultados aún no se han informado en su totalidad. Los resultados de un ECA que comparó vertebroplastia con bloqueos de la articulación de la carilla solamente se ha informado como un resumen de congreso hasta el momento (Hao 2014). Según el resumen, los resultados favorecieron a la vertebroplastia al día y a la semana, pero no hubo diferencias entre los grupos en cualquier resultado de eficacia (dolor, discapacidad medida por el RMDQ, ODI y SF 36 para la función física, o SF 36 para la función mental) al mes, tres, seis o 12 meses, lo que coincide con el resultado primario de la presente revisión. Después de los 12 meses de seguimiento, hubo 13 nuevas fracturas en el grupo de vertebroplastia percutánea y 11 nuevas fracturas en el grupo bloqueo de la articulación de la carilla. Sin embargo, el resumen no informó el método de asignación al azar, si se ocultó la asignación al tratamiento y si los participantes y los investigadores se cegaron a la asignación al tratamiento. Otro ensayo Firanescu 2011), completado el 19 de noviembre de 2014, incluyó un grupo control placebo (simulado) y, por lo tanto, sus resultados también podrían influir en el análisis primario de esta revisión. Otros cuatro ensayos se completaron hace más de dos años, mientras que la fecha de finalización de otro ensayo se desconoce. Tres ensayos incluyeron un grupo de comparación atención habitual y tres incluyeron un grupo de comparación cifoplastia y la inclusión de los resultados de estos ensayos puede alterar las conclusiones de la segunda y tercera comparaciones (vertebroplastia en comparación con atención habitual o cifoplastia respectivamente).
Otros dos ECA, uno que tuvo un brazo de comparación cifoplastia y uno que evaluó la vertebroplastia de la vértebra fracturada, con o sin vertebroplastia adicional de las vértebras adyacentes, informaron haberse suspendido o terminado pero no han publicado los resultados. Otros seis ensayos están actualmente en curso y uno está a punto de comenzar el reclutamiento. De estos ensayos, dos ECA utilizan un control placebo (simulado), dos comparan cemento de viscosidad baja o estándar con cemento de viscosidad alta, mientras que otros ensayos individuales comparan vertebroplastia con inyección con lidocaína sola, atención habitual o tres semanas de reposo en cama con un corsé rígido de hiperextensión seguidas de dos a tres meses en una férula de Cheneau.
Las vertebroplastias fueron realizadas por radiólogos intervencionistas o neuroradiólogos, cirujanos ortopédicos o neurocirujanos entre los diferentes ensayos; sin embargo, el procedimiento en sí pareció similar. La media de cemento inyectado también fue similar entre los nueve ensayos que informaron estos datos. Las poblaciones de estudio en todos los ensayos incluidos parecieron ser representativas de los pacientes que consultan en la atención habitual. Las proporciones en cuanto a edad y sexo fueron similares entre todos los ensayos, excepto Chen 2014, que incluyó una población de estudio más joven. Sin embargo la duración de los síntomas varió mucho entre los ensayos, lo que refleja diferentes filosofías sobre cuándo se debe realizar la vertebroplastia. Algunos autores han indicado que solamente se les ofrezca la vertebroplastia a los pacientes con aparición reciente del dolor (< seis semanas)Bono 2010). Los análisis de subgrupos de la presente revisión, así como el resultado de un metanálisis de datos de pacientes individuales de los mismos dos ensayos(Staples 2011), indican que el resultado del tratamiento no está influenciado por la duración del dolor ≤ seis semanas versus > seis semanas. Lo anterior apoya la decisión de incluir todos los ensayos en los análisis agrupados, independientemente de la duración de los síntomas.
Ningún ensayo midió el dolor exactamente de la misma manera. Aunque todos los ensayos incluyeron una medida continua de dolor (nueve utilizaron una escala de 0 a 10, uno utilizó una escala de 1 a 100 y uno utilizó una escala de 1 a 10), difirieron o no en el período especificado y hubo descripciones variables del dolor, en particular al caracterizar una puntuación de 10, y no hubo dos ensayos que utilizaran exactamente el mismo descriptor. Solamente tres ensayos incluyeron una medida dicotómica de dolor. Este hecho puede explicar parte de la heterogeneidad estadística observada en los análisis agrupados, aunque se observó heterogeneidad estadística similar en los análisis agrupados de la discapacidad que utilizaron las mismas medidas de resultado. En un estudio que incluyó pacientes que experimentaban un procedimiento de aumento espinal, Khosla 2010 encontró que algunos modificadores como la gravedad relativa (más grave versus menos grave) y la actividad (en reposo versus ninguna actividad) podrían dar lugar a una variación amplia en el dolor informado, mientras que preguntar acerca del dolor durante el día anterior versus la semana anterior tuvo una repercusión mínima.
Todos los ensayos excepto uno incluyeron una medida de discapacidad (resultados no informados en un ensayo (Vogl 2013)), y utilizaron con más frecuencia el RMDQ (5/8 ensayos). Cuatro ensayos incluyeron el QUALEFFO y cuatro incluyeron una medida genérica general de calidad de vida. Solamente un ensayo incluyó una medida de éxito del tratamiento informado por el paciente, mientras que tres ensayos informaron el número que logró diversos umbrales de mejoría del dolor o la discapacidad. En su mayoría los ensayos (9/11) informaron la presencia de nuevas fracturas vertebrales (aunque dos ensayos solamente consideraron las fracturas adyacentes (Endres 2012; Vogl 2013) y uno de estos también consideró una nueva fractura de la vértebra tratada (Vogl 2013). Sin embargo, otros eventos adversos graves se informaron menos entre los ensayos; tres ensayos solamente informaron los eventos adversos que ocurrieron en el grupo de vertebroplastia. Los tres ensayos que compararon vertebroplastia con cifoplastia con balón o placa incluyeron la altura vertebral como un resultado de eficacia e informaron resultados contradictorios. Dos de estos ensayos no encontraron diferencias significativas entre los grupos en la altura vertebral después del procedimiento (Endres 2012; Vogl 2013), mientras que un ensayo informó significativamente mayor altura después del tratamiento en el grupo de cifoplastia con balón en comparación con vertebroplastia (media [DE] de la altura vertebral [cm] antes y después del tratamiento: cifoplastia 1,13 [0,34], 2,04 [0,41]; vertebroplastia: 1,02 [0,22], 1,32 [0,26], se informó que el valor de p para la diferencia en el aumento fue < 0,001).
Los ECA incluidos en esta revisión también variaron en cuanto a la duración del seguimiento (de dos semanas a tres años). Se incluyeron los datos del seguimiento a los dos años de un ensayo controlado con placebo pero del segundo ensayo controlado con placebo solamente se incluyeron los datos hasta el mes, a pesar de la disponibilidad de los datos al año, debido a una decisión a priori de que en los ECA cruzados (crossover) de preferencia se extraerían solamente los datos del período antes del cruzamiento. Comstock 2013 informó que después de un mes significativamente menos participantes del grupo de vertebroplastia cruzaron al grupo alterno (11 de 68 [16% de los participantes]) en comparación con el grupo placebo (simulado) (38 de 63 participantes [60%], p = 0,001). Al año la diferencia en el dolor favoreció al grupo de vertebroplastia (DM 1,02 [IC del 95%: 0,04 a 2,01); p = 0,042), pero no hubo diferencias en la discapacidad (DM en el RMDQ 1,37 puntos [IC del 95%: 3,62 a 20,88] p = 0,231). En los análisis según se trató, los participantes tratados con vertebroplastia no difirieron de los del grupo placebo (simulado) con respecto al dolor medio (DM 0,85 [IC del 95%: 2,05 a 20,35], p = 0,166) o la discapacidad (DM en RDQ 0,66 [IC del 95%: 3,30 a 21,98); p = 0,625). Por lo tanto, incluir los datos del análisis por intención de tratar al año de este ensayo no habría alterado significativamente los resultados. Según los datos combinados (intención de tratar) de los dos ensayos a los 12 meses, no hubo diferencias significativa entre los grupos con respecto al dolor medio (DM 0,77 [IC del 95%: ‐1,85 a 3,39]) (datos no mostrados).
Aunque la falta de efectos beneficiosos significativos de la vertebroplastia con respecto al dolor y la discapacidad mostrada en el análisis principal de esta revisión pareció indicar que otros efectos beneficiosos clínicos son poco probables, algunos estudios observacionales poblacionales o ambulatorios (Chen 2013; Edidin 2011; Lange 2014; Zampini 2010) pero no todos (McDonald 2011; McCullough 2013), informaron una reducción en la mortalidad asociada con el procedimiento de aumento espinal (vertebroplastia o cifoplastia), en comparación con los no tratados. Sin embargo McCullough 2013 demostró que el efecto beneficioso de supervivencia observado con los ajustes tradicionales de las covariables no se mantuvo en las pruebas después de utilizar un pareamiento por puntuación de propensión para representar mejor el sesgo de selección McCullough 2013), lo que indica que el sesgo de selección a partir de factores de confusión no reconocidos explica el efecto beneficioso de supervivencia observado con el procedimiento de aumento espinal señalado en otros estudios. Mediante el pareamiento por puntuación de propensiónMcCullough 2013 también informó que las complicaciones médicas graves al año fueron similares entre los grupos, mientras que las tasas de utilización de la asistencia sanitaria, incluidos los ingresos hospitalarios y en unidades de cuidados intensivos y los egresos a instituciones geriátricas especializadas, fueron mayores entre los pacientes tratados con un procedimiento de aumento espinal.
Aunque la presente revisión no demostró un aumento en el riesgo de fracturas vertebrales incidentes asociado con la vertebroplastia, no se puede excluir un aumento clínicamente importante en el riesgo a partir de sus resultados debido al escaso número de eventos. Los datos de los ECA que compararon el riesgo de la vertebroplastia con el de placebo o atención habitual no fueron consistentes como pruebas por la heterogeneidad estadística significativa observada en los análisis agrupados. Un ensayo informó un riesgo significativamente mayor de fracturas vertebrales clínicamente evidentes asociadas con la vertebroplastia después de 12 meses de seguimiento (Blasco 2012); otro ensayo informó un riesgo significativamente menor(Farrokhi 2011), mientras que tres ensayos no observaron diferencias entre los grupos en el riesgo (Buchbinder 2009; Klazen 2010; Rousing 2009).
Estudios observacionales que compararon la incidencia de nuevas fracturas vertebrales después de la vertebroplastia con la incidencia en una cohorte que no recibió el procedimiento también han presentado resultados contradictorios Chosa 2011; Mundano 2009; Álvarez 2006; Tang 2011). Para establecer de una manera concluyente si hay un mayor riesgo de fractura vertebral adicional, en particular fractura adyacente asociada con la vertebroplastia, se necesitarán ensayos aleatorios grandes adicionales con un seguimiento extenso o estudios poblacionales analizados cuidadosamente para considerar las diferencias en la selección de los pacientes como se señala en McCullough 2013.
Según los datos controlados aleatorios examinados, la pérdida de cemento ocurre con frecuencia. Aunque en la mayoría de los casos no da lugar a síntomas, pueden ocurrir secuelas graves. En la presente revisión un ensayo informó un caso de pérdida de cemento en el espacio epidural que requirió descompresión inmediata. A partir de la presente revisión no es posible determinar la tasa de secuelas significativas que aparecen debido a la pérdida de cemento o embolia debido al escaso número de eventos. Sin embargo, se han informado numerosos casos de pérdida local de cemento que requieren descompresión, como informes de émbolos de cemento que requieren extracción quirúrgica de la vena cava inferior (Baumann 2006; (Baumann 2006; las cavidades derechas del corazón (Caynak 2009; Kim 2014) y la arteria pulmonar derecha (François 2003). También se ha informado que la embolia de cemento provoca síntomas respiratorios transitorios y muerte Monticelli 2005), y también se han informado muertes por embolia grasa después de la vertebroplastiaSyed 2006). En un análisis post‐hoc de los datos de Buchbinder 2009 hubo un aumento en las probabilidades de pérdida de cemento con volúmenes mayores de cemento inyectado (odds ratio [OR] 2,8; IC del 95%: 1,3 a 6.1), pero no se encontró relación entre la pérdida de cemento y el resultado de eficacia(Kroon 2014).
Aunque no se encontraron diferencias significativas entre los grupos en el número de otros eventos adversos y no hubo muertes como resultado del procedimiento en los ensayos revisados, también es poco probable que se haya detectado un aumento en el riesgo de otras complicaciones menos habituales y muy poco frecuentes a partir de la revisión de los datos del ensayo. Las complicaciones de la vertebroplastia que se informaron en los ensayos incluidos incluyeron osteomielitis que requirió drenaje quirúrgico, fracturas de la costilla, lesión del saco tecal que requirió hospitalización, reacciones vasovagales inducidas por el dolor, exacerbación del asma aguda y fractura del espolón de cemento. En la bibliografía se ha informado la ocurrencia de muertes debido a tromboembolia pulmonar, embolia grasa, pérdida local extensa de cemento, infección y complicaciones de la anestesia e infección que requirió cirugía (Al‐Nakshabandi 2011).
Calidad de la evidencia
La calidad general de las pruebas para la comparación primaria (vertebroplastia versus placebo) fue moderada según el enfoque GRADE (Schünemann 2011b). La calidad de las pruebas se disminuyó de alta a moderada debido a la imprecisión (es decir, IC del 95% no excluyen diferencias clínicamente importantes [definido como 1,5 puntos en una escala de dolor EAV de 0 a 10; 2 a 3 puntos en la escala del RMDQ de 0 a 23 y 0,074 en la escala de calidad de vida 5D‐EQ de 0 a 1]) o a que el número total de eventos fue pequeño (para otros resultados). Según los grados de las pruebas del GRADE Working Group, una clasificación de calidad moderada de las pruebas indica que es probable que estudios de investigación adicionales tengan una marcada repercusión sobre la confianza en la estimación del efecto y es probable que cambien la estimación.
Aunque los datos disponibles de seis ensayos que compararon la vertebroplastia con la atención habitual en general favorecieron a la vertebroplastia para algunos resultados, pero no todos, se consideró que todos tuvieron alto riesgo de sesgo de realización y detección para los resultados autoinformados debido a la falta de cegamiento de los participantes y el personal. Aunque se reconoce que el cegamiento de los participantes y el personal es difícil de lograr en los ensayos de procedimientos, la falta de estudios con cegamiento de esta naturaleza es problemática ya que se considera que los ensayos con evaluación no cegada de resultados subjetivos (como dolor y función) exageran el beneficio del tratamiento en el 22% como promedio (cociente de OR 0,78; intervalo de credibilidad del 95%: 0,65 a 0,92) (Savović 2012). La corrección de estos de sesgos probablemente acercaría las mejorías observadas con la vertebroplastia sobre la atención habitual hacia el valor nulo, lo que coincide con los resultados de los ensayos controlados con placebo y pone en duda la interpretación GRADE de que es probable que estudios de investigación adicionales cambien de manera significativa las conclusiones de esta revisión.
Sesgos potenciales en el proceso de revisión
Se considera que se identificaron todos los ensayos relevantes después de una búsqueda minuciosa en todas las bases de datos principales sin restricciones de idiomas.
Seis revisores evaluaron de forma independiente los ensayos para inclusión en la revisión, extrajeron los datos y evaluaron el riesgo de sesgo, y un tercer revisor actuó de árbitro cuando hubo alguna discrepancia. Dos de los autores de la revisión (RB y DK) son también autores de dos de los ensayos incluidos en esta revisión(Buchbinder 2009 y Kallmes 2009 respectivamente). Para evitar cualquier sesgo, estos artículos fueron evaluados por un revisor independiente para valorar si cumplían con los criterios de inclusión para esta revisión. Ningún autor participó en la extracción de los datos ni en la evaluación del "Riesgo de sesgo" de sus propios ensayos.
Debido a la posibilidad de sesgo de estudios abiertos cuando los resultados principales son autoinformados, la vertebroplastia en comparación con placebo (simulado) se seleccionó como el análisis primario de esta revisión. Esta decisión se justificó sobre la base de los resultados de los análisis de sensibilidad que se realizaron para determinar si los resultados primarios fueron consistentes para la inclusión de ensayos abiertos.
Acuerdos y desacuerdos con otros estudios o revisiones
Se han publicado numerosas revisiones sistemáticas o metanálisis que investigan los efectos de la vertebroplastia para las fracturas espinales osteoporóticas, p.ej. Stevenson 2014; Anderson 2013; Liu 2013; Zhang 2013; Xing 2013; Ma 2012; Papanastassiou 2012; Shi 2012; Wang 2012; Zou 2012; Bliemel 2012; Robinson 2012; Han 2011; McGirt 2009; Lee 2009; Eck 2008; Gill 2007; Ploeg 2006; Taylor 2006; Hulme 2006; Trout 2006; Hochmuth 2006). Estos estudios han diferido en cuanto al objetivo.
Las revisiones que han resumido la efectividad de la vertebroplastia han informado conclusiones contradictorias explicables sobre la base de los criterios de inclusión o el rigor metodológico(Stevenson 2014; Anderson 2013; Papanastassiou 2012; Shi 2012; Robinson 2012; McGirt 2009; Ploeg 2006; Taylor 2006; Hulme 2006; Hochmuth 2006; Liu 2013). Los resultados de la presente revisión son consistentes con revisiones sistemáticas que solamente incluyeron ECA y realizaron análisis separados según el comparador (p.ej. Stevenson 2014; Shi 2012; Robinson 2012; Liu 2013), aunque las conclusiones diferentes en otras revisiones son explicables sobre la base de que estas revisiones incluyeron análisis agrupados que combinaron comparadores controlados con placebo y atención habitual, incluyeron estudios no aleatorios o combinaron los datos de la vertebroplastia y la cifoplastia (p.ej. Anderson 2013; Papanastassiou 2012).
Cuatro revisiones anteriores que se centraron en las pruebas disponibles con respecto a las fracturas vertebrales incidentes (Bliemel 2012; Trout 2006; Zhang 2013; Zou 2012), informaron conclusiones ampliamente compatibles con las de la presente revisión de que no es posible establecer definitivamente si hay un aumento o no en el riesgo de fractura vertebral adicional asociado con la vertebroplastia. Trout 2006a ha indicado que las fracturas adyacentes pueden ocurrir significativamente más pronto.
A diferencia de la presente revisión, las revisiones anteriores que han evaluado la eficacia comparativa y la seguridad de la vertebroplastia en comparación con cifoplastia han combinado los datos de estudios observacionales y experimentales (Eck 2008; Gill 2007; Han 2011; Ma 2012; Xing 2013), lo que vuelve problemática la comparación con los resultados de esta revisión. Las tres revisiones más recientes (Han 2011; Ma 2012; Xing 2013), incluyeron uno de los cuatro ECA de esta revisión(Liu 2010). De acuerdo con los resultados de la presente revisión basados solamente en los datos de ECA, las revisiones anteriores generalmente han concluido que los dos tratamientos tuvieron efectividad y seguridad comparables a más largo plazo.
Dohm 2014 consideró la corrección promedio de la cifosis como una variable de evaluación radiográfica secundaria y no informó diferencias entre los grupos en la corrección de la angulación cifótica posoperatoriamente o a los tres o 12 meses. A los 24 meses informó una diferencia media de 1,43 grados (IC del 95%: 0,10 a 2,74 grados) que favoreció al grupo de cifosis, aunque no se analizó la importancia clínica de este resultado. Algunas revisiones anteriores han indicado que la cifoplastia puede ser superior con respecto a la mejoría del ángulo de cifosis y la altura vertebral en comparación con la vertebroplastia, pero han reconocido que este resultado se debe comprobar en ECA rigurosos (Ma 2012; Xing 2013).

Study flow diagram.

Risk of bias summary: review authors' judgements about each risk of bias item for each included study.

Risk of bias summary: review authors' judgements about the risk of bias of the available evidence presented as percentages across all included studies.

Comparison 1 Efficacy: Vertebroplasty versus placebo (sham), Outcome 1 Pain (0 to 10 point scale).
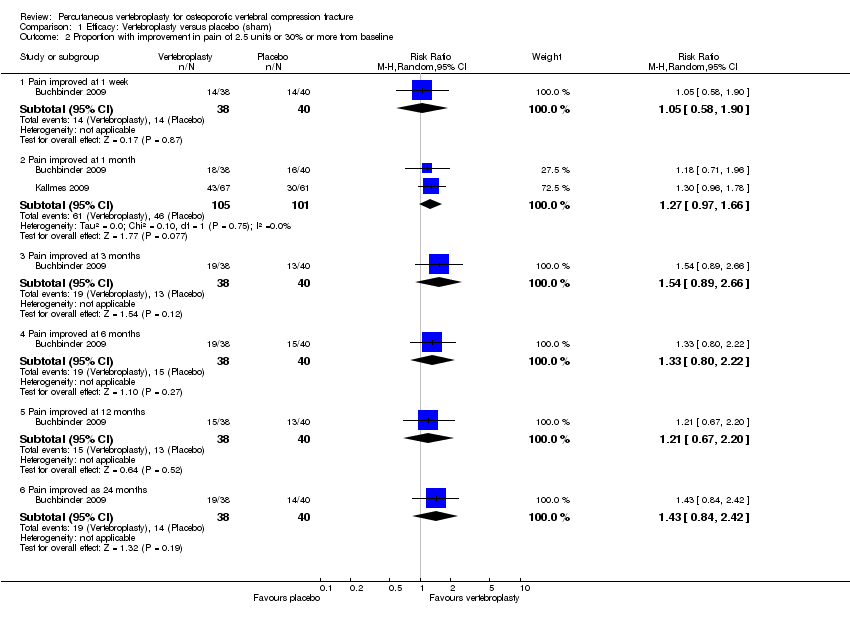
Comparison 1 Efficacy: Vertebroplasty versus placebo (sham), Outcome 2 Proportion with improvement in pain of 2.5 units or 30% or more from baseline.

Comparison 1 Efficacy: Vertebroplasty versus placebo (sham), Outcome 3 Disability (RMDQ).
![Comparison 1 Efficacy: Vertebroplasty versus placebo (sham), Outcome 4 Quality of life (QUALEFFO) [0 to 100].](/es/cdsr/doi/10.1002/14651858.CD006349.pub2/media/CDSR/CD006349/rel0002/CD006349/image_n/nCD006349-CMP-001-04.png)
Comparison 1 Efficacy: Vertebroplasty versus placebo (sham), Outcome 4 Quality of life (QUALEFFO) [0 to 100].
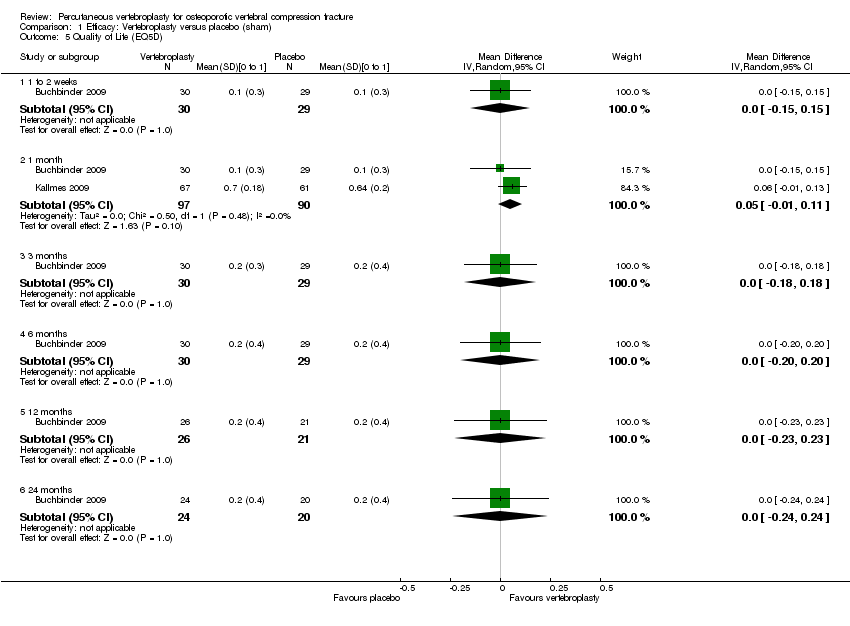
Comparison 1 Efficacy: Vertebroplasty versus placebo (sham), Outcome 5 Quality of Life (EQ5D).
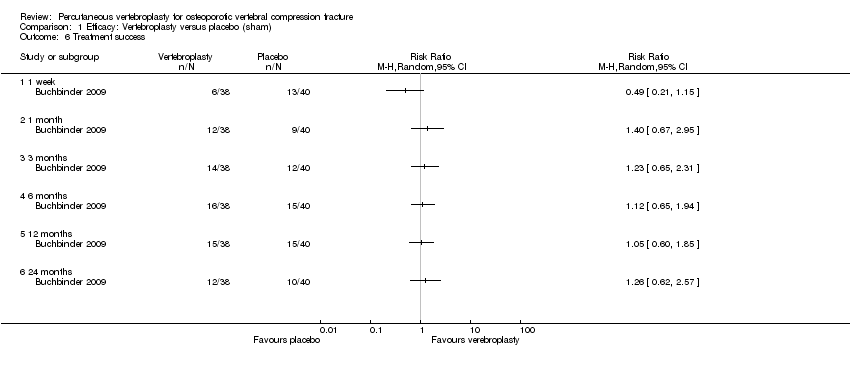
Comparison 1 Efficacy: Vertebroplasty versus placebo (sham), Outcome 6 Treatment success.

Comparison 2 Efficacy: Vertebroplasty versus usual care (open label), Outcome 1 Pain (0 or 1 to 10 point scale).
![Comparison 2 Efficacy: Vertebroplasty versus usual care (open label), Outcome 2 Disability (RMDQ [0 to 24] or ODI [0 to 100]).](/es/cdsr/doi/10.1002/14651858.CD006349.pub2/media/CDSR/CD006349/rel0002/CD006349/image_n/nCD006349-CMP-002-02.png)
Comparison 2 Efficacy: Vertebroplasty versus usual care (open label), Outcome 2 Disability (RMDQ [0 to 24] or ODI [0 to 100]).
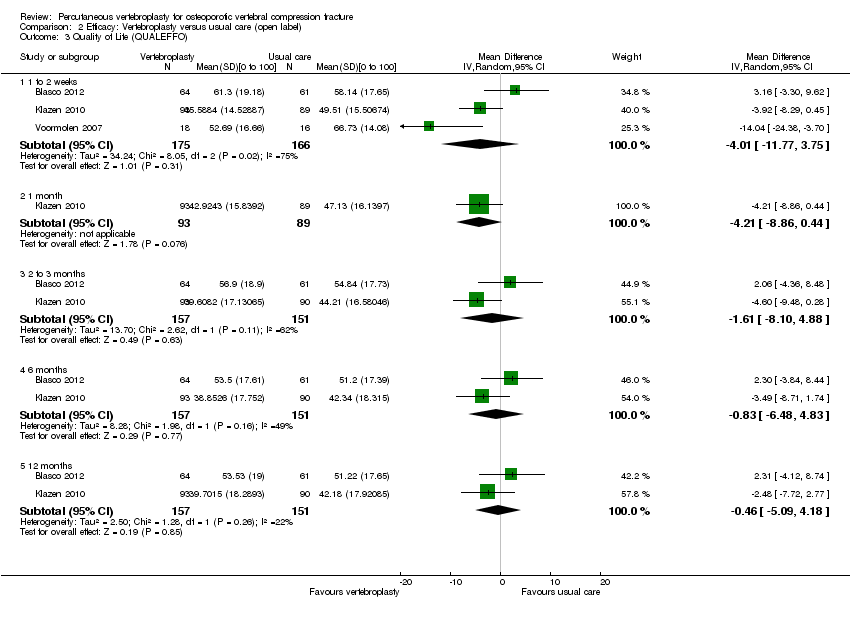
Comparison 2 Efficacy: Vertebroplasty versus usual care (open label), Outcome 3 Quality of Life (QUALEFFO).

Comparison 2 Efficacy: Vertebroplasty versus usual care (open label), Outcome 4 Quality of life (EQ5D).

Comparison 3 Efficacy: Vertebroplasty versus kyphoplasty (balloon), Outcome 1 Pain (0 to 10 point scale).

Comparison 3 Efficacy: Vertebroplasty versus kyphoplasty (balloon), Outcome 2 Disability (ODI).
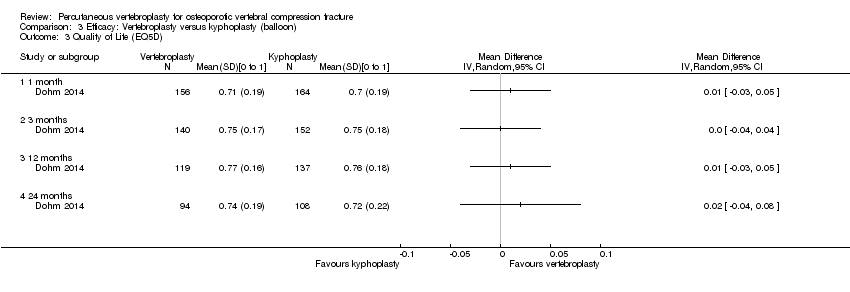
Comparison 3 Efficacy: Vertebroplasty versus kyphoplasty (balloon), Outcome 3 Quality of Life (EQ5D).

Comparison 4 Safety: Vertebroplasty versus placebo (sham) or usual care, Outcome 1 New clinical vertebral fractures.

Comparison 4 Safety: Vertebroplasty versus placebo (sham) or usual care, Outcome 2 New radiographic vertebral fractures.
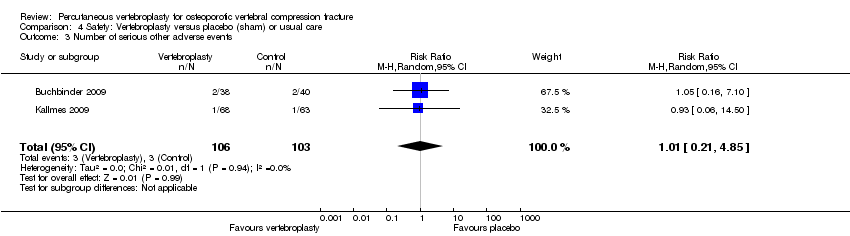
Comparison 4 Safety: Vertebroplasty versus placebo (sham) or usual care, Outcome 3 Number of serious other adverse events.
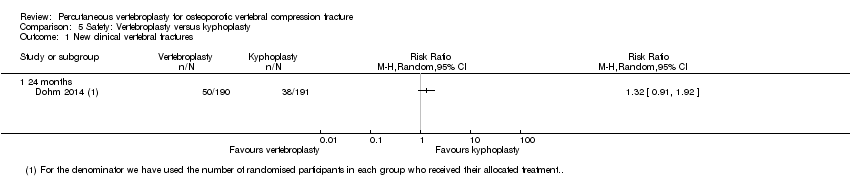
Comparison 5 Safety: Vertebroplasty versus kyphoplasty, Outcome 1 New clinical vertebral fractures.

Comparison 5 Safety: Vertebroplasty versus kyphoplasty, Outcome 2 New radiographic vertebral fractures.

Comparison 6 Subgroup analysis: Duration pain ≤ 6 weeks versus > 6 weeks, Outcome 1 Pain at 1 to 2 weeks.

Comparison 6 Subgroup analysis: Duration pain ≤ 6 weeks versus > 6 weeks, Outcome 2 Pain at 1 month.

Comparison 6 Subgroup analysis: Duration pain ≤ 6 weeks versus > 6 weeks, Outcome 3 Disability at 1 to 2 weeks.

Comparison 6 Subgroup analysis: Duration pain ≤ 6 weeks versus > 6 weeks, Outcome 4 Disability at 1 month.
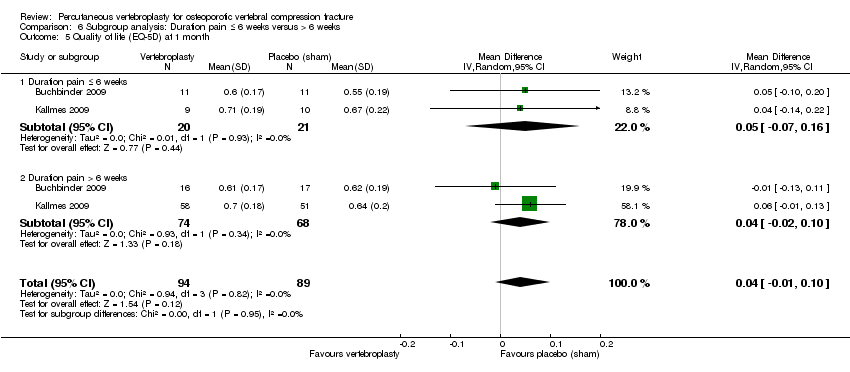
Comparison 6 Subgroup analysis: Duration pain ≤ 6 weeks versus > 6 weeks, Outcome 5 Quality of life (EQ‐5D) at 1 month.

Comparison 7 Sensitivity analysis, Outcome 1 Pain at 1 to 2 weeks (0 to 10 scale).

Comparison 7 Sensitivity analysis, Outcome 2 Pain at 1 month (0 to 10 scale).
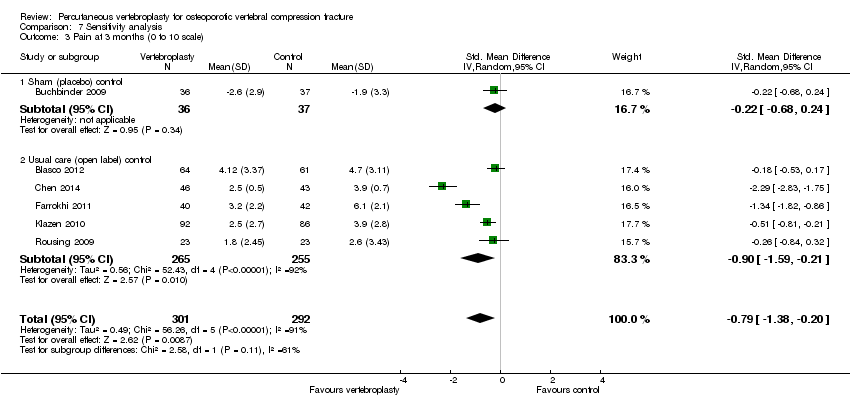
Comparison 7 Sensitivity analysis, Outcome 3 Pain at 3 months (0 to 10 scale).
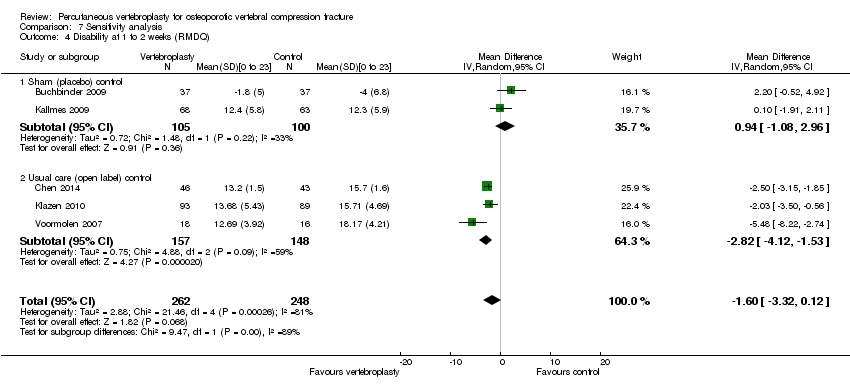
Comparison 7 Sensitivity analysis, Outcome 4 Disability at 1 to 2 weeks (RMDQ).

Comparison 7 Sensitivity analysis, Outcome 5 Disability at 1 month (RMDQ).
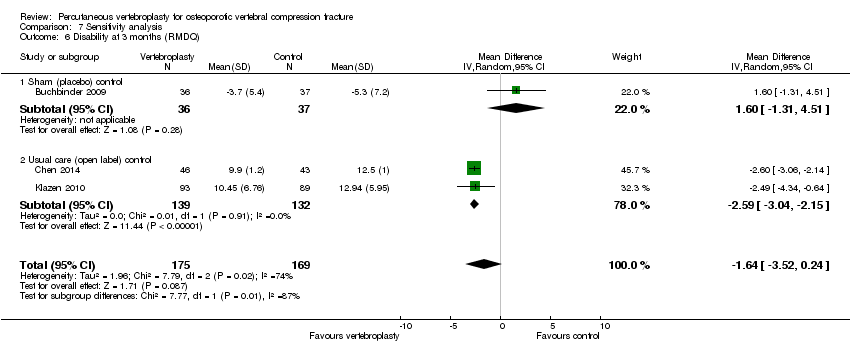
Comparison 7 Sensitivity analysis, Outcome 6 Disability at 3 months (RMDQ).
| Vertebroplasty for osteoporotic vertebral compression fracture | ||||||
| Patient or population: people with osteoporotic vertebral compression fracture | ||||||
| Outcomes | Illustrative comparative risks* (95% CI) | Relative effect | No of Participants | Quality of the evidence | Comments | |
| Assumed risk | Corresponding risk | |||||
| Sham1 | Vertebroplasty | |||||
| Pain | The mean pain in the control groups was | The mean pain in the intervention groups was | 201 | ⊕⊕⊕⊝ | Absolute change 7% better (15% better to 1.5% worse); relative change 10% better (21% better to 2% worse); NNTB n/a2,3 | |
| Disability (Roland‐Morris Disability Questionnaire) | The mean disability in the control groups was | The mean disability in the intervention groups was | 201 | ⊕⊕⊕⊝ | Absolute change 4.8% better (12.8% better to 3.3% worse); relative change 6.3% better (17.0% better to 4.4% worse); NNTB n/a2,3 | |
| Disease‐specific quality of Life (QUALEFFO) | The mean quality of life (QUALEFFO) in the control groups was | The mean quality of life in the intervention groups was | 73 | ⊕⊕⊕⊝ | Absolute change 0.4% worse (5% worse to 5% better); relative change: 0.7% worse (9% worse to 8% better); NNT n/a2,3 | |
| Overall quality of Life (EQ5D) | The mean quality of life (EQ‐5D) in the control groups was | The mean quality of life in the intervention groups was | 201 | ⊕⊕⊕⊝ | Absolute change 5% better (1% worse to 11% better); relative change: 18% improvement (4% worse to 39% better); NNT n/a2,3 | |
| Participant global assessment of success (People perceived their pain as better) Follow‐up: 1 month | 225 per 1000 | 315 per 1000 | RR 1.40 | 78 | ⊕⊕⊕⊝ | Absolute risk difference 9% more reported success (11% fewer to 29% more); relative change 40% more reported success (33% fewer to 195% more); NNTB n/a2 |
| Incident vertebral fractures Follow‐up: 12 months | 138 per 1000 | 203 per 1000 | RR 1.47 | 281 | ⊕⊕⊕⊝ | Absolute difference 6% more new fractures with vertebroplasty (2% fewer to 14% more); relative difference 47% more (61% fewer to 450% more); NNTH n/a2 |
| Other serious adverse events | 28 per 1000 | 29 per 1000 | RR 1.01 | 209 | ⊕⊕⊕⊝ | Absolute difference no more events with vertebroplasty (4% fewer to 4% more); relative change 1% more (79% fewer to 385% more); NNTH n/a2 |
| *The basis for the assumed risk (e.g. the median control group risk across studies) is provided in footnotes. The corresponding risk (and its 95% confidence interval) is based on the assumed risk in the comparison group and the relative effect of the intervention (and its 95% CI). | ||||||
| GRADE Working Group grades of evidence | ||||||
| 1For incident vertebral fractures the comparison includes one sham trial and two trials that compared vertebroplasty versus usual care. 2 Number needed to treat to benefit (NNTB), or harm (NNTH) not applicable (n/a) when result is not statistically significant. NNT for dichotomous outcomes calculated using Cates NNT calculator (http://www.nntonline.net/visualrx/). NNT for continuous outcomes calculated using Wells Calculator (CMSG editorial office) 3 Relative changes calculated as absolute change (mean difference) divided by mean at baseline in the placebo group from Buchbinder 2009 (values were: 7.1 points on 0 to 10 point VAS pain; 17.3 points on 0 to 23 point Roland‐Morris Disability questionnaire; 0.28 points on EQ‐5D quality of life scale; 59.6 points on the QUALEFFO scale) 4 Downgraded due to imprecision: the 95% confidence intervals do not exclude a clinically important change (defined as 1.5 points on 0 to 10 point VAS pain scale; 2 to 3 points on the 0 to 23 point RDQ scale; 0.074 on the 0 to 1 EQ‐5D quality of life scale, and 10 points on the 0 to 100 QUALEFFO scale), or the total number of participants was small, from a single trial only 5 Total number of events small 6 Pooled both placebo and usual care comparisons in the safety analyses. | ||||||
| Trial registration number | Principle Investigator/s and Country | Comparator/s | Main selection criteria | Registration date | Recruitment commenced | Status 24 November 2014 | Planned sample size | Final sample size |
| NCT01482793 | Clark W, Bird P Australia | Sham | Age > 60 years Fracture < 6 weeks | 28 Nov 2011 | Nov 2011 | Recruiting (last verified Nov 2011) | 120 | ‐ |
| NCT00749060 ‘OSTEO‐6’ | Laredo JD France | Kyphoplasty; Usual care with or without brace | Age ≥ 50 years Fracture < 6 weeks | 8 Sept 2008 | Dec 2007 | Completed June 2012; results unpublished | 300 | 48 |
| NCT00749086 ‘STIC2’ | Laredo JD France | Kyphoplasty | Age ≥ 50 years Fracture > 6 weeks | 8 Sept 2008 | Dec 2007 | Completed June 2012; results unpublished | 200 | 97 |
| NCT00635297 | Nakstad PH Norway | Vertebroplasty of fractured vertebra +/‐ additional vertebroplasty to adjacent vertebrae | Age > 50 years | 5 Mar 2008 | Apr 2008 | Suspended, reason not stated (last updated 2 Mar 2010) | 100 | ‐ |
| NCT00203554 | Sorensen L Denmark | Usual care | Fracture < 6 months | 16/09/2005 | Mar 2004 | Completed Jan 2008; results unpublished | 27 | 27 |
| ISRCTN14442024 (Also N0213112414) | Dolin, S UK | Usual care | Fracture > 4 weeks | 12 Sep 2003 | Nov 28 2005 | Completed (last updated 6 Feb 2014); results unpublished | Not provided | Not provided |
| chiCTR‐TRC‐14004835 | Zhao J, Liu B China | Ordinary vs high viscosity cement | Includes osteoporotic fractures, haemangiomas and metastatic disease | 23 Jun 2014 | Planned 1 Jan 2015 | Not yet recruiting | 100 | ‐ |
| NCT01677806 | Sun G China | Usual care | Age ≥ 50 years Fracture < 6 weeks | 23 Aug 2012 | Oct 2012 | Recruiting (last updated 7 Aug 2014) | 114 | ‐ |
| NCT01537770 (also EUCTR2010‐024050‐10‐DK ‘VOPE’ | Hansen EJ, Andersen MO, Rousing R, Tropp H Denmark | Lidocaine | Age > 50 years | 6 Jan 2011 | Feb 2012 | No longer recruiting (last updated 21 Oct 2014) | 80 | ‐ |
| NTR3282 | Nieuwenhuijse MJ Netherlands | Low vs high viscosity cement | ‐ | 14 Feb 2012 | Jan 2011 | Recruiting (last updated 21 July 2014) | 86 | ‐ |
| NCT01200277 ‘VERTOS IV’ | van Rooij HJ, De Vries J, Lohle PN Netherlands | Sham | Age ≥ 50 years Fracture ≤ 6 weeks | 7 Sept 2010 | Jan 2011 | Completed (last updated 19 Nov 2014) | 80 | ‐ |
| NCT00279877 | Evans A USA | Kyphoplasty | 18 Jan 2006 | May 2005 | Completed May 2011; results unpublished | 112 | Not provided | |
| Registration details not found. | Longo UG Italy | 3 weeks bed rest, rigid hyperextension corset, followed by 2‐3 months in a Cheneau brace (called ‘double‐blind) | Age ≥ 50 years | Trial registration not found | Unknown | Unknown (protocol published) | 200 | ‐ |
| NCT01963039 ‘VERTOS V’ | Carli D Netherlands | Sham | Age ≥ 50 years Fracture ≥ 12 weeks | 28 Aug 2013 | May 2013 | Recruiting (last updated Oct 2013)(protocol published) | 94 | ‐ |
| Registration details not found. Results published as conference abstract* | Hao, D, Guo, H, Wang, B, Wang X | Facet joint block | Age ≥55 years Fracture ≤ 8 weeks | Trial registration not found | Jan 2009 | Recruitment completed Jan 2013 | Not stated | 206 (100 in VP; 106 in facet block group) |
| * Abstract reported that analysis favoured vertebroplasty at 1 day and 1 week for pain and disability measured by RMDQ and ODI but no between‐group differences at 1, 3, 6, 12 months for pain, RMDQ, ODI and SF‐36 function and SF‐36 physical and mental component scores. After 12 months follow‐up, there were 13 new fractures in the percutaneous vertebroplasty group and 11 new fractures in the facet joint block group. Abstract did not report method of randomisation, whether or not treatment allocation was concealed and whether or not participants and investigators were blinded to treatment allocation. | ||||||||
| Study | Country | Treatment Groups | Mean age, yrs | Mean symptom duration | Mean (SD) baseline pain (0‐10 scale$) | Mean (SD) baseline RMDQ+ (0‐24 scale†) | Mean (SD) baseline QUALEFFO (0‐100 scale) | Procedures performed by | Mean (range) volume cement injected (mL) | Follow‐up |
| Spain | Vertebroplasty | 71.3 | 140.3 days | 7.2 (0.3) | ‐ | 65.2 (2.2) | Interventional radiologists | Not specified | 2 weeks, 2, 6, 12 months | |
| Usual care | 71.3 | 143.1 days | 6.3 (0.4) | ‐ | 59.2 (2.2) | |||||
| Australia | Vertebroplasty | 74.2 | 9 weeks^ | 7.4 (2.1) | 17.3 (2.8) | 56.9 (13.4) | Interventional radiologists | 2.8 (1.2 ‐ 5.5) | 1 week, 1, 3, 6, 12, 24 months | |
| Placebo | 78.9 | 9.5 weeks^ | 7.1 (2.3) | 17.3 (2.9) | 59.6 (17.1) | |||||
| China | Vertebroplasty | 64.6 | 31 weeks | 6.5 (0.9)& | 18.6 (1.8)#& | ‐ | Orthopaedic surgeons | 3.6 (3 ‐ 6) | 1 day, 1 week, 1, 3, 6, 12 months | |
| Usual care and brace | 66.5 | 29.5 weeks | 6.4 (0.9)& | 16.7 (1.3)#& | ‐ | |||||
| USA and Canada | Vertebroplasty | 75.7 | ‐¤ | ˜7.6µ | ‐ | ‐ | Interventional radiologists and neuroradiologists, orthopaedic surgeons, neuroradiologists | 4.0 (3.0 to 6.0)¢ | 7 days, 1, 3, 12 and 24 months | |
| Balloon kyphoplasty | 75.5 | ‐¤ | ˜7.6µ | ‐ | Not stated | 4.6 (3.4 to 6.0)¢ | ||||
| Germany | Vertebroplasty | 71.3 | ‐§ | 7.8 (0.9) | ‐ | ‐ | Orthopaedic surgeon | 3.1 (2 – 4) | Immediately, mean 5.8 months (range: 4 to 7) | |
| Balloon kyphoplasty | 63.3 | ‐§ | 9.0 (0.7) | ‐ | ‐ | Orthopaedic surgeon | 3.9 (3 – 5) | |||
| Shield kyphoplasty | 67.1 | ‐§ | 8.8 (1.5) | ‐ | ‐ | Orthopaedic surgeon | 4.6 (3 – 6) | |||
| Iran | Vertebroplasty | 72 | 27 weeks | 8.4 (1.6) | ‐ | ‐ | Neurosurgeons | 3.5 (1 ‐ 5.5) | 1 week, 2, 6, 12, 24, 36 months | |
| Usual care | 74 | 30 weeks | 7.2 (1.7) | ‐ | ‐ | |||||
| US, UK, Australia | Vertebroplasty | 73.4 | 16 weeks | 6.9 (2.0) | 16.6 (3.8) | ‐ | Interventional radiologists | 2.8 (1 ‐ 5.5)* | 3 days, 2 weeks, 1 month | |
| Placebo | 73.3 | 20 weeks | 7.2 (2.0) | 17.5 (4.1) | ‐ | |||||
| Netherlands, Belgium | Vertebroplasty | 75.2 | 29.3 days | 7.8 (1.5) | 18.6 (3.6)# | 58.7 (13.5) | Interventional radiologists | 4.1 (1 ‐ 9) | 1 day, 1 week, 1, 3, 6, 12 months | |
| Usual care | 75.4 | 26.8 days | 7.5 (1.6) | 17.2 (4.2)# | 54.7 (14.4) | |||||
| Taiwan | Vertebroplasty | 74.3 | 15.8 days | 7.9 (0.7) | ‐ | ‐ | Not stated | 4.9 (0.7) | 3 days, 6 months | |
| Balloon kyphoplasty | 72.3 | 17.0 days | 8.0 (0.8) | ‐ | ‐ | Not stated | 5.6 (0.6) | |||
| Denmark | Vertebroplasty | 80 | 8.4 days | 7.5 (2.0) | ‐ | ‐ | Orthopedic surgeons | Not specified | 3 months | |
| Usual care and brace | 80 | 6.7 days | 8.8 (1.2) | ‐ | ‐ | |||||
| Germany and USA | Vertebroplasty | 74 | ‐¥ | 8.5 (1.2) | ‐ | ‐ | Not stated | 4.0 (1.1) | 1 day, 3, 12 months | |
| Shield kyphoplasty | 80 | ‐¥ | 8.3 (1.1) | ‐ | ‐ | Not stated | 3.8 (0.7) | |||
| Netherlands | Vertebroplasty | 72 | 85 days | 7.1 (5 ‐ 9)+ | 15.7 (8‐24) | 60.0 (37 to 86)+ | Interventional radiologists | 3.2 (1.0 ‐ 5.0) | 2 weeks | |
| Usual care | 74 | 76 days | 7.6 (5‐10) | 17.8 (8‐22) | 60.7 (38 to 86) | |||||
| $1‐10 point scale used by Farrokhi 2011; +RMDQ: Roland Morris Disability Questionnaire; †modified RMDQ (0‐23 scale) used by Buchbinder 2009 and Kallmes 2009; ^ median duration of symptoms; ¤Not reported but symptom duration 6 months or less; µMean symptom duration reported graphically only; ¢Median and interquartile range;§Not reported but symptom duration 6 weeks or less; &Data only included for the 42/46 in VP group and 43/50 in the usual care group who completed 12‐month follow‐up in groups assigned to at baseline; #Disability significantly higher in the vertebroplasty group; *from n = 20 treated at Mayo (personal communication); ¥Not reported but at least 6 weeks of conservative treatment; +Only range provided. | ||||||||||
| Outcome or subgroup title | No. of studies | No. of participants | Statistical method | Effect size |
| 1 Pain (0 to 10 point scale) Show forest plot | 2 | Mean Difference (IV, Random, 95% CI) | Subtotals only | |
| 1.1 1 to 2 weeks | 2 | 205 | Mean Difference (IV, Random, 95% CI) | 0.12 [‐0.65, 0.88] |
| 1.2 1 month | 2 | 201 | Mean Difference (IV, Random, 95% CI) | ‐0.66 [‐1.48, 0.15] |
| 1.3 3 months | 1 | 73 | Mean Difference (IV, Random, 95% CI) | ‐0.70 [‐2.12, 0.72] |
| 1.4 6 months | 1 | 71 | Mean Difference (IV, Random, 95% CI) | ‐0.30 [‐1.84, 1.24] |
| 1.5 12 months | 1 | 67 | Mean Difference (IV, Random, 95% CI) | ‐0.5 [‐1.82, 0.82] |
| 1.6 24 months | 1 | 57 | Mean Difference (IV, Random, 95% CI) | ‐1.1 [‐2.68, 0.48] |
| 2 Proportion with improvement in pain of 2.5 units or 30% or more from baseline Show forest plot | 2 | Risk Ratio (M‐H, Random, 95% CI) | Subtotals only | |
| 2.1 Pain improved at 1 week | 1 | 78 | Risk Ratio (M‐H, Random, 95% CI) | 1.05 [0.58, 1.90] |
| 2.2 Pain improved at 1 month | 2 | 206 | Risk Ratio (M‐H, Random, 95% CI) | 1.27 [0.97, 1.66] |
| 2.3 Pain improved at 3 months | 1 | 78 | Risk Ratio (M‐H, Random, 95% CI) | 1.54 [0.89, 2.66] |
| 2.4 Pain improved at 6 months | 1 | 78 | Risk Ratio (M‐H, Random, 95% CI) | 1.33 [0.80, 2.22] |
| 2.5 Pain improved at 12 months | 1 | 78 | Risk Ratio (M‐H, Random, 95% CI) | 1.21 [0.67, 2.20] |
| 2.6 Pain improved as 24 months | 1 | 78 | Risk Ratio (M‐H, Random, 95% CI) | 1.43 [0.84, 2.42] |
| 3 Disability (RMDQ) Show forest plot | 2 | Mean Difference (IV, Random, 95% CI) | Subtotals only | |
| 3.1 1 to 2 weeks | 2 | 190 | Mean Difference (IV, Random, 95% CI) | 0.82 [‐1.13, 2.78] |
| 3.2 1 month | 2 | 187 | Mean Difference (IV, Random, 95% CI) | ‐1.09 [‐2.94, 0.76] |
| 3.3 3 months | 1 | 59 | Mean Difference (IV, Random, 95% CI) | 1.60 [‐1.66, 4.86] |
| 3.4 6 months | 1 | 59 | Mean Difference (IV, Random, 95% CI) | ‐0.40 [‐3.36, 2.56] |
| 3.5 12 months | 1 | 48 | Mean Difference (IV, Random, 95% CI) | 0.60 [‐3.02, 4.22] |
| 3.6 24 months | 1 | 43 | Mean Difference (IV, Random, 95% CI) | 0.10 [‐3.67, 3.87] |
| 4 Quality of life (QUALEFFO) [0 to 100] Show forest plot | 1 | Mean Difference (IV, Random, 95% CI) | Totals not selected | |
| 4.1 1 week | 1 | Mean Difference (IV, Random, 95% CI) | 0.0 [0.0, 0.0] | |
| 4.2 1 month | 1 | Mean Difference (IV, Random, 95% CI) | 0.0 [0.0, 0.0] | |
| 4.3 3 months | 1 | Mean Difference (IV, Random, 95% CI) | 0.0 [0.0, 0.0] | |
| 4.4 6 months | 1 | Mean Difference (IV, Random, 95% CI) | 0.0 [0.0, 0.0] | |
| 4.5 12 months | 1 | Mean Difference (IV, Random, 95% CI) | 0.0 [0.0, 0.0] | |
| 4.6 24 months | 1 | Mean Difference (IV, Random, 95% CI) | 0.0 [0.0, 0.0] | |
| 5 Quality of Life (EQ5D) Show forest plot | 2 | Mean Difference (IV, Random, 95% CI) | Subtotals only | |
| 5.1 1 to 2 weeks | 1 | 59 | Mean Difference (IV, Random, 95% CI) | 0.0 [‐0.15, 0.15] |
| 5.2 1 month | 2 | 187 | Mean Difference (IV, Random, 95% CI) | 0.05 [‐0.01, 0.11] |
| 5.3 3 months | 1 | 59 | Mean Difference (IV, Random, 95% CI) | 0.0 [‐0.18, 0.18] |
| 5.4 6 months | 1 | 59 | Mean Difference (IV, Random, 95% CI) | 0.0 [‐0.20, 0.20] |
| 5.5 12 months | 1 | 47 | Mean Difference (IV, Random, 95% CI) | 0.0 [‐0.23, 0.23] |
| 5.6 24 months | 1 | 44 | Mean Difference (IV, Random, 95% CI) | 0.0 [‐0.24, 0.24] |
| 6 Treatment success Show forest plot | 1 | Risk Ratio (M‐H, Random, 95% CI) | Totals not selected | |
| 6.1 1 week | 1 | Risk Ratio (M‐H, Random, 95% CI) | 0.0 [0.0, 0.0] | |
| 6.2 1 month | 1 | Risk Ratio (M‐H, Random, 95% CI) | 0.0 [0.0, 0.0] | |
| 6.3 3 months | 1 | Risk Ratio (M‐H, Random, 95% CI) | 0.0 [0.0, 0.0] | |
| 6.4 6 months | 1 | Risk Ratio (M‐H, Random, 95% CI) | 0.0 [0.0, 0.0] | |
| 6.5 12 months | 1 | Risk Ratio (M‐H, Random, 95% CI) | 0.0 [0.0, 0.0] | |
| 6.6 24 months | 1 | Risk Ratio (M‐H, Random, 95% CI) | 0.0 [0.0, 0.0] | |
| Outcome or subgroup title | No. of studies | No. of participants | Statistical method | Effect size |
| 1 Pain (0 or 1 to 10 point scale) Show forest plot | 6 | Std. Mean Difference (IV, Random, 95% CI) | Subtotals only | |
| 1.1 1 to 2 weeks | 5 | 520 | Std. Mean Difference (IV, Random, 95% CI) | ‐1.07 [‐2.01, ‐0.14] |
| 1.2 1 month | 2 | 277 | Std. Mean Difference (IV, Random, 95% CI) | ‐1.62 [‐3.01, ‐0.24] |
| 1.3 2 to 3 months | 5 | 520 | Std. Mean Difference (IV, Random, 95% CI) | ‐0.90 [‐1.59, ‐0.21] |
| 1.4 6 months | 4 | 466 | Std. Mean Difference (IV, Random, 95% CI) | ‐0.88 [‐1.71, ‐0.04] |
| 1.5 12 months | 5 | 505 | Std. Mean Difference (IV, Random, 95% CI) | ‐0.83 [‐1.55, ‐0.11] |
| 1.6 24 months | 1 | 77 | Std. Mean Difference (IV, Random, 95% CI) | ‐0.45 [‐0.90, 0.01] |
| 2 Disability (RMDQ [0 to 24] or ODI [0 to 100]) Show forest plot | 5 | Std. Mean Difference (IV, Random, 95% CI) | Subtotals only | |
| 2.1 1 to 2 weeks | 4 | 387 | Std. Mean Difference (IV, Random, 95% CI) | ‐2.04 [‐3.57, ‐0.50] |
| 2.2 1 month | 2 | 271 | Std. Mean Difference (IV, Random, 95% CI) | ‐0.94 [‐2.30, 0.43] |
| 2.3 3 months | 4 | 396 | Std. Mean Difference (IV, Random, 95% CI) | ‐1.90 [‐3.76, ‐0.04] |
| 2.4 6 months | 3 | 354 | Std. Mean Difference (IV, Random, 95% CI) | ‐1.69 [‐3.55, 0.17] |
| 2.5 12 months | 4 | 389 | Std. Mean Difference (IV, Random, 95% CI) | ‐1.26 [‐2.61, 0.08] |
| 2.6 24 months | 1 | 77 | Std. Mean Difference (IV, Random, 95% CI) | ‐5.65 [‐6.67, ‐4.63] |
| 3 Quality of Life (QUALEFFO) Show forest plot | 3 | Mean Difference (IV, Random, 95% CI) | Subtotals only | |
| 3.1 1 to 2 weeks | 3 | 341 | Mean Difference (IV, Random, 95% CI) | ‐4.01 [‐11.77, 3.75] |
| 3.2 1 month | 1 | 182 | Mean Difference (IV, Random, 95% CI) | ‐4.21 [‐8.86, 0.44] |
| 3.3 2 to 3 months | 2 | 308 | Mean Difference (IV, Random, 95% CI) | ‐1.61 [‐8.10, 4.88] |
| 3.4 6 months | 2 | 308 | Mean Difference (IV, Random, 95% CI) | ‐0.83 [‐6.48, 4.83] |
| 3.5 12 months | 2 | 308 | Mean Difference (IV, Random, 95% CI) | ‐0.46 [‐5.09, 4.18] |
| 4 Quality of life (EQ5D) Show forest plot | 2 | Mean Difference (IV, Random, 95% CI) | Subtotals only | |
| 4.1 1 to 2 weeks | 1 | 183 | Mean Difference (IV, Random, 95% CI) | 0.08 [0.00, 0.15] |
| 4.2 1 month | 1 | 183 | Mean Difference (IV, Random, 95% CI) | 0.09 [0.01, 0.16] |
| 4.3 3 months | 2 | 215 | Mean Difference (IV, Random, 95% CI) | 0.10 [0.00, 0.20] |
| 4.4 6 months | 1 | 183 | Mean Difference (IV, Random, 95% CI) | 0.07 [‐0.02, 0.15] |
| 4.5 12 months | 2 | 215 | Mean Difference (IV, Random, 95% CI) | 0.07 [‐0.00, 0.14] |
| Outcome or subgroup title | No. of studies | No. of participants | Statistical method | Effect size |
| 1 Pain (0 to 10 point scale) Show forest plot | 3 | Mean Difference (IV, Random, 95% CI) | Subtotals only | |
| 1.1 1 to 2 weeks | 1 | 364 | Mean Difference (IV, Random, 95% CI) | ‐0.20 [‐0.75, 0.35] |
| 1.2 1 month | 1 | 342 | Mean Difference (IV, Random, 95% CI) | ‐0.10 [‐0.69, 0.49] |
| 1.3 3 months | 1 | 314 | Mean Difference (IV, Random, 95% CI) | ‐0.10 [‐0.74, 0.54] |
| 1.4 6 months | 2 | 141 | Mean Difference (IV, Random, 95% CI) | ‐0.08 [‐0.41, 0.24] |
| 1.5 12 months | 1 | 275 | Mean Difference (IV, Random, 95% CI) | 0.30 [‐0.40, 1.00] |
| 1.6 24 months | 1 | 220 | Mean Difference (IV, Random, 95% CI) | 0.10 [‐0.72, 0.92] |
| 2 Disability (ODI) Show forest plot | 1 | Mean Difference (IV, Random, 95% CI) | Totals not selected | |
| 2.1 1 month | 1 | Mean Difference (IV, Random, 95% CI) | 0.0 [0.0, 0.0] | |
| 2.2 3 months | 1 | Mean Difference (IV, Random, 95% CI) | 0.0 [0.0, 0.0] | |
| 2.3 12 months | 1 | Mean Difference (IV, Random, 95% CI) | 0.0 [0.0, 0.0] | |
| 2.4 24 months | 1 | Mean Difference (IV, Random, 95% CI) | 0.0 [0.0, 0.0] | |
| 3 Quality of Life (EQ5D) Show forest plot | 1 | Mean Difference (IV, Random, 95% CI) | Totals not selected | |
| 3.1 1 month | 1 | Mean Difference (IV, Random, 95% CI) | 0.0 [0.0, 0.0] | |
| 3.2 3 months | 1 | Mean Difference (IV, Random, 95% CI) | 0.0 [0.0, 0.0] | |
| 3.3 12 months | 1 | Mean Difference (IV, Random, 95% CI) | 0.0 [0.0, 0.0] | |
| 3.4 24 months | 1 | Mean Difference (IV, Random, 95% CI) | 0.0 [0.0, 0.0] | |
| Outcome or subgroup title | No. of studies | No. of participants | Statistical method | Effect size |
| 1 New clinical vertebral fractures Show forest plot | 4 | Risk Ratio (M‐H, Random, 95% CI) | Subtotals only | |
| 1.1 12 months | 3 | 281 | Risk Ratio (M‐H, Random, 95% CI) | 1.47 [0.39, 5.50] |
| 1.2 24 months | 2 | 134 | Risk Ratio (M‐H, Random, 95% CI) | 0.54 [0.09, 3.38] |
| 2 New radiographic vertebral fractures Show forest plot | 4 | Risk Ratio (M‐H, Random, 95% CI) | Subtotals only | |
| 2.1 12 months | 4 | 397 | Risk Ratio (M‐H, Random, 95% CI) | 1.43 [0.55, 3.74] |
| 2.2 24 months | 1 | 43 | Risk Ratio (M‐H, Random, 95% CI) | 1.48 [0.90, 2.44] |
| 3 Number of serious other adverse events Show forest plot | 2 | 209 | Risk Ratio (M‐H, Random, 95% CI) | 1.01 [0.21, 4.85] |
| Outcome or subgroup title | No. of studies | No. of participants | Statistical method | Effect size |
| 1 New clinical vertebral fractures Show forest plot | 1 | Risk Ratio (M‐H, Random, 95% CI) | Totals not selected | |
| 1.1 24 months | 1 | Risk Ratio (M‐H, Random, 95% CI) | 0.0 [0.0, 0.0] | |
| 2 New radiographic vertebral fractures Show forest plot | 1 | Risk Ratio (M‐H, Random, 95% CI) | Totals not selected | |
| 2.1 12 months | 1 | Risk Ratio (M‐H, Random, 95% CI) | 0.0 [0.0, 0.0] | |
| 2.2 24 months | 1 | Risk Ratio (M‐H, Random, 95% CI) | 0.0 [0.0, 0.0] | |
| Outcome or subgroup title | No. of studies | No. of participants | Statistical method | Effect size |
| 1 Pain at 1 to 2 weeks Show forest plot | 2 | 201 | Mean Difference (IV, Random, 95% CI) | 0.19 [‐0.58, 0.95] |
| 1.1 Duration pain ≤ 6 weeks | 2 | 44 | Mean Difference (IV, Random, 95% CI) | 0.64 [‐0.97, 2.26] |
| 1.2 Duration pain > 6 weeks | 2 | 157 | Mean Difference (IV, Random, 95% CI) | 0.05 [‐0.81, 0.92] |
| 2 Pain at 1 month Show forest plot | 2 | 201 | Mean Difference (IV, Random, 95% CI) | ‐0.66 [‐1.44, 0.13] |
| 2.1 Duration pain ≤ 6 weeks | 2 | 44 | Mean Difference (IV, Random, 95% CI) | 0.04 [‐1.80, 1.87] |
| 2.2 Duration pain > 6 weeks | 2 | 157 | Mean Difference (IV, Random, 95% CI) | ‐0.81 [‐1.68, 0.05] |
| 3 Disability at 1 to 2 weeks Show forest plot | 2 | 182 | Mean Difference (IV, Random, 95% CI) | 0.64 [‐0.88, 2.15] |
| 3.1 Duration pain ≤ 6 weeks | 2 | 41 | Mean Difference (IV, Random, 95% CI) | 0.20 [‐3.33, 3.72] |
| 3.2 Duration pain > 6 weeks | 2 | 141 | Mean Difference (IV, Random, 95% CI) | 0.74 [‐0.94, 2.42] |
| 4 Disability at 1 month Show forest plot | 2 | Mean Difference (IV, Random, 95% CI) | Subtotals only | |
| 4.1 Duration pain ≤ 6 weeks | 2 | 41 | Mean Difference (IV, Random, 95% CI) | ‐0.43 [‐4.02, 3.16] |
| 4.2 Duration pain > 6 weeks | 2 | 142 | Mean Difference (IV, Random, 95% CI) | ‐0.83 [‐2.87, 1.21] |
| 5 Quality of life (EQ‐5D) at 1 month Show forest plot | 2 | 183 | Mean Difference (IV, Random, 95% CI) | 0.04 [‐0.01, 0.10] |
| 5.1 Duration pain ≤ 6 weeks | 2 | 41 | Mean Difference (IV, Random, 95% CI) | 0.05 [‐0.07, 0.16] |
| 5.2 Duration pain > 6 weeks | 2 | 142 | Mean Difference (IV, Random, 95% CI) | 0.04 [‐0.02, 0.10] |
| Outcome or subgroup title | No. of studies | No. of participants | Statistical method | Effect size |
| 1 Pain at 1 to 2 weeks (0 to 10 scale) Show forest plot | 7 | 725 | Std. Mean Difference (IV, Random, 95% CI) | ‐0.43 [‐0.91, 0.06] |
| 1.1 Sham (placebo) control | 2 | 205 | Std. Mean Difference (IV, Random, 95% CI) | 0.04 [‐0.24, 0.31] |
| 1.2 Usual care (open label) control | 5 | 520 | Std. Mean Difference (IV, Random, 95% CI) | ‐0.64 [‐1.27, ‐0.00] |
| 2 Pain at 1 month (0 to 10 scale) Show forest plot | 4 | 478 | Std. Mean Difference (IV, Random, 95% CI) | ‐0.91 [‐1.71, ‐0.12] |
| 2.1 Sham (placebo) control | 2 | 201 | Std. Mean Difference (IV, Random, 95% CI) | ‐0.22 [‐0.50, 0.06] |
| 2.2 Usual care (open label) control | 2 | 277 | Std. Mean Difference (IV, Random, 95% CI) | ‐1.62 [‐3.01, ‐0.24] |
| 3 Pain at 3 months (0 to 10 scale) Show forest plot | 6 | 593 | Std. Mean Difference (IV, Random, 95% CI) | ‐0.79 [‐1.38, ‐0.20] |
| 3.1 Sham (placebo) control | 1 | 73 | Std. Mean Difference (IV, Random, 95% CI) | ‐0.22 [‐0.68, 0.24] |
| 3.2 Usual care (open label) control | 5 | 520 | Std. Mean Difference (IV, Random, 95% CI) | ‐0.90 [‐1.59, ‐0.21] |
| 4 Disability at 1 to 2 weeks (RMDQ) Show forest plot | 5 | 510 | Mean Difference (IV, Random, 95% CI) | ‐1.60 [‐3.32, 0.12] |
| 4.1 Sham (placebo) control | 2 | 205 | Mean Difference (IV, Random, 95% CI) | 0.94 [‐1.08, 2.96] |
| 4.2 Usual care (open label) control | 3 | 305 | Mean Difference (IV, Random, 95% CI) | ‐2.82 [‐4.12, ‐1.53] |
| 5 Disability at 1 month (RMDQ) Show forest plot | 4 | 472 | Mean Difference (IV, Random, 95% CI) | ‐1.26 [‐2.51, ‐0.00] |
| 5.1 Sham (placebo) control | 2 | 201 | Mean Difference (IV, Random, 95% CI) | 0.12 [‐2.40, 2.64] |
| 5.2 Usual care (open label) control | 2 | 271 | Mean Difference (IV, Random, 95% CI) | ‐2.05 [‐2.56, ‐1.54] |
| 6 Disability at 3 months (RMDQ) Show forest plot | 3 | 344 | Mean Difference (IV, Random, 95% CI) | ‐1.64 [‐3.52, 0.24] |
| 6.1 Sham (placebo) control | 1 | 73 | Mean Difference (IV, Random, 95% CI) | 1.60 [‐1.31, 4.51] |
| 6.2 Usual care (open label) control | 2 | 271 | Mean Difference (IV, Random, 95% CI) | ‐2.59 [‐3.04, ‐2.15] |