Vertebroplastia percutánea para la fractura vertebral osteoporótica por compresión
Información
- DOI:
- https://doi.org/10.1002/14651858.CD006349.pub2Copiar DOI

- Base de datos:
-
- Cochrane Database of Systematic Reviews
- Versión publicada:
-
- 30 abril 2015see what's new
- Tipo:
-
- Intervention
- Etapa:
-
- Review
- Grupo Editorial Cochrane:
-
Grupo Cochrane de Salud musculoesquelética
- Copyright:
-
- Copyright © 2015 The Cochrane Collaboration. Published by John Wiley & Sons, Ltd.
Cifras del artículo
Altmetric:
Citado por:
Autores
Contributions of authors
The original published protocol and previous draft of the review was developed by RGW Lambert, K Golmohammadi, SR Majumdar, A Jones, R Buchbinder, SS Dhillon, R Owen, J Homik, DF Kallmes and K Siminoski. The updated protocol and review was drafted by R Buchbinder and R Johnston. SS Dhillon, R Owen, A Jones, J Homik, R Johnston and R Buchbinder independently selected trials for inclusion and/or extracted the data, and/or performed a 'Risk of bias' assessment and/or assessed the quality of the body of evidence for the main outcomes using the GRADE approach. All authors provided critical comment and approved the final manuscript.
Sources of support
Internal sources
-
Monash Department of Clinical Epidemiology, Cabrini Institute and Department of Epidemiology and Preventive Medicine, School of Public Health and Preventive Medicine, Monash University, Australia.
External sources
-
R Buchbinder is supported in part by an Australian National Health and Medical Research Council Practitioner Fellowship, Australia.
Declarations of interest
R Buchbinder was a principal investigator of Buchbinder 2009 and D Kallmes was a principal investigator of Kallmes 2009.
Acknowledgements
The review was supported by grants from the University Hospital Foundation and the Canadian Radiology Foundation. The authors would like to thank Ms Louise Falzon, formerly from the Cochrane Musculoskeletal Group, for designing the search strategies and conducting the update of the electronic database searches; Ms Tamara Rader, Cochrane Musculoskeletal Group Knowledge Translation Specialist for conducting the electronic database searches; Dr Mauritz Voormolen and Dr Caroline Klazen who provided additional information from their trials; Dr. Sean Crowther and Dr. Ken Ong for assistance with review of abstracts; and Dr. Kerry Siminoski and Dr. Sumit Majumdar for advice in the early stages of the review.
Version history
| Published | Title | Stage | Authors | Version |
| 2018 Nov 06 | Percutaneous vertebroplasty for osteoporotic vertebral compression fracture | Review | Rachelle Buchbinder, Renea V Johnston, Kobi J Rischin, Joanne Homik, C Allyson Jones, Kamran Golmohammadi, David F Kallmes | |
| 2018 Apr 04 | Percutaneous vertebroplasty for osteoporotic vertebral compression fracture | Review | Rachelle Buchbinder, Renea V Johnston, Kobi J Rischin, Joanne Homik, C Allyson Jones, Kamran Golmohammadi, David F Kallmes | |
| 2015 Apr 30 | Percutaneous vertebroplasty for osteoporotic vertebral compression fracture | Review | Rachelle Buchbinder, Kamran Golmohammadi, Renea V Johnston, Richard J Owen, Joanne Homik, Allyson Jones, Sukhvinder S Dhillon, David F Kallmes, Robert GW Lambert | |
| 2007 Jan 24 | Percutaneous vertebroplasty for osteoporotic vertebral compression fracture | Protocol | Robert GW Lambert, Kamran Golmohammadi, Sumit R Majumdar, Allyson Jones, Rachelle Buchbinder, Sukhvinder S Dhillon, Richard Owen, Joanne Homik, David F Kallmes, Kerry Siminoski | |
Differences between protocol and review
The protocol was extensively updated to conform with updated conduct and reporting standards of systematic reviews as recommended by The Cochrane Collaboration and the MECIR project.
At the time that the protocol was developed we had planned to include controlled before and after studies (CBAs) and interrupted time series (ITS) in our efficacy analysis if there were no published randomised or quasi‐randomised controlled trials. Subsequent to the publication of the protocol, several randomised controlled trials were published and we therefore only included randomised or quasi‐randomised controlled trials in this review.
Subsequent to publication of the protocol, we clarified the possible comparators eligible for inclusion, i.e., that we would include randomised controlled trials of vertebroplasty compared with any comparator, including sham, conservative treatment or other surgical procedures such as kyphoplasty.
Keywords
MeSH
Medical Subject Headings (MeSH) Keywords
- Bone Cements [therapeutic use];
- Fractures, Compression [*therapy];
- Glucocorticoids [therapeutic use];
- Osteoporotic Fractures [*therapy];
- Pain Measurement;
- Pain, Postoperative;
- Quality of Life;
- Randomized Controlled Trials as Topic;
- Spinal Fractures [*therapy];
- Vertebroplasty [adverse effects, *methods];
Medical Subject Headings Check Words
Aged; Aged, 80 and over; Female; Humans; Male; Middle Aged;
PICO

Study flow diagram.

Risk of bias summary: review authors' judgements about each risk of bias item for each included study.

Risk of bias summary: review authors' judgements about the risk of bias of the available evidence presented as percentages across all included studies.

Comparison 1 Efficacy: Vertebroplasty versus placebo (sham), Outcome 1 Pain (0 to 10 point scale).
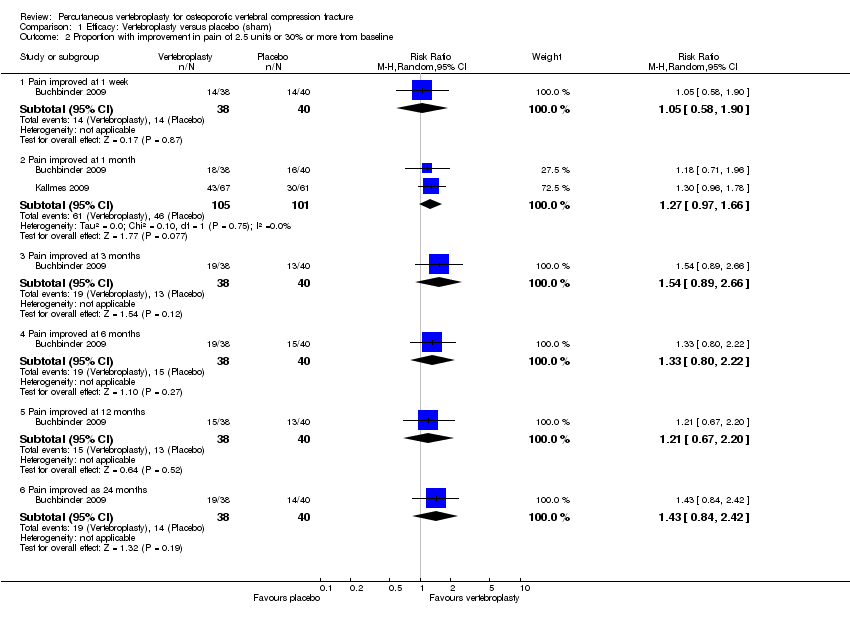
Comparison 1 Efficacy: Vertebroplasty versus placebo (sham), Outcome 2 Proportion with improvement in pain of 2.5 units or 30% or more from baseline.

Comparison 1 Efficacy: Vertebroplasty versus placebo (sham), Outcome 3 Disability (RMDQ).
![Comparison 1 Efficacy: Vertebroplasty versus placebo (sham), Outcome 4 Quality of life (QUALEFFO) [0 to 100].](/es/cdsr/doi/10.1002/14651858.CD006349.pub2/media/CDSR/CD006349/rel0002/CD006349/image_n/nCD006349-CMP-001-04.png)
Comparison 1 Efficacy: Vertebroplasty versus placebo (sham), Outcome 4 Quality of life (QUALEFFO) [0 to 100].
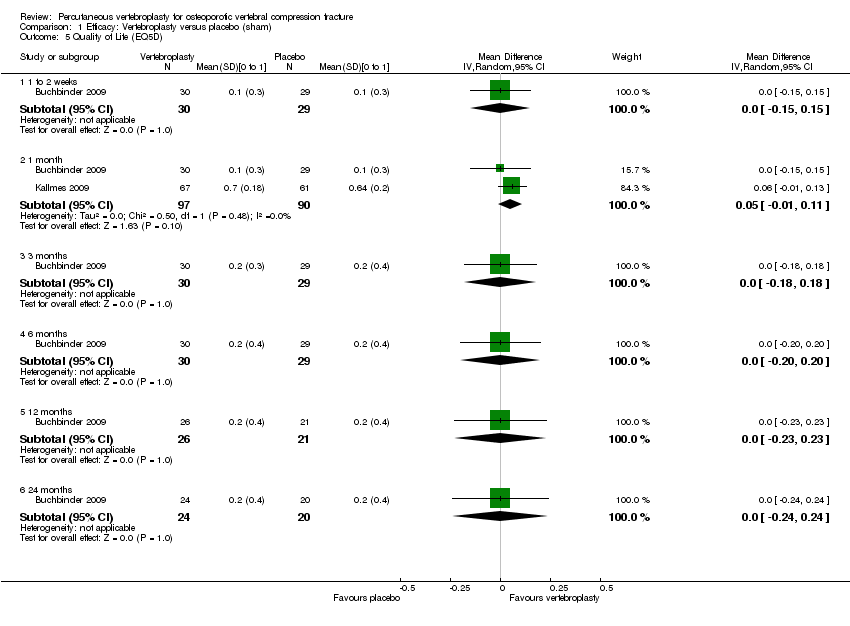
Comparison 1 Efficacy: Vertebroplasty versus placebo (sham), Outcome 5 Quality of Life (EQ5D).
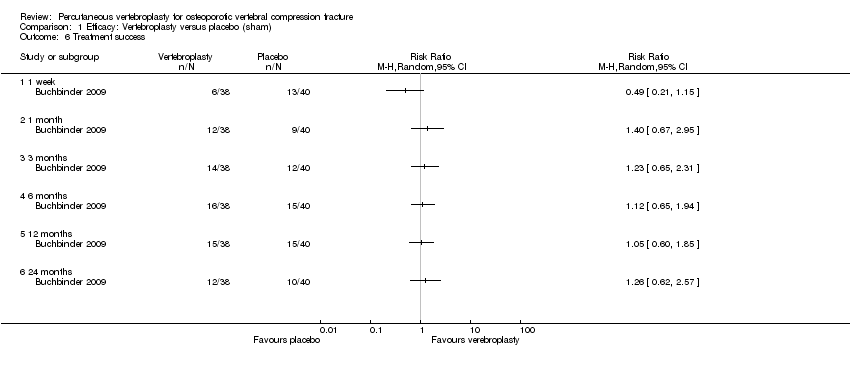
Comparison 1 Efficacy: Vertebroplasty versus placebo (sham), Outcome 6 Treatment success.

Comparison 2 Efficacy: Vertebroplasty versus usual care (open label), Outcome 1 Pain (0 or 1 to 10 point scale).
![Comparison 2 Efficacy: Vertebroplasty versus usual care (open label), Outcome 2 Disability (RMDQ [0 to 24] or ODI [0 to 100]).](/es/cdsr/doi/10.1002/14651858.CD006349.pub2/media/CDSR/CD006349/rel0002/CD006349/image_n/nCD006349-CMP-002-02.png)
Comparison 2 Efficacy: Vertebroplasty versus usual care (open label), Outcome 2 Disability (RMDQ [0 to 24] or ODI [0 to 100]).
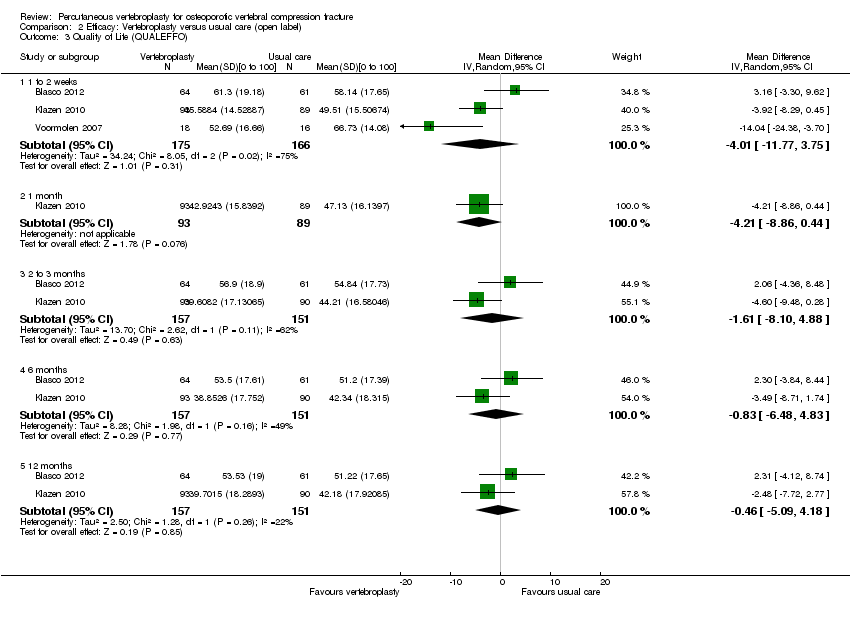
Comparison 2 Efficacy: Vertebroplasty versus usual care (open label), Outcome 3 Quality of Life (QUALEFFO).

Comparison 2 Efficacy: Vertebroplasty versus usual care (open label), Outcome 4 Quality of life (EQ5D).

Comparison 3 Efficacy: Vertebroplasty versus kyphoplasty (balloon), Outcome 1 Pain (0 to 10 point scale).

Comparison 3 Efficacy: Vertebroplasty versus kyphoplasty (balloon), Outcome 2 Disability (ODI).
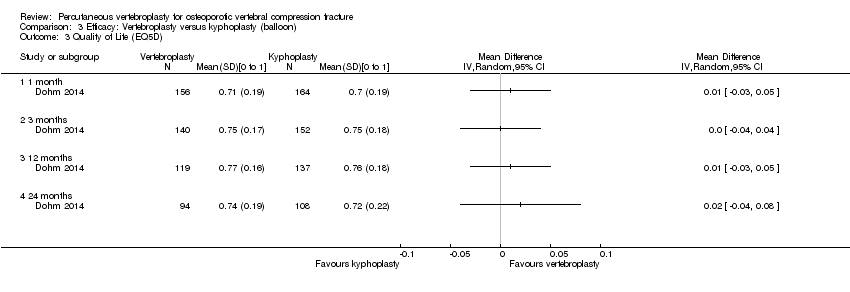
Comparison 3 Efficacy: Vertebroplasty versus kyphoplasty (balloon), Outcome 3 Quality of Life (EQ5D).

Comparison 4 Safety: Vertebroplasty versus placebo (sham) or usual care, Outcome 1 New clinical vertebral fractures.

Comparison 4 Safety: Vertebroplasty versus placebo (sham) or usual care, Outcome 2 New radiographic vertebral fractures.
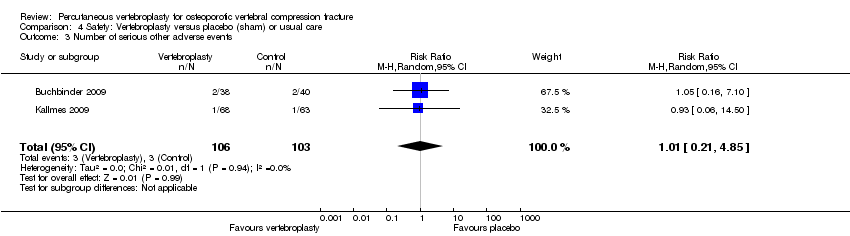
Comparison 4 Safety: Vertebroplasty versus placebo (sham) or usual care, Outcome 3 Number of serious other adverse events.
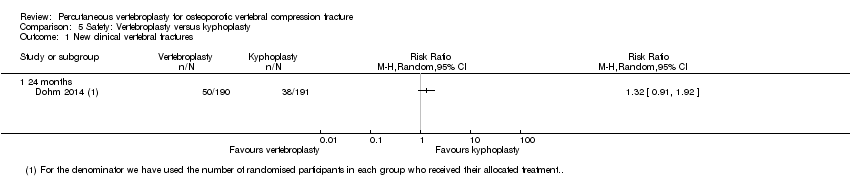
Comparison 5 Safety: Vertebroplasty versus kyphoplasty, Outcome 1 New clinical vertebral fractures.

Comparison 5 Safety: Vertebroplasty versus kyphoplasty, Outcome 2 New radiographic vertebral fractures.

Comparison 6 Subgroup analysis: Duration pain ≤ 6 weeks versus > 6 weeks, Outcome 1 Pain at 1 to 2 weeks.

Comparison 6 Subgroup analysis: Duration pain ≤ 6 weeks versus > 6 weeks, Outcome 2 Pain at 1 month.

Comparison 6 Subgroup analysis: Duration pain ≤ 6 weeks versus > 6 weeks, Outcome 3 Disability at 1 to 2 weeks.

Comparison 6 Subgroup analysis: Duration pain ≤ 6 weeks versus > 6 weeks, Outcome 4 Disability at 1 month.
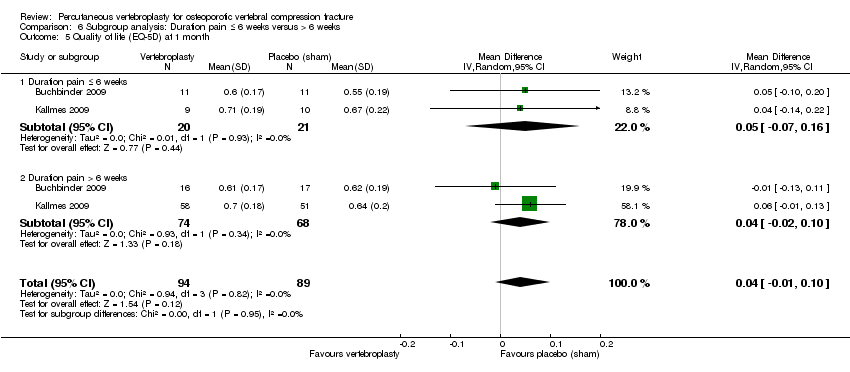
Comparison 6 Subgroup analysis: Duration pain ≤ 6 weeks versus > 6 weeks, Outcome 5 Quality of life (EQ‐5D) at 1 month.

Comparison 7 Sensitivity analysis, Outcome 1 Pain at 1 to 2 weeks (0 to 10 scale).

Comparison 7 Sensitivity analysis, Outcome 2 Pain at 1 month (0 to 10 scale).
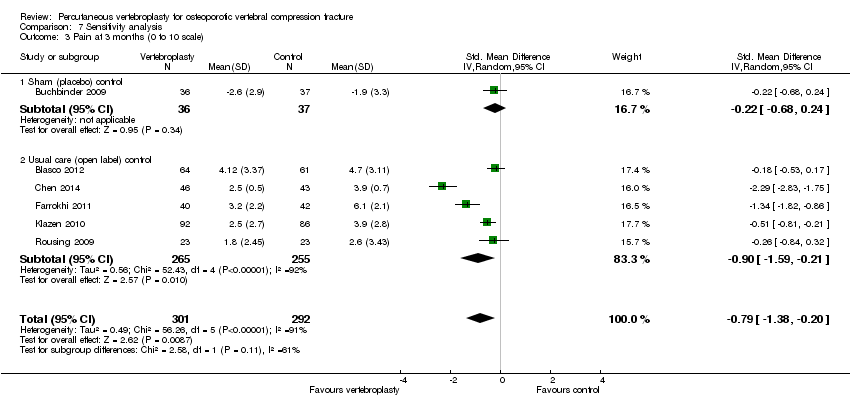
Comparison 7 Sensitivity analysis, Outcome 3 Pain at 3 months (0 to 10 scale).
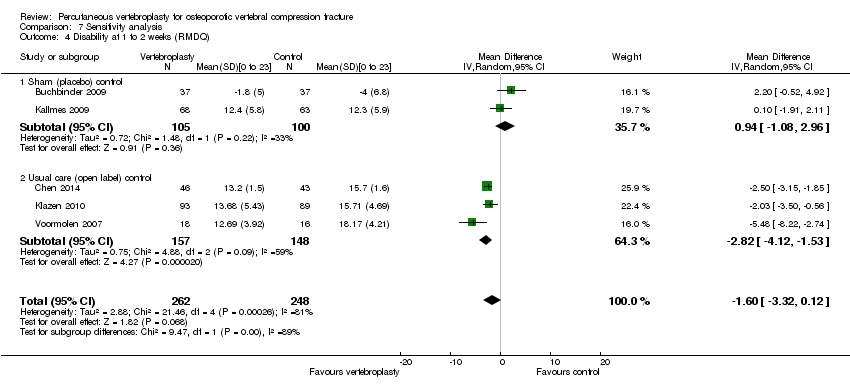
Comparison 7 Sensitivity analysis, Outcome 4 Disability at 1 to 2 weeks (RMDQ).

Comparison 7 Sensitivity analysis, Outcome 5 Disability at 1 month (RMDQ).
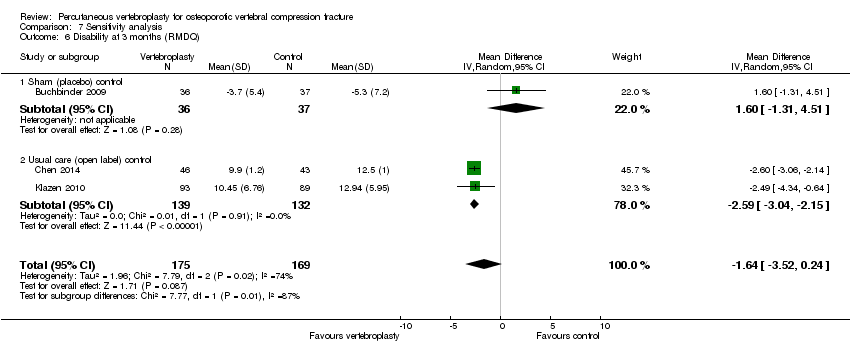
Comparison 7 Sensitivity analysis, Outcome 6 Disability at 3 months (RMDQ).
| Vertebroplasty for osteoporotic vertebral compression fracture | ||||||
| Patient or population: people with osteoporotic vertebral compression fracture | ||||||
| Outcomes | Illustrative comparative risks* (95% CI) | Relative effect | No of Participants | Quality of the evidence | Comments | |
| Assumed risk | Corresponding risk | |||||
| Sham1 | Vertebroplasty | |||||
| Pain | The mean pain in the control groups was | The mean pain in the intervention groups was | 201 | ⊕⊕⊕⊝ | Absolute change 7% better (15% better to 1.5% worse); relative change 10% better (21% better to 2% worse); NNTB n/a2,3 | |
| Disability (Roland‐Morris Disability Questionnaire) | The mean disability in the control groups was | The mean disability in the intervention groups was | 201 | ⊕⊕⊕⊝ | Absolute change 4.8% better (12.8% better to 3.3% worse); relative change 6.3% better (17.0% better to 4.4% worse); NNTB n/a2,3 | |
| Disease‐specific quality of Life (QUALEFFO) | The mean quality of life (QUALEFFO) in the control groups was | The mean quality of life in the intervention groups was | 73 | ⊕⊕⊕⊝ | Absolute change 0.4% worse (5% worse to 5% better); relative change: 0.7% worse (9% worse to 8% better); NNT n/a2,3 | |
| Overall quality of Life (EQ5D) | The mean quality of life (EQ‐5D) in the control groups was | The mean quality of life in the intervention groups was | 201 | ⊕⊕⊕⊝ | Absolute change 5% better (1% worse to 11% better); relative change: 18% improvement (4% worse to 39% better); NNT n/a2,3 | |
| Participant global assessment of success (People perceived their pain as better) Follow‐up: 1 month | 225 per 1000 | 315 per 1000 | RR 1.40 | 78 | ⊕⊕⊕⊝ | Absolute risk difference 9% more reported success (11% fewer to 29% more); relative change 40% more reported success (33% fewer to 195% more); NNTB n/a2 |
| Incident vertebral fractures Follow‐up: 12 months | 138 per 1000 | 203 per 1000 | RR 1.47 | 281 | ⊕⊕⊕⊝ | Absolute difference 6% more new fractures with vertebroplasty (2% fewer to 14% more); relative difference 47% more (61% fewer to 450% more); NNTH n/a2 |
| Other serious adverse events | 28 per 1000 | 29 per 1000 | RR 1.01 | 209 | ⊕⊕⊕⊝ | Absolute difference no more events with vertebroplasty (4% fewer to 4% more); relative change 1% more (79% fewer to 385% more); NNTH n/a2 |
| *The basis for the assumed risk (e.g. the median control group risk across studies) is provided in footnotes. The corresponding risk (and its 95% confidence interval) is based on the assumed risk in the comparison group and the relative effect of the intervention (and its 95% CI). | ||||||
| GRADE Working Group grades of evidence | ||||||
| 1For incident vertebral fractures the comparison includes one sham trial and two trials that compared vertebroplasty versus usual care. 2 Number needed to treat to benefit (NNTB), or harm (NNTH) not applicable (n/a) when result is not statistically significant. NNT for dichotomous outcomes calculated using Cates NNT calculator (http://www.nntonline.net/visualrx/). NNT for continuous outcomes calculated using Wells Calculator (CMSG editorial office) 3 Relative changes calculated as absolute change (mean difference) divided by mean at baseline in the placebo group from Buchbinder 2009 (values were: 7.1 points on 0 to 10 point VAS pain; 17.3 points on 0 to 23 point Roland‐Morris Disability questionnaire; 0.28 points on EQ‐5D quality of life scale; 59.6 points on the QUALEFFO scale) 4 Downgraded due to imprecision: the 95% confidence intervals do not exclude a clinically important change (defined as 1.5 points on 0 to 10 point VAS pain scale; 2 to 3 points on the 0 to 23 point RDQ scale; 0.074 on the 0 to 1 EQ‐5D quality of life scale, and 10 points on the 0 to 100 QUALEFFO scale), or the total number of participants was small, from a single trial only 5 Total number of events small 6 Pooled both placebo and usual care comparisons in the safety analyses. | ||||||
| Trial registration number | Principle Investigator/s and Country | Comparator/s | Main selection criteria | Registration date | Recruitment commenced | Status 24 November 2014 | Planned sample size | Final sample size |
| NCT01482793 | Clark W, Bird P Australia | Sham | Age > 60 years Fracture < 6 weeks | 28 Nov 2011 | Nov 2011 | Recruiting (last verified Nov 2011) | 120 | ‐ |
| NCT00749060 ‘OSTEO‐6’ | Laredo JD France | Kyphoplasty; Usual care with or without brace | Age ≥ 50 years Fracture < 6 weeks | 8 Sept 2008 | Dec 2007 | Completed June 2012; results unpublished | 300 | 48 |
| NCT00749086 ‘STIC2’ | Laredo JD France | Kyphoplasty | Age ≥ 50 years Fracture > 6 weeks | 8 Sept 2008 | Dec 2007 | Completed June 2012; results unpublished | 200 | 97 |
| NCT00635297 | Nakstad PH Norway | Vertebroplasty of fractured vertebra +/‐ additional vertebroplasty to adjacent vertebrae | Age > 50 years | 5 Mar 2008 | Apr 2008 | Suspended, reason not stated (last updated 2 Mar 2010) | 100 | ‐ |
| NCT00203554 | Sorensen L Denmark | Usual care | Fracture < 6 months | 16/09/2005 | Mar 2004 | Completed Jan 2008; results unpublished | 27 | 27 |
| ISRCTN14442024 (Also N0213112414) | Dolin, S UK | Usual care | Fracture > 4 weeks | 12 Sep 2003 | Nov 28 2005 | Completed (last updated 6 Feb 2014); results unpublished | Not provided | Not provided |
| chiCTR‐TRC‐14004835 | Zhao J, Liu B China | Ordinary vs high viscosity cement | Includes osteoporotic fractures, haemangiomas and metastatic disease | 23 Jun 2014 | Planned 1 Jan 2015 | Not yet recruiting | 100 | ‐ |
| NCT01677806 | Sun G China | Usual care | Age ≥ 50 years Fracture < 6 weeks | 23 Aug 2012 | Oct 2012 | Recruiting (last updated 7 Aug 2014) | 114 | ‐ |
| NCT01537770 (also EUCTR2010‐024050‐10‐DK ‘VOPE’ | Hansen EJ, Andersen MO, Rousing R, Tropp H Denmark | Lidocaine | Age > 50 years | 6 Jan 2011 | Feb 2012 | No longer recruiting (last updated 21 Oct 2014) | 80 | ‐ |
| NTR3282 | Nieuwenhuijse MJ Netherlands | Low vs high viscosity cement | ‐ | 14 Feb 2012 | Jan 2011 | Recruiting (last updated 21 July 2014) | 86 | ‐ |
| NCT01200277 ‘VERTOS IV’ | van Rooij HJ, De Vries J, Lohle PN Netherlands | Sham | Age ≥ 50 years Fracture ≤ 6 weeks | 7 Sept 2010 | Jan 2011 | Completed (last updated 19 Nov 2014) | 80 | ‐ |
| NCT00279877 | Evans A USA | Kyphoplasty | 18 Jan 2006 | May 2005 | Completed May 2011; results unpublished | 112 | Not provided | |
| Registration details not found. | Longo UG Italy | 3 weeks bed rest, rigid hyperextension corset, followed by 2‐3 months in a Cheneau brace (called ‘double‐blind) | Age ≥ 50 years | Trial registration not found | Unknown | Unknown (protocol published) | 200 | ‐ |
| NCT01963039 ‘VERTOS V’ | Carli D Netherlands | Sham | Age ≥ 50 years Fracture ≥ 12 weeks | 28 Aug 2013 | May 2013 | Recruiting (last updated Oct 2013)(protocol published) | 94 | ‐ |
| Registration details not found. Results published as conference abstract* | Hao, D, Guo, H, Wang, B, Wang X | Facet joint block | Age ≥55 years Fracture ≤ 8 weeks | Trial registration not found | Jan 2009 | Recruitment completed Jan 2013 | Not stated | 206 (100 in VP; 106 in facet block group) |
| * Abstract reported that analysis favoured vertebroplasty at 1 day and 1 week for pain and disability measured by RMDQ and ODI but no between‐group differences at 1, 3, 6, 12 months for pain, RMDQ, ODI and SF‐36 function and SF‐36 physical and mental component scores. After 12 months follow‐up, there were 13 new fractures in the percutaneous vertebroplasty group and 11 new fractures in the facet joint block group. Abstract did not report method of randomisation, whether or not treatment allocation was concealed and whether or not participants and investigators were blinded to treatment allocation. | ||||||||
| Study | Country | Treatment Groups | Mean age, yrs | Mean symptom duration | Mean (SD) baseline pain (0‐10 scale$) | Mean (SD) baseline RMDQ+ (0‐24 scale†) | Mean (SD) baseline QUALEFFO (0‐100 scale) | Procedures performed by | Mean (range) volume cement injected (mL) | Follow‐up |
| Spain | Vertebroplasty | 71.3 | 140.3 days | 7.2 (0.3) | ‐ | 65.2 (2.2) | Interventional radiologists | Not specified | 2 weeks, 2, 6, 12 months | |
| Usual care | 71.3 | 143.1 days | 6.3 (0.4) | ‐ | 59.2 (2.2) | |||||
| Australia | Vertebroplasty | 74.2 | 9 weeks^ | 7.4 (2.1) | 17.3 (2.8) | 56.9 (13.4) | Interventional radiologists | 2.8 (1.2 ‐ 5.5) | 1 week, 1, 3, 6, 12, 24 months | |
| Placebo | 78.9 | 9.5 weeks^ | 7.1 (2.3) | 17.3 (2.9) | 59.6 (17.1) | |||||
| China | Vertebroplasty | 64.6 | 31 weeks | 6.5 (0.9)& | 18.6 (1.8)#& | ‐ | Orthopaedic surgeons | 3.6 (3 ‐ 6) | 1 day, 1 week, 1, 3, 6, 12 months | |
| Usual care and brace | 66.5 | 29.5 weeks | 6.4 (0.9)& | 16.7 (1.3)#& | ‐ | |||||
| USA and Canada | Vertebroplasty | 75.7 | ‐¤ | ˜7.6µ | ‐ | ‐ | Interventional radiologists and neuroradiologists, orthopaedic surgeons, neuroradiologists | 4.0 (3.0 to 6.0)¢ | 7 days, 1, 3, 12 and 24 months | |
| Balloon kyphoplasty | 75.5 | ‐¤ | ˜7.6µ | ‐ | Not stated | 4.6 (3.4 to 6.0)¢ | ||||
| Germany | Vertebroplasty | 71.3 | ‐§ | 7.8 (0.9) | ‐ | ‐ | Orthopaedic surgeon | 3.1 (2 – 4) | Immediately, mean 5.8 months (range: 4 to 7) | |
| Balloon kyphoplasty | 63.3 | ‐§ | 9.0 (0.7) | ‐ | ‐ | Orthopaedic surgeon | 3.9 (3 – 5) | |||
| Shield kyphoplasty | 67.1 | ‐§ | 8.8 (1.5) | ‐ | ‐ | Orthopaedic surgeon | 4.6 (3 – 6) | |||
| Iran | Vertebroplasty | 72 | 27 weeks | 8.4 (1.6) | ‐ | ‐ | Neurosurgeons | 3.5 (1 ‐ 5.5) | 1 week, 2, 6, 12, 24, 36 months | |
| Usual care | 74 | 30 weeks | 7.2 (1.7) | ‐ | ‐ | |||||
| US, UK, Australia | Vertebroplasty | 73.4 | 16 weeks | 6.9 (2.0) | 16.6 (3.8) | ‐ | Interventional radiologists | 2.8 (1 ‐ 5.5)* | 3 days, 2 weeks, 1 month | |
| Placebo | 73.3 | 20 weeks | 7.2 (2.0) | 17.5 (4.1) | ‐ | |||||
| Netherlands, Belgium | Vertebroplasty | 75.2 | 29.3 days | 7.8 (1.5) | 18.6 (3.6)# | 58.7 (13.5) | Interventional radiologists | 4.1 (1 ‐ 9) | 1 day, 1 week, 1, 3, 6, 12 months | |
| Usual care | 75.4 | 26.8 days | 7.5 (1.6) | 17.2 (4.2)# | 54.7 (14.4) | |||||
| Taiwan | Vertebroplasty | 74.3 | 15.8 days | 7.9 (0.7) | ‐ | ‐ | Not stated | 4.9 (0.7) | 3 days, 6 months | |
| Balloon kyphoplasty | 72.3 | 17.0 days | 8.0 (0.8) | ‐ | ‐ | Not stated | 5.6 (0.6) | |||
| Denmark | Vertebroplasty | 80 | 8.4 days | 7.5 (2.0) | ‐ | ‐ | Orthopedic surgeons | Not specified | 3 months | |
| Usual care and brace | 80 | 6.7 days | 8.8 (1.2) | ‐ | ‐ | |||||
| Germany and USA | Vertebroplasty | 74 | ‐¥ | 8.5 (1.2) | ‐ | ‐ | Not stated | 4.0 (1.1) | 1 day, 3, 12 months | |
| Shield kyphoplasty | 80 | ‐¥ | 8.3 (1.1) | ‐ | ‐ | Not stated | 3.8 (0.7) | |||
| Netherlands | Vertebroplasty | 72 | 85 days | 7.1 (5 ‐ 9)+ | 15.7 (8‐24) | 60.0 (37 to 86)+ | Interventional radiologists | 3.2 (1.0 ‐ 5.0) | 2 weeks | |
| Usual care | 74 | 76 days | 7.6 (5‐10) | 17.8 (8‐22) | 60.7 (38 to 86) | |||||
| $1‐10 point scale used by Farrokhi 2011; +RMDQ: Roland Morris Disability Questionnaire; †modified RMDQ (0‐23 scale) used by Buchbinder 2009 and Kallmes 2009; ^ median duration of symptoms; ¤Not reported but symptom duration 6 months or less; µMean symptom duration reported graphically only; ¢Median and interquartile range;§Not reported but symptom duration 6 weeks or less; &Data only included for the 42/46 in VP group and 43/50 in the usual care group who completed 12‐month follow‐up in groups assigned to at baseline; #Disability significantly higher in the vertebroplasty group; *from n = 20 treated at Mayo (personal communication); ¥Not reported but at least 6 weeks of conservative treatment; +Only range provided. | ||||||||||
| Outcome or subgroup title | No. of studies | No. of participants | Statistical method | Effect size |
| 1 Pain (0 to 10 point scale) Show forest plot | 2 | Mean Difference (IV, Random, 95% CI) | Subtotals only | |
| 1.1 1 to 2 weeks | 2 | 205 | Mean Difference (IV, Random, 95% CI) | 0.12 [‐0.65, 0.88] |
| 1.2 1 month | 2 | 201 | Mean Difference (IV, Random, 95% CI) | ‐0.66 [‐1.48, 0.15] |
| 1.3 3 months | 1 | 73 | Mean Difference (IV, Random, 95% CI) | ‐0.70 [‐2.12, 0.72] |
| 1.4 6 months | 1 | 71 | Mean Difference (IV, Random, 95% CI) | ‐0.30 [‐1.84, 1.24] |
| 1.5 12 months | 1 | 67 | Mean Difference (IV, Random, 95% CI) | ‐0.5 [‐1.82, 0.82] |
| 1.6 24 months | 1 | 57 | Mean Difference (IV, Random, 95% CI) | ‐1.1 [‐2.68, 0.48] |
| 2 Proportion with improvement in pain of 2.5 units or 30% or more from baseline Show forest plot | 2 | Risk Ratio (M‐H, Random, 95% CI) | Subtotals only | |
| 2.1 Pain improved at 1 week | 1 | 78 | Risk Ratio (M‐H, Random, 95% CI) | 1.05 [0.58, 1.90] |
| 2.2 Pain improved at 1 month | 2 | 206 | Risk Ratio (M‐H, Random, 95% CI) | 1.27 [0.97, 1.66] |
| 2.3 Pain improved at 3 months | 1 | 78 | Risk Ratio (M‐H, Random, 95% CI) | 1.54 [0.89, 2.66] |
| 2.4 Pain improved at 6 months | 1 | 78 | Risk Ratio (M‐H, Random, 95% CI) | 1.33 [0.80, 2.22] |
| 2.5 Pain improved at 12 months | 1 | 78 | Risk Ratio (M‐H, Random, 95% CI) | 1.21 [0.67, 2.20] |
| 2.6 Pain improved as 24 months | 1 | 78 | Risk Ratio (M‐H, Random, 95% CI) | 1.43 [0.84, 2.42] |
| 3 Disability (RMDQ) Show forest plot | 2 | Mean Difference (IV, Random, 95% CI) | Subtotals only | |
| 3.1 1 to 2 weeks | 2 | 190 | Mean Difference (IV, Random, 95% CI) | 0.82 [‐1.13, 2.78] |
| 3.2 1 month | 2 | 187 | Mean Difference (IV, Random, 95% CI) | ‐1.09 [‐2.94, 0.76] |
| 3.3 3 months | 1 | 59 | Mean Difference (IV, Random, 95% CI) | 1.60 [‐1.66, 4.86] |
| 3.4 6 months | 1 | 59 | Mean Difference (IV, Random, 95% CI) | ‐0.40 [‐3.36, 2.56] |
| 3.5 12 months | 1 | 48 | Mean Difference (IV, Random, 95% CI) | 0.60 [‐3.02, 4.22] |
| 3.6 24 months | 1 | 43 | Mean Difference (IV, Random, 95% CI) | 0.10 [‐3.67, 3.87] |
| 4 Quality of life (QUALEFFO) [0 to 100] Show forest plot | 1 | Mean Difference (IV, Random, 95% CI) | Totals not selected | |
| 4.1 1 week | 1 | Mean Difference (IV, Random, 95% CI) | 0.0 [0.0, 0.0] | |
| 4.2 1 month | 1 | Mean Difference (IV, Random, 95% CI) | 0.0 [0.0, 0.0] | |
| 4.3 3 months | 1 | Mean Difference (IV, Random, 95% CI) | 0.0 [0.0, 0.0] | |
| 4.4 6 months | 1 | Mean Difference (IV, Random, 95% CI) | 0.0 [0.0, 0.0] | |
| 4.5 12 months | 1 | Mean Difference (IV, Random, 95% CI) | 0.0 [0.0, 0.0] | |
| 4.6 24 months | 1 | Mean Difference (IV, Random, 95% CI) | 0.0 [0.0, 0.0] | |
| 5 Quality of Life (EQ5D) Show forest plot | 2 | Mean Difference (IV, Random, 95% CI) | Subtotals only | |
| 5.1 1 to 2 weeks | 1 | 59 | Mean Difference (IV, Random, 95% CI) | 0.0 [‐0.15, 0.15] |
| 5.2 1 month | 2 | 187 | Mean Difference (IV, Random, 95% CI) | 0.05 [‐0.01, 0.11] |
| 5.3 3 months | 1 | 59 | Mean Difference (IV, Random, 95% CI) | 0.0 [‐0.18, 0.18] |
| 5.4 6 months | 1 | 59 | Mean Difference (IV, Random, 95% CI) | 0.0 [‐0.20, 0.20] |
| 5.5 12 months | 1 | 47 | Mean Difference (IV, Random, 95% CI) | 0.0 [‐0.23, 0.23] |
| 5.6 24 months | 1 | 44 | Mean Difference (IV, Random, 95% CI) | 0.0 [‐0.24, 0.24] |
| 6 Treatment success Show forest plot | 1 | Risk Ratio (M‐H, Random, 95% CI) | Totals not selected | |
| 6.1 1 week | 1 | Risk Ratio (M‐H, Random, 95% CI) | 0.0 [0.0, 0.0] | |
| 6.2 1 month | 1 | Risk Ratio (M‐H, Random, 95% CI) | 0.0 [0.0, 0.0] | |
| 6.3 3 months | 1 | Risk Ratio (M‐H, Random, 95% CI) | 0.0 [0.0, 0.0] | |
| 6.4 6 months | 1 | Risk Ratio (M‐H, Random, 95% CI) | 0.0 [0.0, 0.0] | |
| 6.5 12 months | 1 | Risk Ratio (M‐H, Random, 95% CI) | 0.0 [0.0, 0.0] | |
| 6.6 24 months | 1 | Risk Ratio (M‐H, Random, 95% CI) | 0.0 [0.0, 0.0] | |
| Outcome or subgroup title | No. of studies | No. of participants | Statistical method | Effect size |
| 1 Pain (0 or 1 to 10 point scale) Show forest plot | 6 | Std. Mean Difference (IV, Random, 95% CI) | Subtotals only | |
| 1.1 1 to 2 weeks | 5 | 520 | Std. Mean Difference (IV, Random, 95% CI) | ‐1.07 [‐2.01, ‐0.14] |
| 1.2 1 month | 2 | 277 | Std. Mean Difference (IV, Random, 95% CI) | ‐1.62 [‐3.01, ‐0.24] |
| 1.3 2 to 3 months | 5 | 520 | Std. Mean Difference (IV, Random, 95% CI) | ‐0.90 [‐1.59, ‐0.21] |
| 1.4 6 months | 4 | 466 | Std. Mean Difference (IV, Random, 95% CI) | ‐0.88 [‐1.71, ‐0.04] |
| 1.5 12 months | 5 | 505 | Std. Mean Difference (IV, Random, 95% CI) | ‐0.83 [‐1.55, ‐0.11] |
| 1.6 24 months | 1 | 77 | Std. Mean Difference (IV, Random, 95% CI) | ‐0.45 [‐0.90, 0.01] |
| 2 Disability (RMDQ [0 to 24] or ODI [0 to 100]) Show forest plot | 5 | Std. Mean Difference (IV, Random, 95% CI) | Subtotals only | |
| 2.1 1 to 2 weeks | 4 | 387 | Std. Mean Difference (IV, Random, 95% CI) | ‐2.04 [‐3.57, ‐0.50] |
| 2.2 1 month | 2 | 271 | Std. Mean Difference (IV, Random, 95% CI) | ‐0.94 [‐2.30, 0.43] |
| 2.3 3 months | 4 | 396 | Std. Mean Difference (IV, Random, 95% CI) | ‐1.90 [‐3.76, ‐0.04] |
| 2.4 6 months | 3 | 354 | Std. Mean Difference (IV, Random, 95% CI) | ‐1.69 [‐3.55, 0.17] |
| 2.5 12 months | 4 | 389 | Std. Mean Difference (IV, Random, 95% CI) | ‐1.26 [‐2.61, 0.08] |
| 2.6 24 months | 1 | 77 | Std. Mean Difference (IV, Random, 95% CI) | ‐5.65 [‐6.67, ‐4.63] |
| 3 Quality of Life (QUALEFFO) Show forest plot | 3 | Mean Difference (IV, Random, 95% CI) | Subtotals only | |
| 3.1 1 to 2 weeks | 3 | 341 | Mean Difference (IV, Random, 95% CI) | ‐4.01 [‐11.77, 3.75] |
| 3.2 1 month | 1 | 182 | Mean Difference (IV, Random, 95% CI) | ‐4.21 [‐8.86, 0.44] |
| 3.3 2 to 3 months | 2 | 308 | Mean Difference (IV, Random, 95% CI) | ‐1.61 [‐8.10, 4.88] |
| 3.4 6 months | 2 | 308 | Mean Difference (IV, Random, 95% CI) | ‐0.83 [‐6.48, 4.83] |
| 3.5 12 months | 2 | 308 | Mean Difference (IV, Random, 95% CI) | ‐0.46 [‐5.09, 4.18] |
| 4 Quality of life (EQ5D) Show forest plot | 2 | Mean Difference (IV, Random, 95% CI) | Subtotals only | |
| 4.1 1 to 2 weeks | 1 | 183 | Mean Difference (IV, Random, 95% CI) | 0.08 [0.00, 0.15] |
| 4.2 1 month | 1 | 183 | Mean Difference (IV, Random, 95% CI) | 0.09 [0.01, 0.16] |
| 4.3 3 months | 2 | 215 | Mean Difference (IV, Random, 95% CI) | 0.10 [0.00, 0.20] |
| 4.4 6 months | 1 | 183 | Mean Difference (IV, Random, 95% CI) | 0.07 [‐0.02, 0.15] |
| 4.5 12 months | 2 | 215 | Mean Difference (IV, Random, 95% CI) | 0.07 [‐0.00, 0.14] |
| Outcome or subgroup title | No. of studies | No. of participants | Statistical method | Effect size |
| 1 Pain (0 to 10 point scale) Show forest plot | 3 | Mean Difference (IV, Random, 95% CI) | Subtotals only | |
| 1.1 1 to 2 weeks | 1 | 364 | Mean Difference (IV, Random, 95% CI) | ‐0.20 [‐0.75, 0.35] |
| 1.2 1 month | 1 | 342 | Mean Difference (IV, Random, 95% CI) | ‐0.10 [‐0.69, 0.49] |
| 1.3 3 months | 1 | 314 | Mean Difference (IV, Random, 95% CI) | ‐0.10 [‐0.74, 0.54] |
| 1.4 6 months | 2 | 141 | Mean Difference (IV, Random, 95% CI) | ‐0.08 [‐0.41, 0.24] |
| 1.5 12 months | 1 | 275 | Mean Difference (IV, Random, 95% CI) | 0.30 [‐0.40, 1.00] |
| 1.6 24 months | 1 | 220 | Mean Difference (IV, Random, 95% CI) | 0.10 [‐0.72, 0.92] |
| 2 Disability (ODI) Show forest plot | 1 | Mean Difference (IV, Random, 95% CI) | Totals not selected | |
| 2.1 1 month | 1 | Mean Difference (IV, Random, 95% CI) | 0.0 [0.0, 0.0] | |
| 2.2 3 months | 1 | Mean Difference (IV, Random, 95% CI) | 0.0 [0.0, 0.0] | |
| 2.3 12 months | 1 | Mean Difference (IV, Random, 95% CI) | 0.0 [0.0, 0.0] | |
| 2.4 24 months | 1 | Mean Difference (IV, Random, 95% CI) | 0.0 [0.0, 0.0] | |
| 3 Quality of Life (EQ5D) Show forest plot | 1 | Mean Difference (IV, Random, 95% CI) | Totals not selected | |
| 3.1 1 month | 1 | Mean Difference (IV, Random, 95% CI) | 0.0 [0.0, 0.0] | |
| 3.2 3 months | 1 | Mean Difference (IV, Random, 95% CI) | 0.0 [0.0, 0.0] | |
| 3.3 12 months | 1 | Mean Difference (IV, Random, 95% CI) | 0.0 [0.0, 0.0] | |
| 3.4 24 months | 1 | Mean Difference (IV, Random, 95% CI) | 0.0 [0.0, 0.0] | |
| Outcome or subgroup title | No. of studies | No. of participants | Statistical method | Effect size |
| 1 New clinical vertebral fractures Show forest plot | 4 | Risk Ratio (M‐H, Random, 95% CI) | Subtotals only | |
| 1.1 12 months | 3 | 281 | Risk Ratio (M‐H, Random, 95% CI) | 1.47 [0.39, 5.50] |
| 1.2 24 months | 2 | 134 | Risk Ratio (M‐H, Random, 95% CI) | 0.54 [0.09, 3.38] |
| 2 New radiographic vertebral fractures Show forest plot | 4 | Risk Ratio (M‐H, Random, 95% CI) | Subtotals only | |
| 2.1 12 months | 4 | 397 | Risk Ratio (M‐H, Random, 95% CI) | 1.43 [0.55, 3.74] |
| 2.2 24 months | 1 | 43 | Risk Ratio (M‐H, Random, 95% CI) | 1.48 [0.90, 2.44] |
| 3 Number of serious other adverse events Show forest plot | 2 | 209 | Risk Ratio (M‐H, Random, 95% CI) | 1.01 [0.21, 4.85] |
| Outcome or subgroup title | No. of studies | No. of participants | Statistical method | Effect size |
| 1 New clinical vertebral fractures Show forest plot | 1 | Risk Ratio (M‐H, Random, 95% CI) | Totals not selected | |
| 1.1 24 months | 1 | Risk Ratio (M‐H, Random, 95% CI) | 0.0 [0.0, 0.0] | |
| 2 New radiographic vertebral fractures Show forest plot | 1 | Risk Ratio (M‐H, Random, 95% CI) | Totals not selected | |
| 2.1 12 months | 1 | Risk Ratio (M‐H, Random, 95% CI) | 0.0 [0.0, 0.0] | |
| 2.2 24 months | 1 | Risk Ratio (M‐H, Random, 95% CI) | 0.0 [0.0, 0.0] | |
| Outcome or subgroup title | No. of studies | No. of participants | Statistical method | Effect size |
| 1 Pain at 1 to 2 weeks Show forest plot | 2 | 201 | Mean Difference (IV, Random, 95% CI) | 0.19 [‐0.58, 0.95] |
| 1.1 Duration pain ≤ 6 weeks | 2 | 44 | Mean Difference (IV, Random, 95% CI) | 0.64 [‐0.97, 2.26] |
| 1.2 Duration pain > 6 weeks | 2 | 157 | Mean Difference (IV, Random, 95% CI) | 0.05 [‐0.81, 0.92] |
| 2 Pain at 1 month Show forest plot | 2 | 201 | Mean Difference (IV, Random, 95% CI) | ‐0.66 [‐1.44, 0.13] |
| 2.1 Duration pain ≤ 6 weeks | 2 | 44 | Mean Difference (IV, Random, 95% CI) | 0.04 [‐1.80, 1.87] |
| 2.2 Duration pain > 6 weeks | 2 | 157 | Mean Difference (IV, Random, 95% CI) | ‐0.81 [‐1.68, 0.05] |
| 3 Disability at 1 to 2 weeks Show forest plot | 2 | 182 | Mean Difference (IV, Random, 95% CI) | 0.64 [‐0.88, 2.15] |
| 3.1 Duration pain ≤ 6 weeks | 2 | 41 | Mean Difference (IV, Random, 95% CI) | 0.20 [‐3.33, 3.72] |
| 3.2 Duration pain > 6 weeks | 2 | 141 | Mean Difference (IV, Random, 95% CI) | 0.74 [‐0.94, 2.42] |
| 4 Disability at 1 month Show forest plot | 2 | Mean Difference (IV, Random, 95% CI) | Subtotals only | |
| 4.1 Duration pain ≤ 6 weeks | 2 | 41 | Mean Difference (IV, Random, 95% CI) | ‐0.43 [‐4.02, 3.16] |
| 4.2 Duration pain > 6 weeks | 2 | 142 | Mean Difference (IV, Random, 95% CI) | ‐0.83 [‐2.87, 1.21] |
| 5 Quality of life (EQ‐5D) at 1 month Show forest plot | 2 | 183 | Mean Difference (IV, Random, 95% CI) | 0.04 [‐0.01, 0.10] |
| 5.1 Duration pain ≤ 6 weeks | 2 | 41 | Mean Difference (IV, Random, 95% CI) | 0.05 [‐0.07, 0.16] |
| 5.2 Duration pain > 6 weeks | 2 | 142 | Mean Difference (IV, Random, 95% CI) | 0.04 [‐0.02, 0.10] |
| Outcome or subgroup title | No. of studies | No. of participants | Statistical method | Effect size |
| 1 Pain at 1 to 2 weeks (0 to 10 scale) Show forest plot | 7 | 725 | Std. Mean Difference (IV, Random, 95% CI) | ‐0.43 [‐0.91, 0.06] |
| 1.1 Sham (placebo) control | 2 | 205 | Std. Mean Difference (IV, Random, 95% CI) | 0.04 [‐0.24, 0.31] |
| 1.2 Usual care (open label) control | 5 | 520 | Std. Mean Difference (IV, Random, 95% CI) | ‐0.64 [‐1.27, ‐0.00] |
| 2 Pain at 1 month (0 to 10 scale) Show forest plot | 4 | 478 | Std. Mean Difference (IV, Random, 95% CI) | ‐0.91 [‐1.71, ‐0.12] |
| 2.1 Sham (placebo) control | 2 | 201 | Std. Mean Difference (IV, Random, 95% CI) | ‐0.22 [‐0.50, 0.06] |
| 2.2 Usual care (open label) control | 2 | 277 | Std. Mean Difference (IV, Random, 95% CI) | ‐1.62 [‐3.01, ‐0.24] |
| 3 Pain at 3 months (0 to 10 scale) Show forest plot | 6 | 593 | Std. Mean Difference (IV, Random, 95% CI) | ‐0.79 [‐1.38, ‐0.20] |
| 3.1 Sham (placebo) control | 1 | 73 | Std. Mean Difference (IV, Random, 95% CI) | ‐0.22 [‐0.68, 0.24] |
| 3.2 Usual care (open label) control | 5 | 520 | Std. Mean Difference (IV, Random, 95% CI) | ‐0.90 [‐1.59, ‐0.21] |
| 4 Disability at 1 to 2 weeks (RMDQ) Show forest plot | 5 | 510 | Mean Difference (IV, Random, 95% CI) | ‐1.60 [‐3.32, 0.12] |
| 4.1 Sham (placebo) control | 2 | 205 | Mean Difference (IV, Random, 95% CI) | 0.94 [‐1.08, 2.96] |
| 4.2 Usual care (open label) control | 3 | 305 | Mean Difference (IV, Random, 95% CI) | ‐2.82 [‐4.12, ‐1.53] |
| 5 Disability at 1 month (RMDQ) Show forest plot | 4 | 472 | Mean Difference (IV, Random, 95% CI) | ‐1.26 [‐2.51, ‐0.00] |
| 5.1 Sham (placebo) control | 2 | 201 | Mean Difference (IV, Random, 95% CI) | 0.12 [‐2.40, 2.64] |
| 5.2 Usual care (open label) control | 2 | 271 | Mean Difference (IV, Random, 95% CI) | ‐2.05 [‐2.56, ‐1.54] |
| 6 Disability at 3 months (RMDQ) Show forest plot | 3 | 344 | Mean Difference (IV, Random, 95% CI) | ‐1.64 [‐3.52, 0.24] |
| 6.1 Sham (placebo) control | 1 | 73 | Mean Difference (IV, Random, 95% CI) | 1.60 [‐1.31, 4.51] |
| 6.2 Usual care (open label) control | 2 | 271 | Mean Difference (IV, Random, 95% CI) | ‐2.59 [‐3.04, ‐2.15] |