| 1 Recovery time Show forest plot | 11 | 776 | Mean Difference (IV, Random, 95% CI) | ‐16.59 [‐24.99, ‐8.18] |
|
| 1.1 Propofol alone | 4 | 249 | Mean Difference (IV, Random, 95% CI) | ‐14.68 [‐19.79, ‐9.58] |
| 1.2 Propofol combined with another agent | 7 | 527 | Mean Difference (IV, Random, 95% CI) | ‐17.36 [‐29.39, ‐5.34] |
| 2 Recovery time (minutes) in studies, which reported recovery time in formats which could not be meta‐analyzyed Show forest plot | | | Other data | No numeric data |
|
| 3 Discharge time Show forest plot | 7 | 542 | Mean Difference (IV, Random, 95% CI) | ‐20.86 [‐30.94, ‐10.78] |
|
| 3.1 Propofol alone | 4 | 297 | Mean Difference (IV, Random, 95% CI) | ‐19.06 [‐28.08, ‐10.04] |
| 3.2 Propofol combined with another agent | 3 | 245 | Mean Difference (IV, Random, 95% CI) | ‐32.17 [‐64.84, 0.50] |
| 4 Procedure duration Show forest plot | 9 | 736 | Mean Difference (IV, Random, 95% CI) | 0.84 [‐1.02, 2.71] |
|
| 4.1 Propofol alone | 2 | 168 | Mean Difference (IV, Random, 95% CI) | ‐1.98 [‐6.12, 2.17] |
| 4.2 Propofol combined with another agent | 7 | 568 | Mean Difference (IV, Random, 95% CI) | 1.85 [‐0.26, 3.97] |
| 5 Cecal intubation Show forest plot | 9 | 1840 | Odds Ratio (M‐H, Random, 95% CI) | 0.41 [0.22, 0.76] |
|
| 5.1 Propofol alone | 3 | 268 | Odds Ratio (M‐H, Random, 95% CI) | 0.0 [0.0, 0.0] |
| 5.2 Propofol combined with another agent | 6 | 1572 | Odds Ratio (M‐H, Random, 95% CI) | 0.41 [0.22, 0.76] |
| 6 Patient Dissatisfication (dichotomous data) Show forest plot | 6 | 449 | Odds Ratio (M‐H, Random, 95% CI) | 0.22 [0.11, 0.44] |
|
| 6.1 Propofol alone | 2 | 117 | Odds Ratio (M‐H, Random, 95% CI) | 0.25 [0.09, 0.72] |
| 6.2 Propofol combined with another agent | 4 | 332 | Odds Ratio (M‐H, Random, 95% CI) | 0.19 [0.07, 0.50] |
| 7 Patient Satisfication (continuous data) Show forest plot | 4 | 370 | Std. Mean Difference (IV, Random, 95% CI) | 0.43 [‐0.00, 0.85] |
|
| 7.1 Propofol alone | 3 | 220 | Std. Mean Difference (IV, Random, 95% CI) | 0.50 [‐0.17, 1.17] |
| 7.2 Propofol combined with another agent | 1 | 150 | Std. Mean Difference (IV, Random, 95% CI) | 0.32 [‐0.02, 0.66] |
| 8 Patient Dissatisfication (combined) Show forest plot | 7 | | Odds Ratio (Random, 95% CI) | 0.35 [0.23, 0.53] |
|
| 8.1 Propofol Alone | 4 | | Odds Ratio (Random, 95% CI) | 0.33 [0.18, 0.60] |
| 8.2 Propofol combined with another agent | 3 | | Odds Ratio (Random, 95% CI) | 0.33 [0.14, 0.80] |
| 9 Pain Control (continuous outcome) Show forest plot | 6 | 633 | Std. Mean Difference (IV, Random, 95% CI) | 0.38 [0.03, 0.74] |
|
| 9.1 Propofol alone | 2 | 187 | Std. Mean Difference (IV, Random, 95% CI) | ‐0.14 [‐0.53, 0.26] |
| 9.2 Propofol combined with another agent | 4 | 446 | Std. Mean Difference (IV, Random, 95% CI) | 0.51 [0.17, 0.84] |
| 10 Pain Control (dichotomous outcome) Show forest plot | 5 | 344 | Odds Ratio (M‐H, Random, 95% CI) | 1.12 [0.21, 5.97] |
|
| 10.1 Propofol alone | 3 | 220 | Odds Ratio (M‐H, Random, 95% CI) | 0.20 [0.02, 1.79] |
| 10.2 Propofol combined with another agent | 2 | 124 | Odds Ratio (M‐H, Random, 95% CI) | 2.64 [0.39, 18.04] |
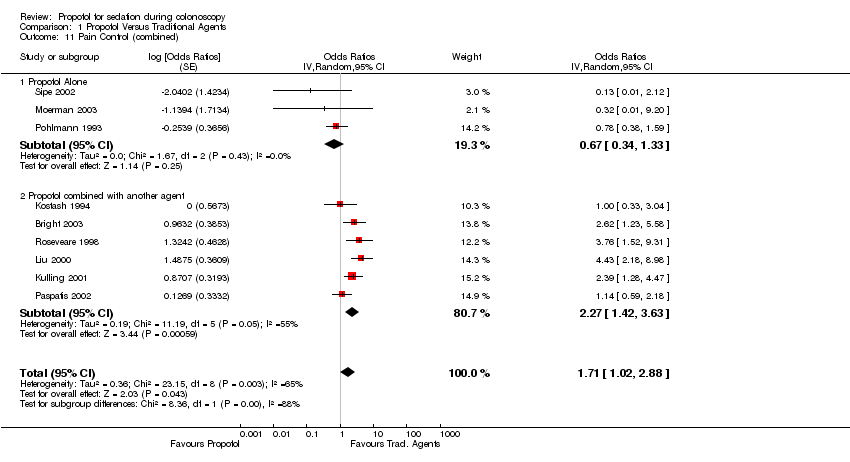
| 11 Pain Control (combined) Show forest plot | 9 | | Odds Ratios (Random, 95% CI) | 1.71 [1.02, 2.88] |
|
| 11.1 Propofol Alone | 3 | | Odds Ratios (Random, 95% CI) | 0.67 [0.34, 1.33] |
| 11.2 Propofol combined with another agent | 6 | | Odds Ratios (Random, 95% CI) | 2.27 [1.42, 3.63] |
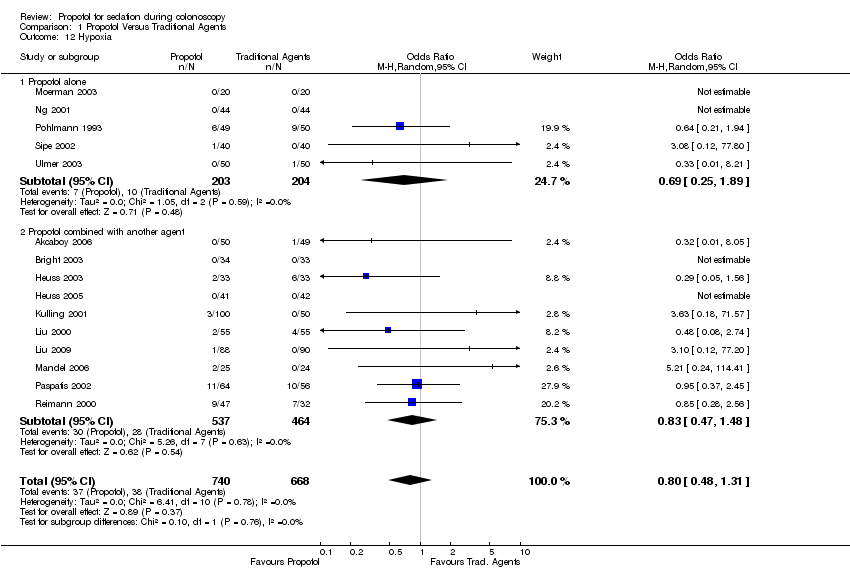
| 12 Hypoxia Show forest plot | 15 | 1408 | Odds Ratio (M‐H, Random, 95% CI) | 0.80 [0.48, 1.31] |
|
| 12.1 Propofol alone | 5 | 407 | Odds Ratio (M‐H, Random, 95% CI) | 0.69 [0.25, 1.89] |
| 12.2 Propofol combined with another agent | 10 | 1001 | Odds Ratio (M‐H, Random, 95% CI) | 0.83 [0.47, 1.48] |
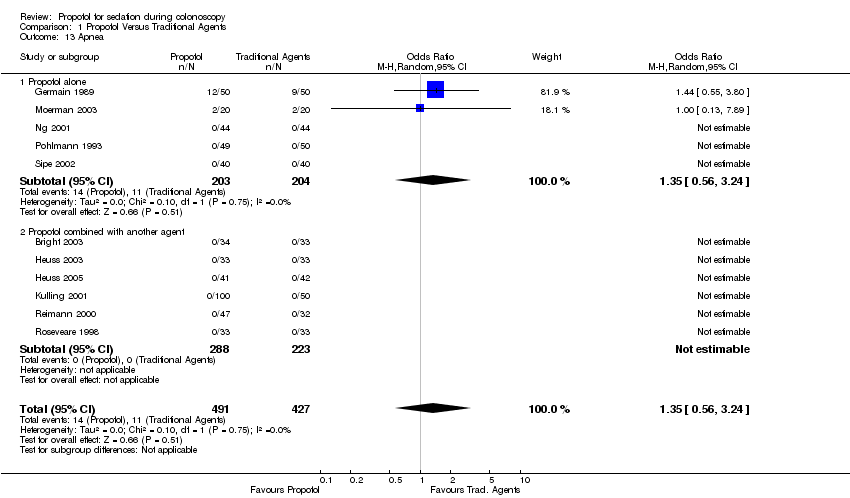
| 13 Apnea Show forest plot | 11 | 918 | Odds Ratio (M‐H, Random, 95% CI) | 1.35 [0.56, 3.24] |
|
| 13.1 Propofol alone | 5 | 407 | Odds Ratio (M‐H, Random, 95% CI) | 1.35 [0.56, 3.24] |
| 13.2 Propofol combined with another agent | 6 | 511 | Odds Ratio (M‐H, Random, 95% CI) | 0.0 [0.0, 0.0] |
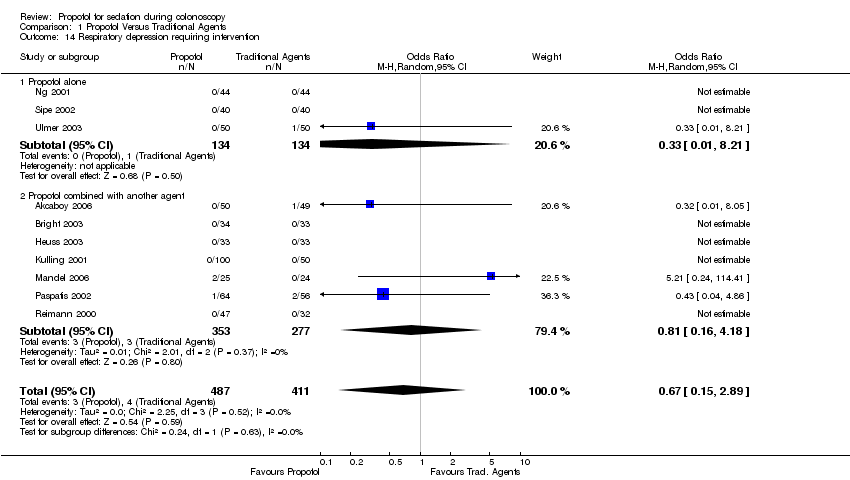
| 14 Respiratory depression requiring intervention Show forest plot | 10 | 898 | Odds Ratio (M‐H, Random, 95% CI) | 0.67 [0.15, 2.89] |
|
| 14.1 Propofol alone | 3 | 268 | Odds Ratio (M‐H, Random, 95% CI) | 0.33 [0.01, 8.21] |
| 14.2 Propofol combined with another agent | 7 | 630 | Odds Ratio (M‐H, Random, 95% CI) | 0.81 [0.16, 4.18] |
| 15 Arrhythmias Show forest plot | 7 | 684 | Odds Ratio (M‐H, Random, 95% CI) | 0.70 [0.31, 1.55] |
|
| 15.1 Propofol alone | 3 | 220 | Odds Ratio (M‐H, Random, 95% CI) | 0.55 [0.09, 3.46] |
| 15.2 Propofol combined with another agent | 4 | 464 | Odds Ratio (M‐H, Random, 95% CI) | 0.74 [0.30, 1.80] |
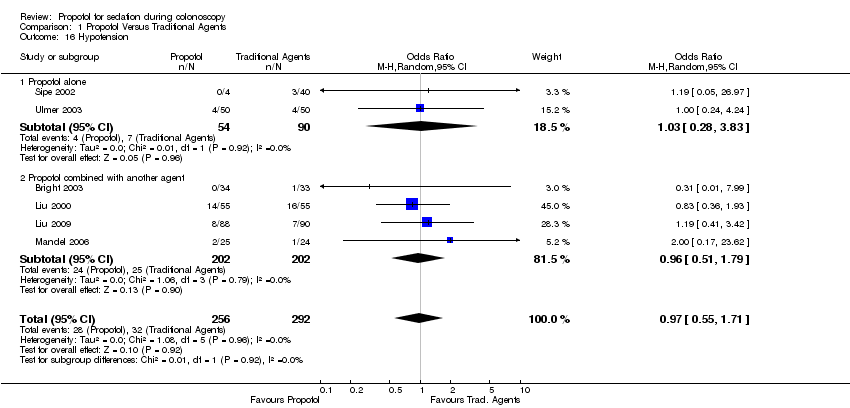
| 16 Hypotension Show forest plot | 6 | 548 | Odds Ratio (M‐H, Random, 95% CI) | 0.97 [0.55, 1.71] |
|
| 16.1 Propofol alone | 2 | 144 | Odds Ratio (M‐H, Random, 95% CI) | 1.03 [0.28, 3.83] |
| 16.2 Propofol combined with another agent | 4 | 404 | Odds Ratio (M‐H, Random, 95% CI) | 0.96 [0.51, 1.79] |
| 17 Blood pressure drop or lowest blood pressure during the procedure Show forest plot | 5 | 494 | Mean Difference (IV, Random, 95% CI) | 2.19 [‐2.55, 6.94] |
|
| 17.1 Propofol alone | 2 | 199 | Mean Difference (IV, Random, 95% CI) | 0.45 [‐9.40, 10.30] |
| 17.2 Propofol combined with another agent | 3 | 295 | Mean Difference (IV, Random, 95% CI) | 3.63 [‐4.47, 11.72] |
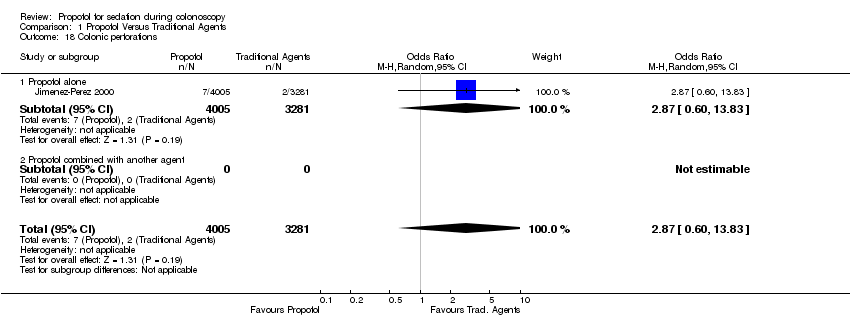
| 18 Colonic perforations Show forest plot | 1 | 7286 | Odds Ratio (M‐H, Random, 95% CI) | 2.87 [0.60, 13.83] |
|
| 18.1 Propofol alone | 1 | 7286 | Odds Ratio (M‐H, Random, 95% CI) | 2.87 [0.60, 13.83] |
| 18.2 Propofol combined with another agent | 0 | 0 | Odds Ratio (M‐H, Random, 95% CI) | 0.0 [0.0, 0.0] |
| 19 Sedation (failure to sedate) Show forest plot | 2 | 277 | Odds Ratio (M‐H, Random, 95% CI) | 0.03 [0.00, 1.43] |
|
| 19.1 Propofol alone | 1 | 99 | Odds Ratio (M‐H, Random, 95% CI) | 0.20 [0.07, 0.60] |
| 19.2 Propofol combined with another agent | 1 | 178 | Odds Ratio (M‐H, Random, 95% CI) | 0.00 [0.00, 0.01] |
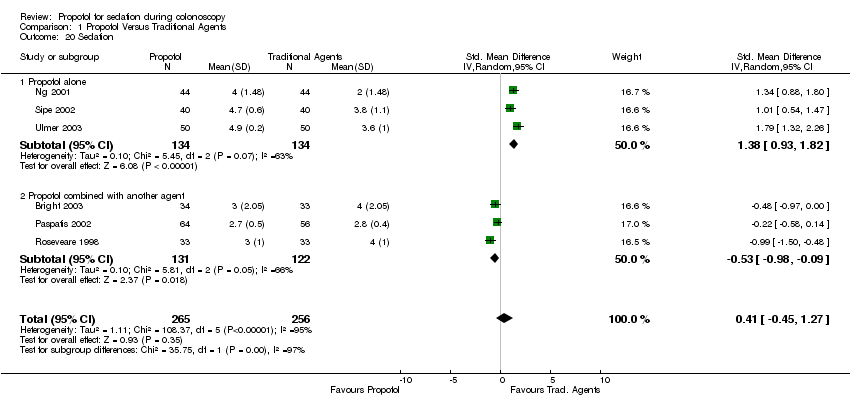
| 20 Sedation Show forest plot | 6 | 521 | Std. Mean Difference (IV, Random, 95% CI) | 0.41 [‐0.45, 1.27] |
|
| 20.1 Propofol alone | 3 | 268 | Std. Mean Difference (IV, Random, 95% CI) | 1.38 [0.93, 1.82] |
| 20.2 Propofol combined with another agent | 3 | 253 | Std. Mean Difference (IV, Random, 95% CI) | ‐0.53 [‐0.98, ‐0.09] |