| Comparison | Studies in comparison | Risk of Bias | Inconsistency | Indirectness | Imprecision | Publication bias | Quality of the evidence |
| Work‐directed | | | | | | | |
| Work‐directed + clinical intervention versus clinical (medium) | Hees 2013; Lerner 2012; Schene 2006 | No: Majority low risk of bias | No: I² < 50% | No | Yes: N < ‐400 Downgrade: ‐1 | Undetected | Moderate |
| Work‐directed + clinical intervention versus clinical (long) | Hees 2013; Schene 2006 | No: Majority low risk of bias | No: I² < 50% | No | Yes: N < ‐400 Downgrade: ‐1 | Undetected | Moderate |
| Work‐directed + clinical versus work‐directed | Vlasveld 2013 | No: study with low risk of bias | N.a. | No | Yes: Single study Downgrade: ‐1 | Undetected | Moderate |
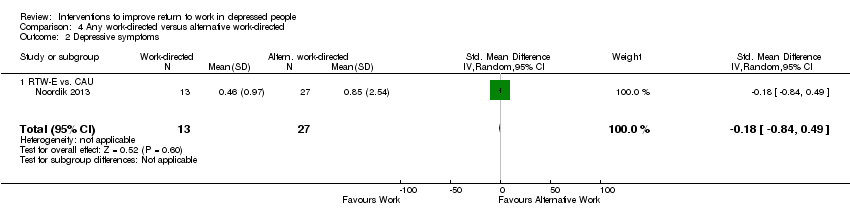
| Work‐directed versus work‐directed | Noordik 2013 | Yes: very serious Downgrade ‐2 | N.a. | No | Yes: wide CI Downgrade: ‐1 | Undetected | Very low |
| Clinical, medication | | | | | | | |
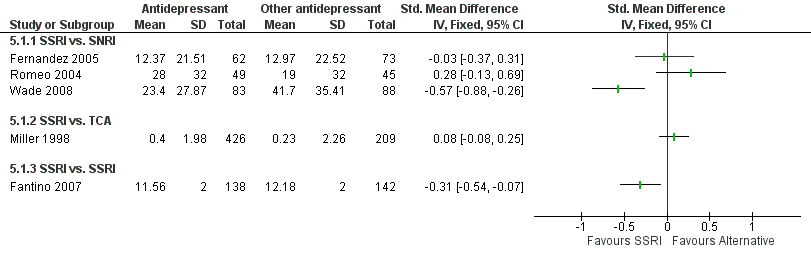
| Medication: SSRI versus SNRI | Fernandez 2005; Romeo 2004; Wade 2008 | Fernandez: low Romeo: high Wade: high | Yes: 83%, pooling not feasible | No | Yes: Single studies Downgrade: ‐1 | Undetected | Fernandez: moderate Romeo: Low Wade: Low |
| SSRI versus TCA | Miller 1998 | Yes: very serious Downgrade ‐2 | N.a. | No | No | Undetected | Low |
| SSRI versus SSRI | Fantino 2007 | No: study with low risk of bias | N.a. | No | Yes: N< ‐400 Downgrade: ‐1 | Undetected | Moderate |
| TCA or MAO versus placebo | Agosti 1991 | Yes: very serious Downgrade ‐2 | N.a. | No | Yes: N < ‐400 Downgrade: ‐1 | Undetected | Very low |
| Clinical, psychological | | | | | | | |
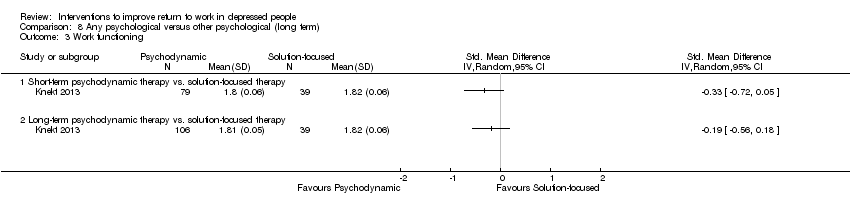
| Any psych versus other psych (medium) | Knekt 2013 (three arms) | Yes: serious Downgrade ‐1 | Yes: 99% pooling not feasible | No | Yes: single study arms Downgrade ‐1 | Undetected | Knekt I: Low Knekt II: Low |
| Any psych versus other psych (medium) | Knekt 2013 (three arms) | Yes: serious Downgrade ‐1 | Yes: 99% pooling not feasible | No | Yes: single study arms Downgrade ‐1 | Undetected | Knekt I: Low Knekt II: Low |
| Any psych versus CAU | Bee 2010; Hollinghurst 2010; McCrone 2004 | No: Majority low risk of bias | No: I² < 50% | No | Yes: N < ‐400 Downgrade: ‐1 | Undetected | Moderate |
| CMHN versus CAU | Kendrick 2005 (three arms) | Yes: serious Downgrade ‐1 | No: I² < 50% | No | Yes: wide CI Downgrade: ‐1 | Undetected | Low |
| Clinical, psychological and medication | | | | | | | |
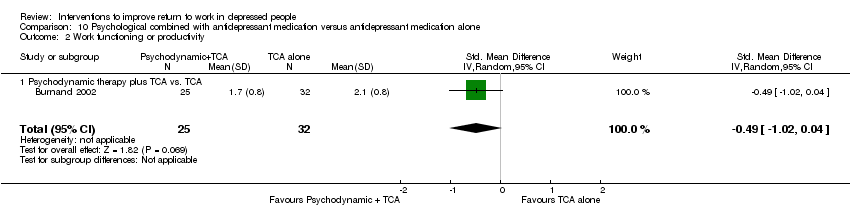
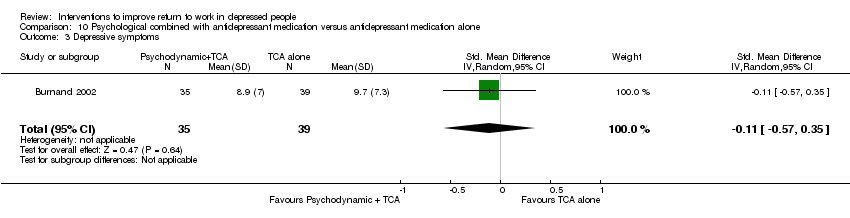
| Psych + med versus medicine | Burnand 2002 | Yes: very serious Downgrade ‐2 | N.a. | No | Yes: N < ‐400 Downgrade: ‐1 | Undetected | Very low |
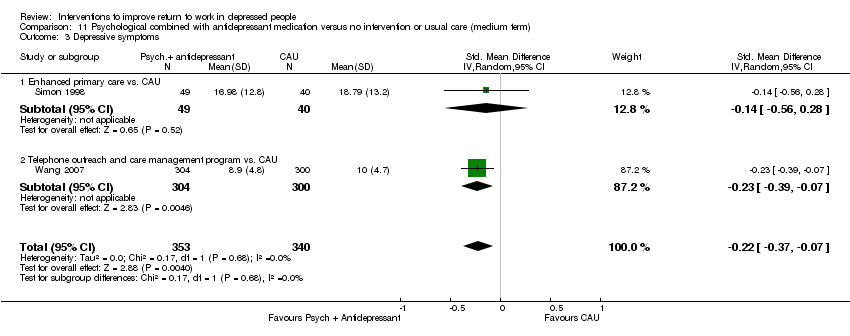
| Enhanced primary care versus CAU | Rost 2004; Schoenbaum 2001; Simon 1998 | Yes: very serious Downgrade ‐2 | No: I² < 50% | No | No | Undetected | Low |
| Telephone outreach versus CAU | Wang 2007 | No: study with low risk of bias | N.a. | No | No (n > 400 * CI not wide) | Undetected | High |
| Clinical, exercise | | | | | | | |
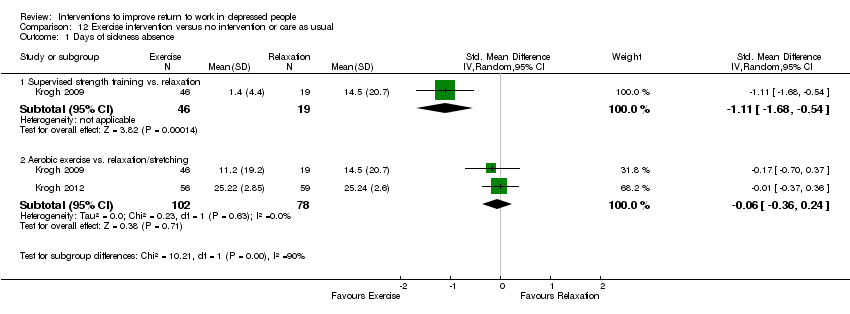
| Strength versus relax | Krogh 2009 | Yes: serious Downgrade ‐1 | N.a. | No | Yes: N < ‐400 Downgrade: ‐1 | Undetected | Low |
| Aerobic versus relax or stretching | Krogh 2009; Krogh 2012 | No: Majority low risk of bias | No: I² < 50% | No | Yes: N < ‐400 Downgrade: ‐1 | Undetected | Moderate |