Intervenciones para mejorar el retorno al trabajo en pacientes con depresión
Referencias
References to studies included in this review
References to studies excluded from this review
References to ongoing studies
Additional references
References to other published versions of this review
Characteristics of studies
Characteristics of included studies [ordered by study ID]
| Methods | Double‐blind randomised trial with four arms (3 treatment and one placebo). Recruitment: unclear. Follow up: 6 weeks. Lost to follow up: 29.5% | |
| Participants | 61 were randomised (T1: 38, C: 23). Setting: Outpatients in New York, USA Inclusion: ‐ DSM‐III diagnosis of depressive disorder Female: 52% Single: 57% Married: 23% Divorced or separated: 19.6% Working: 70% | |
| Interventions | T1: Treatment with increasing dose of either TCA or MAO | |
| Outcomes | Absenteeism: 1) hours worked in past week (baseline and at 6 weeks) 1) CGI (measured but not reported!) | |
| Notes | ||
| Risk of bias | ||
| Bias | Authors' judgement | Support for judgement |
| Random sequence generation (selection bias) | Unclear risk | Random sequence generation not reported "Following baseline evaluation, patients were treated with single‐blind placebo for 1‐2 weeks, those who were still depressed were randomly assigned to 6 weeks of treatment with increasing doses of one of four agents in a double blind design." |
| Allocation concealment (selection bias) | Unclear risk | Allocation concealment not reported "Following baseline evaluation, patients were treated with single‐blind placebo for 1‐2 weeks, those who were still depressed were randomly assigned to 6 weeks of treatment with increasing doses of one of four agents in a double blind design." |
| Blinding of participants and personnel (performance bias) | Low risk | A double blind design was used "Following baseline evaluation, patients were treated with single‐blind placebo for 1‐2 weeks, those who were still depressed were randomly assigned to 6 weeks of treatment with increasing doses of one of four agents in a double blind design." |
| Blinding of outcome assessment (detection bias) | Low risk | Patients reported sick leave in an interview, but were blinded to treatment allocation "Sick leave was assessed by the LIFE. The LIFE is a semi‐structured interview which tracks episodes of psychiatric illness. The portion of the LIFE which we used assessed the psychosocial functioning during the week in five areas; employment..etc. The LIFE was administered to the patient by the treating physician." |
| Blinding of outcome assessment (detection bias) | Low risk | Depressive symptoms were determined by personnel, were blinded to treatment allocation "Clinical outcome was determined by the treating psychiatrist on the basis of Clinical Global Improvement." |
| Incomplete outcome data (attrition bias) | Unclear risk | Outcome not reported |
| Incomplete outcome data (attrition bias) | High risk | Loss to follow up is considered to be high: T1: 28.9%; T2: 30.4%, even though the proportion of incomplete data was comparable in both groups |
| Selective reporting (reporting bias) | Unclear risk | No design paper or trial registration could be identified to assess this risk |
| Other bias | Unclear risk | None Identified |
| Methods | RCT. Recruitment: over 10 months, human resources mailed all potential participants a study information pack. Follow up: 3 months. Lost to follow up: overall 40%, subgroup depressed workers: 0% | |
| Participants | 53 were randomised (T1: 26; T2: 27). Subgroup of depressed workers: 12. Setting: large communications company. Inclusion: employees of a large communications company absent from work with mild to moderate mental health difficulties for 8 to 90 days authorised by general practitioner certificate Exclusion: severe or complex disorders (psychosis, comorbid personality disorder), degenerative cognitive disorders, substance misuse or active self‐harm For the subgroup of depressed workers: mean age: 50.9 (SD 10.04) male: 58% | |
| Interventions | T1: Telephone CBT, delivered over 12 weeks by one of two registered graduate mental health workers. Participants worked with therapists through regular phone calls to identify and challenge negative thoughts, develop self‐care skills and complete workbook exercises emphasizing behavioural activation. Therapists received 12 h of didactic instruction and role play and weekly supervision from a senior CBT therapist. T2: Usual care, primary and occupational health services. | |
| Outcomes | Absenteeism: 1) self‐reported actual working hours (HPQ) in last four weeks Clinical: 1) depression, assessed by the HADS | |
| Notes | ||
| Risk of bias | ||
| Bias | Authors' judgement | Support for judgement |
| Random sequence generation (selection bias) | Low risk | Personal communication: "Yes there was a random component in the sequence generation – and the sequence was held by an independent trial units." |
| Allocation concealment (selection bias) | Low risk | "Randomization was conducted centrally by an independent service, with minimization on age, gender and illness severity". "[...] internal validity was heightened trough allocation concealment via central randomization [ .. ]" |
| Blinding of participants and personnel (performance bias) | High risk | Due to the nature of the intervention, the participants could not be blinded |
| Blinding of outcome assessment (detection bias) | High risk | The actual working hours were assessed by the participants themselves. As they were aware of the allocation status, risk of detection bias is considered to be high |
| Blinding of outcome assessment (detection bias) | High risk | Depression is assessed by the HADS, which is a self‐reported instrument. As the participants were aware of their allocation status, risk of detection bias is considered to be high |
| Incomplete outcome data (attrition bias) | Low risk | Personal communication: "For the subgroup of depressed workers, there is no loss to follow up." |
| Incomplete outcome data (attrition bias) | Low risk | Personal communication: "For the subgroup of depressed workers, there is no loss to follow up." |
| Selective reporting (reporting bias) | Unclear risk | No design paper or trial registration could be identified to assess this risk |
| Other bias | Unclear risk | None identified |
| Methods | RCT, random assignment stratified by presence of personality disorder, past major depressive syndrome and gender; two conditions. Recruitment: screening by nurse and psychiatrist of consecutive patients referred for acute outpatient treatment. Follow up: 10 weeks. Lost to follow up: 22% | |
| Participants | 95 were randomised (T1: 35; C: 39); Setting: outpatient community mental health centre in Switzerland; Inclusion: age 20 to 65 years, new episode of care, MDD DSM‐IV (SCID) + HDRS at least 20; Exclusion: bipolar disorder, psychotic symptoms, severe substance dependence, organic disorder, mental retardation, history of severe intolerance to clomipramine, poor command of French language Female: T1: 66%; C: 56% Stable employment: T1: 71%; C: 82% | |
| Interventions | T1: Psychodynamic psychotherapy: individual sessions by nurse + clomipramine: 25 mg first day, gradually increasing to 125 mg on fifth day (dosage adjustment allowed). Refusal or severe side effects: 20 to 40 mg citalopram per day. Duration: 10‐week program, frequency psychotherapy sessions not fixed, duration of clomipramine 10 weeks | |
| Outcomes | Absenteeism: 1) number of days of sick leave in 10 weeks | |
| Notes | ||
| Risk of bias | ||
| Bias | Authors' judgement | Support for judgement |
| Random sequence generation (selection bias) | Unclear risk | Randomisation procedure not reported |
| Allocation concealment (selection bias) | Unclear risk | Randomisation procedure not reported |
| Blinding of participants and personnel (performance bias) | Low risk | No blinding but risk of performance bias low as both treatments can be considered equally desirable for patients "Both treatments involved the same clomipramine protocol and intensive nursing in a specialized milieu. In addition, the amount of structured psychodynamic psychotherapy provided during combined treatment was comparable to the amount of supportive care provided during treatment with clomipramine alone." |
| Blinding of outcome assessment (detection bias) | High risk | Outcome assessor for sick leave was blinded, but (non‐blinded) patients had to report the number of sick leave days to them "The psychologists who made the assessments of hospitalizations, number of days of sick leave, and GAS scores were blinded to each patient's treatment assignment." |
| Blinding of outcome assessment (detection bias) | High risk | "The individuals who rated the presence and severity of major depression and HSRS scores at ten weeks were not blinded to treatment assignment." |
| Incomplete outcome data (attrition bias) | High risk | Loss to follow up is high: 22%. Risk of attrition bias due to follow up losses is therefore considered to be high, although multiple analyses were used to study the effect on the findings and the authors conclude otherwise: "Twenty‐one patients (12 in the experimental and nine in the control group, or 22 percent) were excluded from the analysis‐‐four who did not return for treatment (three in the experimental group and one in the control group), three who dropped out against medical advice (two in the experimental group and one in the control group), and 14 who were discharged because they had exclusion characteristics that were not detected at entry, including severe alcohol or drug dependence (five in each group) and adverse effects (two in each group). These patients were not significantly different from the other patients in terms of the main outcome variables at intake. The 74 patients who completed the study were not significantly different from the 21 who were withdrawn or from the group of 95 as a whole. To control for intent to treat, the analyses were repeated with all 95 patients who had been randomly assigned to treatment." "This finding was unchanged when we repeated the analyses and controlled for age, gender, initial severity of depression, GAS score at intake, compliance and intent to treat" |
| Incomplete outcome data (attrition bias) | High risk | Loss to follow up is high: 22%. Risk of attrition bias due to follow up losses is therefore considered to be high, although multiple analyses were used to study the effect on the findings and the authors conclude otherwise: "Twenty‐one patients (12 in the experimental and nine in the control group, or 22 percent) were excluded from the analysis‐‐four who did not return for treatment (three in the experimental group and one in the control group), three who dropped out against medical advice (two in the experimental group and one in the control group), and 14 who were discharged because they had exclusion characteristics that were not detected at entry, including severe alcohol or drug dependence (five in each group) and adverse effects (two in each group). These patients were not significantly different from the other patients in terms of the main outcome variables at intake. The 74 patients who completed the study were not significantly different from the 21 who were withdrawn or from the group of 95 as a whole. To control for intent to treat, the analyses were repeated with all 95 patients who had been randomly assigned to treatment." "This finding was unchanged when we repeated the analyses and controlled for age, gender, initial severity of depression, GAS score at intake, compliance and intent to treat" |
| Selective reporting (reporting bias) | Unclear risk | No design paper or trial registration could be identified to assess this risk |
| Other bias | Unclear risk | None Identified |
| Methods | RCT. Recruitment: patients were recruited by psychiatrists or by general practitioners. Follow up: 8 weeks. Lost to follow up: 8.1% | |
| Participants | 280 were randomised (T1: 138; T2: 142). Setting: outpatient; general or psychiatric practices in France. Inclusion: all patients fulfilling the DSM‐IV criteria for MDD and having a baseline MADRS total score of at least 30 were eligible for the study. Exclusion: patients meeting DSM‐IV for primary diagnoses for any axis I disorder other than MDD or those with a history of mania, bipolar disorder, schizophrenia or other psychotic disorder, obsessive‐compulsive disorder, cognitive disorder including mental retardation or personality disorder, patients who met the DMS‐IV criteria for substance abuse or dependence within the past 12 months, or used a depot antipsychotic within 6 months before study inclusion or any antipsychotic or anticonvulsant medications within 2 weeks before the first administration of study medication Male: T1: 28.3%; T2: 38.0% Age: T1: 44.1 (SD 10.9); T2: 46.2 (SD 11.1) Family situation: T1: 23.9% single; T2: 16.2% single T1: 49.3% married, living with partner; T2: 50.7% married living with partner T1: 26.8% separated, divorced, widowed; T2: 33.1% separated, divorced, widowed Occupational status: T1: 35.5% unemployed; T2: 29.6% unemployed T1: 64.5% employed; T2: 70.4% T1: 4.5% craftsman, tradesman; T2: 7.0% craftsman, tradesman T1: 9.0% manager; T2: 12.0% manager T1: 21.3% technician; T2: 30.0% technician T1: 9.0% workman; T2: 4.0% workman | |
| Interventions | T1: Escitalopram (SSRI) 10 mg daily during the first week, 20 mg per day for the remaining 7 weeks T2: Citalopram (SSRI) 20 mg/day daily during the first week, 40 mg per day for the remaining 7 weeks All study medications were provided in identical blister packs of identical capsules administered as one capsule per day, regardless of dose or | |
| Outcomes | Absenteeism: 1) says of sick leave for the 2‐month pre‐study period and for the 8‐week study period (percentage of patients and mean consumption of those patients) Clinical: 1) sepression severity, assessed by the Montgomery‐Asberg Depression Scale (MADRS) 2) remission, defined as the total score MADRS of ≤ 12 3) MADRS‐S, the self‐reported version of MADRS | |
| Notes | ||
| Risk of bias | ||
| Bias | Authors' judgement | Support for judgement |
| Random sequence generation (selection bias) | Low risk | Personal communication: "Allocation was random. This includes random allocation using equal block sizes." |
| Allocation concealment (selection bias) | Low risk | Personal communication: "Allocation was concealed. Investigators allotted patients to a treatment defined by the patient inclusion number. All treatments were prepared and identical, the only difference being the treatment number, corresponding to the allocation table, which was kept by the person who prepared the treatments. The investigators were not aware of the nature of the treatments." |
| Blinding of participants and personnel (performance bias) | Low risk | Trial is double‐blind: "Those meeting the eligibility criteria were randomly assigned to receive double‐blind, fixed doses of either escitalopram 20 mg daily or citalopram 40 mg daily during 8 weeks, with equal block randomization at baseline." "All study medications were provided in identical blister packs of identical capsules administered as one capsule per day, regardless of dose or treatment group." Personal communication: "The psychiatrist or GP both included the patient, dispensed the study medication, and did the assessments. Patient and investigator were both blind to the treatment, which were identical in aspect. Since this was not placebo‐controlled, both comparators were active and quite similar, differing only be the presence of 20 mg R‐citalopram in the 40 mg citalopram.This actually reduces the risk of unblinding by recognizable drug effects or side‐effects." |
| Blinding of outcome assessment (detection bias) | Low risk | "A standardized form was used by trained investigators to record healthcare services and days of sick leave for the 2‐month pre‐study period and for the 8‐week study period." Since the investigators were blinded, the risk of bias is considered to be low |
| Blinding of outcome assessment (detection bias) | Low risk | The MADSR was done by investigators who are trained or confirmed in the proper use of the MADSR scores and who were blinded for the allocation status. The MADSR‐S is a self‐reported version, but patients were also blinded for treatment allocation |
| Incomplete outcome data (attrition bias) | Low risk | Loss to follow up is considered to be low. T1: 4.3%; T2: 10.6% |
| Incomplete outcome data (attrition bias) | Low risk | No missing sick leave data: "Valid resource utilization information corresponding to the pre study and study periods was thus available for 280 patients." |
| Selective reporting (reporting bias) | Unclear risk | No design paper or trial registration could be identified to assess this risk |
| Other bias | Unclear risk | None identified |
| Methods | Randomised, double‐blind, flexible‐dose, multinational, clinical trial with a one‐week run‐in period with no treatment. After randomisation: two treatment arms Recruitment: patient were asked to participate by GP. Follow up: 8 weeks. Lost to follow up: 16% | |
| Participants | 293 were randomised (T1: 148; T2: 145). Setting: primary care at 44 sites in 8 European countries. Inclusion: patients in primary care Sex: T1: 75.4% female; T2: 71.2% female Married or cohabiting: T1: 61.9%; T2: 56% Employed: T1: 51.5%; T2: 60% Long‐term sickness absence: T1: 11.1%; T2: 11.2% Higher education: T1: 9.5%. T2: 11.2% | |
| Interventions | T1: Escitalopram (SSRI): initial 10 mg/day. At week 2 or 4 dose could be increased to 20 mg/day at the investigator's discretion if patient's response was unsatisfactory. After 8 weeks of treatment, 1 week run‐out period. Patients on 20 mg/day were down‐tapered to 10 mg for the first 4 days and placebo the last 3. Patients on lower dose received 7 days of placebo | |
| Outcomes | Absenteeism: 1) % of patients on sick leave and average length of sick leave per week (3 months prior baseline and during 8 weeks of study) 2) personal communication; days of sick leave during 8 weeks of study, for workers only 1) MADRS (at 8 weeks) 2) HAM‐D (at 8 weeks) | |
| Notes | ||
| Risk of bias | ||
| Bias | Authors' judgement | Support for judgement |
| Random sequence generation (selection bias) | Low risk | Personal communication with first author: "Patients who met the selection criteria at the baseline visit were assigned to 8 weeks of double‐blind treatment according to a computer‐generated randomisation list." |
| Allocation concealment (selection bias) | Low risk | Personal communication with first author: "The details of the randomisation series were unknown to any of the investigators and were contained in a set of sealed opaque envelopes." |
| Blinding of participants and personnel (performance bias) | Low risk | An economic evaluation was conducted alongside a double‐blind,multinational, randomised clinical trial. Personal communication with first author: "This means that both investigator and patient were blinded regarding allocation to treatment." |
| Blinding of outcome assessment (detection bias) | Low risk | "Data at baseline consisted of self‐reported patient questionnaires recording use of healthcare services and days of sick leave ...." Personal communication with first author: "Patients were blinded regarding allocation to treatment." |
| Blinding of outcome assessment (detection bias) | Low risk | "Depressive symptoms were assessed by trained raters." Personal communication with first author: "Outcome assessors were blinded for the allocation of patients." |
| Incomplete outcome data (attrition bias) | High risk | Loss to follow‐up depression data is 15%, which we consider high and no appropriate method has been used to account for attrition. "Efficacy analyses were conducted on the intention‐to‐treat (ITT) population, which included all randomised patients who took at least |
| Incomplete outcome data (attrition bias) | High risk | Lost to follow‐up sick leave data is 16%, which we consider high and no appropriate method has been used to account for attrition. "Data at baseline consisted of self‐reported patient questionnaires recording use of healthcare services and days of sick leave. Of the 293 patients in the trial, valid cost information in the 3‐month pre‐study period was available for 251 patients; for 22 patients in the escitalopram arm and 20 patients in the venlafaxine arm, either the physician or patient did not fill in the resource use questionnaire. Of the 251 evaluable patients, 126 received escitalopram and 125 received venlafaxine. Of these, 245 patients reported valid cost information for the 8‐week duration of the trial (four escitalopram and two venlafaxine patients were lost relative to the pre‐study period). "Given the very low rate of attrition in the sample during the trial, patients with missing data were unlikely to represent serious bias to the results of the present analysis. As a result, no attempt was made to impute missing data." |
| Selective reporting (reporting bias) | Unclear risk | No design paper or trial registration could be identified to assess this risk |
| Other bias | Unclear risk | None Identified |
| Methods | Two armed RCT. Recruitment: Between December 2007 and October 2009, participants were referred by occupational physicians from several occupational health services. Follow up: 18 months. Lost to follow up: 13.7% | |
| Participants | 117 were randomised (T1: 39; T2: 78); Setting: Outpatient; Department of Psychiatry, Academic Medical Center, Amsterdam; Inclusion: Age 18 to 65, DSM‐IV diagnosis of MDD, Absent from work at least 25% of their contract hours due to their depression. In addition, the duration of the depression had to be at least 3 months or the duration of their sickness absence had to be at least 8 weeks. Finally, there had to be a relation between the depressive disorder en the work situation, that is, work was one of the determinants of depressive disorder and contributed substantially (> 25%), or the depressive symptoms reduced productivity or hindered RTW. Exclusion: severe alcohol or drug dependence, bipolar disorder, psychotic disorder, depression with psychotic characteristics, indication of inpatient treatment Male: T1: 41%; T2: 53% Education (years): T1: 13.9 (SD 3.7); T2: 13.5 (SD 3.1) Martital status: T1: 59% married or living together; T2: 58% married or living together; T1: 23% single; T2: 28% single; T1: 18% divorced or widowed; T2: 14% divorced or widowed Contract (number of hours): T1: 32.7 (SD 5.8); T2: 35.0 (SD 5.0) Absenteeism (number of hours): T1: 27.1 (SD 8.8); T2: 27.6 (SD 10.0) Duration of absenteeism (months): T1: 3.8 (IQR 2.0 ‐ 6.5); T2: 5.0 (IQR 2.8 ‐ 5.0) Occupational sector: financial or insurance: T1: 54%; T2: 58%; Health care: T1: 18%; T2: 9%; Other: T1: 28%; T2: 33% Work experience (years): T1: 14.1 (SD 9.6); T2: 15.9 (SD 11.0) | |
| Interventions | T1: Treatment as usual: treatment by psychiatric residents in an outpatient university clinic according to a treatment protocol consistent with the APA guidelines. 19 visits consisted of clinical management, including psycho education, supportive therapy and cognitive behavioural interventions. Therapies were supervised on a weekly basis by an experienced senior psychiatrist specialised in depression. If needed, participants received pharmacotherapy according to a protocolised algorithm. If the participant's condition deteriorated and outpatient treatment was no longer deemed adequate, he or she was referred to day treatment or inpatient treatment | |
| Outcomes | Absenteeism: 1) work participation, defined in: a) average number of hours of absenteeism over each 6‐month period and b) duration of sick leave due to depression in calender days from the start of treatment until partial (or full) RTW. Time until partial or full RTW was operationalised as the duration of sick leave due to depression in calendar days from the start of treatment until partial (or full) RTW. Partial RTW was defined as working an increment of at least 5 hours (compared with hours worked at baseline), for at least 4 weeks without partial or full recurrence. Full RTW was defined as working the full number of contract hours in own or other work for at least 4 weeks, without partial or full recurrence Clinical: 1) severity of depression, assessed by the Hamilton Rating Scale for depression (HRSD) 2) depression remission, defined as having HRSD ≤ 7 3) severity of depression, assessed by the Questionnaire Inventory of Depressive Symptoms Self‐Report (StIDS‐SR) Functioning: 1) at work functioning: weekly self‐report records of work efficiency on a scale 1‐0 and 3 sub scales of WLQ: Output, time, mental‐interpersonal 2) health‐related functioning, 3 subscales of MOS‐SF 36: role limitations due to emotional problems, mental health, role limitations due to physical problems | |
| Notes | ||
| Risk of bias | ||
| Bias | Authors' judgement | Support for judgement |
| Random sequence generation (selection bias) | Low risk | "Randomization was conducted by an independent research assistant, using software based on a minimization randomization procedure." |
| Allocation concealment (selection bias) | Low risk | "Randomization was conducted by an independent research assistant, using software based on a minimization randomization procedure." |
| Blinding of participants and personnel (performance bias) | High risk | "Due to the nature of the intervention, neither patients nor therapists could be blinded to the patient's allocation status." Both treatments cannot be considered equally desirable for patients, so risk of performance bias high |
| Blinding of outcome assessment (detection bias) | High risk | Sickness absence data are measured by the use of self‐report. As patients are not blinded for the allocation status, risk of bias is high |
| Blinding of outcome assessment (detection bias) | Low risk | "Study assessment were conducted by a psychiatrist and a researcher who where blind to group allocation." As the HRSD is a clinician‐rated instrument, there is a low risk of bias for the HRSD outcome |
| Incomplete outcome data (attrition bias) | Low risk | Lost to follow up: T1: 15.4%; T2: 12.8% but appropriate imputation methods have been used. "To take potential biased outcomes caused by selective loss to follow up into account, we used multiple imputation (five imputed datasets), which, assuming missing at random for missing values, gives unbiased results with correct SEs." |
| Incomplete outcome data (attrition bias) | Low risk | Lost to follow up: T1: 15.4%; T2: 12.8% but appropriate imputation methods have been used. "To take potential biased outcomes caused by selective loss to follow up into account, we used multiple imputation (five imputed datasets), which, assuming missing at random for missing values, gives unbiased results with correct SEs." |
| Selective reporting (reporting bias) | Low risk | The study protocol is available and all of the study’s pre‐specified (primary and secondary) outcomes that are of interest in the review have been reported in the pre‐specified way |
| Other bias | Unclear risk | None identified |
| Methods | RCT. Recruitment: patients were recruited from 55 general practices in Bristol, London, and Warwickshire between October 2005 and February 2008. Follow up: 8 months. Lost to follow up: 53% for sickness absence and 29% for clinical outcomes | |
| Participants | 297 were randomised (T1: 149; T2: 148). Setting: patients between who where identified in primary care as having a new episode of depression Inclusion: patients between 18 and 75 who where identified in primary care as having a new episode of depression which was defined as being diagnosed within the 4 weeks preceding referral. Depression was defined as a score of 14 or more on the BDI12 and an ICD‐10 diagnosis of depression using the CIS‐R) Exclusion: patients treated for depression in the 3 months before the present episode, patients with a history of bipolar disorder, psychotic disorder, alcohol or substance misuse, and those already receiving psychotherapy Female: T1: 69%; T2: 67% Age: T1: 35.6 (SD 11.9); T2: 34.4 (SD 11.3) Marital status: T1: 34% married; T2: 39% married T1: 50% single; T2: 47% single T1: 16% separated or divorced or widowed; T2: 15% separated or divorced or widowed Employment status: T1: 65% employed; T2: 56% employed T1: 15% student; T2: 24% student T1: 20% not in employment; T2: 20% not in employment Highest educational level: T1: 65% A level or above; T2: 63% A level or above T1: 32% other; T2: 33% other T1: 3% no educational qualifications; T2: 4% no educational qualifications | |
| Interventions | T1: Online CBT in addition to usual care: participants receiving online CBT were offered up to ten sessions of 55 minutes, to be completed within 4 months from the date of randomisation when possible. Each participant was assigned their own therapist for the duration of the study. Participants and therapists typed free text into the computer, with messages sent instantaneously, using only this means of communication T2: Usual care from GP while on a 8‐month waiting list for online CBT: participants on the waiting list were not to receive psychotherapy during the study follow‐up period. Those on the waiting list who had still an eligible Beck Depression Inventory (BDI) score after 8 months were offered the intervention at that time | |
| Outcomes | Absenteeism: 1) the number of working days lost because of depression (time off work) over 8 months Clinical: 1) depression severity, assessed by the BDI 2) recovery, defined as a score of less than 10 on the BDI | |
| Notes | ||
| Risk of bias | ||
| Bias | Authors' judgement | Support for judgement |
| Random sequence generation (selection bias) | Low risk | "Randomization was by means of a computer‐generated code, implemented by an individual who was not involved in the recruitment process, and communicated to the participant within 48 h of the baseline interview." |
| Allocation concealment (selection bias) | Low risk | "Randomization was by means of a computer‐generated code, implemented by an individual who was not involved in the recruitment process, and communicated to the participant within 48 h of the baseline interview." "The allocation was concealed in advance from participants, researchers involved in recruitment, and therapists." |
| Blinding of participants and personnel (performance bias) | High risk | Risk of performance bias is considered high as patients were aware of their allocation status and both treatments are not equally desirable for patients: "Randomization was by means of a computer‐generated code, implemented by an individual who was not involved in the recruitment process, and communicated to the participant within 48 h of the baseline interview." |
| Blinding of outcome assessment (detection bias) | High risk | The number of working days lost because of depression was recorded in a diary by the participants themselves. As participants were aware of their intervention status, risk of bias high |
| Blinding of outcome assessment (detection bias) | High risk | The BDI is a self‐report inventory. As participants were aware of their intervention status, risk of bias high |
| Incomplete outcome data (attrition bias) | High risk | Loss to follow up is high: T1: 27%; T2: 32% even though appropriate method has been used to account for these missing data: "Fourth, a sensitivity analysis investigated the effect of missing data with multiple imputation by chained equation methods in Stata." "Analyses imputing missing values suggested that differences in attrition between the groups did not introduce any noticeable bias." |
| Incomplete outcome data (attrition bias) | High risk | Loss to follow up is high: T1: 50%; T2: 55% even though appropriate method has been used to account for this missing data: "we imputed missing observations of cost and QALYs using the multiple imputation by chained equation procedure in Stata release 10." "We acknowledge that more complete data would have been available if we had used questionnaires completed face to face or data from practice records. However, the results of the imputation suggest that any information lost is unlikely to have a major influence on the results or conclusions." |
| Selective reporting (reporting bias) | Unclear risk | No design paper or trial registration could be identified to assess this risk |
| Other bias | Unclear risk | None identified |
| Methods | RCT, randomisation on the level of patients stratified for referring GP; 3 conditions. Recruitment: general practices referred patients to the study. CMHNs were employed by local NHS trusts. Follow up: 26 weeks. Lost to follow up: 26% | |
| Participants | 247 randomised (T1: 90; T2: 79; T3: 78). Setting: community mental health, UK. Inclusion: age: 18‐65; new episode of anxiety, depression or reaction to life difficulties; minimum duration symptoms: 4 weeks; maximum duration symptoms: 6 months; GHQ‐12 score at least 3 | |
| Interventions | T1: CMHN problem‐solving treatment: | |
| Outcomes | Absenteeism: 1) SAS, however, subscale "work outside the home" not separately reported | |
| Notes | Personal communication: data for depressed subsample was provided | |
| Risk of bias | ||
| Bias | Authors' judgement | Support for judgement |
| Random sequence generation (selection bias) | Low risk | "The telephone randomisation service at the university of York was contracted." |
| Allocation concealment (selection bias) | Low risk | "Remote central randomisation was provided by telephone" "Randomisation sequences were in block sizes of either three or six, to prevent practitioners from guessing to which arm the next referral would be." |
| Blinding of participants and personnel (performance bias) | High risk | High risk for the comparison with the GP usual care group (T3) as this treatment cannot be considered equally desirable as T1 and T1 for patients and patients were not blinded. "Table 16: n = 50 received their preferred treatment; n = 114 did not receive their preferred treatment; n = 83 reported no preference" |
| Blinding of outcome assessment (detection bias) | High risk | Sick leave was measured by self‐report and patients were not blinded to treatment allocation "Number of days off paid work was captured by a resource‐use questionnaire filled out by patients." "Patients were reminded not to reveal their allocation at the follow‐up assessments." |
| Blinding of outcome assessment (detection bias) | High risk | Depression symptom score (CIS‐R and HADS‐D) were measured by self‐report and patients were not blinded. "The computerised version of the CIS‐R, which is self‐complete, was used in this study." "Patients were reminded not to reveal their allocation at the follow‐up assessments." |
| Incomplete outcome data (attrition bias) | High risk | Loss to follow up is considered to be high (26%). Risk of attrition bias due to follow‐up losses is therefore considered to be high, although sensitivity analyses were conducted and the authors conclude otherwise; "sensitivity analyses were conducted to see whether the result changed depending on what assumptions were made about the missing data". "Table 12 shows that the main findings are not particularly sensitive to the different assumptions about missing data that were investigated." It was harder to retain patients in the GP care (thus higher loss to follow up in that group): "Although the overall follow‐up rates were good, there was a lower follow‐up rate in the GP arm. It is difficult to tell whether this biased the findings in a particular direction. Follow‐up rates were better among those patients who received the treatment they preferred, so it is likely that there were more disaffected patients in the GP care arm. However, it is not known whether those who dropped out remained more symptomatic than those who were followed up. Failing to receive their treatment of preference was not associated with a worse outcome on the CIS‐R among those who were followed up. The sensitivity analyses suggest that CMHN care, whether generic care or specific PST, is unlikely to be more effective than GP care, unless one believes the LOCF analysis and makes the extreme assumption that all the dropouts remained as symptomatic as they were at the time of last assessment." |
| Incomplete outcome data (attrition bias) | High risk | Loss to follow up for sick leave data is considered to be high (26%). Risk of attrition bias due to follow‐up losses is therefore considered to be high, although sensitivity analyses were conducted and the authors conclude otherwise; "cost results from this analysis were validated by substituting where possible data from the GP case notes in place of imputed values for missing data, and repeating the analysis. Overall, the results did not change significantly." "36% had at least one resource item missing over the 6‐month follow up. Therefore, complete resource use data were available for 159 (64%) of the patients. The results presented here are based mainly on the 184 patients for whom complete CIS‐R data were available over the 6‐month period. To achieve this sample, 25 (14%) of the patients who had CIS‐R data but not resource‐use information had to be imputed. The results were then compared with those obtained using data from GP notes where available instead of imputation, and those obtained using only the 159 patients with complete resource‐use data. After imputing missing values for the 25 patients with missing resource‐use data, the numbers of patients included in the economic analysis in each group were as follows: 51 patients in GP care (28%), 62 patients in generic CMHN care (34%) and 71 patients in PS CMHN care (38%)." |
| Selective reporting (reporting bias) | Low risk | No indication for selective reporting could be identified. However, in the design study, the comparisons of T1 with T2 was not pre‐specified |
| Other bias | Unclear risk | None identified |
| Methods | RCT. Recruitment: a total of 459 eligible outpatients were referred to the Helsinki Psychotherapy Study from psychiatric services in the Helsinki region from June 1994 to June 2000. Follow up: 5 years. Lost to follow up: 19% (for all participants over five years), lost to follow up for the subgroup of people with depressive disorder: 51% (over five years) | |
| Participants | 326 were randomised (T: 97; T2: 101; T3: 128). Subgroup of people with depressive disorder: 161. Setting: outpatient. Inclusion: 20 to 45 years of age and suffered from a longstanding (> 1 year) disorder causing dysfunction in work ability. They were also required to meet DSM‐IV criteria for anxiety or mood disorders Exclusion: psychotic disorder or severe personality disorder, adjustment disorder, substance‐related disorder, organic brain disease or other diagnosed severe organic disease, and mental retardation. Individuals treated with psychotherapy within the previous 2 years and psychiatric health employees were also excluded Age: T1: 33.6 (SD 7.2); T2: 32.1 (SD 7.0); T3: 31.6 (SD 6.6) Male: T1: 25.8%; T2: 25.7%; T3: 21.1% Employed or student: T1: 83.2%; T2: 85.1%; T3: 75.4% Academic education: T: 28.9%; T2: 19.8%; T3: 75.4% | |
| Interventions | T1: Solution‐focused therapy: is a brief, focal, transference‐based therapeutic approach which helps patients by exploring and working through specific intrapsychic and interpersonal conflicts. The therapy included one session every second or third week, with a limit of 12 sessions, over no more than 8 months T2: Short‐term psychodynamic psychotherapy: is characterized by the exploration of a focus, which can be identified by both the therapist and the patient. This consists of material from current and past interpersonal and intrapsychic conflicts and the application of confrontation, clarification, and interpretation in a process in which the therapist is active in creating the alliance and ensuring the time‐limited focus. The therapy was scheduled for 20 weekly treatment sessions over 5 to 6 months T3: Long‐term psychodynamic psychotherapy: is an open‐ended, intensive, transference‐based therapeutic approach which helps patients by exploring and working through a broad area of intrapsychic and interpersonal conflicts. The therapy is characterized by a framework in which the central elements are exploration of unconscious conflicts, developmental deficits, and distortions of intrapsychic structures. Confrontation, clarification and interpretation are major elements, as well as the therapist's actions in ensuring alliance and working through the therapeutic relationship to attain conflict resolution and greater self‐awareness. Therapy includes both expressive and supportive elements, the use of which depends on patient needs. The frequency of sessions was 2 to 3 times a week, and the duration of the therapy was up to 3 years | |
| Outcomes | Absenteeism: 1) number of sick‐leave days during last 3 months Clinical: 1) depressive symptoms assessed by the Beck Depression Inventory (BDI) 2) depressive symptoms assessed by the Hamilton Depression Rating Scale (HDRS) Functioning: 1) the work‐subscale (SAS‐work) of the social adjustment scale (SAS‐SR) | |
| Notes | ||
| Risk of bias | ||
| Bias | Authors' judgement | Support for judgement |
| Random sequence generation (selection bias) | Low risk | "Concealed assignment codes were given sequentially to patients in consecutively numbered envelopes." |
| Allocation concealment (selection bias) | Low risk | "The patients who fulfilled the selection criteria at baseline were randomized into solution‐focused therapy, short‐term psychodynamic psychotherapy or long‐term psychodynamic psychotherapy or long‐term psychodynamic psychotherapy in a 1:1:1.3 ratio using a central computerized randomization schedule. Concealed assignment codes were given sequentially to patients in consecutively numbered envelopes." |
| Blinding of participants and personnel (performance bias) | High risk | Due to the nature of the intervention, the participants and personnel could not be blinded |
| Blinding of outcome assessment (detection bias) | High risk | Sick leave was measured by self‐report and the patients were not blinded for their allocation status. Outcome is likely to be influenced by this lack of blinding. "The number of sick leave days from work during the past 3 months were collected by single‐item questions included in a follow‐up questionnaire developed in the project." "Unavoidable weaknesses in a study like this are [...] the lack of blindness of assessments." |
| Blinding of outcome assessment (detection bias) | High risk | The BDI is a self‐report inventory and patient were not blinded for their allocation status. Outcome is likely to be influenced by this lack of blinding. The HDRS is a clinician‐administered scale but clinicians were also not blinded: "raters were not blinded since they were provided with information on the treatment group at the five interview sessions during the 3‐year follow up." |
| Incomplete outcome data (attrition bias) | Low risk | Loss to follow up is 19% and missing values were replaced by multiple imputation; this did not alter the results. "Analyses based on multiple imputation and taking into account the need for treatment at the time of dropout did not, however, notably alter the results, suggesting that the results presented are unbiased (data not shown)." |
| Incomplete outcome data (attrition bias) | High risk | Loss to follow up is considered to be high: 39% at one year and 52% at five years |
| Selective reporting (reporting bias) | Unclear risk | No design paper or trial registration could be identified to assess this risk |
| Other bias | Unclear risk | None identified |
| Methods | Randomized pragmatic trial. Recruitment: between January 2005 and July 2006. Follow‐up: 12 months. Lost to follow up: 17% at 4 months and 22% at 12 months | |
| Participants | 165 were randomised (T1:55; T2:55; T3:55); Setting: outpatient; this trial was carried out at a single location at Copenhagen University. Inclusion: age 18‐55 years, referred by a medical doctor or psychologist, meeting ICD‐10 criteria for unipolar depression, living in the Greater Copenhagen catchment area, able to read and understand informed consent. Exclusion: being engaged in regular sports activity for more than 1 hour per week, ongoing alcohol or substance abuse judged to be at risk of suicide, poor Danish language skills, having a medical condition that contraindicated physical exercise, or had been on sickness leave for than 24 consecutive months Female: T1: 81.8%; T2: 78.2%; T3: 61.8% Ethnicity: T1: 90.9% Caucasian; T2: 92.7% Caucasian; T3: 90.9% Caucasian Occupational status: T1: 41.8% unemployed; 40% fulltime work; 14.5% part‐time work; 3.6% < 20 hrs/wk T2: 54.5% unemployed; 32.7% fulltime work; 10.9% part‐time work; 1.8% < 20 hrs/wk T3: 36.4% unemployed; 41.8% fulltime work; 18.2% part‐time work; 3.6% > 20 hrs/wk | |
| Interventions | T1: Supervised strength training. Designed to increase muscular strength, initially with 12 repetitions of 50% of repetition maximum 2 or 3 times per exercise. As the patients progressed, the numbers of repetitions were reduced to 10 and 8, with an increase of RM to 75%. The training was a circuit‐training program with 6 exercise on machines involving large muscle groups. As a supplement to this, free weights and sandbags were used for exercising the calf muscles, the arm abductors, the triceps muscles, and the hip abductors. All patients were scheduled to meet twice per week during a 4‐month period for a total of 32 sessions T2: Aerobic training. Designed to increase fitness as measured by maximal oxygen uptake. The program involved 10 different aerobic exercises using large muscle groups. Machines were used for cycling, running, stepping, abdominal exercises, and rowing. Additional exercises were sliding movements on small carpets, trampoline, step bench, jump rope, and Ski Fitter. During the first 8 sessions, each exercise was done twice for 2 minutes with a 2‐minute rest at an intensity level of 70% of maximal heart rate. This gradually increased to a level at which exercise was done for 3 minutes with a 1‐minute rest at an intensity level of 89% during the last 8 sessions. All patients were scheduled to meet twice per week during a 4‐month period for a total of 32 sessions T3: Relaxation training. Designed to avoid muscular contractions or stimulation of the cardiovascular system, and the patients did not engage in activities perceived higher than 12 on the Borg Scale. The first 20 to 30 minutes were used for exercises on mattresses or Bobath Balls or back massage using a Ball Stick Ball. This was followed by light balance exercises for 10 to 20 minutes and by relaxation exercises with alternating muscle contraction and relaxation in different muscle groups while lying down for 20 to 30 minutes | |
| Outcomes | Absenteeism: 1) self‐reported percentage of days absent from work during the last 10 working days at 4 and 12 months Clinical: 1) severity of depression, assessed by the Hamilton Rating Scale for Depression (HAM‐D17) 2) remission, defined as not fulfilling the ICD‐10 criteria for depression and having a HAM‐D17 < 8 3) severity of depression, assessed by the Beck Depression Inventory (BDI) Employment status: 1) % on sick leave 2) % unemployed | |
| Notes | ||
| Risk of bias | ||
| Bias | Authors' judgement | Support for judgement |
| Random sequence generation (selection bias) | Low risk | "Randomization was carried out by the CTU using computerized restricted randomization with a block size of 6. The block size and thus the allocation sequence were unknown to the DEMO trial staff." "The strengths of our trial were the centralized randomization, which provided adequate generation of the allocation sequence and adequate allocation concealment" |
| Allocation concealment (selection bias) | Low risk | "Randomization was centralized and stratified according to medicine status." "The strengths of our trial were the centralized randomization, which provided adequate generation of the allocation sequence and adequate allocation concealment" |
| Blinding of participants and personnel (performance bias) | High risk | "The same 2 physiotherapists were used throughout the trial period. The type and number of exercise interventions were distributed evenly between the two, and thus the physiotherapists were not blinded to allocation". "And the patients were instructed not to reveal their group assignment." "The lack of blinding of treatment allocation for patients and psychotherapists could lead to collateral interventions, possibly confounding our results." As the relaxation condition was not equally desirable to patients as the other two groups, the risk of performance bias is considered high |
| Blinding of outcome assessment (detection bias) | High risk | Absenteeism measured by self‐report. As patients were aware of their allocation status, risk of bias high |
| Blinding of outcome assessment (detection bias) | Low risk | For HAM‐D17: "The assessor was blinded to intervention group, and the patients were instructed not to reveal their group assignment. After assessment the assessor was requested to guess which group the patient has been assigned to, making it possible to examine whether the blinding was successful [ .. ] This indicated that the blinding of the assessors was successful" |
| Incomplete outcome data (attrition bias) | High risk | Loss to follow up at endpoint was high: 22% (36/165) and skewed. Risk of attrition bias was therefore considered high although an appropriate method was used to deal with missing values in the analyses and the authors conclude otherwise "Analysis of age, sex, HAM‐D17, or absence from work during the last 10 working days at entry did not suggest any significant differences between missing participants and participants included in the analysis at either 4 months or 12 months." "It is then plausible to consider the missing data as 'missing at random', making the mixed effect model a plausible approach to estimate the effect, based on the total sample with missing cases included." "This approach uses data from all included patients (intention‐to‐treat), handles entry differences, and is able to handle missing data (restricted maximum likelihood procedure) with higher precision and power compared to more traditional methods such as the last observation carried forward." "There was skewed attrition, and the follow‐up assessment was significantly later than 4 months in the control group." |
| Incomplete outcome data (attrition bias) | High risk | Loss to follow up at endpoint was high: 22% (36/165) and skewed. Risk of attrition bias was therefore considered high although an appropriate method was used to deal with missing values in the analyses and the authors conclude otherwise. "Analysis of age, sex, HAM‐D17, or absence from work during the last 10 working days at entry did not suggest any significant differences between missing participants and participants included in the analysis at either 4 months or 12 months." "It is then plausible to consider the missing data as 'missing at random', making the mixed effect model a plausible approach to estimate the effect, based on the total sample with missing cases included." "This approach uses data from all included patients (intention‐to‐treat), handles entry differences, and is able to handle missing data (restricted maximum likelihood procedure) with higher precision and power compared to more traditional methods such as the last observation carried forward." "There was skewed attrition, and the follow‐up assessment was significantly later than 4 months in the control group." |
| Selective reporting (reporting bias) | High risk | In the study protocol, no report was made regarding the third treatment group (relaxation) |
| Other bias | Unclear risk | None identified |
| Methods | A single‐centre, two‐armed, parallel‐group, observer‐blinded randomised clinical superiority trial. Recruitment: between September 2008 and April 2011, participants were referred to trial site from various clinical settings. Follow up: 3 months. Lost to follow up: 13% | |
| Participants | 115 were randomised (T1: 56; T2: 59). Setting: outpatient; the participants were enrolled at the trial site in Copenhagen (Denmark) from various clinical settings. Inclusion: men and women between 18 and 60 years of age, referred from a clinical setting by a physician or a psychologist, a diagnose of major depression (DSM‐IV) based on the Danish version of the Mini International Neuropsychiatric Interview, score above 12 on the HAM‐D17 and living in the Greater Copenhagen catchments area, able to comprehend and sign the informed consent statement. Exclusion: current drugs abuse, any antidepressant medication within the last two months, current psychotherapeutic treatment, contraindications to physical exercise, more than 1 hour or recreational exercise per week, suicidal behaviour according to the 17‐item Hamilton depression rating scale (HAM‐D17 item 3 > 2), pregnancy, current/previous psychotic or manic symptoms, or lack of informed consent Age: T1: 39.7 (SD11.3); T2: 43.4 (SD 11.2) Female: T1: 71.4%; T2: 62.7% Occupational status: T1: 35.7% unemployed; T2: 45.7% T1: 35.7% sickness leave; T2: 30.5% sickness leave T1: 74.3% job attendance, last 10 days; T2: 73.8% job attendance, last 10 days | |
| Interventions | T1: Aerobic training group: designed to increase fitness as measured by maximal oxygen uptake. After initial 10 minutes of general low‐intensity warm‐up, the participants did 30 minutes of aerobic exercise on a stationary cycle ergometer followed by five minutes low‐intensity cool down period. During the initial four weeks, the aim was to work out at intensity levels corresponding to at least 65% to their maximal capacity, progressing to 70% and 80% during the second and third month, respectively. The participants carried a pulse monitor during exercise to guide and document intensity levels T2: Stretching exercise group: designed as an attention control group with the purpose of providing the same level of social interaction and contact with health care professionals as in the aerobic exercise group. This was done in order to assess the potential antidepressant effect of aerobic exercise in it self, and not the effect of aerobic exercise plus social interaction. This stretching exercise group performed low intensity exercise, which we did not expect to contain any antidepressant effect per se. The initial 10 minutes were low‐intensity warm‐up on a stationary bike, then a 20 minutes program of stretching, followed by 15 minutes of various low intensity exercises such as throwing and catching balls Both groups were scheduled to meet three times per week for three months for a total of 36 sessions | |
| Outcomes | Absenteeism: 1) the number of days spent on the job within the last ten working days, expressed as a percentage Clinical: 1) depression severity, assessed by the HAM‐D17 2) core depression items, assessed by HAM‐D6 3) remission, defined as not fulfilling the DSM‐IV criteria for major depression and a HAM‐D17 score below 8 4) self‐reported depression, assessed by the Beck Depression Inventory (BDI) Employment status: 1) employment status or sick leave at the time of the interview | |
| Notes | ||
| Risk of bias | ||
| Bias | Authors' judgement | Support for judgement |
| Random sequence generation (selection bias) | Low risk | "The randomization was centralized and carried out by the Copenhagen Trial Unit (CTU) using a computerized randomization sequence with alternating block sizes unknown to the investigators." |
| Allocation concealment (selection bias) | Low risk | "The randomization was centralized and carried out by the Copenhagen Trial Unit (CTU) using a computerized randomization sequence with alternating block sizes unknown to the investigators." |
| Blinding of participants and personnel (performance bias) | High risk | "Prior to the first training session of the participant, the trial psychotherapist would contact the CTU by phone for participant allocation." "Neither participants nor the physiotherapist conducting the intervention were blinded to the allocation." |
| Blinding of outcome assessment (detection bias) | Low risk | The outcome assessors were all blinded to participant allocation "Prior to the follow up interview, participants were instructed not to reveal their allocation to the outcome assessors. The statistical analysis and preparation of the first draft was carried out blinded to group assignment." |
| Blinding of outcome assessment (detection bias) | Low risk | The outcome assessors were all blinded to participant allocation. The HAM‐D17 is a structured interviewer based questionnaire, so risk of bias low (this does not apply to the BDI as this is a self‐report instrument) |
| Incomplete outcome data (attrition bias) | Low risk | Lost to follow up: T1: 16.1%; T2: 10.2% but appropriate method has been used to account for these missing data: "All continuous outcome measures were analyzed using a repeated measurement linear mixed effect model with an unstructured variance matrix [ .. ] The mixed effects function is able to handle missing continuous data using a likelihood estimation of missing data." |
| Incomplete outcome data (attrition bias) | Low risk | Lost to follow up: T1: 16.1%; T2: 10.2% but appropriate method has been used to account for these missing data: " "All continuous outcome measures were analyzed using a repeated measurement linear mixed effect model with an unstructured variance matrix [ .. ] The mixed effects function is able to handle missing continuous data using a likelihood estimation of missing data." |
| Selective reporting (reporting bias) | Unclear risk | No design paper or trial registration could be identified to assess this risk |
| Other bias | Unclear risk | None reported |
| Methods | RCT. Recruitment: 6 months. Follow up: 4 months. Lost to follow up: 8.9% | |
| Participants | 79 were randomised (T1:52; T2:27); Setting: workplace; this study involved State Government in Maine Inclusion: ages 18 to 62 years and employed 15 hours per week or more and fulfilled the criteria for current MDD and/or dysthymia, a WLQ productivity loss of at least 5% in the past 2 weeks (this score is consistent with an impaired ability to work approximately 20% of the time over 2 weeks). Exclusion: planning to retire within 2 years, receiving work disability benefits, active alcoholism or drugs‐abuse based on the five‐item CAGE, pregnant or 6 months postpartum, schizophrenia or bipolar disorder, non‐English speaking and/or reading, and/or diagnosed with one or more of 12 medical conditions that have symptoms that potentially interfere with working (e.g. angina, congestive hart failure, stroke, diabetes, chronic obstructive lung disease) Age: T1: 45.5 (SD 9.8); T2: 45.9 (SD 8.6) Male: T1: 23.1%; T2: 18.5% Ethinicity: T1: 100% white; 96.3% white Marital status: T1: 47.1% married; T2: 48.1% married | |
| Interventions | T1: Work and Health Initiative (WHI) intervention. Provided over the phone by EAP counsellors trained in its methods. The program lasts for 8 weeks with 1‐hour visits occurring every 2 weeks. This multi component work‐focused programs consists of: 1) work coaching and modification, 2) care coordination, 3) cognitive‐behavioral strategies. In the WHI, the counsellor and employee co‐create a care plan for dealing with each functional problem and review specific assignments and progress at each session. A motivational enhancement approach is utilized to promote and solidify change. In both groups: electronic feedback on depression and advise to seek care T2: Usual care. Primary care, specialty care, behavioral health programs, and/or standard EAP services. In both groups: electronic feedback on depression and advise to seek care | |
| Outcomes | Absenteeism: 1) the WLQ Work Absence Module measured self‐reported time missed from work in the past 2 weeks because of health or medical care Clinical: 1) change in depression symptom severity as measured by the PHQ‐9 Functioning: 1) Work limitations Questionnaires Short Form (WLQ), a self‐report survey tool for assessing the impact of health problems, including at‐work performance. 4 Dimensions of performance are measured | |
| Notes | ||
| Risk of bias | ||
| Bias | Authors' judgement | Support for judgement |
| Random sequence generation (selection bias) | Low risk | "Employees were allocated by electronic randomization." |
| Allocation concealment (selection bias) | Low risk | Web‐based randomisation |
| Blinding of participants and personnel (performance bias) | High risk | Participants received information about the RCT and were thus aware of the treatment condition to which they were randomised. Seven counsellors volunteered to conduct the WHI intervention |
| Blinding of outcome assessment (detection bias) | High risk | The WLQ Work absence module is a self‐report measure. As participants were aware of their allocation status, risk of bias high |
| Blinding of outcome assessment (detection bias) | High risk | The PHQ‐9 relies on patient self‐report. As participants were aware of their allocation status, risk of bias high |
| Incomplete outcome data (attrition bias) | Low risk | "Five (9.6%) employees in the WHI treatment group and 2 (7.4%) of the usual group did not complete the follow‐up questionnaire and were considered dropouts." "Sensitivity analyses including the seven employees that were lost to follow‐up confirmed the results." |
| Incomplete outcome data (attrition bias) | Low risk | "Five (9.6%) employees in the WHI treatment group and 2 (7.4%) of the usual group did not complete the follow‐up questionnaire and were considered dropouts." "Sensitivity analyses including the seven employees that were lost to follow‐up confirmed the results." |
| Selective reporting (reporting bias) | Unclear risk | No design paper or trial registration could be identified to assess this risk |
| Other bias | Unclear risk | None identified |
| Methods | RCT, 2 conditions. Recruitment: by screening in the GP waiting rooms and of GP referrals using the GHQ‐12. Score at least 4: seen by GP who administered inclusion and exclusion criteria. Follow up: 6 months. Lost to follow up at 6 months: T1: 27%; T2: 24% | |
| Participants | 274 were randomised (T1: 146; T2: 128). Setting: Primary care, UK Inclusion: GP patients aged 18 to 75 years; diagnosis (ICD): depression, mixed anxiety/depression or anxiety disorder. CIS‐R score at least 12 Married or cohabiting: T1: 54%; T2: 52% Employed: T1: 66%; T2: 58% | |
| Interventions | T1: Computerised CBT: interactive, multimedia. Feedback to patient and GP after each session. 15 minute introductory video, 8 x 50 minute sessions of CBT, with homework projects between sessions | |
| Outcomes | Absenteeism: 1) Number of days of absence from work (certified by GP) during 8 months 1) BDI 1) Work and Social Adjustment Scale | |
| Notes | ||
| Risk of bias | ||
| Bias | Authors' judgement | Support for judgement |
| Random sequence generation (selection bias) | Low risk | "The random allocation schedule was generated at the Institute of Psychiatry. An individual unit of randomization was used." |
| Allocation concealment (selection bias) | Low risk | "Random allocation schedule was generated at the Institute of Psychiatry, before the study commenced and away from GP practices. Cards in sealed and numbered envelopes were used. Only to be opened by practice nurse who ran study. Integrity was checked by the first author on her regular visits to the practices." |
| Blinding of participants and personnel (performance bias) | High risk | No blinding, risk of performance bias considered high as the treatment of interest (T1) cannot be considered equally desirable as Treatment as usual (T2) for patients. "Patients randomized to 'Beating the Blues' (T1) also received pharmacotherapy, if prescribed by their GP, and/or general GP support and practical/social help", offered as part of treatment as usual, with the exception of any face‐to‐face counselling or psychological intervention. We did not constrain the interventions received by patients allocated to treatment as usual (T2)." Moreover, patients in the Treatment as Usual (T2) group were found to attend other health care professionals more often. "Large differences were observed for the proportion of patients attending accident and emergency or outpatient departments, and having contacts with community psychiatric nurses, counsellors and other therapists. Greater use was made by the TAU group for all these services." |
| Blinding of outcome assessment (detection bias) | High risk | No blinding of outcome assessors was reported. Sick leave was based on the sick leave certificates of the GP, who was also the treatment provider of treatment as usual. "We recorded the number of days of absence from work during the baseline and follow‐up periods on the basis of an issue of a certificate by the general practitioner." |
| Blinding of outcome assessment (detection bias) | High risk | No blinding of patients was reported and depressive symptoms were measured by self‐report "Depressive symptoms were measured with self‐report and participants were not blinded to treatment allocation." |
| Incomplete outcome data (attrition bias) | High risk | Loss to follow up was relatively high (> 20%) for the depression outcome From Figure 2 of the publication on depression outcome (Proudfoot et al 2004): Loss to follow up: T1: 27%; T2: 24% |
| Incomplete outcome data (attrition bias) | Low risk | Sick leave data were part of the cost data, and a high percentage of the cost data were complete at follow up. "A total of 274 patients were randomised into two groups (BtB, n = 146; TAU, n = 128), with cost data available for both baseline and follow‐up periods for 261 (95%) patients (138 BtB, 123 TAU)." |
| Selective reporting (reporting bias) | Unclear risk | No design paper or trial registration could be identified to assess this risk |
| Other bias | Unclear risk | None identified |
| Methods | RCT. multicentre, 2 conditions. Recruitment: referrals from physicians or mental health professionals, media advertising, and word of mouth. Follow up: 12 weeks. Lost to follow up: 2% | |
| Participants | 635 were randomised: (T1: 426; T2: 209). Setting: 12 outpatient centres in USA Inclusion: age 21 to 65 years; Diagnosis of chronic MDD with two or less cumulative depression‐free months and who had not met DSM‐II‐R criteria for dysthymia within 2 months of the onset of current MD episode OR of concurrent MD episode superimposed on antecedent DSM‐III‐R dysthymia; Premenopausal women: adequate contraception Married: 38% Employed: 71% | |
| Interventions | T1: sertraline (SSRI). Week 1‐3: 50 mg/day, then weekly titration in 50 mg/day increments (max 200 mg/day). 12 weeks, visits every week for the first 6 weeks and every 2 weeks for last 6 weeks. Before this, 1 week placebo run‐in | |
| Outcomes | Absenteeism: 1) hours worked per week (12 weeks) Clinical: 1) full remission, both CGI‐I (=sub scale CGI) score of 1 or2 AND total HAM‐D score of 7 (or less) at last visit Employment status: 1) employed (yes or no) 2) LIFE work functioning | |
| Notes | ||
| Risk of bias | ||
| Bias | Authors' judgement | Support for judgement |
| Random sequence generation (selection bias) | Unclear risk | Not reported |
| Allocation concealment (selection bias) | Unclear risk | Not reported |
| Blinding of participants and personnel (performance bias) | Low risk | "A novel statistical method was employed for unblinding patients who experienced recurrence or clinically significant worsening of symptoms." "In consultation with FDA personnel, the sponsor's statistician monitored the ability of each investigator to guess the treatment assignment of their patients still in the study. When breaking the blind for any patient, the statistician (R.J.M.) examined the effect of unblinding on our ability to guess the treatment assignment for the remaining patients at that site. If any of these probabilities exceeded 75%, the site agreed to refer all subsequent relapsers to a third party for treatment." |
| Blinding of outcome assessment (detection bias) | Unclear risk | Sick leave was assessed by the LIFE interview. Interviewers were blind to treatment condition. "Finally, it should be noted that while blind to treatment condition, patients and interviewers were not blind to the fact that patients were receiving active medication nor were they blind to the time of assessment (baseline, week 4, endpoint)." |
| Blinding of outcome assessment (detection bias) | Unclear risk | Depressive symptoms were measured with the 24 HAM‐D (clinician‐rated). Interviewers were blind to treatment condition. "Finally, it should be noted that while blind to treatment condition, patients and interviewers were not blind to the fact that patients were receiving active medication nor were they blind to the time of assessment (baseline, week 4, endpoint)." |
| Incomplete outcome data (attrition bias) | Low risk | For depressive symptoms, ITT rates of remission could be calculated for 623 (of the 635) patients, which is 98%. "See Figure 1, Keller et al, 1998." |
| Incomplete outcome data (attrition bias) | Unclear risk | Completeness of sick leave data not reported. "Sample sizes [on psychosocial variables] vary due to sporadic missing data." |
| Selective reporting (reporting bias) | Unclear risk | No indication for selective reporting could be identified. The design was published in a paper by Rush et al, albeit concurrently with the publications on the outcome |
| Other bias | Unclear risk | None identified |
| Methods | Two‐armed cluster randomised trial. Recruitment: Recruitment of workers started in November 2006 and ended in December 2007. Workers eligible according to the OP were invited to participate. Follow up: 12 months. Lost to follow up main outcome: 10.6% for all participants and 11% for depressed subgroup | |
| Participants | 160 were randomised (T1: 75; T2: 85). Subgroup of depressed workers: 37 (T1: 18; T2:19). Setting: Occupational healthcare. This study was conducted in the Netherlands, where most of the workers on sick leave due to CMD visit an OP. The OP offers RTW interventions to these workers according to the evidence‐based (Dutch) guidelines Inclusion: workers who were on sick leave due to CMD between 2 and 8 weeks. CMD were defined as stress‐related, adjustment, anxiety or depressive disorders. Stress‐related disorders were classified according to the Dutch guidelines for OP (19). Anxiety, depressive, and adjustment disorders were classified by the Diagnostic and Statistical Manual of Mental Disorders (DSM‐IV) Exclusion: workers with a primary somatic disorder according to the OP and those who were not able to speak Dutch Mean age: T1: 44.9 (SD 9.8); T2: 45.9 (SD 9.8) Female: T1: 75.7%; T2: 66.7% Educational level: Low: T1: 8.7%; T2: 17.9% Middle: T1: 24.6%; T2: 23.1% High: 66.7%; T2: 59.0% | |
| Interventions | T1: Exposure based return to work intervention (RTW‐E): In the RTW‐E program, workers received CAU and were gradually exposed in vivo to more demanding work situations structured by a hierarchy of tasks evoking increasing levels of anxiety, stress, or anger. The RTW‐E program provided workers with several homework assignments aimed at preparing, executing, and evaluating an exposure‐based RTW plan T2: Care as usual (CAU): aims to help workers regain control and rebuild social and occupational contacts and activities, according to the OP practice guidelines for CMD. The OP can support this process by using recommended methods such as stress inoculation training, cognitive restructuring, graded activity, and time contingency during the RTW | |
| Outcomes | Absenteeism: 1) the time‐to‐full RTW, calculated as the number of calendar days from the first day of sick leave to the first day of full RTW. Full RTW was defined as the total number of contracted working hours per week lasting ≥28 calendar days without a recurrence of sick leave Clinical: 1) symptoms of depression, assessed by the Four‐Dimensional Symptom Questionnaire (4DSQ) | |
| Notes | ||
| Risk of bias | ||
| Bias | Authors' judgement | Support for judgement |
| Random sequence generation (selection bias) | Low risk | "We performed a restricted randomization with blocks of four OPs." After randomization researcher KN informed EN about the allocation of every OP and saved the randomization file." Personal communication: "The randomization followed a schedule generation by randomization software." |
| Allocation concealment (selection bias) | High risk | "The validity of the results of this study may have been limited due to a selection bias because of the absence of allocation for each OP. As a result, the potential for the selective inclusion of workers was rather high." "However, we could not prevent some OP from including zero workers, which could have introduced selection bias." |
| Blinding of participants and personnel (performance bias) | High risk | Blinding of participants and researchers, but not of personnel was ensured: "The workers were blind to the differences in RTW‐E and CAU." "The researchers were blind to the allocation and outcome measurement." |
| Blinding of outcome assessment (detection bias) | Low risk | Sick leave was assessed by workers' diaries. As workers are blinded to allocation status, risk of detection bias for sick leave is considered to be low |
| Blinding of outcome assessment (detection bias) | High risk | Depression is assessed by the 4DSQ, a self‐report questionnaire. As the participants were blinded to allocation status, risk of detection bias for depressive symptoms is considered to be low |
| Incomplete outcome data (attrition bias) | High risk | Loss to follow‐up for depression for the subgroup of depressed workers: 52% |
| Incomplete outcome data (attrition bias) | High risk | Loss to follow up of sick leave data for the subgroup of depressed workers was: 11%. No appropriate method was used to take selective attrition into account |
| Selective reporting (reporting bias) | High risk | Not all (secondary) outcomes measures announced in the design paper were reported in the effect study, of which the data on the HADS‐depression subscale |
| Other bias | Unclear risk | None identified |
| Methods | RCT. multicenter, 2 conditions. Recruitment: from general practitioners' practices. Follow up: 24 weeks. Lost to follow up: T1: 6%; T2: 14% | |
| Participants | 177 were randomised: (T1:93; T2:84). Setting: primary care, outpatients in Scotland, UK. Inclusion: > 18 years old; Depressive episode according to DSM‐IV checklist; 17‐HAM‐D score > 18 Exclusion: schizophrenia, Bipolar, suicidal, illicit drug abuse or alcohol dependence; Treatment with any other psychotropic drug within 1 week before entry, or mirtazapine or paroxetine during the present episode, or treatment within 5 weeks before entry with fluoxetine, or any other antidepressant within 2 weeks before entry; renal, hepatic, respiratory, cardiovascular, or cerebrovascular disease; pregnancy or lactating, or no contraception Fulltime or part‐time employed: T1: 48%; T2: 58% | |
| Interventions | T1: Mirtazapine (TCA): 30 tto 45 mg/day oral | |
| Outcomes | Absenteeism: 1) total mean days lost due to illness in 24 weeks 1) primary: change from baseline on 17‐HAM‐D; Secondary: 17‐HAM‐D responder rates (= at least 50% change from baseline to endpoint); 17 HAM‐D remitter rates (= % with score of 8 or less on two assessments after the first score of 8 or less) | |
| Notes | ||
| Risk of bias | ||
| Bias | Authors' judgement | Support for judgement |
| Random sequence generation (selection bias) | Low risk | A randomisation list was used that was prepared in advance "Randomization was performed according to centrally prepared randomization lists." |
| Allocation concealment (selection bias) | Low risk | "Randomization was performed according to centrally prepared randomization lists." Personal communication: "The person assessing eligibility for inclusion was blind to allocation concealment." |
| Blinding of participants and personnel (performance bias) | Low risk | Double‐blind study design. Personal communication: "Medication was dispensed by the GP who was blinded to treatment allocation." |
| Blinding of outcome assessment (detection bias) | Low risk | Double‐blind study design. Sick leave was assessed by questionnaires filled out by patients, who were blinded to treatment allocation |
| Blinding of outcome assessment (detection bias) | Low risk | Double‐blind study design. Personal communication: "Outcomes were assessed by trained research nurses who were blind to treatment allocation." |
| Incomplete outcome data (attrition bias) | High risk | Lost to follow‐up: T1: 6%; T2: 14% and no appropriate imputation methods have been used "Six excluded mirtazapine patients, four were lost to follow‐up, one dropped out early, and one refused participation in the study. Of the 14 excluded paroxetine patients, five were lost to follow‐up, four were early drop outs, two did not participate any further, one discontinued due to the lack of efficacy, one was hospitalized as a results of a concomitant disease and one did not fulfil the selection criteria." "The high attrition rate observed in our study should be taken in to account when interpreting efficacy results due to possible influence on overall efficacy results." |
| Incomplete outcome data (attrition bias) | High risk | Lost to follow‐up: T1: 6%; T2: 14% and no appropriate imputation methods have been used. "Six excluded mirtazapine patients, four were lost to follow‐up, one dropped out early, and one refused participation in the study. Of the 14 excluded paroxetine patients, five were lost to follow‐up, four were early drop outs, two did not participate any further, one discontinued due to the lack of efficacy, one was hospitalized as a results of a concomitant disease and one did not fulfil the selection criteria." "The high attrition rate observed in our study should be taken in to account when interpreting efficacy results due to possible influence on overall efficacy results." |
| Selective reporting (reporting bias) | Unclear risk | No design paper or trial registration could be identified to assess this risk |
| Other bias | Unclear risk | None identified |
| Methods | RCT, randomisation on the level of practice, 12 practices were randomised. Recruitment: Trained administrative staff recruited patients who made routine‐length visits to physicians. They asked eligible (see inclusion) patients to participate in 2 min first stage depression screener. Patients who screened positive and did not meet exclusion criteria were immediately invited to complete 5 min second stage screener. If they screened positive, they were asked to participate in study. Follow up: 24 months. Lost to follow up: 27% | |
| Participants | 326 employed persons were randomised: (T1: 158; T2: 168). Setting: Community primary care practices across the US. Female: T1: 84.2%; T2: 85.7% Employed: 100% | |
| Interventions | T1: Enhanced care. Primary care team was trained to provide high quality depression treatment. After enrolment, patients were evaluated for depression by physician and asked to return within one week to nurse care manager. Subsequent visit: education about treatment, addressing treatment barriers, checklist for physician's review, scheduling of next appointment in one week. This continued for 5‐7 weeks. Then patients were monitored (symptoms and treatment adherence) for one year. Physicians reviewed patients monthly based on report of nurses to see whether guideline recommendations were followed. Medication algorithm of guideline: initially SSRI or secondary amine tricyclic. Switch drug classes when response failure T2: Usual Care. Regular Primary physicians care | |
| Outcomes | Absenteeism: 1) total number of work hours lost due to illness or doctor visits over past 4 weeks 1) depression severity: CES‐D (adapted) Productivity: 1) subjective rating on 0 to 10 scale of productivity at work | |
| Notes | ||
| Risk of bias | ||
| Bias | Authors' judgement | Support for judgement |
| Random sequence generation (selection bias) | Unclear risk | "The practices were stratified and matched into six pairs." "Within each pair, one practice was randomized to the 'enhanced' care condition and the other practice delivered usual care to study participants." |
| Allocation concealment (selection bias) | High risk | Personal communication: "The allocation of the practice was known to the administrative staff who screened patients." |
| Blinding of participants and personnel (performance bias) | Unclear risk | Personal communication: "The allocation of the practice was known to patients eligible to participate. However, these patients did not know that there was another arm of the study that other practices participated in." |
| Blinding of outcome assessment (detection bias) | High risk | Sick leave was measured by self‐report and patients were not blinded to treatment allocation "We measured absenteeism at baseline, 6, 12, 18, and 24 months by calculating lost work hours from employee reports of how many full workdays and part workdays they missed due to illness or doctor visits, reflecting that employee reports demonstrate high agreement with employer records of absenteeism." |
| Blinding of outcome assessment (detection bias) | High risk | Depression was measured by self‐report (CESD‐D) and patients were not blinded to treatment allocation |
| Incomplete outcome data (attrition bias) | High risk | Loss to follow up at endpoint is considered to be high (27%). Risk of attrition bias was therefore deemed high although analyses accounted sufficiently for missing data according to authors: "Because analysis of missing data patterns produced no evidence of non ignorable missingness, we present unweighted models, noting that weighted models produce closely comparable results." |
| Incomplete outcome data (attrition bias) | High risk | Loss to follow up at endpoint is considered to be high (27%). Risk of attrition bias was therefore deemed high although although analyses accounted sufficiently for missing data according to authors: "Because analysis of missing data patterns produced no evidence of non ignorable missingness, we present unweighted models, noting that weighted models produce closely comparable results." |
| Selective reporting (reporting bias) | Unclear risk | No design paper or trial registration could be identified to assess this risk |
| Other bias | Unclear risk | None identified |
| Methods | RCT, two conditions; Regular referrals (including from occupational physicians), 48 weeks treatment. Follow up: 42 months. Lost to follow up at 12 months: T1: 13%; T2: 3%; at 42 months: T1: 25%; T2: 20% | |
| Participants | 62 were randomised (T1:32; T2:30). Setting: outpatient unit of Psychiatric department of Academic hospital. The Netherlands Inclusion:18 years; MDD (single episode or recurrent); BDI score >15; Work absenteeism due to depression of at least 50% of regular hours worked per week with a duration between 10 weeks and 2 years;Clinically estimated contribution of work to the onset and/or continuation of depression of > 50% of supposed causal factors Mean hours employment: T1: 36.5 (SD 10.4); T2: 36.4 (SD 7.8) | |
| Interventions | T1: Treatment as usual (TAU) following evidence‐based guidelines (APA Guideline);This consisted of clinical management according to APA Guideline and antidepressants, if indicated and accepted by patients, according to our standardized stepwise drug treatment regimen or algorithm. Visits consisted of symptom assessment, psycho‐education, general support and cognitive behavioral techniques, and if indicated medication prescription, dose titration and review of adverse effects. In case of any clinical significant deterioration in condition patients could be referred for partial or full‐time hospitalisation within the Program. Patients were treated by three supervised senior psychiatric residents. Visits regularly took 30 minutes every 2 to 4 weeks | |
| Outcomes | Absenteeism: | |
| Notes | ||
| Risk of bias | ||
| Bias | Authors' judgement | Support for judgement |
| Random sequence generation (selection bias) | Low risk | "Patients who met the inclusion criteria were randomly assigned to TAU or TAU +OT in blocks of 20 by use of computer‐generated cards stored as concealed assignment codes in consecutively number sealed envelopes under the responsibility of an independent research associate." |
| Allocation concealment (selection bias) | Low risk | "Patients who met the inclusion criteria were them randomly assigned to TAU or TAU +OT in blocks of 20 by use of computer‐generated cards stored as concealed assignment codes in consecutively number sealed envelopes under the responsibility of an independent research associate." |
| Blinding of participants and personnel (performance bias) | High risk | Risk of performance bias considered high as the TAU cannot be considered equally desirable as TAU +OT for patients. Personal communication: "patients and clinical personnel were not blinded." |
| Blinding of outcome assessment (detection bias) | High risk | Sick leave was measured by self‐report and patients were not blinded to treatment allocation "Work resumption data were assessed by a study‐specific questionnaire at T2, T3, T4 and T5." |
| Blinding of outcome assessment (detection bias) | High risk | "Depression was assessed by the BDI, a self‐report measure of severity of depressive symptoms." Patients were not blinded to treatment allocation |
| Incomplete outcome data (attrition bias) | High risk | Loss to follow up was high: T1: 25%; T2: 20%. Risk of attrition bias was therefore deemed high even though appropriate imputation methods have been used: "Complete T4 data were obtained on 28 (88%) of TAU patients and on 29 (97%) of TAU +OT patients. For T5 these figures were 24 (75%) for TAU and 24 (80%) for TAU + OT." "Both GEE and Proc Mixed give unbiased effect estimates taking into account missing data." |
| Incomplete outcome data (attrition bias) | High risk | Loss to follow up was high: T1:25%; T2: 20%. Risk of attrition bias was therefore deemed high even though appropriate imputation methods have been used: "Complete T4 data were obtained on 28 (88%) of TAU patients and on 29 (97%) of TAU +OT patients. For T5 these figures were 24 (75%) for TAU and 24 (80%) for TAU +OT." "Both GEE and Proc Mixed give unbiased effect estimates taking into account missing data." |
| Selective reporting (reporting bias) | Unclear risk | No design paper or trial registration could be identified to assess this risk |
| Other bias | Unclear risk | None identified |
| Methods | RCT with randomisation on the level of clinic. Clinic clusters were matched based on patient demographics, clinician specialty, and distance to mental health providers. Recruitment: study staff screened consecutive patient visitors. Follow up: 24 months. Lost to follow‐up: T1: 15%; T2: 13% | |
| Participants | 1356 were randomised (T1:913; T2: 443). Setting: 46 Primary care clinics in 6 community‐based managed care organisations in the US | |
| Interventions | T1: Quality improvement program (QI meds or QI therapy). Treatment type or content | |
| Outcomes | Absenteeism: 1) days worked during 24 months follow‐up for whole sample 1) CES‐D | |
| Notes | ||
| Risk of bias | ||
| Bias | Authors' judgement | Support for judgement |
| Random sequence generation (selection bias) | Low risk | "Within blocks, we used a random number table to assign clusters to usual care or QI interventions." |
| Allocation concealment (selection bias) | High risk | Randomisation was on the level of practice and primary care clinicians were not blinded for allocation during enrolment of patients |
| Blinding of participants and personnel (performance bias) | High risk | Patients and personnel were not blinded: "We asked all primary care clinicians to enrolls prior to their knowledge of intervention status." "Patients learned of their intervention status after enrolment." Personal communication: "Subjects in the interviews were not blinded, but may or may not have known their intervention status given the nature of interventions." Interventions were not equally desirable for patients, so risk of performance bias high |
| Blinding of outcome assessment (detection bias) | High risk | Sick leave was measured by self‐report and patients were not blinded to treatment allocation "We also examined days missed from work due to illness, which patients reported for the 4 weeks preceding each follow‐up study." |
| Blinding of outcome assessment (detection bias) | High risk | Depression was measured by self‐report and patients were not blinded to treatment allocation. 'We assessed depressive symptoms at baseline and follow‐up using a 23‐item version of the Center of Epidemiologic Studies Depression (CES‐D) Scale, developed by Daniel Ford. This version drops 6 items and adds others to approximate DSM‐IV criteria. Items responses were summed." |
| Incomplete outcome data (attrition bias) | Low risk | Lost to follow up for the depressive symptoms is 15% but appropriate imputation methods have been used. "The data are weighted for the probability of study enrolment and follow‐up response to the characteristics of the eligible sample. We used multiple imputations for missing items at each wave." |
| Incomplete outcome data (attrition bias) | Low risk | Lost to follow for the economic survey is 15% but appropriate imputation methods have been used. "The data are weighted for the probability of study enrolment and follow‐up response to the characteristics of the eligible sample. We used multiple imputations for missing items at each wave." |
| Selective reporting (reporting bias) | Unclear risk | No design paper or trial registration could be identified to assess this risk |
| Other bias | Unclear risk | None identified |
| Methods | RCT (consisting of 2 substudies) with two conditions. Recruitment: participating primary care physicians were asked to refer any adult outpatient initiating care for depression and willing to consider treatment with antidepressant medication. The research assistant screened for eligibility | |
| Participants | 156 patients with MDD were randomised (T1: 80; T2: 76). Setting: Large primary care clinic in managed care setting in US | |
| Interventions | T1: Multifaceted intervention. Goal: increase likelihood that treatment would be conform primary care depression guidelines Components: | |
| Outcomes | Absenteeism: 1) proportion of patients with MDD who experienced at least 50% reduction in depressive symptoms on IDS | |
| Notes | Data are provided for subgroup of MDD only, both substudies combined | |
| Risk of bias | ||
| Bias | Authors' judgement | Support for judgement |
| Random sequence generation (selection bias) | Low risk | "Patients were randomly assigned using computer generated random numbers." |
| Allocation concealment (selection bias) | Low risk | Personal communication: "The primary care physicians or the research assistant did not know anything about the randomization status of the next patient. Randomization was performed 1‐7 days after the baseline assessment by the study manager." |
| Blinding of participants and personnel (performance bias) | High risk | Personal communication: "Patient participants and their treating clinicians were not blinded – and it would not have been possible to do so." Interventions were not equally desirable for patients, so risk of performance bias high |
| Blinding of outcome assessment (detection bias) | High risk | Sick leave was measured by self‐report and patients were not blinded to treatment allocation. "One of the four assessments included questions adapted from the National Health Interview Survey regarding days of missed work or school due to health." |
| Blinding of outcome assessment (detection bias) | Low risk | "Folllow‐up telephone interviewers were blinded to treatments assignment." "Two of the assessments included a 20‐item depression scale extracted from the Hopkins Symptom Checklist or SCL and a version of the clinician‐rated Inventory of Depressive Symptoms or IDS modified for telephone administration." |
| Incomplete outcome data (attrition bias) | High risk | Lost to follow‐up is considered to be high: T1: 17%; T2: 21%. Risk of attrition bias was therefore deemed high although appropriate imputation methods have been used: "Model were estimated using generalized estimating equations (GEE) to account for multiple assessments and to allow for missing data" |
| Incomplete outcome data (attrition bias) | High risk | Lost to follow‐up is considered to be high: T1: 17%; T2: 21%. Risk of attrition bias was therefore deemed high although appropriate imputation methods have been used: "Model were estimated using generalized estimating equations (GEE) to account for multiple assessments and to allow for missing data" |
| Selective reporting (reporting bias) | Unclear risk | No design paper or trial registration could be identified to assess this risk |
| Other bias | Unclear risk | None identified |
| Methods | RCT. Recruitment: 22 months. Follow up: 12 months. Lost to follow up: 41.3% | |
| Participants | 126 were randomised (T1:65; T2:61); Setting: the study was carried out within a large occupational health service in the Netherlands Inclusion: workers on sickness absence between 4 and 12 weeks, whose absence was diagnosed by occupational physicians (OPs) as due to mental disorder, who screened positively for depressive disorder (i.e. score ≥ 10 on 9‐item 0 to 27 depression subscale of Patient Health Questionnaire), who have informed consent and who met the DSM‐IV criteria for MDD and gave written informed consent Exclusion: workers who were suicidal, psychotic or had a primary diagnosis of substance abuse or dependence, as assessed by the MINI Male: T1: 45.9%; T2: 46.2% Marital status: T1: 73.3% married or cohabiting; T2: 60.0% married or cohabiting Educational level: T1: 35.0% high; T2: 36.1% high; T1 30.0% average; T2: 36.0% average; T1: 35.0% low; T2: 27.9% low Dutch nationality: T1: 91.8%; T2: 95.4% | |
| Interventions | T1: Collaborative care intervention. Provided by the Occupational Physician Care Manager (OP‐CM), contained the following elements: 6 to 12 sessions of Problem Solving Therapy, manual‐guided self‐help, a workplace intervention and, depending on patient preference, prescription of antidepressant medication according to a treatment algorithm. In order to enhance the adherence to the treatment model, ongoing supervision and psychiatric consultation was provided to the OP‐CMs. Also, a web‐based tracking system was developed to support the OP‐CM in monitoring treatment outcomes and in adhering to the stepped care protocol. In case of questions regarding the treatment, prescription of antidepressants, or (lack of) progress of the worker, the OP‐CM was prompted by the web‐based tracking system to consult the psychiatrist T2: Usual care. Sick‐listed workers start to visit the company's OP before the 6th week of sickness absence. The guidance of company's OP is protocolised according to the OP guidelines of the Dutch Board for Occupational Medicine. In practice, whether or not sick‐listed workers will receive treatment for MDD may vary considerable. The actual care that was provided was assessed by questionnaires in both groups | |
| Outcomes | Absenteeism: 1) the duration until lasting, full RTW. The duration until lasting, full RTW was defined as the duration of sickness absence due to MDD in calendar days, from the day of randomisation until full RTW for at least 4 weeks without partial or full recurrence 2) the total number of sickness absence days, calculated for the entire follow up Clinical: 1) severity of depression, assessed by the PHQ‐9 2) time to first response on depressive symptoms. Response is defined as a reduction in depressive symptoms of at least 50% 3) time to first remission, defined as a score of less than 5 on the PHQ‐9 | |
| Notes | ||
| Risk of bias | ||
| Bias | Authors' judgement | Support for judgement |
| Random sequence generation (selection bias) | Low risk | "The randomization scheme was prepared by a computer, with blocks of four, by an independent statistician." |
| Allocation concealment (selection bias) | Low risk | "While assessing eligibility for the study, both the research assistant and the participant were blinded for the allocation." |
| Blinding of participants and personnel (performance bias) | High risk | Participants were not blinded and both interventions were not equally desirable for them, so risk of performance bias was high. "Then, the participant was informed about the computer generated allocation status by the research assistant. Next, the baseline questionnaire was sent by mail." |
| Blinding of outcome assessment (detection bias) | Low risk | Low risk as sickness absence data were based on registration database. "Sickness absence data were derived from the register of the occupational service 1 year after randomization." |
| Blinding of outcome assessment (detection bias) | High risk | Data about depressive symptoms were collected by a self‐report questionnaire and patients were not blinded to treatment allocation |
| Incomplete outcome data (attrition bias) | High risk | Lost to follow up was high. "Lost to follow‐up rates at 3,6, 9 and 12 months were respectively 22.2%, 28.6%, 33.3% and 41.3%." Risk of attrition bias was considered high even though an appropriate method has been described to account for this missing data: 'If there is missing data on costs and/or effects, and the additional uncertainty it introduces, multiple imputation will be used." |
| Incomplete outcome data (attrition bias) | Low risk | No missing sickness absence data |
| Selective reporting (reporting bias) | Low risk | The study protocol is available and all of the study’s pre‐specified (primary and secondary) outcomes that are of interest in the review have been reported in the pre‐specified way |
| Other bias | Unclear risk | None identified |
| Methods | A double‐blind, multinational randomised study. Recruitment: outpatients with MDD were recruited in psychiatric and general practice settings, from September 2005 to September 2006. Follow up: 24 weeks. Lost to follow up: 23% (clinical outcome) and 24.4% (sick leave) | |
| Participants | 295 were randomised (T1: 144; T2: 151). Setting: outpatients of 35 centra of psychiatric and general practice settings. Inclusion: patients with MDD (current episode assessed with the MINI), according to the DSM IV‐TR criteria, outpatient of either sex, aged 18‐65 years, with a MADRS total score ≥ 26 and a CGI‐S score ≥ 4 at baseline visit. Patients with a secondary current comorbid anxiety disorder (DSM‐IV TR criteria) could be included in the study, expect for obsessive‐compulsive disorder, post‐traumatic stress disorder, or panic disorder. Exclusion: if they met one or more of the DSM IV‐TR criteria for any of the following: bipolar disorder, psychotic disorder or features, current eating disorders (anorexia nervosa, bulimia), mental retardation, any pervasive developmental disorder or cognitive disorder, or alcohol or drug abuse‐related disorders within 12 months prior to baseline. In addition, patients at serious suicide risk, based on the investigator's clinical judgement, or who had a score of ≥ 5 on item 10 of the MADRS scale, were also excluded, as were those receiving formal behavioural therapy, or systematic psychotherapy, or were pregnant or breast feeding, or had a history of lactose intolerance. Patients with a history of hypersensitivity or non‐response to citalopram, or escitalopram, or duloxetine, or with increased intra‐ocular pressure, or at risk of acute narrow‐angle glaucoma, were also excluded. Patients were also excluded if they were taking the following psychotropic drugs within 2 weeks prior to baseline or during the study: MAOI or RIMA, SSRI (fluoxetine within 5 weeks), SNRIs, and tricyclic antidepressants, tryptophan, psychoactive herbal remedies, any drug used for augmentation of antidepressant action or any other antidepressant drugs, oral antipsychotic and anti‐manic drugs (including lithium), or ECT (within 6 months), dopamine antagonists, any anxiolytics (including benzodiazepines), any anticonvulsant drug, serotonergic agonists, narcotic analgesics, cardiac glycosides, type 1c anti‐arrhythmics, oral anticoagulants, cimetidine, potent inhibitors of CYP2C19, CYP1A2, or medicinal products with a narrow therapeutic index predominantly metabolised by CYP2D6. Female: T1: 73.8%; T2: 71.2% Age: T1: 43.3 (SD 11.6); T2: 44.5 (SD 11.0) Marital status: T1: 27.0% single; T2: 20.5% single T1: 50.4% married or living as a couple; T2: 50.7% married or living as a couple T1: 17.7% divorced or separated; T2: 25.3% divorced or separated T1: 5.0% widowed; T2: 3.4% widowed Level of education: T1: 5.0% no degree or diploma; T2: 4.1% no degree or diploma T1: 29.1% elementary school; T2: 26.0% elementary school T1: 43.3% high school; T2: 45.2% high school T1: 11.3% non‐university degree; T2: 15.1% non university degree T1: 11.3% university; T2: 9.6% university Employment status: T1: 58.9% paid employment or self‐employed; T2: 60.3% paid employment or self‐employed T1: 15.6% unemployed; T2: 18.5% unemployed T1: 5.0% student; T2: 4.8% student T1: 6.4% non‐working spouse; T2: 3.4% non‐working spouse T1: 7.8% retired; T2: 10.3% retired T1: 6.4% other; T2: 2.7% other Occupational status: T1: 34.8% no data available; T2: 36.3% no data available T1: 6.5% manager or administrator; T2: 12.9% manager or administrator T1: 16.3% professional; T2: 15.1% professional T1: 10.9% associate professional; T2: 10.8% associate professional T1: 8.7% clerical worker/secretary; T2: 10.8% clerical worker/secretary T1: 26.1% skilled labourer or factory worker; T2: 17.2% skilled labourer or factory worker T1: 27.2% services/sales (retail); T2: 24.7% services/sales T1: 4.3% other; T2: 8.6% other | |
| Interventions | T1: escitalopram (SSRI), 10 mg/day for the first 2 weeks, and 20 mg/day for the rest of the period T2: duloxetine (SNRI), 60 mg/day for the 24 weeks, in accordance with the recommendations in the package insert for duloxetine in the participating countries | |
| Outcomes | Absenteeism: 1) percentage of patients taking sick leave 2) mean per patient sick leave duration in days Clinical: 1) adjusted mean change in the MADRS total score 2) MADRS total score 3) HAMD‐17 4) remission, defined as MADRS ≤ 12 or post hoc as HAMD‐17 ≤ 7) 5) response, defined as ≥50% decrease from baseline in MADRS or (post hoc) HAMD total score Work functioning: 1) impairment, assessed by the Sheehan Disability Scale | |
| Notes | ||
| Risk of bias | ||
| Bias | Authors' judgement | Support for judgement |
| Random sequence generation (selection bias) | Low risk | "Patients who met the selection criteria at the baseline visit were assigned to 24 weeks of double‐blind treatment in a 1:1 ratio of escitalopram or duloxetine treatment according to a computer‐generation randomization list." "At each study centre, sequentially enrolled patients were assigned to the lowest randomization number available in blocks of 4." |
| Allocation concealment (selection bias) | Low risk | "The details of the randomization series were unknown to any of the investigators and were contained in a set of sealed opaque envelopes." |
| Blinding of participants and personnel (performance bias) | Low risk | "All study personnel and participants were blinded to treatment assignment for the duration of the entire study." |
| Blinding of outcome assessment (detection bias) | Low risk | Sick leave was assessed by physicians, who are blinded for allocation status |
| Blinding of outcome assessment (detection bias) | Low risk | The MADRS and HAMD‐17 are assessed by a doctor, who were blinded for allocation status |
| Incomplete outcome data (attrition bias) | High risk | Lost to follow up is considered to be high (23%). Risk of attrition bias was therefore deemed high and no appropriate method has been used to account for this missing data: "The primary endpoint was the adjusted mean change in MADRS total score from baseline to week 24, based on the intention‐to‐treat set (ITT), comprising all patients who took at least one valid post‐baseline MADRS assessment, and using last‐observation‐carried‐forward (LOCF) analysis." |
| Incomplete outcome data (attrition bias) | High risk | Lost to follow up is considered to be high (24.4%) Risk of attrition bias was therefore deemed high and no appropriate method has been used to account for this missing data: "In cases of premature study withdrawal, patients were assigned zero sick leave for missing assessments." |
| Selective reporting (reporting bias) | Unclear risk | No design paper or trial registration could be identified to assess this risk |
| Other bias | Unclear risk | None identified |
| Methods | RCT. Recruitment: occurred between January 2004 and February 2005 using a 2‐phase procedure. Follow up: 12 months. Lost to follow up: 12.3% | |
| Participants | 604 were randomised (T1:304; T2:300); Setting: Participants included 604 depressed workers 18 years and older and enrolled in United Behavioural Health (UBH), a large managed behavioral health care company; Inclusion: Respondents with at least moderate depression (phase 1: K‐6 ≥ 9; Phase 2: QIDS‐SR ≥ 8); Exclusion: employees with lifetime bipolar disorder, substance disorder, recent mental health specialty care or suicidally Female: T1: 70.7 %; T2: 77.0%% College graduates: T1: 38.0%; T2: 43.8% (24.6%) | |
| Interventions | T1: The structured telephone intervention: telephone outreach and care management program. Systematically assessed needs for treatment, facilitated entry into in‐person treatment (both psychotherapy and antidepressant medication), monitored and supported treatment adherence, and (for those declining in‐person treatment) provided a structured psychotherapy intervention by telephone. Intervention participants declining in‐person treatment and experiencing significant depressive symptoms after 2 months were offered a structured 8‐session cognitive behavioural psychotherapy program T2: Usual care. Patients were advised to consult a clinician and could receive any normally available insurance benefit or service (eg, psychotherapy or pharmacotherapy), just not the additional telephone care management components provided to those in the intervention group | |
| Outcomes | Absenteeism: 1) actual weekly hours worked among the employed, assessed by Health and Productivity Questionnaire (HPQ), a validated self‐report instrument Clinical: 1) depression severity, assessed by QIDS‐SR Functioning: 1) on‐the‐job performance, assessed by HPQ | |
| Notes | ||
| Risk of bias | ||
| Bias | Authors' judgement | Support for judgement |
| Random sequence generation (selection bias) | Low risk | "Randomization was carried out by the survey research firm conducting eligibility assessments with a computerized procedure that classified respondents for eligibility and used a random number generator to assign participants to intervention or usual care." |
| Allocation concealment (selection bias) | Low risk | "Patient treatment allocation was concealed." |
| Blinding of participants and personnel (performance bias) | High risk | Participants were not blinded. "Participants were advised not to offer information information to their interviewers regarding their intervention status." Interventions not equally desirable for both groups which entails a high risk of bias. "Respondents were told they might be invited to participate in an innovative treatment program." |
| Blinding of outcome assessment (detection bias) | High risk | HPQ is a self‐report instrument. As patients were aware of their allocation status, risk of bias high |
| Blinding of outcome assessment (detection bias) | High risk | QID‐SR is a self‐report instrument. As patients were aware of their allocation status, risk of bias high |
| Incomplete outcome data (attrition bias) | Low risk | Lost to follow up: T1: 14.5%; T2: 10% but appropriate method has been used to account for missing data: "Multiple imputation was used to adjust for some participants not completing either 6‐months (35 intervention and 22 usual care) or 12 month (44 intervention and 30 usual care) interviews." "Intervention effects on depression severity were estimated using multiple imputation linear regression with simulated standard errors." |
| Incomplete outcome data (attrition bias) | Low risk | Lost to follow up: T1: 14.5%; T2: 10% but appropriate method has been used to account for missing data: "Multiple imputation was used to adjust for some participants not completing either 6‐months (35 intervention and 22 usual care) or 12 month (44 intervention and 30 usual care) interviews." "Comparable multiple imputation regression analyses were used to estimate intervention effects on work outcomes.'' |
| Selective reporting (reporting bias) | Unclear risk | No design paper or trial registration could be identified to assess this risk |
| Other bias | Unclear risk | None identified |
BDI = Back Depression Inventory
CAGE = The name of which is an acronym of its four questions, is a widely used method of screening for alcoholism
CAU = Care as usual
CES‐D = Center for Epidemiologic Studies Depression scale
CMD = Common mental disorders
CMHN = Community Mental Health Nursing
CIS‐R = Clinical Interview Schedule‐Revised
CTU = Copenhagen Trial Unit
DSM‐IV = Diagnostic and Statistical Manual of Mental Disorders
4DSQ = Four‐Dimensional Symptom Questionnaire
EAP = Employee Assistance Programme
ECT = Electroconvulsive therapy
FDA = Food and Drug Administration
GAS = Global Assessment Scale
GCI = Clinical Global Impression Scale
GEE = Generalized Estimating Equation
GP = General practitioner
GHQ‐12 = General Health Questionnaire
HADS(‐D)= Hospital Anxiety en Depression Scale
HAMD‐D(17) = Hamilton Rating Scale for Depression
HDRS = Hamilton Rating Scale for Depression
HPQ = Health and Work Performance Questionnaire
HRSD = Hamilton Rating Scale for Depression
ICD‐10 = International Statistical Classification of Diseases and Related Health Problems
IDS = Inventory of Depressive Symptomatology
LOCF = Last Observation Carrierd Forward
MADRS = Montgomery‐Asberg Depression Scale
MAO = Monoamine oxidase
MAOI = Monoamine oxidase inhibitor
MINI = Mini International Neuropsychiatric Interview
MOS‐SF 36 = Medical Outcomes Study 36‐Item Short Form Health Survey
MDD = Major depressive disorder
OP = Occupational Physician
OT = Occupational therapy
PHQ = Patient Health Questionnaire
PST = Problem Solving Therapy
QI = Quality improvement
QIDS‐SR = Quick Inventory of Depressive Symptomatology‐Self Report
RCT = Randomized controlled trial
RIMA = Reversible inhibitors of monoamine oxidase A
RTW = Return to work
RTW‐E = Exposure based return to work program
SAS = Social Adjustment Scale
SCL = Symptom Checklist Score
SNRI = Selective Serotonin and Noradrenalin Reuptake Inhibitor
SSRI = Delective serotonin reuptake inhibitor
TAU = Treatment as usual
TCA = Tricyclic antidepressant
WLQ = Work Limitations Questionnaire
WHI = Work and Health Initiative
Characteristics of excluded studies [ordered by study ID]
| Study | Reason for exclusion |
| Participants are people with a mild to moderate depression | |
| Sickness absence was not measured as outcome measure | |
| No worker population and sickness absence not measured as outcome measure | |
| Sickness absence was not measured as outcome measure | |
| Patients suffered from mental health problems, less than 50% of these are patients with a depressive disorder | |
| Sickness absence was not measured as outcome measure | |
| It is a meta‐analysis instead of a RCT | |
| Participants were people with severe mental ilness such as schizophrenia | |
| Patients suffered from psychological complaints, including adjustment disorders. Patients with a major depression were excluded from the study | |
| Sickness absence was not measured as outcome measure | |
| Sickness absence was not measured as outcome measure | |
| It is meta‐analysis instead of a RCT | |
| Sickness absence was not measured as outcome measure | |
| Sickness absence was not measured as outcome measure | |
| This study took place in an inpatient care setting | |
| Sickness absence was not measured as outcome measure | |
| No RCT but a matched‐control design was used | |
| Sickness absence was not measured as outcome measure | |
| Sickness absence was not measured as outcome measure | |
| This study is done in a sample of unemployed individuals | |
| Participants were students | |
| Participants with mild depression were included in this study; people with a major depressive disorder were excluded | |
| Participants suffered from a range of non‐psychotic symptoms, data for the depressed subgroup only could not be provided | |
| Inclusion criterion in this study was 'clinical diagnosis of chronic muscle contraction headache' | |
| Sickness absence was not measured as outcome measure | |
| This study took place in a hospital setting | |
| It is quasi‐experimental study | |
| Sickness absence was not measured as outcome measure | |
| Sickness absence was not measured as outcome measure | |
| Sickness absence was not measured as outcome measure | |
| Major depressive disorder was excluded in this study | |
| Sickness absence was not measured as outcome measure | |
| The focus in this study is on relatively mild complaints | |
| Sickness absence was not measured as outcome measure | |
| Sickness absence was not measured as outcome measure | |
| Prevention study; subjects were not depressed | |
| Participants are people with sub‐threshold depression | |
| Sickness absence was not measured as outcome measure | |
| Sickness absence was not measured as outcome measure | |
| Sickness absence was not measured as outcome measure | |
| Sickness absence was not measured as outcome measure | |
| It is not a RCT but a review | |
| This study turned out to be a publication on the same study as Schoenbaum 2001 (which was also included) | |
| Sickness absence was not measured as outcome measure | |
| Sickness absence was not measured as outcome measure | |
| Sickness absence was not measured as outcome measure | |
| This trial is the basis of the economic evaluation of Schoenbaum 2001 | |
| Design was CCT instead of RCT | |
| This study focuses on employees with minimal symptoms of depression |
Characteristics of ongoing studies [ordered by study ID]
| Trial name or title | Not yet assessed |
| Methods | Cluster RCT |
| Participants | common mental disorders |
| Interventions | guideline‐based care by occupational physicians |
| Outcomes | Return‐to‐work |
| Starting date | 2011 |
| Contact information | Department of Social and Behavioral Sciences, Tranzo Scientific Center for Care and Welfare, Tilburg University, PO Box 90153, Tilburg, 5000 LE, the Netherlands |
| Notes |
| Trial name or title | Happy@Work |
| Methods | RCT |
| Participants | Employees with depressive symptoms |
| Interventions | Web‐based guided self‐help |
| Outcomes | Health and Work Performance Questionnaire |
| Starting date | Not yet assessed |
| Contact information | |
| Notes |
| Trial name or title | TCC: PAINDIP |
| Methods | Randomised placebo‐controlled multicentre trial |
| Participants | Major depressive disorder (MDD) and (sub)chronic pain |
| Interventions | Transmural collaborative care with consultation letter (TCCCL) and duloxetine in collaboration with primary care |
| Outcomes | Not yet assessed |
| Starting date | Not yet assessed |
| Contact information | Not yet assessed |
| Notes |
| Trial name or title | The effect of IPS‐modified, an early intervention for people with mood and anxiety disorders: study protocol for a randomised clinical superiority trial. Trials 2013, 14:442. doi:10.1186/1745‐6215‐14‐442 |
| Methods | Randomized clinical superiority trial |
| Participants | Participants with mood and anxiety disorders recently employed or enrolled in education |
| Interventions | IPS‐modified; an individualised supported employment intervention, aiming at supporting people with recently diagnosed anxiety or affective disorders to obtain and sustain competitive employment through mentor support. |
| Outcomes | Competitive employment or education at 24 months |
| Starting date | Not yet assessed |
| Contact information | |
| Notes |
| Trial name or title | Not yet assessed |
| Methods | RCT with three conditions: two treatment conditions and one waiting list control group |
| Participants | Subjects with symptoms of depression (≥ 16 on the Center for Epidemiological Studies Depression scale) from the general population |
| Interventions | Two Internet‐based treatments for depression, namely cognitive behavioural therapy and problem‐solving therapy |
| Outcomes | Absence at work |
| Starting date | Not yet assessed |
| Contact information | |
| Notes | Results at 12 weeks are published: https://ce1ul13jdba‐qne8l9ebidp.sec.amc.nl/pmc/articles/PMC2629364/ This did not include the work outcome |
Data and analyses
| Outcome or subgroup title | No. of studies | No. of participants | Statistical method | Effect size |
| 1 Days of sickness absence Show forest plot | 3 | 251 | Std. Mean Difference (IV, Random, 95% CI) | ‐0.40 [‐0.66, ‐0.14] |
| Analysis 1.1  Comparison 1 Work‐directed plus clinical versus clinical alone (medium term), Outcome 1 Days of sickness absence. | ||||
| 1.1 Occupational therapy plus CAU vs. CAU | 2 | 179 | Std. Mean Difference (IV, Random, 95% CI) | ‐0.30 [‐0.61, 0.01] |
| 1.2 Multi‐component work‐focused program vs. CAU | 1 | 72 | Std. Mean Difference (IV, Random, 95% CI) | ‐0.66 [‐1.15, ‐0.16] |
| 2 Depressive symptoms Show forest plot | 3 | 251 | Std. Mean Difference (IV, Random, 95% CI) | ‐0.32 [‐0.88, 0.25] |
| Analysis 1.2  Comparison 1 Work‐directed plus clinical versus clinical alone (medium term), Outcome 2 Depressive symptoms. | ||||
| 2.1 Occupational therapy plus CAU vs. CAU | 2 | 179 | Std. Mean Difference (IV, Random, 95% CI) | ‐0.08 [‐0.66, 0.50] |
| 2.2 Multi‐component work‐focused program vs. CAU | 1 | 72 | Std. Mean Difference (IV, Random, 95% CI) | ‐0.84 [‐1.34, ‐0.33] |
| 3 Work functioning Show forest plot | 2 | 189 | Std. Mean Difference (IV, Random, 95% CI) | ‐0.31 [‐0.79, 0.16] |
| Analysis 1.3  Comparison 1 Work‐directed plus clinical versus clinical alone (medium term), Outcome 3 Work functioning. | ||||
| 3.1 Occupational therapy plus CAU vs. CAU | 1 | 117 | Std. Mean Difference (IV, Random, 95% CI) | ‐0.09 [‐0.48, 0.29] |
| 3.2 Multi‐component work‐focused program vs. CAU | 1 | 72 | Std. Mean Difference (IV, Random, 95% CI) | ‐0.58 [‐1.08, ‐0.09] |
| Outcome or subgroup title | No. of studies | No. of participants | Statistical method | Effect size |
| 1 Days of sickness absence Show forest plot | 2 | 179 | Std. Mean Difference (IV, Random, 95% CI) | ‐0.19 [‐0.49, 0.12] |
| Analysis 2.1 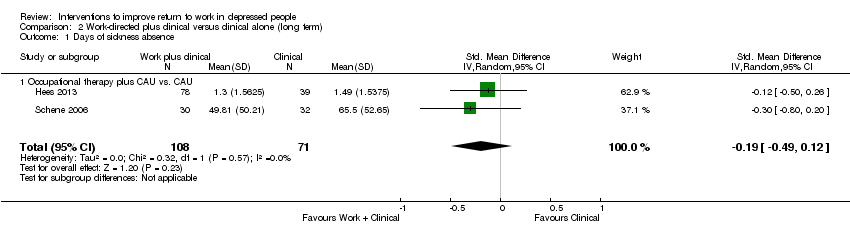 Comparison 2 Work‐directed plus clinical versus clinical alone (long term), Outcome 1 Days of sickness absence. | ||||
| 1.1 Occupational therapy plus CAU vs. CAU | 2 | 179 | Std. Mean Difference (IV, Random, 95% CI) | ‐0.19 [‐0.49, 0.12] |
| 2 Depressive symptoms Show forest plot | 1 | 117 | Std. Mean Difference (IV, Random, 95% CI) | ‐0.63 [‐1.02, ‐0.24] |
| Analysis 2.2 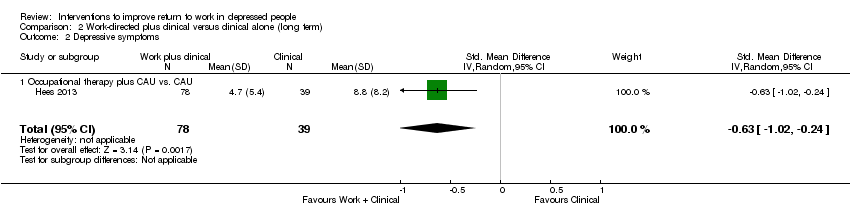 Comparison 2 Work‐directed plus clinical versus clinical alone (long term), Outcome 2 Depressive symptoms. | ||||
| 2.1 Occupational therapy plus CAU vs. CAU | 1 | 117 | Std. Mean Difference (IV, Random, 95% CI) | ‐0.63 [‐1.02, ‐0.24] |
| 3 Work functioning Show forest plot | 1 | 117 | Std. Mean Difference (IV, Random, 95% CI) | ‐0.25 [‐0.63, 0.14] |
| Analysis 2.3  Comparison 2 Work‐directed plus clinical versus clinical alone (long term), Outcome 3 Work functioning. | ||||
| 3.1 Occupational therapy plus CAU vs. CAU | 1 | 117 | Std. Mean Difference (IV, Random, 95% CI) | ‐0.25 [‐0.63, 0.14] |
| Outcome or subgroup title | No. of studies | No. of participants | Statistical method | Effect size |
| 1 Days of sickness absence Show forest plot | 1 | 126 | Std. Mean Difference (IV, Random, 95% CI) | ‐0.14 [‐0.49, 0.21] |
| Analysis 3.1  Comparison 3 Work‐directed plus clinical versus work‐directed (medium term), Outcome 1 Days of sickness absence. | ||||
| 1.1 Collaborative care vs. CAU | 1 | 126 | Std. Mean Difference (IV, Random, 95% CI) | ‐0.14 [‐0.49, 0.21] |
| 2 Depressive symptoms Show forest plot | 1 | 74 | Std. Mean Difference (IV, Random, 95% CI) | 0.26 [‐0.20, 0.72] |
| Analysis 3.2  Comparison 3 Work‐directed plus clinical versus work‐directed (medium term), Outcome 2 Depressive symptoms. | ||||
| 2.1 Collaborative care vs. CAU | 1 | 74 | Std. Mean Difference (IV, Random, 95% CI) | 0.26 [‐0.20, 0.72] |
| Outcome or subgroup title | No. of studies | No. of participants | Statistical method | Effect size |
| 1 Days of sickness absence Show forest plot | 1 | 75 | Std. Mean Difference (IV, Random, 95% CI) | 0.45 [‐0.00, 0.91] |
| Analysis 4.1  Comparison 4 Any work‐directed versus alternative work‐directed, Outcome 1 Days of sickness absence. | ||||
| 1.1 RTW‐E vs. CAU | 1 | 75 | Std. Mean Difference (IV, Random, 95% CI) | 0.45 [‐0.00, 0.91] |
| 2 Depressive symptoms Show forest plot | 1 | 40 | Std. Mean Difference (IV, Random, 95% CI) | ‐0.18 [‐0.84, 0.49] |
| Analysis 4.2  Comparison 4 Any work‐directed versus alternative work‐directed, Outcome 2 Depressive symptoms. | ||||
| 2.1 RTW‐E vs. CAU | 1 | 40 | Std. Mean Difference (IV, Random, 95% CI) | ‐0.18 [‐0.84, 0.49] |
| Outcome or subgroup title | No. of studies | No. of participants | Statistical method | Effect size |
| 1 Days of sickness absence Show forest plot | 5 | Std. Mean Difference (IV, Fixed, 95% CI) | Totals not selected | |
| Analysis 5.1 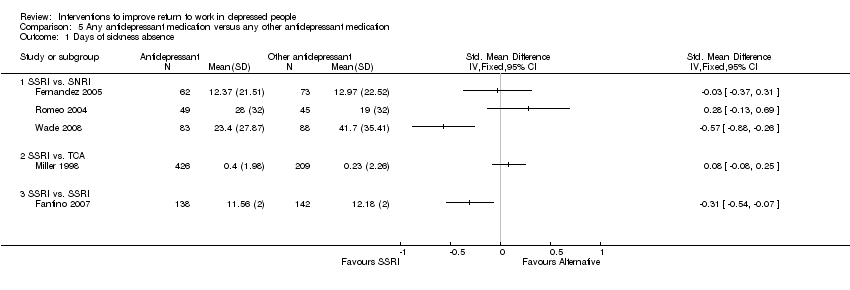 Comparison 5 Any antidepressant medication versus any other antidepressant medication, Outcome 1 Days of sickness absence. | ||||
| 1.1 SSRI vs. SNRI | 3 | Std. Mean Difference (IV, Fixed, 95% CI) | 0.0 [0.0, 0.0] | |
| 1.2 SSRI vs. TCA | 1 | Std. Mean Difference (IV, Fixed, 95% CI) | 0.0 [0.0, 0.0] | |
| 1.3 SSRI vs. SSRI | 1 | Std. Mean Difference (IV, Fixed, 95% CI) | 0.0 [0.0, 0.0] | |
| 2 Depressive symptoms Show forest plot | 5 | 1514 | Std. Mean Difference (IV, Random, 95% CI) | 0.07 [‐0.34, 0.48] |
| Analysis 5.2  Comparison 5 Any antidepressant medication versus any other antidepressant medication, Outcome 2 Depressive symptoms. | ||||
| 2.1 SSRI vs. SNRI | 3 | 599 | Std. Mean Difference (IV, Random, 95% CI) | 0.18 [‐0.37, 0.73] |
| 2.2 SSRI vs. TCA | 1 | 635 | Std. Mean Difference (IV, Random, 95% CI) | 0.0 [0.0, 0.0] |
| 2.3 SSRI vs. SSRI | 1 | 280 | Std. Mean Difference (IV, Random, 95% CI) | ‐0.23 [‐0.47, 0.00] |
| 3 Work functioning Show forest plot | 1 | 635 | Mean Difference (IV, Random, 95% CI) | ‐0.05 [‐0.16, 0.06] |
| Analysis 5.3  Comparison 5 Any antidepressant medication versus any other antidepressant medication, Outcome 3 Work functioning. | ||||
| 3.1 SSRI vs. TCA | 1 | 635 | Mean Difference (IV, Random, 95% CI) | ‐0.05 [‐0.16, 0.06] |
| Outcome or subgroup title | No. of studies | No. of participants | Statistical method | Effect size |
| 1 Days of sickness absence Show forest plot | 1 | 61 | Std. Mean Difference (IV, Random, 95% CI) | 0.48 [‐0.05, 1.00] |
| Analysis 6.1  Comparison 6 Any antidepressant medication versus placebo, Outcome 1 Days of sickness absence. | ||||
| 1.1 TCA or MAO vs. placebo | 1 | 61 | Std. Mean Difference (IV, Random, 95% CI) | 0.48 [‐0.05, 1.00] |
| 2 Work functioning Show forest plot | 1 | 61 | Std. Mean Difference (IV, Random, 95% CI) | ‐0.58 [‐1.11, ‐0.05] |
| Analysis 6.2  Comparison 6 Any antidepressant medication versus placebo, Outcome 2 Work functioning. | ||||
| 2.1 TCA or MAO vs. placebo | 1 | 61 | Std. Mean Difference (IV, Random, 95% CI) | ‐0.58 [‐1.11, ‐0.05] |
| Outcome or subgroup title | No. of studies | No. of participants | Statistical method | Effect size |
| 1 Days of sickness absence Show forest plot | 1 | Std. Mean Difference (IV, Random, 95% CI) | Totals not selected | |
| Analysis 7.1  Comparison 7 Any psychological versus other psychological (medium term), Outcome 1 Days of sickness absence. | ||||
| 1.1 Short‐term psychodynamic therapy vs. solution‐focused therapy | 1 | Std. Mean Difference (IV, Random, 95% CI) | 0.0 [0.0, 0.0] | |
| 1.2 Long‐term psychodynamic therapy vs. solution‐focused therapy | 1 | Std. Mean Difference (IV, Random, 95% CI) | 0.0 [0.0, 0.0] | |
| 2 Depressive symptoms Show forest plot | 1 | Std. Mean Difference (IV, Random, 95% CI) | Totals not selected | |
| Analysis 7.2  Comparison 7 Any psychological versus other psychological (medium term), Outcome 2 Depressive symptoms. | ||||
| 2.1 Short‐term psychodynamic therapy vs. solution‐focused therapy | 1 | Std. Mean Difference (IV, Random, 95% CI) | 0.0 [0.0, 0.0] | |
| 2.2 Long‐term psychodynamic therapy vs. solution‐focused therapy | 1 | Std. Mean Difference (IV, Random, 95% CI) | 0.0 [0.0, 0.0] | |
| 3 Work functioning Show forest plot | 1 | Std. Mean Difference (IV, Random, 95% CI) | Totals not selected | |
| Analysis 7.3  Comparison 7 Any psychological versus other psychological (medium term), Outcome 3 Work functioning. | ||||
| 3.1 Short‐term psychodynamic therapy vs solution‐focused therapy | 1 | Std. Mean Difference (IV, Random, 95% CI) | 0.0 [0.0, 0.0] | |
| 3.2 Long‐term psychodynamic therapy vs solution‐focused therapy | 1 | Std. Mean Difference (IV, Random, 95% CI) | 0.0 [0.0, 0.0] | |
| Outcome or subgroup title | No. of studies | No. of participants | Statistical method | Effect size |
| 1 Days of sickness absence Show forest plot | 1 | Std. Mean Difference (IV, Random, 95% CI) | Subtotals only | |
| Analysis 8.1 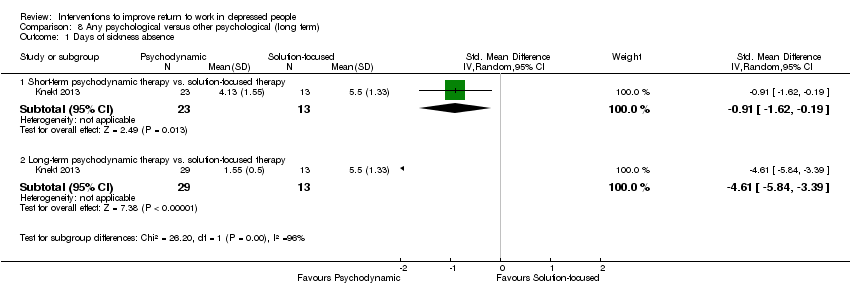 Comparison 8 Any psychological versus other psychological (long term), Outcome 1 Days of sickness absence. | ||||
| 1.1 Short‐term psychodynamic therapy vs. solution‐focused therapy | 1 | 36 | Std. Mean Difference (IV, Random, 95% CI) | ‐0.91 [‐1.62, ‐0.19] |
| 1.2 Long‐term psychodynamic therapy vs. solution‐focused therapy | 1 | 42 | Std. Mean Difference (IV, Random, 95% CI) | ‐4.61 [‐5.84, ‐3.39] |
| 2 Depressive symptoms Show forest plot | 1 | 263 | Std. Mean Difference (IV, Random, 95% CI) | ‐1.85 [‐2.99, ‐0.72] |
| Analysis 8.2  Comparison 8 Any psychological versus other psychological (long term), Outcome 2 Depressive symptoms. | ||||
| 2.1 Short‐term psychodynamic therapy vs. solution‐focused therapy | 1 | 118 | Std. Mean Difference (IV, Random, 95% CI) | ‐1.28 [‐1.69, ‐0.86] |
| 2.2 Long‐term psychodynamic therapy vs. solution‐focused therapy | 1 | 145 | Std. Mean Difference (IV, Random, 95% CI) | ‐2.44 [‐2.90, ‐1.97] |
| 3 Work functioning Show forest plot | 1 | Std. Mean Difference (IV, Random, 95% CI) | Totals not selected | |
| Analysis 8.3  Comparison 8 Any psychological versus other psychological (long term), Outcome 3 Work functioning. | ||||
| 3.1 Short‐term psychodynamic therapy vs. solution‐focused therapy | 1 | Std. Mean Difference (IV, Random, 95% CI) | 0.0 [0.0, 0.0] | |
| 3.2 Long‐term psychodynamic therapy vs. solution‐focused therapy | 1 | Std. Mean Difference (IV, Random, 95% CI) | 0.0 [0.0, 0.0] | |
| Outcome or subgroup title | No. of studies | No. of participants | Statistical method | Effect size |
| 1 Days of sickness absence Show forest plot | 4 | Std. Mean Difference (IV, Random, 95% CI) | Subtotals only | |
| Analysis 9.1  Comparison 9 Any psychological versus no intervention or care as usual, Outcome 1 Days of sickness absence. | ||||
| 1.1 Online/telephone CBT vs. CAU | 3 | 326 | Std. Mean Difference (IV, Random, 95% CI) | ‐0.23 [‐0.45, ‐0.01] |
| 1.2 CMHN vs. usual GP care | 1 | 59 | Std. Mean Difference (IV, Random, 95% CI) | 0.22 [‐0.36, 0.79] |
| 2 Depressive symptoms Show forest plot | 4 | Std. Mean Difference (IV, Random, 95% CI) | Subtotals only | |
| Analysis 9.2  Comparison 9 Any psychological versus no intervention or care as usual, Outcome 2 Depressive symptoms. | ||||
| 2.1 Online/telephone CBT vs. CAU | 3 | 408 | Std. Mean Difference (IV, Random, 95% CI) | ‐0.56 [‐0.76, ‐0.36] |
| 2.2 CMHN vs. usual GP care | 1 | 78 | Std. Mean Difference (IV, Random, 95% CI) | 0.22 [‐0.31, 0.75] |
| Outcome or subgroup title | No. of studies | No. of participants | Statistical method | Effect size |
| 1 Days of sickness absence Show forest plot | 1 | 57 | Std. Mean Difference (IV, Random, 95% CI) | ‐0.71 [‐1.25, ‐0.17] |
| Analysis 10.1  Comparison 10 Psychological combined with antidepressant medication versus antidepressant medication alone, Outcome 1 Days of sickness absence. | ||||
| 1.1 Psychodynamic therapy plus TCA vs. TCA | 1 | 57 | Std. Mean Difference (IV, Random, 95% CI) | ‐0.71 [‐1.25, ‐0.17] |
| 2 Work functioning or productivity Show forest plot | 1 | 57 | Std. Mean Difference (IV, Random, 95% CI) | ‐0.49 [‐1.02, 0.04] |
| Analysis 10.2  Comparison 10 Psychological combined with antidepressant medication versus antidepressant medication alone, Outcome 2 Work functioning or productivity. | ||||
| 2.1 Psychodynamic therapy plus TCA vs. TCA | 1 | 57 | Std. Mean Difference (IV, Random, 95% CI) | ‐0.49 [‐1.02, 0.04] |
| 3 Depressive symptoms Show forest plot | 1 | 74 | Std. Mean Difference (IV, Random, 95% CI) | ‐0.11 [‐0.57, 0.35] |
| Analysis 10.3  Comparison 10 Psychological combined with antidepressant medication versus antidepressant medication alone, Outcome 3 Depressive symptoms. | ||||
| Outcome or subgroup title | No. of studies | No. of participants | Statistical method | Effect size |
| 1 Days of sickness absence Show forest plot | 3 | Std. Mean Difference (IV, Random, 95% CI) | Subtotals only | |
| Analysis 11.1  Comparison 11 Psychological combined with antidepressant medication versus no intervention or usual care (medium term), Outcome 1 Days of sickness absence. | ||||
| 1.1 Enhanced primary care vs. CAU | 2 | 969 | Std. Mean Difference (IV, Random, 95% CI) | ‐0.02 [‐0.15, 0.12] |
| 1.2 Telephone outreach and care management program vs. CAU | 1 | 604 | Std. Mean Difference (IV, Random, 95% CI) | ‐0.21 [‐0.37, ‐0.05] |
| 2 Employment status Show forest plot | 1 | 1356 | Risk Ratio (M‐H, Random, 95% CI) | 1.08 [0.99, 1.18] |
| Analysis 11.2  Comparison 11 Psychological combined with antidepressant medication versus no intervention or usual care (medium term), Outcome 2 Employment status. | ||||
| 2.1 Enhanced primary care vs. CAU | 1 | 1356 | Risk Ratio (M‐H, Random, 95% CI) | 1.08 [0.99, 1.18] |
| 3 Depressive symptoms Show forest plot | 2 | 693 | Std. Mean Difference (IV, Random, 95% CI) | ‐0.22 [‐0.37, ‐0.07] |
| Analysis 11.3  Comparison 11 Psychological combined with antidepressant medication versus no intervention or usual care (medium term), Outcome 3 Depressive symptoms. | ||||
| 3.1 Enhanced primary care vs. CAU | 1 | 89 | Std. Mean Difference (IV, Random, 95% CI) | ‐0.14 [‐0.56, 0.28] |
| 3.2 Telephone outreach and care management program vs. CAU | 1 | 604 | Std. Mean Difference (IV, Random, 95% CI) | ‐0.23 [‐0.39, ‐0.07] |
| 4 Depressed yes/no Show forest plot | 1 | 1356 | Risk Ratio (M‐H, Random, 95% CI) | 0.89 [0.81, 0.98] |
| Analysis 11.4  Comparison 11 Psychological combined with antidepressant medication versus no intervention or usual care (medium term), Outcome 4 Depressed yes/no. | ||||
| 4.1 Enhanced primary care vs. CAU | 1 | 1356 | Risk Ratio (M‐H, Random, 95% CI) | 0.89 [0.81, 0.98] |
| 5 Work functioning Show forest plot | 1 | 604 | Std. Mean Difference (IV, Random, 95% CI) | 0.50 [0.34, 0.66] |
| Analysis 11.5  Comparison 11 Psychological combined with antidepressant medication versus no intervention or usual care (medium term), Outcome 5 Work functioning. | ||||
| 5.1 Telephone outreach and care management program vs. CAU | 1 | 604 | Std. Mean Difference (IV, Random, 95% CI) | 0.50 [0.34, 0.66] |
| Outcome or subgroup title | No. of studies | No. of participants | Statistical method | Effect size |
| 1 Days of sickness absence Show forest plot | 2 | Std. Mean Difference (IV, Random, 95% CI) | Subtotals only | |
| Analysis 12.1  Comparison 12 Exercise intervention versus no intervention or care as usual, Outcome 1 Days of sickness absence. | ||||
| 1.1 Supervised strength training vs. relaxation | 1 | 65 | Std. Mean Difference (IV, Random, 95% CI) | ‐1.11 [‐1.68, ‐0.54] |
| 1.2 Aerobic exercise vs. relaxation/stretching | 2 | 180 | Std. Mean Difference (IV, Random, 95% CI) | ‐0.06 [‐0.36, 0.24] |
| 2 Depressive symptoms Show forest plot | 2 | Std. Mean Difference (IV, Random, 95% CI) | Subtotals only | |
| Analysis 12.2  Comparison 12 Exercise intervention versus no intervention or care as usual, Outcome 2 Depressive symptoms. | ||||
| 2.1 Supervised strength training vs. relaxation | 1 | 65 | Std. Mean Difference (IV, Random, 95% CI) | 0.15 [‐0.39, 0.68] |
| 2.2 Aerobic exercise vs. relaxation/stretching | 2 | 180 | Std. Mean Difference (IV, Random, 95% CI) | 0.18 [‐0.12, 0.48] |

PRISMA Study flow diagram of the study selection process.

Risk of bias graph: review authors' judgements about each risk of bias item presented as percentages across all included studies.

Risk of bias summary: review authors' judgements about each risk of bias item for each included study.

Forest plot of comparison: 1 Work‐directed plus clinical versus clinical alone (medium term), outcome: 1.1 Days of sickness absence.
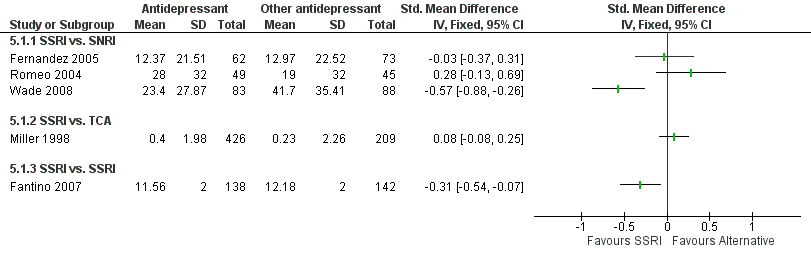
Forest plot of comparison: 5 Any antidepressant medication versus any other antidepressant medication, outcome: 5.1 Days of sickness absence.

Forest plot of comparison: 9 Any psychological versus no intervention or care as usual, outcome: 9.1 Days of sickness absence.

Comparison 1 Work‐directed plus clinical versus clinical alone (medium term), Outcome 1 Days of sickness absence.

Comparison 1 Work‐directed plus clinical versus clinical alone (medium term), Outcome 2 Depressive symptoms.

Comparison 1 Work‐directed plus clinical versus clinical alone (medium term), Outcome 3 Work functioning.

Comparison 2 Work‐directed plus clinical versus clinical alone (long term), Outcome 1 Days of sickness absence.

Comparison 2 Work‐directed plus clinical versus clinical alone (long term), Outcome 2 Depressive symptoms.

Comparison 2 Work‐directed plus clinical versus clinical alone (long term), Outcome 3 Work functioning.

Comparison 3 Work‐directed plus clinical versus work‐directed (medium term), Outcome 1 Days of sickness absence.

Comparison 3 Work‐directed plus clinical versus work‐directed (medium term), Outcome 2 Depressive symptoms.

Comparison 4 Any work‐directed versus alternative work‐directed, Outcome 1 Days of sickness absence.
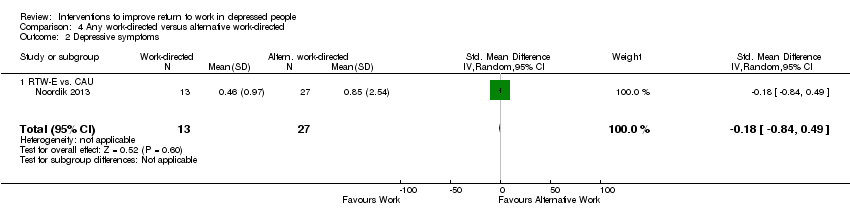
Comparison 4 Any work‐directed versus alternative work‐directed, Outcome 2 Depressive symptoms.

Comparison 5 Any antidepressant medication versus any other antidepressant medication, Outcome 1 Days of sickness absence.

Comparison 5 Any antidepressant medication versus any other antidepressant medication, Outcome 2 Depressive symptoms.

Comparison 5 Any antidepressant medication versus any other antidepressant medication, Outcome 3 Work functioning.

Comparison 6 Any antidepressant medication versus placebo, Outcome 1 Days of sickness absence.

Comparison 6 Any antidepressant medication versus placebo, Outcome 2 Work functioning.

Comparison 7 Any psychological versus other psychological (medium term), Outcome 1 Days of sickness absence.

Comparison 7 Any psychological versus other psychological (medium term), Outcome 2 Depressive symptoms.

Comparison 7 Any psychological versus other psychological (medium term), Outcome 3 Work functioning.

Comparison 8 Any psychological versus other psychological (long term), Outcome 1 Days of sickness absence.

Comparison 8 Any psychological versus other psychological (long term), Outcome 2 Depressive symptoms.
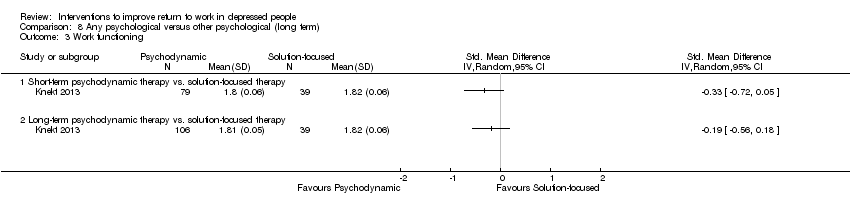
Comparison 8 Any psychological versus other psychological (long term), Outcome 3 Work functioning.

Comparison 9 Any psychological versus no intervention or care as usual, Outcome 1 Days of sickness absence.

Comparison 9 Any psychological versus no intervention or care as usual, Outcome 2 Depressive symptoms.

Comparison 10 Psychological combined with antidepressant medication versus antidepressant medication alone, Outcome 1 Days of sickness absence.
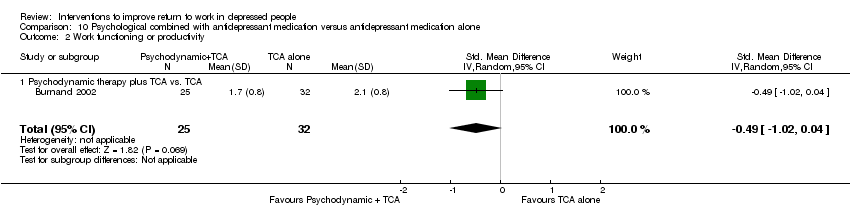
Comparison 10 Psychological combined with antidepressant medication versus antidepressant medication alone, Outcome 2 Work functioning or productivity.
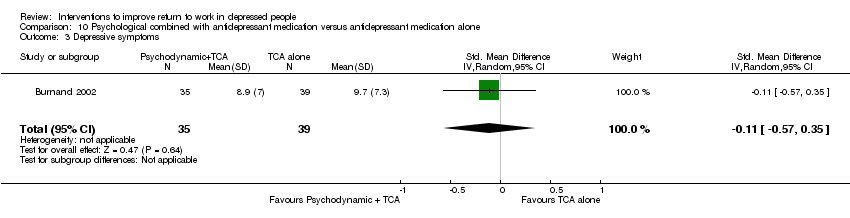
Comparison 10 Psychological combined with antidepressant medication versus antidepressant medication alone, Outcome 3 Depressive symptoms.

Comparison 11 Psychological combined with antidepressant medication versus no intervention or usual care (medium term), Outcome 1 Days of sickness absence.

Comparison 11 Psychological combined with antidepressant medication versus no intervention or usual care (medium term), Outcome 2 Employment status.
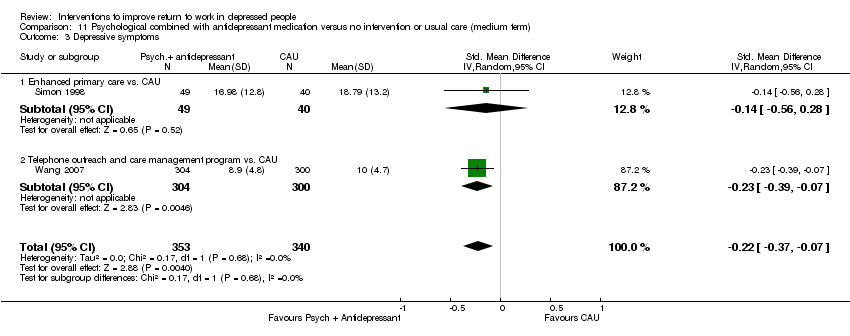
Comparison 11 Psychological combined with antidepressant medication versus no intervention or usual care (medium term), Outcome 3 Depressive symptoms.

Comparison 11 Psychological combined with antidepressant medication versus no intervention or usual care (medium term), Outcome 4 Depressed yes/no.

Comparison 11 Psychological combined with antidepressant medication versus no intervention or usual care (medium term), Outcome 5 Work functioning.
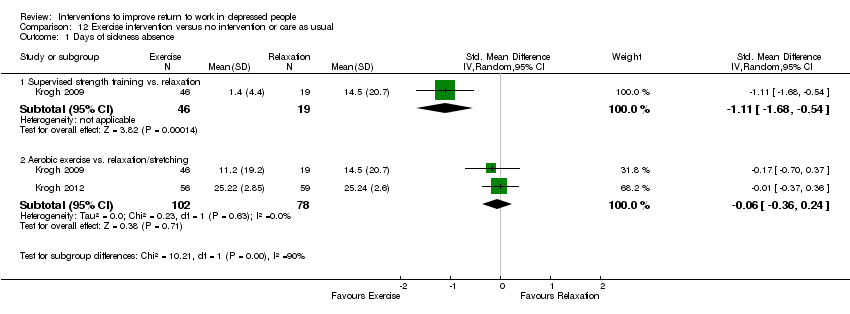
Comparison 12 Exercise intervention versus no intervention or care as usual, Outcome 1 Days of sickness absence.

Comparison 12 Exercise intervention versus no intervention or care as usual, Outcome 2 Depressive symptoms.
| Work‐directed intervention plus clinical intervention compared to clinical intervention alone for depressive disorder | ||||||
| Patient or population: Persons with depressive disorder | ||||||
| Outcomes | Illustrative comparative risks* (95% CI) | Relative effect | No of participants | Quality of the evidence | Comments | |
| Assumed risk | Corresponding risk | |||||
| Clinical intervention | Work‐directed intervention plus clinical intervention | |||||
| Days of sickness absence | The mean days of sickness absence in the intervention groups was | SMD ‐0.4 (‐0.66 to ‐0.14) | 251 | ⊕⊕⊕⊝ | A standard deviation of 0.5 represents a moderate difference between groups | |
| *The basis for the assumed risk (e.g. the median control group risk across studies) is provided in footnotes. The corresponding risk (and its 95% confidence interval) is based on the assumed risk in the comparison group and the relative effect of the intervention (and its 95% CI). | ||||||
| Intervention description: In two studies, an occupational therapy program focusing on work reintegration, combining modified work and supportive interventions was added to clinical care. In one study a regular Employee Assistance program was expanded and incorporated work coaching and modification. GRADE Working Group grades of evidence | ||||||
| 1 Downgraded one level because N < 400 | ||||||
| Any psychological intervention versus no intervention or care as usual for depressive disorder | ||||||
| Patient or population: Persons with depressive disorder | ||||||
| Outcomes | Illustrative comparative risks* (95% CI) | Relative effect | No of participants | Quality of the evidence | Comments | |
| Assumed risk | Corresponding risk | |||||
| Care As Usual (CAU) | Any psychological intervention | |||||
| Days of sickness absence | The mean days of sickness absence in the intervention groups was | SMD ‐0.23 (‐0.45 to ‐0.01) | 326 | ⊕⊕⊕⊝ | A standard deviation of 0.2 represents a small difference between groups | |
| *The basis for the assumed risk (e.g. the median control group risk across studies) is provided in footnotes. The corresponding risk (and its 95% confidence interval) is based on the assumed risk in the comparison group and the relative effect of the intervention (and its 95% CI). | ||||||
| Intervention description All three interventions were cognitive‐behavioral therapy, one by telephone and two online. Each of the interventions were interactive, with therapists or specialised nurses providing feedback. GRADE Working Group grades of evidence | ||||||
| 1 Downgraded one level because N < 400 | ||||||
| Psychological intervention combined with antidepressant medication versus no intervention or usual care for depressive disorder | ||||||
| Patient or population: Persons with depressive disorders | ||||||
| Outcomes | Illustrative comparative risks* (95% CI) | Relative effect | No of participants | Quality of the evidence | Comments | |
| Assumed risk | Corresponding risk | |||||
| Care As Usual (CAU) | Psychological intervention combined with antidepressant medication | |||||
| Days of sickness absence ‐ Enhanced primary care versus CAU | The mean days of sickness absence in the intervention groups was | SMD ‐0.02 (‐0.15 to 0.12) | 969 | ⊕⊕⊝⊝ | A standard deviation of 0.2 represents a small difference between groups | |
| Days of sickness absence ‐ Telephone outreach and care management program versus CAU | The mean days of sickness absence in the intervention groups was | SMD ‐0.21 (‐0.37 to ‐0.05) | 604 | ⊕⊕⊕⊕ | A standard deviation of 0.2 represents a small difference between groups | |
| *The basis for the assumed risk (e.g. the median control group risk across studies) is provided in footnotes. The corresponding risk (and its 95% confidence interval) is based on the assumed risk in the comparison group and the relative effect of the intervention (and its 95% CI). | ||||||
| Intervention description Enhanced primary care General practitioners were enrolled in a quality improvement program and were expected to provide enhanced care including antidepressant medication and psychological interventions, according to primary care guidelines. Telephone outreach and care management This program systematically assessed needs for treatment, facilitated entry into in‐person treatment (both psychotherapy and antidepressant medication), monitored and supported treatment adherence, and (for those declining in‐person treatment) provided a structured psychotherapy intervention by telephone. GRADE Working Group grades of evidence | ||||||
| 1 Downgraded with one level because all studies were of low quality | ||||||
| Comparison | Studies in comparison | Risk of Bias | Inconsistency | Indirectness | Imprecision | Publication bias | Quality of the evidence |
| Work‐directed | |||||||
| Work‐directed + clinical intervention versus clinical (medium) | No: Majority low risk of bias | No: I² < 50% | No | Yes: N < ‐400 Downgrade: ‐1 | Undetected | Moderate | |
| Work‐directed + clinical intervention versus clinical (long) | No: Majority low risk of bias | No: I² < 50% | No | Yes: N < ‐400 Downgrade: ‐1 | Undetected | Moderate | |
| Work‐directed + clinical versus work‐directed | No: study with low risk of bias | N.a. | No | Yes: Single study Downgrade: ‐1 | Undetected | Moderate | |
| Work‐directed versus work‐directed | Yes: very serious Downgrade ‐2 | N.a. | No | Yes: wide CI Downgrade: ‐1 | Undetected | Very low | |
| Clinical, medication | |||||||
| Medication: SSRI versus SNRI | Fernandez: low Romeo: high Wade: high | Yes: 83%, pooling not feasible | No | Yes: Single studies Downgrade: ‐1 | Undetected | Fernandez: moderate Romeo: Low Wade: Low | |
| SSRI versus TCA | Yes: very serious Downgrade ‐2 | N.a. | No | No | Undetected | Low | |
| SSRI versus SSRI | No: study with low risk of bias | N.a. | No | Yes: N< ‐400 Downgrade: ‐1 | Undetected | Moderate | |
| TCA or MAO versus placebo | Yes: very serious Downgrade ‐2 | N.a. | No | Yes: N < ‐400 Downgrade: ‐1 | Undetected | Very low | |
| Clinical, psychological | |||||||
| Any psych versus other psych (medium) | Knekt 2013 (three arms) | Yes: serious Downgrade ‐1 | Yes: 99% pooling not feasible | No | Yes: single study arms Downgrade ‐1 | Undetected | Knekt I: Low Knekt II: Low |
| Any psych versus other psych (medium) | Knekt 2013 (three arms) | Yes: serious Downgrade ‐1 | Yes: 99% pooling not feasible | No | Yes: single study arms Downgrade ‐1 | Undetected | Knekt I: Low Knekt II: Low |
| Any psych versus CAU | No: Majority low risk of bias | No: I² < 50% | No | Yes: N < ‐400 Downgrade: ‐1 | Undetected | Moderate | |
| CMHN versus CAU | Kendrick 2005 (three arms) | Yes: serious Downgrade ‐1 | No: I² < 50% | No | Yes: wide CI Downgrade: ‐1 | Undetected | Low |
| Clinical, psychological and medication | |||||||
| Psych + med versus medicine | Yes: very serious Downgrade ‐2 | N.a. | No | Yes: N < ‐400 Downgrade: ‐1 | Undetected | Very low | |
| Enhanced primary care versus CAU | Yes: very serious Downgrade ‐2 | No: I² < 50% | No | No | Undetected | Low | |
| Telephone outreach versus CAU | No: study with low risk of bias | N.a. | No | No (n > 400 * CI not wide) | Undetected | High | |
| Clinical, exercise | |||||||
| Strength versus relax | Yes: serious Downgrade ‐1 | N.a. | No | Yes: N < ‐400 Downgrade: ‐1 | Undetected | Low | |
| Aerobic versus relax or stretching | No: Majority low risk of bias | No: I² < 50% | No | Yes: N < ‐400 Downgrade: ‐1 | Undetected | Moderate |
| Outcome or subgroup title | No. of studies | No. of participants | Statistical method | Effect size |
| 1 Days of sickness absence Show forest plot | 3 | 251 | Std. Mean Difference (IV, Random, 95% CI) | ‐0.40 [‐0.66, ‐0.14] |
| 1.1 Occupational therapy plus CAU vs. CAU | 2 | 179 | Std. Mean Difference (IV, Random, 95% CI) | ‐0.30 [‐0.61, 0.01] |
| 1.2 Multi‐component work‐focused program vs. CAU | 1 | 72 | Std. Mean Difference (IV, Random, 95% CI) | ‐0.66 [‐1.15, ‐0.16] |
| 2 Depressive symptoms Show forest plot | 3 | 251 | Std. Mean Difference (IV, Random, 95% CI) | ‐0.32 [‐0.88, 0.25] |
| 2.1 Occupational therapy plus CAU vs. CAU | 2 | 179 | Std. Mean Difference (IV, Random, 95% CI) | ‐0.08 [‐0.66, 0.50] |
| 2.2 Multi‐component work‐focused program vs. CAU | 1 | 72 | Std. Mean Difference (IV, Random, 95% CI) | ‐0.84 [‐1.34, ‐0.33] |
| 3 Work functioning Show forest plot | 2 | 189 | Std. Mean Difference (IV, Random, 95% CI) | ‐0.31 [‐0.79, 0.16] |
| 3.1 Occupational therapy plus CAU vs. CAU | 1 | 117 | Std. Mean Difference (IV, Random, 95% CI) | ‐0.09 [‐0.48, 0.29] |
| 3.2 Multi‐component work‐focused program vs. CAU | 1 | 72 | Std. Mean Difference (IV, Random, 95% CI) | ‐0.58 [‐1.08, ‐0.09] |
| Outcome or subgroup title | No. of studies | No. of participants | Statistical method | Effect size |
| 1 Days of sickness absence Show forest plot | 2 | 179 | Std. Mean Difference (IV, Random, 95% CI) | ‐0.19 [‐0.49, 0.12] |
| 1.1 Occupational therapy plus CAU vs. CAU | 2 | 179 | Std. Mean Difference (IV, Random, 95% CI) | ‐0.19 [‐0.49, 0.12] |
| 2 Depressive symptoms Show forest plot | 1 | 117 | Std. Mean Difference (IV, Random, 95% CI) | ‐0.63 [‐1.02, ‐0.24] |
| 2.1 Occupational therapy plus CAU vs. CAU | 1 | 117 | Std. Mean Difference (IV, Random, 95% CI) | ‐0.63 [‐1.02, ‐0.24] |
| 3 Work functioning Show forest plot | 1 | 117 | Std. Mean Difference (IV, Random, 95% CI) | ‐0.25 [‐0.63, 0.14] |
| 3.1 Occupational therapy plus CAU vs. CAU | 1 | 117 | Std. Mean Difference (IV, Random, 95% CI) | ‐0.25 [‐0.63, 0.14] |
| Outcome or subgroup title | No. of studies | No. of participants | Statistical method | Effect size |
| 1 Days of sickness absence Show forest plot | 1 | 126 | Std. Mean Difference (IV, Random, 95% CI) | ‐0.14 [‐0.49, 0.21] |
| 1.1 Collaborative care vs. CAU | 1 | 126 | Std. Mean Difference (IV, Random, 95% CI) | ‐0.14 [‐0.49, 0.21] |
| 2 Depressive symptoms Show forest plot | 1 | 74 | Std. Mean Difference (IV, Random, 95% CI) | 0.26 [‐0.20, 0.72] |
| 2.1 Collaborative care vs. CAU | 1 | 74 | Std. Mean Difference (IV, Random, 95% CI) | 0.26 [‐0.20, 0.72] |
| Outcome or subgroup title | No. of studies | No. of participants | Statistical method | Effect size |
| 1 Days of sickness absence Show forest plot | 1 | 75 | Std. Mean Difference (IV, Random, 95% CI) | 0.45 [‐0.00, 0.91] |
| 1.1 RTW‐E vs. CAU | 1 | 75 | Std. Mean Difference (IV, Random, 95% CI) | 0.45 [‐0.00, 0.91] |
| 2 Depressive symptoms Show forest plot | 1 | 40 | Std. Mean Difference (IV, Random, 95% CI) | ‐0.18 [‐0.84, 0.49] |
| 2.1 RTW‐E vs. CAU | 1 | 40 | Std. Mean Difference (IV, Random, 95% CI) | ‐0.18 [‐0.84, 0.49] |
| Outcome or subgroup title | No. of studies | No. of participants | Statistical method | Effect size |
| 1 Days of sickness absence Show forest plot | 5 | Std. Mean Difference (IV, Fixed, 95% CI) | Totals not selected | |
| 1.1 SSRI vs. SNRI | 3 | Std. Mean Difference (IV, Fixed, 95% CI) | 0.0 [0.0, 0.0] | |
| 1.2 SSRI vs. TCA | 1 | Std. Mean Difference (IV, Fixed, 95% CI) | 0.0 [0.0, 0.0] | |
| 1.3 SSRI vs. SSRI | 1 | Std. Mean Difference (IV, Fixed, 95% CI) | 0.0 [0.0, 0.0] | |
| 2 Depressive symptoms Show forest plot | 5 | 1514 | Std. Mean Difference (IV, Random, 95% CI) | 0.07 [‐0.34, 0.48] |
| 2.1 SSRI vs. SNRI | 3 | 599 | Std. Mean Difference (IV, Random, 95% CI) | 0.18 [‐0.37, 0.73] |
| 2.2 SSRI vs. TCA | 1 | 635 | Std. Mean Difference (IV, Random, 95% CI) | 0.0 [0.0, 0.0] |
| 2.3 SSRI vs. SSRI | 1 | 280 | Std. Mean Difference (IV, Random, 95% CI) | ‐0.23 [‐0.47, 0.00] |
| 3 Work functioning Show forest plot | 1 | 635 | Mean Difference (IV, Random, 95% CI) | ‐0.05 [‐0.16, 0.06] |
| 3.1 SSRI vs. TCA | 1 | 635 | Mean Difference (IV, Random, 95% CI) | ‐0.05 [‐0.16, 0.06] |
| Outcome or subgroup title | No. of studies | No. of participants | Statistical method | Effect size |
| 1 Days of sickness absence Show forest plot | 1 | 61 | Std. Mean Difference (IV, Random, 95% CI) | 0.48 [‐0.05, 1.00] |
| 1.1 TCA or MAO vs. placebo | 1 | 61 | Std. Mean Difference (IV, Random, 95% CI) | 0.48 [‐0.05, 1.00] |
| 2 Work functioning Show forest plot | 1 | 61 | Std. Mean Difference (IV, Random, 95% CI) | ‐0.58 [‐1.11, ‐0.05] |
| 2.1 TCA or MAO vs. placebo | 1 | 61 | Std. Mean Difference (IV, Random, 95% CI) | ‐0.58 [‐1.11, ‐0.05] |
| Outcome or subgroup title | No. of studies | No. of participants | Statistical method | Effect size |
| 1 Days of sickness absence Show forest plot | 1 | Std. Mean Difference (IV, Random, 95% CI) | Totals not selected | |
| 1.1 Short‐term psychodynamic therapy vs. solution‐focused therapy | 1 | Std. Mean Difference (IV, Random, 95% CI) | 0.0 [0.0, 0.0] | |
| 1.2 Long‐term psychodynamic therapy vs. solution‐focused therapy | 1 | Std. Mean Difference (IV, Random, 95% CI) | 0.0 [0.0, 0.0] | |
| 2 Depressive symptoms Show forest plot | 1 | Std. Mean Difference (IV, Random, 95% CI) | Totals not selected | |
| 2.1 Short‐term psychodynamic therapy vs. solution‐focused therapy | 1 | Std. Mean Difference (IV, Random, 95% CI) | 0.0 [0.0, 0.0] | |
| 2.2 Long‐term psychodynamic therapy vs. solution‐focused therapy | 1 | Std. Mean Difference (IV, Random, 95% CI) | 0.0 [0.0, 0.0] | |
| 3 Work functioning Show forest plot | 1 | Std. Mean Difference (IV, Random, 95% CI) | Totals not selected | |
| 3.1 Short‐term psychodynamic therapy vs solution‐focused therapy | 1 | Std. Mean Difference (IV, Random, 95% CI) | 0.0 [0.0, 0.0] | |
| 3.2 Long‐term psychodynamic therapy vs solution‐focused therapy | 1 | Std. Mean Difference (IV, Random, 95% CI) | 0.0 [0.0, 0.0] | |
| Outcome or subgroup title | No. of studies | No. of participants | Statistical method | Effect size |
| 1 Days of sickness absence Show forest plot | 1 | Std. Mean Difference (IV, Random, 95% CI) | Subtotals only | |
| 1.1 Short‐term psychodynamic therapy vs. solution‐focused therapy | 1 | 36 | Std. Mean Difference (IV, Random, 95% CI) | ‐0.91 [‐1.62, ‐0.19] |
| 1.2 Long‐term psychodynamic therapy vs. solution‐focused therapy | 1 | 42 | Std. Mean Difference (IV, Random, 95% CI) | ‐4.61 [‐5.84, ‐3.39] |
| 2 Depressive symptoms Show forest plot | 1 | 263 | Std. Mean Difference (IV, Random, 95% CI) | ‐1.85 [‐2.99, ‐0.72] |
| 2.1 Short‐term psychodynamic therapy vs. solution‐focused therapy | 1 | 118 | Std. Mean Difference (IV, Random, 95% CI) | ‐1.28 [‐1.69, ‐0.86] |
| 2.2 Long‐term psychodynamic therapy vs. solution‐focused therapy | 1 | 145 | Std. Mean Difference (IV, Random, 95% CI) | ‐2.44 [‐2.90, ‐1.97] |
| 3 Work functioning Show forest plot | 1 | Std. Mean Difference (IV, Random, 95% CI) | Totals not selected | |
| 3.1 Short‐term psychodynamic therapy vs. solution‐focused therapy | 1 | Std. Mean Difference (IV, Random, 95% CI) | 0.0 [0.0, 0.0] | |
| 3.2 Long‐term psychodynamic therapy vs. solution‐focused therapy | 1 | Std. Mean Difference (IV, Random, 95% CI) | 0.0 [0.0, 0.0] | |
| Outcome or subgroup title | No. of studies | No. of participants | Statistical method | Effect size |
| 1 Days of sickness absence Show forest plot | 4 | Std. Mean Difference (IV, Random, 95% CI) | Subtotals only | |
| 1.1 Online/telephone CBT vs. CAU | 3 | 326 | Std. Mean Difference (IV, Random, 95% CI) | ‐0.23 [‐0.45, ‐0.01] |
| 1.2 CMHN vs. usual GP care | 1 | 59 | Std. Mean Difference (IV, Random, 95% CI) | 0.22 [‐0.36, 0.79] |
| 2 Depressive symptoms Show forest plot | 4 | Std. Mean Difference (IV, Random, 95% CI) | Subtotals only | |
| 2.1 Online/telephone CBT vs. CAU | 3 | 408 | Std. Mean Difference (IV, Random, 95% CI) | ‐0.56 [‐0.76, ‐0.36] |
| 2.2 CMHN vs. usual GP care | 1 | 78 | Std. Mean Difference (IV, Random, 95% CI) | 0.22 [‐0.31, 0.75] |
| Outcome or subgroup title | No. of studies | No. of participants | Statistical method | Effect size |
| 1 Days of sickness absence Show forest plot | 1 | 57 | Std. Mean Difference (IV, Random, 95% CI) | ‐0.71 [‐1.25, ‐0.17] |
| 1.1 Psychodynamic therapy plus TCA vs. TCA | 1 | 57 | Std. Mean Difference (IV, Random, 95% CI) | ‐0.71 [‐1.25, ‐0.17] |
| 2 Work functioning or productivity Show forest plot | 1 | 57 | Std. Mean Difference (IV, Random, 95% CI) | ‐0.49 [‐1.02, 0.04] |
| 2.1 Psychodynamic therapy plus TCA vs. TCA | 1 | 57 | Std. Mean Difference (IV, Random, 95% CI) | ‐0.49 [‐1.02, 0.04] |
| 3 Depressive symptoms Show forest plot | 1 | 74 | Std. Mean Difference (IV, Random, 95% CI) | ‐0.11 [‐0.57, 0.35] |
| Outcome or subgroup title | No. of studies | No. of participants | Statistical method | Effect size |
| 1 Days of sickness absence Show forest plot | 3 | Std. Mean Difference (IV, Random, 95% CI) | Subtotals only | |
| 1.1 Enhanced primary care vs. CAU | 2 | 969 | Std. Mean Difference (IV, Random, 95% CI) | ‐0.02 [‐0.15, 0.12] |
| 1.2 Telephone outreach and care management program vs. CAU | 1 | 604 | Std. Mean Difference (IV, Random, 95% CI) | ‐0.21 [‐0.37, ‐0.05] |
| 2 Employment status Show forest plot | 1 | 1356 | Risk Ratio (M‐H, Random, 95% CI) | 1.08 [0.99, 1.18] |
| 2.1 Enhanced primary care vs. CAU | 1 | 1356 | Risk Ratio (M‐H, Random, 95% CI) | 1.08 [0.99, 1.18] |
| 3 Depressive symptoms Show forest plot | 2 | 693 | Std. Mean Difference (IV, Random, 95% CI) | ‐0.22 [‐0.37, ‐0.07] |
| 3.1 Enhanced primary care vs. CAU | 1 | 89 | Std. Mean Difference (IV, Random, 95% CI) | ‐0.14 [‐0.56, 0.28] |
| 3.2 Telephone outreach and care management program vs. CAU | 1 | 604 | Std. Mean Difference (IV, Random, 95% CI) | ‐0.23 [‐0.39, ‐0.07] |
| 4 Depressed yes/no Show forest plot | 1 | 1356 | Risk Ratio (M‐H, Random, 95% CI) | 0.89 [0.81, 0.98] |
| 4.1 Enhanced primary care vs. CAU | 1 | 1356 | Risk Ratio (M‐H, Random, 95% CI) | 0.89 [0.81, 0.98] |
| 5 Work functioning Show forest plot | 1 | 604 | Std. Mean Difference (IV, Random, 95% CI) | 0.50 [0.34, 0.66] |
| 5.1 Telephone outreach and care management program vs. CAU | 1 | 604 | Std. Mean Difference (IV, Random, 95% CI) | 0.50 [0.34, 0.66] |
| Outcome or subgroup title | No. of studies | No. of participants | Statistical method | Effect size |
| 1 Days of sickness absence Show forest plot | 2 | Std. Mean Difference (IV, Random, 95% CI) | Subtotals only | |
| 1.1 Supervised strength training vs. relaxation | 1 | 65 | Std. Mean Difference (IV, Random, 95% CI) | ‐1.11 [‐1.68, ‐0.54] |
| 1.2 Aerobic exercise vs. relaxation/stretching | 2 | 180 | Std. Mean Difference (IV, Random, 95% CI) | ‐0.06 [‐0.36, 0.24] |
| 2 Depressive symptoms Show forest plot | 2 | Std. Mean Difference (IV, Random, 95% CI) | Subtotals only | |
| 2.1 Supervised strength training vs. relaxation | 1 | 65 | Std. Mean Difference (IV, Random, 95% CI) | 0.15 [‐0.39, 0.68] |
| 2.2 Aerobic exercise vs. relaxation/stretching | 2 | 180 | Std. Mean Difference (IV, Random, 95% CI) | 0.18 [‐0.12, 0.48] |