Intervenciones para mejorar el retorno al trabajo en pacientes con depresión
Información
- DOI:
- https://doi.org/10.1002/14651858.CD006237.pub3Copiar DOI

- Base de datos:
-
- Cochrane Database of Systematic Reviews
- Versión publicada:
-
- 03 diciembre 2014see what's new
- Tipo:
-
- Intervention
- Etapa:
-
- Review
- Grupo Editorial Cochrane:
-
Grupo Cochrane de Salud laboral
- Copyright:
-
- Copyright © 2014 The Cochrane Collaboration. Published by John Wiley & Sons, Ltd.
Cifras del artículo
Altmetric:
Citado por:
Autores
Contributions of authors
Original review
KN wrote the initial draft of the protocol and will write subsequent drafts of the protocol and review. She and AN designed and conducted the search strategy. AV, UB, CF, AN, and JV contributed to the draft version of the protocol and contributed to subsequent versions and revisions of the protocol and review. KN, AV, and UB included eligible studies. UB and CF conducted the quality assessment of eligible studies. KN and AN extracted the data from the original studies. KN, CF, and JV conducted the data synthesis.
Update 2014
BF adapted the search strategy and conducted the searches. BF, KN, CF, UB, and AV checked resulting studies for eligibility. BF, KN, AN, AV CF, HH, and UB conducted data extraction. BF, KN, AN, AV, CH, HH, UB, and JV assessed included studies for risk of bias. BF, KN, and JV ran the analyses. KN wrote the draft of the updated review and all others commented on this draft. JV acted as an advisor on the whole review process and several specific topics such as meaningful comparisons, GRADE, and meta‐analysis.
Sources of support
Internal sources
-
Coronel Institute of Occupational Health, Netherlands.
Salary for Karen Nieuwenhuijsen and Babs Faber
-
Trimbos Instituut ‐ Netherlands Institute of Mental Health and Addiction, Netherlands.
Salary for Christina van der Feltz‐Cornelis
-
Federal Institute for Occupational Safety and Health, Germany.
Salary for Angela Neumeyer‐Gromen
-
Finnish Institute of Occupational Health, Finland.
Salary for Jos Verbeek
-
University Medical Center Groningen, Netherlands.
Salary for Ute Bültmann
-
Dutch Research Center for Insurance Medicine, Netherlands.
Support and training for authors
External sources
-
KIS programme, Ministry of Social Affairs and Employment, Netherlands.
A small grant to Karen Nieuwenhuijsen to help her finish the first version of this review
Declarations of interest
Karen Nieuwenhuijsen was an author of one of the included studies: Noordik 2013.
Babs Faber: none known.
Jos Verbeek: none known.
Angela Neumeyer‐Gromen: none known.
Hiske Hees was an author of one of the included studies: Hees 2013.
Arco Verhoeven: none known.
Christina van der Feltz‐Cornelis was an author of one of the included studies: Vlasveld 2013. Her employer received an unrestricted grant from Eli Lilly for an investigator‐initiated trial on depression and pain. She also received payment from Benecke for speaking at a symposium on chronic pain. She has received royalties from various publishers on her books on psychiatry.
Ute Bültmann: none known.
None of the authors assessed studies they were authors of for eligibility or risk of bias.
Acknowledgements
We are grateful to José Luis Fernandez, Martin Keller, Tony Kendrick, Paul Knekt, Paul McCrone, Judith Proudfoot, Renee Romeo, Kathryn Rost, Aart Schene, Gregory Simon, Alan Wade, Penny Bee, Clément Francois, Nicholas Moore, and Ken Wells for kindly providing further information about their studies. We thank the CCDAN group for their support with the first version of this review. We thank Janet Wale for copy editing the text of the updated review. To conclude, we are very grateful for the help of the Cochrane Occupational Safety and Health Review Group and Jani Ruotsalainen in particular.
Version history
| Published | Title | Stage | Authors | Version |
| 2020 Oct 14 | Interventions to improve return to work in depressed people | Review | Karen Nieuwenhuijsen, Jos H Verbeek, Angela Neumeyer-Gromen, Arco C Verhoeven, Ute Bültmann, Babs Faber | |
| 2014 Dec 03 | Interventions to improve return to work in depressed people | Review | Karen Nieuwenhuijsen, Babs Faber, Jos H Verbeek, Angela Neumeyer‐Gromen, Hiske L Hees, Arco C Verhoeven, Christina M van der Feltz‐Cornelis, Ute Bültmann | |
| 2008 Apr 23 | Interventions to improve occupational health in depressed people | Review | Karen Nieuwenhuijsen, Ute Bültmann, Angela Neumeyer‐Gromen, Arco C Verhoeven, Jos H Verbeek, Christina M. Feltz‐Cornelis | |
| 2006 Oct 18 | Interventions to improve occupational health in depressed people | Protocol | Karen Nieuwenhuijsen, Arco C Verhoeven, Ute Bültmann, Angela Neumeyer‐Gromen, C M van der Feltz‐Cornelis, Christina M. Feltz‐Cornelis | |
Differences between protocol and review
In order to reflect the latest guidance available in the Cochrane Handbook for Systematic Teviews of Interventions, we used the GRADE approach. In the former version of the protocol and the published review, we used the Downs and Black checklist to assess quality, while in this update we used the Cochrane Collaboration’s risk of bias tool. Also, we no longer formally tested heterogeneity but rather assessed the I² statistic. Furthermore, our search strategy was simplified and we no longer handsearched journals as these were indexed in MEDLINE and did not yield additional studies. Instead of searching the CCDAN registers, we now directly searched CENTRAL.
Keywords
MeSH
Medical Subject Headings (MeSH) Keywords
- *Absenteeism;
- Antidepressive Agents [therapeutic use];
- Bias;
- Cognitive Behavioral Therapy;
- Depression [*therapy];
- Depressive Disorder, Major [*therapy];
- Muscle Stretching Exercises;
- *Occupational Health;
- Randomized Controlled Trials as Topic;
- Return to Work [*psychology];
- Sick Leave;
- Work Performance;
Medical Subject Headings Check Words
Adult; Humans;
PICO

PRISMA Study flow diagram of the study selection process.

Risk of bias graph: review authors' judgements about each risk of bias item presented as percentages across all included studies.

Risk of bias summary: review authors' judgements about each risk of bias item for each included study.

Forest plot of comparison: 1 Work‐directed plus clinical versus clinical alone (medium term), outcome: 1.1 Days of sickness absence.
Forest plot of comparison: 5 Any antidepressant medication versus any other antidepressant medication, outcome: 5.1 Days of sickness absence.

Forest plot of comparison: 9 Any psychological versus no intervention or care as usual, outcome: 9.1 Days of sickness absence.

Comparison 1 Work‐directed plus clinical versus clinical alone (medium term), Outcome 1 Days of sickness absence.

Comparison 1 Work‐directed plus clinical versus clinical alone (medium term), Outcome 2 Depressive symptoms.

Comparison 1 Work‐directed plus clinical versus clinical alone (medium term), Outcome 3 Work functioning.

Comparison 2 Work‐directed plus clinical versus clinical alone (long term), Outcome 1 Days of sickness absence.

Comparison 2 Work‐directed plus clinical versus clinical alone (long term), Outcome 2 Depressive symptoms.

Comparison 2 Work‐directed plus clinical versus clinical alone (long term), Outcome 3 Work functioning.

Comparison 3 Work‐directed plus clinical versus work‐directed (medium term), Outcome 1 Days of sickness absence.

Comparison 3 Work‐directed plus clinical versus work‐directed (medium term), Outcome 2 Depressive symptoms.

Comparison 4 Any work‐directed versus alternative work‐directed, Outcome 1 Days of sickness absence.
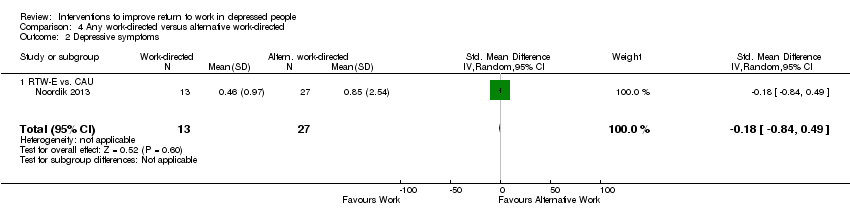
Comparison 4 Any work‐directed versus alternative work‐directed, Outcome 2 Depressive symptoms.

Comparison 5 Any antidepressant medication versus any other antidepressant medication, Outcome 1 Days of sickness absence.

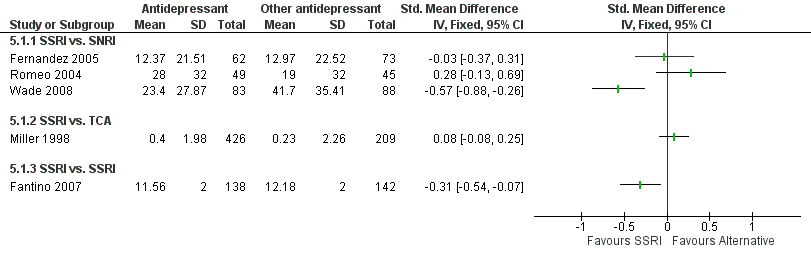
Comparison 5 Any antidepressant medication versus any other antidepressant medication, Outcome 2 Depressive symptoms.

Comparison 5 Any antidepressant medication versus any other antidepressant medication, Outcome 3 Work functioning.

Comparison 6 Any antidepressant medication versus placebo, Outcome 1 Days of sickness absence.

Comparison 6 Any antidepressant medication versus placebo, Outcome 2 Work functioning.

Comparison 7 Any psychological versus other psychological (medium term), Outcome 1 Days of sickness absence.

Comparison 7 Any psychological versus other psychological (medium term), Outcome 2 Depressive symptoms.

Comparison 7 Any psychological versus other psychological (medium term), Outcome 3 Work functioning.

Comparison 8 Any psychological versus other psychological (long term), Outcome 1 Days of sickness absence.

Comparison 8 Any psychological versus other psychological (long term), Outcome 2 Depressive symptoms.
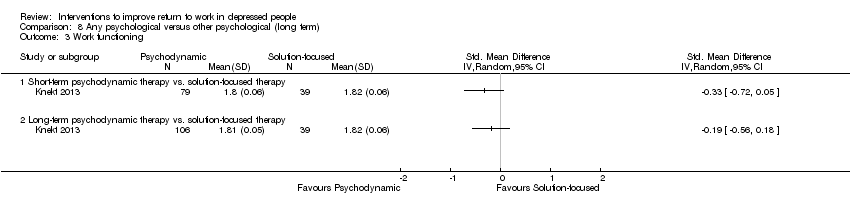
Comparison 8 Any psychological versus other psychological (long term), Outcome 3 Work functioning.

Comparison 9 Any psychological versus no intervention or care as usual, Outcome 1 Days of sickness absence.

Comparison 9 Any psychological versus no intervention or care as usual, Outcome 2 Depressive symptoms.

Comparison 10 Psychological combined with antidepressant medication versus antidepressant medication alone, Outcome 1 Days of sickness absence.
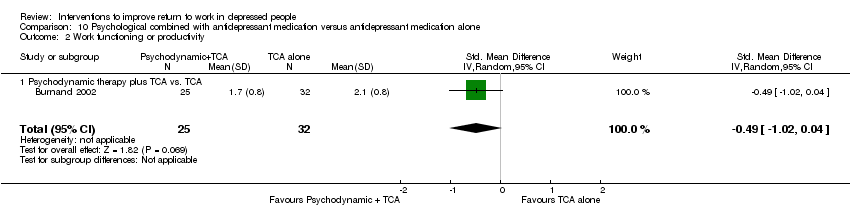
Comparison 10 Psychological combined with antidepressant medication versus antidepressant medication alone, Outcome 2 Work functioning or productivity.
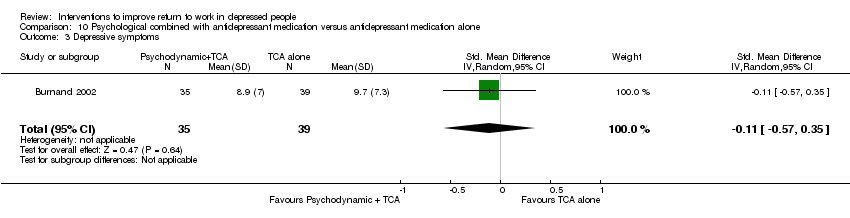
Comparison 10 Psychological combined with antidepressant medication versus antidepressant medication alone, Outcome 3 Depressive symptoms.

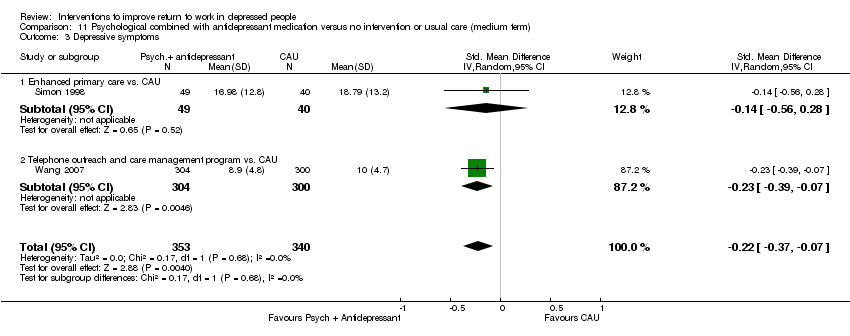
Comparison 11 Psychological combined with antidepressant medication versus no intervention or usual care (medium term), Outcome 1 Days of sickness absence.

Comparison 11 Psychological combined with antidepressant medication versus no intervention or usual care (medium term), Outcome 2 Employment status.
Comparison 11 Psychological combined with antidepressant medication versus no intervention or usual care (medium term), Outcome 3 Depressive symptoms.

Comparison 11 Psychological combined with antidepressant medication versus no intervention or usual care (medium term), Outcome 4 Depressed yes/no.

Comparison 11 Psychological combined with antidepressant medication versus no intervention or usual care (medium term), Outcome 5 Work functioning.
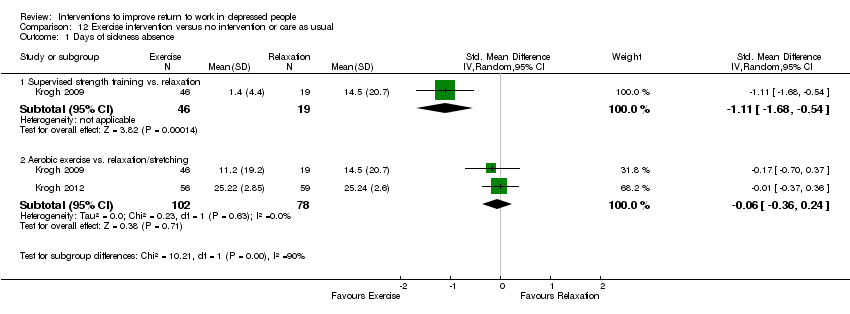
Comparison 12 Exercise intervention versus no intervention or care as usual, Outcome 1 Days of sickness absence.

Comparison 12 Exercise intervention versus no intervention or care as usual, Outcome 2 Depressive symptoms.
| Work‐directed intervention plus clinical intervention compared to clinical intervention alone for depressive disorder | ||||||
| Patient or population: Persons with depressive disorder | ||||||
| Outcomes | Illustrative comparative risks* (95% CI) | Relative effect | No of participants | Quality of the evidence | Comments | |
| Assumed risk | Corresponding risk | |||||
| Clinical intervention | Work‐directed intervention plus clinical intervention | |||||
| Days of sickness absence | The mean days of sickness absence in the intervention groups was | SMD ‐0.4 (‐0.66 to ‐0.14) | 251 | ⊕⊕⊕⊝ | A standard deviation of 0.5 represents a moderate difference between groups | |
| *The basis for the assumed risk (e.g. the median control group risk across studies) is provided in footnotes. The corresponding risk (and its 95% confidence interval) is based on the assumed risk in the comparison group and the relative effect of the intervention (and its 95% CI). | ||||||
| Intervention description: In two studies, an occupational therapy program focusing on work reintegration, combining modified work and supportive interventions was added to clinical care. In one study a regular Employee Assistance program was expanded and incorporated work coaching and modification. GRADE Working Group grades of evidence | ||||||
| 1 Downgraded one level because N < 400 | ||||||
| Any psychological intervention versus no intervention or care as usual for depressive disorder | ||||||
| Patient or population: Persons with depressive disorder | ||||||
| Outcomes | Illustrative comparative risks* (95% CI) | Relative effect | No of participants | Quality of the evidence | Comments | |
| Assumed risk | Corresponding risk | |||||
| Care As Usual (CAU) | Any psychological intervention | |||||
| Days of sickness absence | The mean days of sickness absence in the intervention groups was | SMD ‐0.23 (‐0.45 to ‐0.01) | 326 | ⊕⊕⊕⊝ | A standard deviation of 0.2 represents a small difference between groups | |
| *The basis for the assumed risk (e.g. the median control group risk across studies) is provided in footnotes. The corresponding risk (and its 95% confidence interval) is based on the assumed risk in the comparison group and the relative effect of the intervention (and its 95% CI). | ||||||
| Intervention description All three interventions were cognitive‐behavioral therapy, one by telephone and two online. Each of the interventions were interactive, with therapists or specialised nurses providing feedback. GRADE Working Group grades of evidence | ||||||
| 1 Downgraded one level because N < 400 | ||||||
| Psychological intervention combined with antidepressant medication versus no intervention or usual care for depressive disorder | ||||||
| Patient or population: Persons with depressive disorders | ||||||
| Outcomes | Illustrative comparative risks* (95% CI) | Relative effect | No of participants | Quality of the evidence | Comments | |
| Assumed risk | Corresponding risk | |||||
| Care As Usual (CAU) | Psychological intervention combined with antidepressant medication | |||||
| Days of sickness absence ‐ Enhanced primary care versus CAU | The mean days of sickness absence in the intervention groups was | SMD ‐0.02 (‐0.15 to 0.12) | 969 | ⊕⊕⊝⊝ | A standard deviation of 0.2 represents a small difference between groups | |
| Days of sickness absence ‐ Telephone outreach and care management program versus CAU | The mean days of sickness absence in the intervention groups was | SMD ‐0.21 (‐0.37 to ‐0.05) | 604 | ⊕⊕⊕⊕ | A standard deviation of 0.2 represents a small difference between groups | |
| *The basis for the assumed risk (e.g. the median control group risk across studies) is provided in footnotes. The corresponding risk (and its 95% confidence interval) is based on the assumed risk in the comparison group and the relative effect of the intervention (and its 95% CI). | ||||||
| Intervention description Enhanced primary care General practitioners were enrolled in a quality improvement program and were expected to provide enhanced care including antidepressant medication and psychological interventions, according to primary care guidelines. Telephone outreach and care management This program systematically assessed needs for treatment, facilitated entry into in‐person treatment (both psychotherapy and antidepressant medication), monitored and supported treatment adherence, and (for those declining in‐person treatment) provided a structured psychotherapy intervention by telephone. GRADE Working Group grades of evidence | ||||||
| 1 Downgraded with one level because all studies were of low quality | ||||||
| Comparison | Studies in comparison | Risk of Bias | Inconsistency | Indirectness | Imprecision | Publication bias | Quality of the evidence |
| Work‐directed | |||||||
| Work‐directed + clinical intervention versus clinical (medium) | No: Majority low risk of bias | No: I² < 50% | No | Yes: N < ‐400 Downgrade: ‐1 | Undetected | Moderate | |
| Work‐directed + clinical intervention versus clinical (long) | No: Majority low risk of bias | No: I² < 50% | No | Yes: N < ‐400 Downgrade: ‐1 | Undetected | Moderate | |
| Work‐directed + clinical versus work‐directed | No: study with low risk of bias | N.a. | No | Yes: Single study Downgrade: ‐1 | Undetected | Moderate | |
| Work‐directed versus work‐directed | Yes: very serious Downgrade ‐2 | N.a. | No | Yes: wide CI Downgrade: ‐1 | Undetected | Very low | |
| Clinical, medication | |||||||
| Medication: SSRI versus SNRI | Fernandez: low Romeo: high Wade: high | Yes: 83%, pooling not feasible | No | Yes: Single studies Downgrade: ‐1 | Undetected | Fernandez: moderate Romeo: Low Wade: Low | |
| SSRI versus TCA | Yes: very serious Downgrade ‐2 | N.a. | No | No | Undetected | Low | |
| SSRI versus SSRI | No: study with low risk of bias | N.a. | No | Yes: N< ‐400 Downgrade: ‐1 | Undetected | Moderate | |
| TCA or MAO versus placebo | Yes: very serious Downgrade ‐2 | N.a. | No | Yes: N < ‐400 Downgrade: ‐1 | Undetected | Very low | |
| Clinical, psychological | |||||||
| Any psych versus other psych (medium) | Knekt 2013 (three arms) | Yes: serious Downgrade ‐1 | Yes: 99% pooling not feasible | No | Yes: single study arms Downgrade ‐1 | Undetected | Knekt I: Low Knekt II: Low |
| Any psych versus other psych (medium) | Knekt 2013 (three arms) | Yes: serious Downgrade ‐1 | Yes: 99% pooling not feasible | No | Yes: single study arms Downgrade ‐1 | Undetected | Knekt I: Low Knekt II: Low |
| Any psych versus CAU | No: Majority low risk of bias | No: I² < 50% | No | Yes: N < ‐400 Downgrade: ‐1 | Undetected | Moderate | |
| CMHN versus CAU | Kendrick 2005 (three arms) | Yes: serious Downgrade ‐1 | No: I² < 50% | No | Yes: wide CI Downgrade: ‐1 | Undetected | Low |
| Clinical, psychological and medication | |||||||
| Psych + med versus medicine | Yes: very serious Downgrade ‐2 | N.a. | No | Yes: N < ‐400 Downgrade: ‐1 | Undetected | Very low | |
| Enhanced primary care versus CAU | Yes: very serious Downgrade ‐2 | No: I² < 50% | No | No | Undetected | Low | |
| Telephone outreach versus CAU | No: study with low risk of bias | N.a. | No | No (n > 400 * CI not wide) | Undetected | High | |
| Clinical, exercise | |||||||
| Strength versus relax | Yes: serious Downgrade ‐1 | N.a. | No | Yes: N < ‐400 Downgrade: ‐1 | Undetected | Low | |
| Aerobic versus relax or stretching | No: Majority low risk of bias | No: I² < 50% | No | Yes: N < ‐400 Downgrade: ‐1 | Undetected | Moderate |
| Outcome or subgroup title | No. of studies | No. of participants | Statistical method | Effect size |
| 1 Days of sickness absence Show forest plot | 3 | 251 | Std. Mean Difference (IV, Random, 95% CI) | ‐0.40 [‐0.66, ‐0.14] |
| 1.1 Occupational therapy plus CAU vs. CAU | 2 | 179 | Std. Mean Difference (IV, Random, 95% CI) | ‐0.30 [‐0.61, 0.01] |
| 1.2 Multi‐component work‐focused program vs. CAU | 1 | 72 | Std. Mean Difference (IV, Random, 95% CI) | ‐0.66 [‐1.15, ‐0.16] |
| 2 Depressive symptoms Show forest plot | 3 | 251 | Std. Mean Difference (IV, Random, 95% CI) | ‐0.32 [‐0.88, 0.25] |
| 2.1 Occupational therapy plus CAU vs. CAU | 2 | 179 | Std. Mean Difference (IV, Random, 95% CI) | ‐0.08 [‐0.66, 0.50] |
| 2.2 Multi‐component work‐focused program vs. CAU | 1 | 72 | Std. Mean Difference (IV, Random, 95% CI) | ‐0.84 [‐1.34, ‐0.33] |
| 3 Work functioning Show forest plot | 2 | 189 | Std. Mean Difference (IV, Random, 95% CI) | ‐0.31 [‐0.79, 0.16] |
| 3.1 Occupational therapy plus CAU vs. CAU | 1 | 117 | Std. Mean Difference (IV, Random, 95% CI) | ‐0.09 [‐0.48, 0.29] |
| 3.2 Multi‐component work‐focused program vs. CAU | 1 | 72 | Std. Mean Difference (IV, Random, 95% CI) | ‐0.58 [‐1.08, ‐0.09] |
| Outcome or subgroup title | No. of studies | No. of participants | Statistical method | Effect size |
| 1 Days of sickness absence Show forest plot | 2 | 179 | Std. Mean Difference (IV, Random, 95% CI) | ‐0.19 [‐0.49, 0.12] |
| 1.1 Occupational therapy plus CAU vs. CAU | 2 | 179 | Std. Mean Difference (IV, Random, 95% CI) | ‐0.19 [‐0.49, 0.12] |
| 2 Depressive symptoms Show forest plot | 1 | 117 | Std. Mean Difference (IV, Random, 95% CI) | ‐0.63 [‐1.02, ‐0.24] |
| 2.1 Occupational therapy plus CAU vs. CAU | 1 | 117 | Std. Mean Difference (IV, Random, 95% CI) | ‐0.63 [‐1.02, ‐0.24] |
| 3 Work functioning Show forest plot | 1 | 117 | Std. Mean Difference (IV, Random, 95% CI) | ‐0.25 [‐0.63, 0.14] |
| 3.1 Occupational therapy plus CAU vs. CAU | 1 | 117 | Std. Mean Difference (IV, Random, 95% CI) | ‐0.25 [‐0.63, 0.14] |
| Outcome or subgroup title | No. of studies | No. of participants | Statistical method | Effect size |
| 1 Days of sickness absence Show forest plot | 1 | 126 | Std. Mean Difference (IV, Random, 95% CI) | ‐0.14 [‐0.49, 0.21] |
| 1.1 Collaborative care vs. CAU | 1 | 126 | Std. Mean Difference (IV, Random, 95% CI) | ‐0.14 [‐0.49, 0.21] |
| 2 Depressive symptoms Show forest plot | 1 | 74 | Std. Mean Difference (IV, Random, 95% CI) | 0.26 [‐0.20, 0.72] |
| 2.1 Collaborative care vs. CAU | 1 | 74 | Std. Mean Difference (IV, Random, 95% CI) | 0.26 [‐0.20, 0.72] |
| Outcome or subgroup title | No. of studies | No. of participants | Statistical method | Effect size |
| 1 Days of sickness absence Show forest plot | 1 | 75 | Std. Mean Difference (IV, Random, 95% CI) | 0.45 [‐0.00, 0.91] |
| 1.1 RTW‐E vs. CAU | 1 | 75 | Std. Mean Difference (IV, Random, 95% CI) | 0.45 [‐0.00, 0.91] |
| 2 Depressive symptoms Show forest plot | 1 | 40 | Std. Mean Difference (IV, Random, 95% CI) | ‐0.18 [‐0.84, 0.49] |
| 2.1 RTW‐E vs. CAU | 1 | 40 | Std. Mean Difference (IV, Random, 95% CI) | ‐0.18 [‐0.84, 0.49] |
| Outcome or subgroup title | No. of studies | No. of participants | Statistical method | Effect size |
| 1 Days of sickness absence Show forest plot | 5 | Std. Mean Difference (IV, Fixed, 95% CI) | Totals not selected | |
| 1.1 SSRI vs. SNRI | 3 | Std. Mean Difference (IV, Fixed, 95% CI) | 0.0 [0.0, 0.0] | |
| 1.2 SSRI vs. TCA | 1 | Std. Mean Difference (IV, Fixed, 95% CI) | 0.0 [0.0, 0.0] | |
| 1.3 SSRI vs. SSRI | 1 | Std. Mean Difference (IV, Fixed, 95% CI) | 0.0 [0.0, 0.0] | |
| 2 Depressive symptoms Show forest plot | 5 | 1514 | Std. Mean Difference (IV, Random, 95% CI) | 0.07 [‐0.34, 0.48] |
| 2.1 SSRI vs. SNRI | 3 | 599 | Std. Mean Difference (IV, Random, 95% CI) | 0.18 [‐0.37, 0.73] |
| 2.2 SSRI vs. TCA | 1 | 635 | Std. Mean Difference (IV, Random, 95% CI) | 0.0 [0.0, 0.0] |
| 2.3 SSRI vs. SSRI | 1 | 280 | Std. Mean Difference (IV, Random, 95% CI) | ‐0.23 [‐0.47, 0.00] |
| 3 Work functioning Show forest plot | 1 | 635 | Mean Difference (IV, Random, 95% CI) | ‐0.05 [‐0.16, 0.06] |
| 3.1 SSRI vs. TCA | 1 | 635 | Mean Difference (IV, Random, 95% CI) | ‐0.05 [‐0.16, 0.06] |
| Outcome or subgroup title | No. of studies | No. of participants | Statistical method | Effect size |
| 1 Days of sickness absence Show forest plot | 1 | 61 | Std. Mean Difference (IV, Random, 95% CI) | 0.48 [‐0.05, 1.00] |
| 1.1 TCA or MAO vs. placebo | 1 | 61 | Std. Mean Difference (IV, Random, 95% CI) | 0.48 [‐0.05, 1.00] |
| 2 Work functioning Show forest plot | 1 | 61 | Std. Mean Difference (IV, Random, 95% CI) | ‐0.58 [‐1.11, ‐0.05] |
| 2.1 TCA or MAO vs. placebo | 1 | 61 | Std. Mean Difference (IV, Random, 95% CI) | ‐0.58 [‐1.11, ‐0.05] |
| Outcome or subgroup title | No. of studies | No. of participants | Statistical method | Effect size |
| 1 Days of sickness absence Show forest plot | 1 | Std. Mean Difference (IV, Random, 95% CI) | Totals not selected | |
| 1.1 Short‐term psychodynamic therapy vs. solution‐focused therapy | 1 | Std. Mean Difference (IV, Random, 95% CI) | 0.0 [0.0, 0.0] | |
| 1.2 Long‐term psychodynamic therapy vs. solution‐focused therapy | 1 | Std. Mean Difference (IV, Random, 95% CI) | 0.0 [0.0, 0.0] | |
| 2 Depressive symptoms Show forest plot | 1 | Std. Mean Difference (IV, Random, 95% CI) | Totals not selected | |
| 2.1 Short‐term psychodynamic therapy vs. solution‐focused therapy | 1 | Std. Mean Difference (IV, Random, 95% CI) | 0.0 [0.0, 0.0] | |
| 2.2 Long‐term psychodynamic therapy vs. solution‐focused therapy | 1 | Std. Mean Difference (IV, Random, 95% CI) | 0.0 [0.0, 0.0] | |
| 3 Work functioning Show forest plot | 1 | Std. Mean Difference (IV, Random, 95% CI) | Totals not selected | |
| 3.1 Short‐term psychodynamic therapy vs solution‐focused therapy | 1 | Std. Mean Difference (IV, Random, 95% CI) | 0.0 [0.0, 0.0] | |
| 3.2 Long‐term psychodynamic therapy vs solution‐focused therapy | 1 | Std. Mean Difference (IV, Random, 95% CI) | 0.0 [0.0, 0.0] | |
| Outcome or subgroup title | No. of studies | No. of participants | Statistical method | Effect size |
| 1 Days of sickness absence Show forest plot | 1 | Std. Mean Difference (IV, Random, 95% CI) | Subtotals only | |
| 1.1 Short‐term psychodynamic therapy vs. solution‐focused therapy | 1 | 36 | Std. Mean Difference (IV, Random, 95% CI) | ‐0.91 [‐1.62, ‐0.19] |
| 1.2 Long‐term psychodynamic therapy vs. solution‐focused therapy | 1 | 42 | Std. Mean Difference (IV, Random, 95% CI) | ‐4.61 [‐5.84, ‐3.39] |
| 2 Depressive symptoms Show forest plot | 1 | 263 | Std. Mean Difference (IV, Random, 95% CI) | ‐1.85 [‐2.99, ‐0.72] |
| 2.1 Short‐term psychodynamic therapy vs. solution‐focused therapy | 1 | 118 | Std. Mean Difference (IV, Random, 95% CI) | ‐1.28 [‐1.69, ‐0.86] |
| 2.2 Long‐term psychodynamic therapy vs. solution‐focused therapy | 1 | 145 | Std. Mean Difference (IV, Random, 95% CI) | ‐2.44 [‐2.90, ‐1.97] |
| 3 Work functioning Show forest plot | 1 | Std. Mean Difference (IV, Random, 95% CI) | Totals not selected | |
| 3.1 Short‐term psychodynamic therapy vs. solution‐focused therapy | 1 | Std. Mean Difference (IV, Random, 95% CI) | 0.0 [0.0, 0.0] | |
| 3.2 Long‐term psychodynamic therapy vs. solution‐focused therapy | 1 | Std. Mean Difference (IV, Random, 95% CI) | 0.0 [0.0, 0.0] | |
| Outcome or subgroup title | No. of studies | No. of participants | Statistical method | Effect size |
| 1 Days of sickness absence Show forest plot | 4 | Std. Mean Difference (IV, Random, 95% CI) | Subtotals only | |
| 1.1 Online/telephone CBT vs. CAU | 3 | 326 | Std. Mean Difference (IV, Random, 95% CI) | ‐0.23 [‐0.45, ‐0.01] |
| 1.2 CMHN vs. usual GP care | 1 | 59 | Std. Mean Difference (IV, Random, 95% CI) | 0.22 [‐0.36, 0.79] |
| 2 Depressive symptoms Show forest plot | 4 | Std. Mean Difference (IV, Random, 95% CI) | Subtotals only | |
| 2.1 Online/telephone CBT vs. CAU | 3 | 408 | Std. Mean Difference (IV, Random, 95% CI) | ‐0.56 [‐0.76, ‐0.36] |
| 2.2 CMHN vs. usual GP care | 1 | 78 | Std. Mean Difference (IV, Random, 95% CI) | 0.22 [‐0.31, 0.75] |
| Outcome or subgroup title | No. of studies | No. of participants | Statistical method | Effect size |
| 1 Days of sickness absence Show forest plot | 1 | 57 | Std. Mean Difference (IV, Random, 95% CI) | ‐0.71 [‐1.25, ‐0.17] |
| 1.1 Psychodynamic therapy plus TCA vs. TCA | 1 | 57 | Std. Mean Difference (IV, Random, 95% CI) | ‐0.71 [‐1.25, ‐0.17] |
| 2 Work functioning or productivity Show forest plot | 1 | 57 | Std. Mean Difference (IV, Random, 95% CI) | ‐0.49 [‐1.02, 0.04] |
| 2.1 Psychodynamic therapy plus TCA vs. TCA | 1 | 57 | Std. Mean Difference (IV, Random, 95% CI) | ‐0.49 [‐1.02, 0.04] |
| 3 Depressive symptoms Show forest plot | 1 | 74 | Std. Mean Difference (IV, Random, 95% CI) | ‐0.11 [‐0.57, 0.35] |
| Outcome or subgroup title | No. of studies | No. of participants | Statistical method | Effect size |
| 1 Days of sickness absence Show forest plot | 3 | Std. Mean Difference (IV, Random, 95% CI) | Subtotals only | |
| 1.1 Enhanced primary care vs. CAU | 2 | 969 | Std. Mean Difference (IV, Random, 95% CI) | ‐0.02 [‐0.15, 0.12] |
| 1.2 Telephone outreach and care management program vs. CAU | 1 | 604 | Std. Mean Difference (IV, Random, 95% CI) | ‐0.21 [‐0.37, ‐0.05] |
| 2 Employment status Show forest plot | 1 | 1356 | Risk Ratio (M‐H, Random, 95% CI) | 1.08 [0.99, 1.18] |
| 2.1 Enhanced primary care vs. CAU | 1 | 1356 | Risk Ratio (M‐H, Random, 95% CI) | 1.08 [0.99, 1.18] |
| 3 Depressive symptoms Show forest plot | 2 | 693 | Std. Mean Difference (IV, Random, 95% CI) | ‐0.22 [‐0.37, ‐0.07] |
| 3.1 Enhanced primary care vs. CAU | 1 | 89 | Std. Mean Difference (IV, Random, 95% CI) | ‐0.14 [‐0.56, 0.28] |
| 3.2 Telephone outreach and care management program vs. CAU | 1 | 604 | Std. Mean Difference (IV, Random, 95% CI) | ‐0.23 [‐0.39, ‐0.07] |
| 4 Depressed yes/no Show forest plot | 1 | 1356 | Risk Ratio (M‐H, Random, 95% CI) | 0.89 [0.81, 0.98] |
| 4.1 Enhanced primary care vs. CAU | 1 | 1356 | Risk Ratio (M‐H, Random, 95% CI) | 0.89 [0.81, 0.98] |
| 5 Work functioning Show forest plot | 1 | 604 | Std. Mean Difference (IV, Random, 95% CI) | 0.50 [0.34, 0.66] |
| 5.1 Telephone outreach and care management program vs. CAU | 1 | 604 | Std. Mean Difference (IV, Random, 95% CI) | 0.50 [0.34, 0.66] |
| Outcome or subgroup title | No. of studies | No. of participants | Statistical method | Effect size |
| 1 Days of sickness absence Show forest plot | 2 | Std. Mean Difference (IV, Random, 95% CI) | Subtotals only | |
| 1.1 Supervised strength training vs. relaxation | 1 | 65 | Std. Mean Difference (IV, Random, 95% CI) | ‐1.11 [‐1.68, ‐0.54] |
| 1.2 Aerobic exercise vs. relaxation/stretching | 2 | 180 | Std. Mean Difference (IV, Random, 95% CI) | ‐0.06 [‐0.36, 0.24] |
| 2 Depressive symptoms Show forest plot | 2 | Std. Mean Difference (IV, Random, 95% CI) | Subtotals only | |
| 2.1 Supervised strength training vs. relaxation | 1 | 65 | Std. Mean Difference (IV, Random, 95% CI) | 0.15 [‐0.39, 0.68] |
| 2.2 Aerobic exercise vs. relaxation/stretching | 2 | 180 | Std. Mean Difference (IV, Random, 95% CI) | 0.18 [‐0.12, 0.48] |