Probióticos para el tratamiento del eccema
Resumen
Antecedentes
El eccema es una afección cutánea crónica común. Los probióticos se han propuesto como un tratamiento efectivo para el eccema y está aumentando su uso debido a que hay numerosos ensayos clínicos en marcha. Esta es una actualización de una revisión Cochrane publicada por primera vez en 2008, que indicó que los probióticos pueden no ser un tratamiento efectivo para el eccema aunque identificó áreas sobre las cuales faltaba evidencia.
Objetivos
Evaluar los efectos de los probióticos para el tratamiento del eccema en pacientes de todas las edades.
Métodos de búsqueda
Se actualizaron las búsquedas de las siguientes bases de datos hasta enero de 2017: registro especializado del Grupo Cochrane de Piel (Cochrane Skin Group Specialised Register), Registro Cochrane Central de Ensayos Controlados (Cochrane Central Register of Controlled Trials) (CENTRAL), en la Cochrane Library, la Global Resource of Eczema Trials (GREAT) database, MEDLINE, Embase, PsycINFO, en la Allied and Complementary Medicine Database (AMED), y en Latin American Caribbean Health Sciences Literature (LILACS). También se buscó en cinco registros de ensayos, y se verificaron las listas de referencias de los estudios incluidos y revisiones relevantes para obtener más referencias de ensayos controlados aleatorios (ECA). También se realizaron búsquedas manuales en varias actas de congresos. Se actualizaron las búsquedas en las principales bases de datos en enero de 2018 y en los registros de ensayos en marzo de 2018, pero aún no se han incorporado estos resultados a la revisión.
Criterios de selección
Ensayos controlados aleatorios de los probióticos (microorganismos vivos ingeridos por vía oral) en comparación con ningún tratamiento, placebo u otra intervención activa con ningún probiótico para el tratamiento del eccema diagnosticado por un médico.
Obtención y análisis de los datos
Se utilizaron los procedimientos metodológicos estándar previstos por Cochrane. Se registraron los eventos adversos a partir de los estudios incluidos y de otra búsqueda de eventos adversos realizada para la primera revisión. Se evaluó formalmente el sesgo de informe mediante la preparación de gráficos en embudo, y se realizó el análisis secuencial de ensayos para el primer resultado primario ‐ síntomas del eccema al final del tratamiento activo.
Se utilizaron los criterios GRADE para evaluar la calidad de la evidencia de cada resultado (en cursiva).
Resultados principales
Se incluyeron 39 ensayos controlados aleatorios con 2599 asignados al azar. Se incluyó a participantes de cualquier sexo, desde el primer año de vida hasta los 55 años de edad (sólo seis estudios evaluaron a adultos), que presentaban eccema leve a grave. Los ensayos se realizaron en ámbitos de asistencia sanitaria primaria y secundaria, principalmente en Europa o Asia. La duración del tratamiento varió desde cuatro semanas a seis meses, y la duración del seguimiento después del final del tratamiento varió de cero a 36 meses. No se seleccionó ninguna dosis estándar: los investigadores usaron diversas dosis y concentraciones de probióticos. Los probióticos utilizados fueron bacterias de las especies Lactobacillus y Bifidobacteria , que se administraron solas o se combinaron con otros probióticos, y se administraron con o sin prebióticos. Los comparadores fueron ningún tratamiento, placebo y otros tratamientos sin probióticos.
Para todos los resultados descritos en este resumen, el comparador fue ningún probiótico. El tratamiento activo varió desde seis semanas a tres meses para todos los resultados a continuación, además del resultado de la gravedad del eccema calificada por el investigador, para el cual el límite superior del tratamiento activo fue de 16 semanas. Con respecto a la puntuación, cuanto mayor era la puntuación, más grave eran los síntomas. Todos los resultados clave presentados en este resumen se midieron al final del tratamiento activo, excepto por los eventos adversos, que se midieron durante el período de tratamiento activo.
Los probióticos probablemente logran poco o ningún cambio en los síntomas del eccema calificados por los participantes o los padres (13 ensayos; 754 participantes): la gravedad de los síntomas en una escala de 0 a 20 fue de 0,44 puntos inferior después del tratamiento con probióticos (intervalo de confianza [IC] del 95%: ‐1,22 a 0,33; evidencia de calidad moderada). El análisis secuencial de ensayos demuestra que se han excedido los tamaños de la muestra proyectados de 258 y 456, que son necesarios para demostrar una diferencia de medias mínima de ‐2 y ‐1,5, respectivamente, con un poder estadístico del 90%, lo cual sugiere que pueden no ser útiles los ensayos adicionales con cepas de probióticos similares para este resultado al final del tratamiento activo.
No se encontró evidencia que indicara que los probióticos logran un cambio en la CdV para los pacientes con eccema (seis estudios; 552 participantes; diferencia de medias estandarizada [DME] 0,03; IC del 95%: ‐0,36 a 0,42; evidenciade baja calidad) según lo medido con instrumentos validados de la CdV específica de la enfermedad utilizados por los participantes o los padres.
Los probióticos pueden reducir levemente las puntuaciones de la gravedad del eccema consideradas por el investigador (24 ensayos; 1596 participantes). En una escala de 0 a 103 para la Severity Scoring of Atopic Dermatitis (SCORAD) total, una puntuación que combinó la puntuación de la gravedad del eccema calificada por el investigador y la calificación del participante de los síntomas del eccema de prurito y falta de sueño fue de 3,91 puntos inferior después del tratamiento con probióticos en lugar del tratamiento con ningún probiótico (IC del 95%: ‐5,86 a ‐1,96; evidencia de baja calidad). La diferencia mínima clínicamente importante para SCORAD se ha calculado en 8,7 puntos.
Se observaron niveles significativos a extremos de heterogeneidad inexplicable entre los resultados de los estudios individuales. Se consideró que la mayoría de los estudios presentaban un riesgo poco claro de sesgo; seis estudios estuvieron en riesgo alto de sesgo de abandono, y nueve estuvieron en riesgo bajo de sesgo en general.
No se halló evidencia para demostrar que los probióticos logran un cambio en el riesgo de eventos adversos durante el tratamiento activo (cociente de riesgos [CR] 1,54, IC del 95%: 0,90 a 2,63; siete ensayos; 402 participantes; evidencia de baja calidad). Los estudios de la revisión que informaron de efectos adversos describieron los síntomas gastrointestinales.
Conclusiones de los autores
La evidencia indica que, en comparación con ningún probiótico, las cepas de probióticos disponibles en la actualidad probablemente logran poco o ningún cambio en la mejoría de los síntomas del eccema calificada por el paciente. Los probióticos pueden lograr poco o ningún cambio en la CdV para los pacientes con eccema y en la puntuación de la gravedad del eccema calificada por el investigador (combinada con la calificación del participante de los síntomas del eccema de prurito y falta de sueño); para lo último, el efecto observado fue pequeño y de importancia clínica incierta. Por lo tanto, la administración de probióticos para el tratamiento del eccema actualmente no se basa en evidencia. Esta actualización no encontró evidencia de un aumento de los efectos adversos con el uso de probióticos durante los estudios, aunque otra búsqueda de los eventos adversos a partir de la primera revisión reveló que el tratamiento con probióticos conlleva un riesgo pequeño de eventos adversos.
Los resultados muestran heterogeneidad significativa inexplicable entre los resultados de los ensayos individuales. Sólo un número pequeño de estudios midió algunos resultados.
Los estudios futuros deben medir mejor las puntuaciones de la CdV y los eventos adversos y deben informar sobre los nuevos probióticos. Los investigadores también deben considerar la posibilidad de estudiar a los subgrupos de pacientes (p.ej. pacientes con atopia o alergias a los alimentos, adultos) y de estandarizar las dosis/concentraciones de los probióticos administrados.
PICO
Resumen en términos sencillos
Probióticos para el tratamiento del eccema
Pregunta de la revisión
Esta revisión Cochrane procuró determinar, mediante el análisis de los datos de los ensayos controlados aleatorios (ECA), si los probióticos (bacterias, hongos o levaduras) son efectivos para tratar el eccema de cualquier gravedad en los pacientes de todas las edades en comparación con placebo (un tratamiento idéntico pero inactivo), ningún tratamiento u otro tratamiento que no incluye probióticos. Se deseaba determinar si el tratamiento con probióticos mejora los síntomas, la calidad de vida o la gravedad del eccema en los pacientes al final del tratamiento activo y durante el seguimiento después de que el tratamiento activo ha finalizado.
Antecedentes
El eccema es una afección cutánea no contagiosa que genera inflamación y prurito. Afecta a entre un 5% y un 20% de las personas en algún momento de la vida. Los pacientes con eccema tienen diferentes bacterias en el intestino en comparación con las personas sin eccema y a veces presentan inflamación intestinal. Se ha sugerido que los síntomas del eccema pueden ser tratados mediante el cambio en la combinación de bacterias del intestino o mediante la reducción de la inflamación en los intestinos. Los probióticos, que son microorganismos vivos administrados por vía oral, como las bacterias Lactobacillus encontradas en la leche y el yogur no pasteurizados, podrían lograr dicho objetivo.
Ésta es una actualización de una revisión Cochrane anterior publicada en 2008; es importante porque se han realizado más ensayos desde la publicación de la primera revisión, está aumentando el uso de probióticos y se necesitan nuevos tratamientos para el eccema.
Características de los estudios
Se incluyeron 39 ensayos clínicos controlados aleatorios (ECA) con 2599 participantes, que se identificaron en las búsquedas hasta enero de 2017.
Estos estudios incluyeron a pacientes de cualquier género y de todas las edades, aunque la mayoría de los estudios evaluó a niños que habían recibido un diagnóstico de eccema por parte de un profesional sanitario. Los participantes presentaban eccema que variaba de leve a grave y los ECA compararon el tratamiento con microorganismos vivos (probióticos) de dosis y concentración variables, administrados por vía oral, versus ningún tratamiento, placebo, u otro tratamiento sin probióticos.
Los probióticos incluidos eran bacterias de las especies Lactobacillus y Bifidobacteria solas o en combinación con otros probióticos durante un período que varió desde cuatro semanas hasta seis meses. No se consideraron los estudios que procuraban prevenir el eccema. La mayoría de los estudios se realizaron en Europa, y algunos se realizaron en Asia, Australia y Nueva Zelanda, todo en un entorno médico. La mayoría de los estudios se realizaron en un solo centro. Los autores de la revisión no aplicaron restricciones de idioma en la selección de los estudios. Diez estudios fueron financiados por empresas que suministraban los probióticos, y otros cuatro estudios no declararon la fuente de financiación.
Resultados clave
Debe observarse que los resultados de este resumen se basan en lo siguiente: una comparación de probióticos versus ningún probiótico; tratamiento durante seis semanas a tres meses, excepto por el resultado de la gravedad del eccema calificado por el investigador, para el cual los participantes fueron tratados durante un periodo más prolongado (16 semanas); y los resultados medidos al final del período de tratamiento, además de los eventos adversos, que se evaluaron durante todo el tratamiento. A menos que se indicara lo contrario, los resultados fueron medidos por los participantes o sus padres. Los estudios incluidos evaluaron diversos probióticos en diferentes concentraciones o dosis. Con respecto a la puntuación, cuanto mayor era la puntuación, más grave eran los síntomas.
Se encontró que los probióticos disponibles en la actualidad probablemente logran poco o ningún cambio en la reducción de los síntomas del eccema, como el prurito y la falta de sueño (evidencia de calidad moderada).
Sin embargo, se encontró que estos probióticos pueden reducir levemente la gravedad del eccema calificada por los pacientes y los profesionales sanitarios en combinación (evidencia de baja calidad), aunque no se conoce si un cambio de este tipo es significativo para los pacientes.
En cuanto a la calidad de vida del paciente, no se halló evidencia de que los probióticos lograran un cambio (evidencia de baja calidad).
No se halló evidencia de un aumento de los eventos adversos; los informados en los estudios incluidos que estaban relacionados con el tratamiento fueron malestar estomacal e intestinal con diarrea, estreñimiento, vómitos y dolores cólicos (evidencia de baja calidad).
El análisis indica que puede no justificarse la realización de estudios adicionales de los probióticos que evalúen los efectos de los síntomas del eccema, debido a que es poco probable que cambien el resultado al final del tratamiento activo.
Calidad de la evidencia
La certeza de la evidencia que apoya los resultados clave fue baja, además de una clasificación de moderado para los síntomas del eccema calificados por los participantes. Las razones de lo anterior incluyen la variabilidad entre los estudios, que no pudo explicarse y la cantidad insuficiente de datos disponibles.
Conclusiones de los autores
Summary of findings
| Comparison: probiotics vs no probiotics for treating eczema | ||||||
| Patient or population: male and female patients 0 to 55 years of age with physician‐diagnosed eczema Settings: primary or secondary care. Europe: 22 studies with 1390 participants. Asia: 8 studies with 500 participants. Australasia: 2 studies with 116 participants Intervention: probiotics ± prebiotics Comparison: no probiotics | ||||||
| Outcomes | Illustrative comparative risks* (95% CI) | Relative effect | No. of participants | Quality of the evidence | Comments | |
| Assumed risk | Corresponding risk | |||||
| No probiotics | Probiotics | |||||
| Primary outcome 1: participant‐ or parent‐rated symptoms of eczema (SCORAD part C) at the end of active treatment Visual analogue scale for itch and sleep disturbance ranging from 0 to 10 for each symptom and combined ranging from 0 to 20. The higher the score, the more severe the symptoms Duration of follow‐up from baseline until end of active treatment from 6 weeks to 3 months | Mean SCORAD part C score ranged across control groups from 2 to 7.9 | Mean SCORAD part C score in the intervention groups was 0.44 points lower (1.22 lower to 0.33 higher) | ‐ | 754 | ⊕⊕⊕⊝ | Two cross‐over studies included. Significant heterogeneity between studies Post hoc trial sequential analysis showed no effects of probiotics over control and suggests that further studies of currently available probiotic strains for this outcome may be futile |
| Primary outcome 1: participant‐ or parent‐rated global change in eczema symptoms at the end of active treatment (binary outcome) Change in risk for worsened/unchanged eczema Duration of follow‐up from baseline until end of active treatment from 6 weeks to 3 months | Low‐risk population | OR 0.40 (0.14 to 1.15) | 135 | ⊕⊕⊝⊝ | One cross‐over study included. Number of studies for this outcome was small. Moderate heterogeneity between studies | |
| 300 per 1000 | 146 per 1000 | |||||
| Medium‐risk population | ||||||
| 400 per 1000 | 210 per 1000 | |||||
| High‐risk population | ||||||
| 500 per 1000 | 286 per 1000 | |||||
| Primary outcome 2: participant‐ or parent‐rated participant quality of life score at the end of active treatment Scales used: DLQI, IDQoL, Skindex‐29, CDLQI. On those scales, the higher the score, the more severely the quality of life is affected Duration of follow‐up from baseline until end of active treatment from 8 weeks to 3 months | Mean DLQI score ranged across control groups from | Mean participant quality of life score in the intervention groups was | ‐ | 552 (6) | ⊕⊕⊝⊝ | Small number of studies for this outcome. Significant heterogeneity |
| Primary outcome 2: participant‐ or parent‐rated family quality of life score at the end of active treatment Scale used: DFI, FDLQI. On those scales, the higher the score, the more severely the quality of life is affected Duration of follow‐up from baseline until end of active treatment from 8 weeks to 3 months | Mean change in DFI score during treatment ranged across control groups from ‐2 points to ‐3 points | Mean family quality of life score in the intervention groups was 0.19 standard deviations lower (0.56 lower to 0.18 higher) | ‐ | 358 | ⊕⊝⊝⊝ | Very small number of studies for this outcome. Significant heterogeneity |
| Secondary outcome 4: global eczema severity score (total SCORAD) at the end of active treatment (Investigator‐rated eczema severity) Scale used: total SCORAD ranging from 0 to 103. The higher the score, the more severe the disease Duration of follow‐up from baseline until end of active treatment from 8 weeks to 16 weeks | Mean total SCORAD ranged across control groups from | Mean total SCORAD score in the intervention groups was 3.91 points lower (5.86 to 1.96 points lower) | ‐ | 1596 | ⊕⊕⊝⊝ | Two cross‐over studies included. Extreme levels of heterogeneity for this outcome. Evidence of reporting bias |
| Secondary outcome 6: adverse events (gastrointestinal symptoms) during active treatment Duration of follow‐up from baseline until end of active treatment from 8 weeks to 3 months | Low‐risk population | RR 1.54 (0.90 to 2.63) | 402 (7) | ⊕⊕⊝⊝ | Small number of studies reported adverse events. Small number of events were included in this analysis | |
| 0 per 1000 | 0 per 1000 | |||||
| Medium‐risk population | ||||||
| 100 per 1000 | 154 per 1000 | |||||
| High‐risk population | ||||||
| 200 per 1000 | 308 per 1000 | |||||
| *The basis for the assumed risk (e.g. the median control group risk across studies) is provided in footnotes. The corresponding risk (and its 95% confidence interval) is based on the assumed risk in the comparison group and the relative effect of the intervention (and its 95% CI). | ||||||
| GRADE Working Group grades of evidence. | ||||||
| aDowngraded by one level due to inconsistency as there was significant heterogeneity among studies (I² = 57%). bDowngraded by two levels due to small number of studies for this outcome (imprecision) and because of moderate levels of heterogeneity among studies (I² = 48%). cDowngraded by two levels due to small number of studies for this outcome (imprecision) and because of significant levels of heterogeneity among studies (I² = 68%). dDowngraded by three levels due to inconsistency (one level) as there was significant heterogeneity among studies (I² = 57%) and because of very small number of studies (imprecision) for this outcome (two levels). eDowngraded by two levels because of extreme levels of heterogeneity among studies (I² = 79%) and because of evidence of reporting bias. fDowngraded by two levels because of small number of studies reporting adverse events and small number of events in the meta‐analysis for this outcome (imprecision). | ||||||
Antecedentes
Descripción de la afección
Definición de la enfermedad
El eccema es una enfermedad inflamatoria crónica no infecciosa de la piel caracterizada por una erupción cutánea, habitualmente eritematosa, que causa prurito. Los términos “eccema” y “dermatitis” se han usado como sinónimos, y el eccema se asocia con atopia. La “atopia” se define como una predisposición genética a la sensibilización y la producción de anticuerpos de inmunoglobulina (Ig) E en respuesta a la exposición normal a los alérgenos (Johansson 2004). A pesar de la asociación entre el eccema y la atopia, hasta un 40% de niños con eccema no son atópicos, cuando se define de acuerdo a pruebas de alergias como las pruebas cutáneas (Bohme 2001; Flohr 2004). Una nomenclatura revisada sobre la alergia, presentada por Johansson 2001, ha sido actualizada por la World Allergy Organisation (Johansson 2004). La nueva nomenclatura se basa en los mecanismos que inician y median las reacciones alérgicas. Se propone reemplazar el término provisional “síndrome de dermatitis/eccema atópico” por el término “eccema”. Se piensa que lo que se conocía como síndrome de dermatitis/eccema atópico desde 2001 no es ahora una única enfermedad sino un conjunto de varias enfermedades con ciertas características comunes. El término “atopia” no puede usarse hasta que se documente una sensibilización por IgE por medio de la detección de estos anticuerpos en la sangre o por medio de una prueba cutánea positiva a alérgenos ambientales o dietéticos comunes, como el polen, el ácaro de polvo doméstico, la leche de vaca o el huevo. Cuando se realice dicho registro, el término “eccema” se podrá dividir en “eccema atópico” y “eccema no atópico”.
En esta revisión, se usará el término “eccema” e incluirá el eccema cuando se haya confirmado la sensibilización por IgE, cuando no haya sensibilización por IgE y cuando ésta no haya sido evaluada.
Epidemiología y causas
El eccema es la enfermedad inflamatoria de la piel más frecuente de la niñez y afecta de un 5% a un 20% de los niños en algún momento (Nankervis 2016; Williams 1999). El International Study of Asthma and Allergies in Childhood (ISAAC) Phase III reveló que la prevalencia del eccema actual para los niños de seis a siete años de edad varía de un 0,9% en la India a un 22,5% en Ecuador, y para los adolescentes de 13 a 14 años de edad, de un 0,2% en China a un 24,6% en Columbia (Odhiambo 2009). El mismo estudio reveló que la prevalencia de los síntomas del eccema grave varió de un 0,0% a un 4,9% para los niños de seis a siete años de edad, y de un 0,0% a un 5,8% para los adolescentes de 13 a 14 años de edad. Cerca de un 2% de los adultos presentan eccema y muchos presentan una modalidad más crónica y grave (Charman 2002). La prevalencia a un año del eccema en adultos en Estados Unidos se calculó en un 10,2% (Silverberg 2013). El eccema a menudo se asocia con otras enfermedades atópicas como asma, rinitis alérgica o alergias alimentarias (Beck 2000), y los pacientes a menudo tienen antecedentes familiares de enfermedades alérgicas. Se ha observado una variación amplia en la prevalencia del eccema entre diferentes países, y los estudios indican que la prevalencia está aumentando en los países en desarrollo (Odhiambo 2009; Williams 2008).
La causa del eccema no se comprende claramente. El hallazgo de que las variantes de la pérdida de la función de la proteína de la barrera de la piel filagrina son un factor predisponente para la dermatitis atópica en los ciudadanos de Europa occidental fue un descubrimiento importante en la investigación sobre la etiopatogénesis de la dermatitis atópica (Palmer 2006). Se encontraron las mismas u otras variantes en otras poblaciones como en los japoneses (informado en Enomoto 2008 y Nemoto‐Hasebe 2009) y en los chinos del grupo Han (informado en Zhang 2011). La patogenia del eccema es compleja e incluye una combinación de factores: defectos de la barrera de la piel, inmunidad innata y adaptativa, y exposición a los alérgenos y microbios ambientales (Bieber 2008). Los productos del sistema inmunitario innatos y adaptativos tienen un efecto sobre las proteínas principales de la función de la barrera epidérmica y en la defensa contra los agentes patógenos (Malik 2017). La investigación también ha apuntado a la posible función de los microbios de los intestinos (Abrahamsson 2012; Bjorksten 2001; Ismail 2012; Song 2016; Watanabe 2003).
Características clínicas
El eccema es una afección crónica, no contagiosa y recurrente que produce prurito. En la infancia, se localiza predominantemente en la cara, en el área del pañal y en las superficies de extensión de las rodillas y los codos; en la niñez, afecta principalmente las zonas de flexión, la cara y el cuello y continúa de forma similar en la edad adulta. Puede ser generalizado. La afectación de las manos y los pies es más común en la edad adulta. En la infancia, la erupción cutánea del eccema consta de pápulas y vesículas rojas edematosas, y posteriormente muestra manchas eritematosos con pápulas, vesículas, exudado, formación de costras, liquenificación e hiperpigmentación o hipopigmentación según el tipo de piel. Puede ser complicado por infecciones bacterianas y virales y linfadenopatía. La gravedad del eccema es variable, desde sequedad leve localizada y enrojecimiento con poco impacto sobre la calidad de vida hasta una afectación generalizada con limitación grave de las actividades diarias y falta de sueño. El prurito es el síntoma predominante, que se puede exacerbar por el calor, la sudoración, el baño, el ejercicio, la ropa de lana y la alteración emocional (Rook 2016).
Evolución natural
Para un 45% de los pacientes, el eccema comienza en los primeros seis meses de vida, y al año y cinco años, un 60% y un 85%, respectivamente, de los que presentan probabilidades de desarrollarlo lo habrán hecho. Hasta un 70% de estos casos presentarán la remisión espontánea antes de la adolescencia (Bieber 2008). La evidencia emergente indica que el eccema puede tener una prevalencia similar en la adolescencia y en la primera etapa de la adultez que en la niñez (Abuabara 2018).
Impacto
El eccema varía en cuanto a su gravedad, que puede medirse de varias maneras. Una revisión sistemática de los instrumentos que miden los signos del eccema incluyó 16 escalas diferentes usadas en los estudios de validación. Dos de ellas ‐ la Eczema Area and Severity Index (EASI) y la Severity Scoring of Atopic Dermatitis (SCORAD) ‐ se consideran las mejores para evaluar la gravedad de los signos de la dermatitis atópica basado en la validez, la respuesta, la consistencia interna, la fiabilidad interobservador e intraobservador, la interpretabilidad y la factibilidad (Schmitt 2013). La iniciativa HOME (Harmonizing Outcome Measures for Eczema) comprende un grupo internacional que está trabajando para lograr un acuerdo en cuanto a las medidas de resultado centrales que deben informarse en todos los ensayos clínicos para el eccema. Su meta es permitir la comparación de los datos entre los ensayos para el eccema (www.homeforeczema.org).
El prurito intenso y el hecho de rascarse pueden dar lugar a trastornos del sueño graves en los niños y los adultos con eccema, lo cual resulta en cansancio y falta de concentración. La falta de sueño, así como la inflamación sistémica y el deterioro de la calidad de vida, pueden contribuir con los trastornos de salud mental asociados con el eccema, como la depresión y el trastorno de hiperactividad con déficit atención (Silverberg 2017). Un estudio que comparó el efecto sobre la calidad de vida de los niños con enfermedad de la piel crónica revela que para los niños y los padres, la dermatitis atópica causó la mayor deficiencia, y tuvo calificaciones peores que las enfermedades crónicas como la epilepsia, la enuresis y la diabetes (Beattie 2006). El eccema tiene una repercusión significativa sobre la calidad de vida de la familia o los padres del paciente. La falta de sueño, el tiempo dedicado al cuidado del paciente y el tiempo de ausentismo del trabajo para cuidar al niño afectado tienen una repercusión significativa sobre la calidad de vida y la economía de los padres y la familia del paciente con eccema (Lewis‐Jones 2006).
El eccema también implica considerables costes para toda la comunidad. Por ejemplo, en Australia se estimó un coste del eccema infantil de 316,7 millones de dólares australianos para la comunidad (USD 239 300 000; 195 900 000 millones de euros) por año en 1999 (Kemp 1999). En Estados Unidos, el coste nacional calculado de la dermatitis atópica osciló entre USD 364 000 000 y USD 3 800 000 000 (Mancini 2008). Los costes de asistencia sanitaria del eccema en adultos son equivalentes a los de la epilepsia, el enfisema y otras enfermedades crónicas (Ellis 2002). Los costes directos de la familia surgen con los tratamientos, la ropa y la ropa de cama especiales y los gastos adicionales de lavandería; los costes indirectos son el producto de los días laborables perdidos cuando los padres cuidan un niño enfermo. Las mayores implicaciones económicas se observan en los costos de los profesionales sanitarios; las oportunidades desaprovechadas para los padres de los niños enfermos que no tienen la opción de buscar empleo; y las limitaciones laborales que enfrenta el niño como resultado de la pérdida de escolaridad.
Descripción de la intervención
Actualmente no se conoce ninguna cura para el eccema; sin embargo, se dispone de diversos tratamientos para controlar y reducir los síntomas (Fennessy 2000; Lamb 2002; Nankervis 2016). Los profesionales de la salud ayudan a los pacientes en el tratamiento de la enfermedad mediante diversos métodos de tratamiento que incluyen emolientes, esteroides tópicos, alquitranes tópicos y tacrolimus y pimecrolimus tópicos. También se usan otros tratamientos como vendajes oclusivos húmedos, fototerapia, evitar factores desencadenantes como alérgenos alimentarios y terapias complementarias (Ernst 2000). Muchos tratamientos son de efectividad desconocida (Nankervis 2016). Los emolientes, los corticosteroides tópicos y los inhibidores de la calcineurina tópicos se recomiendan en todo el mundo (Nankervis 2016; Smethurst 2002). Con un conocimiento más profundo de la inmunopatogénesis de la dermatitis atópica, han surgido nuevos tratamientos como el dupilumab, un inhibidor de la subunidad alfa del receptor de interleucina (IL)‐4, y los inhibidores de la enzima fosfodiesterasa (Eichenfield 2017). Los regímenes de tratamiento pueden ser prolongados y costosos para los pacientes y sus familias, y se necesitan nuevos tratamientos que sean efectivos, económicos y fáciles de administrar.
Los probióticos son microorganismos vivos (p.ej. especies Lactobacillus) que cuando se administran en cantidades adecuadas confieren un beneficio de salud en el huésped (FAO/WHO 2002). Se ha sugerido que los requisitos mínimos para el estado de los probióticos incluyen la evaluación de la identidad de la cepa, pruebas in vitro para seleccionar los probióticos potenciales, la evaluación de la seguridad y estudios in vivo para la fundamentación de los efectos (Pineiro 2007). Los microorganismos considerados probióticos que son usados en los alimentos y las preparaciones farmacéuticas son predominantemente bacterias ácidas lácticas y sobre todo las de la especie Lactobacillus y Bifidobacteria, aunque también las bacterias ácidas no lácticas como la Saccharomyces boulardii (Holzapfel 2001). Los probióticos no son prebióticos, que son azúcares no digeribles que se encuentran en algunos alimentos que promueven el crecimiento de ciertos tipos de bacterias en el intestino.
De qué manera podría funcionar la intervención
Fundamento del uso de probióticos para el tratamiento del eccema
La microflora intestinal (o microbiota intestinal) es un grupo grande y variado de microorganismos que viven en el intestino humano y otorgan beneficios intestinales, inmunitarios y nutricionales al huésped. La composición de la microflora intestinal puede ser diferente en los individuos con eccema, y tales diferencias pueden preceder la aparición del eccema activo. El resultado más consistente en los estudios relevantes es una proporción reducida de las especies de bifidobacterias en las heces de los lactantes con eccema (Bjorksten 2001; Kalliomaki 2001; Murray 2005), así como en los niños mayores y los adultos jóvenes con dermatitis atópica (Watanabe 2003). En el último estudio, los números inferiores de especies Bifidobacteria también se correlacionaron con una mayor gravedad de la enfermedad. Estudios posteriores han revelado que la diversidad microbiana reducida en el período neonatal se asocia con el desarrollo del eccema en el primer año de vida (Ismail 2012), el eccema con atopia en los primeros dos años de vida (Abrahamsson 2012) y el eccema asociado a la IgE en los primeros 18 meses (Wang 2008). Otro estudio halló que los pacientes con dermatitis atópica presentaban números mayores de Faecalibacterium prausnitzii asociados con niveles bajos de ácidos grasos de cadena corta, lo cual posiblemente da lugar a respuestas de las células T auxiliares tipo 2 (Th2) aberrantes (Song 2016).
Una intervención que se ha propuesto que influye en el microbioma de los intestinos es la administración de probióticos (Simonyte Sjödin 2016). Los probióticos pueden alterar la microbiota intestinal de los pacientes con eccema y pueden mejorar los signos y los síntomas del eccema. Son tratamientos efectivos para algunos trastornos gastrointestinales caracterizados por una alteración de la microbiota intestinal, como la diarrea (Guarino 2015). Alguna evidencia indica que pueden prevenir el desarrollo del eccema cuando se les administra durante el embarazo o en la infancia (Dang 2013; Doege 2012; Mansfield 2014; Zhu 2010). Su modo preciso de acción no está bien establecido. La investigación actual está centrada en los efectos inmunorreguladores de los probióticos. La evidencia indica que varias especies de probióticos estimulan los linfocitos T reguladores, que producen IL‐10 y factor de crecimiento tumoral (TGF)‐β, y controlan las células T auxiliares tipo 1 (Th1) y la inhibición de las respuestas Th2 (Vitaliti 2014). Las respuestas Th2 son particularmente predominantes en el eccema agudo y aumentan en el eccema crónico (Malik 2017).
Los probióticos se consumen ampliamente en todo el mundo en forma de leche fermentada y son un tratamiento potencialmente económico y accesible para el eccema. Aunque todos los probióticos tienen ciertas propiedades en común (patogenicidad baja, resistencia al ácido gástrico y la digestión de las sales biliares y adherencia a la mucosa intestinal), los efectos clínicos y de laboratorio pueden variar notablemente entre las especies (Allen 2003; Christensen 2002).
Por qué es importante realizar esta revisión
Los probióticos se han comercializado recientemente en la leche de fórmula y son recomendados por algunos profesionales para el tratamiento del eccema. Los consumidores los usan cada vez más para el tratamiento y la prevención de una variedad de trastornos y se han investigado formalmente en algunos de ensayos clínicos para el tratamiento del eccema. No obstante, su función en el tratamiento del eccema es polémica (Williams 2005), y la primera revisión Cochrane sobre los probióticos para el tratamiento del eccema indicó que los probióticos pueden no ser un tratamiento efectivo para el eccema aunque identificó áreas sobre las cuales faltaba evidencia (Boyle 2008). Además, los informes indican que los probióticos ocasionalmente pueden causar efectos adversos graves (Besselink 2008; De Groote 2005; Hennequin 2000; Land 2005). Por lo tanto, es importante evaluar formalmente la evidencia de la eficacia de los probióticos para el tratamiento del eccema. Desde que se publicó la primera revisión Cochrane sobre los probióticos para el tratamiento del eccema (Boyle 2008), los ensayos clínicos han seguido investigando la administración de probióticos para tratar el eccema, y ahora hay más datos disponibles para evaluar su eficacia. La primera revisión incluyó ensayos realizados sólo en niños y principalmente en Europa; ahora se dispone de datos de los ensayos realizados en adultos y en países asiáticos.
La justificación de esta revisión comprende lo siguiente:
-
El eccema es una enfermedad frecuente con una repercusión negativa en el paciente, su familia y comunidad.
-
Se necesitan nuevos tratamientos para el eccema.
-
Los probióticos se usan cada vez más para el tratamiento del eccema.
-
Se ha informado de casos de sepsis por probióticos.
-
Se han completado nuevos ensayos clínicos desde la publicación de la primera revisión Cochrane sobre los probióticos para el tratamiento del eccema, y es necesario evaluar nuevamente la evidencia sobre la administración de probióticos para el tratamiento del eccema.
Los planes para esta revisión se publicaron como un protocolo (Boyle 2006a), Esta Revisión Cochrane es una actualización de Boyle 2008.
Objetivos
Evaluar los efectos de los probióticos para el tratamiento del eccema en pacientes de todas las edades.
Métodos
Criterios de inclusión de estudios para esta revisión
Tipos de estudios
Ensayos controlados aleatorios (ECA) de probióticos para el tratamiento del eccema.
Tipos de participantes
Se incluyó a participantes de cualquier edad o sexo con eccema diagnosticado por un médico. No se incluyó a participantes con otras formas específicas de eccema como el eccema de contacto.
La revisión sistemática del National Health Service Technology Assessment de los tratamientos para el eccema usó términos específicos para identificar a los participantes del ensayo (Hoare 2000). Se utilizó una clasificación modificada de estos términos que se mencionan en la Tabla 1. Esta lista clasifica las formas de eccema incluidas en esta revisión y las formas específicas de eccema no incluidas en esta revisión. Uno de los autores (RB) seleccionó los estudios que usaron los términos en la categoría de “posible eccema atópico” (como “eccema infantil”) y sólo incluyó el estudio si la descripción de los participantes indicaba ausencia de formas específicas como “eccema alérgico de contacto”.
Tipos de intervenciones
Se incluyeron intervenciones con microorganismos vivos, incluidas las bacterias, los hongos o las levaduras, ingeridos solas o combinadas. No hubo restricciones en la duración de la intervención.
Los comparadores podían constar de ningún tratamiento, placebo u otra intervención activa sin probióticos. Se excluyeron los estudios que utilizaban otros microorganismos o productos microbianos como el único comparador. No se excluyeron de esta revisión los estudios que incluían un complemento del tratamiento activo (como los antibióticos, otro tratamiento dietético [p.ej. evitación de alérgenos, administración de suplementos de prebióticos] o tratamientos estándar del eccema como los corticosteroides tópicos).
Tipos de medida de resultado
Resultados primarios
-
Cambios en los síntomas del eccema calificados por el participante, calificados por el padre o calificados por el cuidador principal al final del tratamiento activo
-
Cambios en la calidad de vida al final del tratamiento activo
Resultados secundarios
-
Cambios en los síntomas del eccema calificados por el participante, calificados por el padre o calificados por el cuidador principal durante el período de seis meses después de la finalización del tratamiento activo
-
Cambios en la calidad de vida en el período de seis meses después de la finalización del tratamiento activo
-
Cambios en la necesidad de otro tratamiento del eccema durante el tratamiento activo o en el período de seis meses después de la finalización del tratamiento activo
-
Gravedad del eccema calificada por el investigador
-
Cambios en la gravedad global del eccema según lo medido por un investigador formado o un médico al final del tratamiento activo
-
Cambios en la gravedad global del eccema o cambio en el número de brotes del eccema según lo medido por los participantes, los padres, los cuidadores principales, o un médico en el período de seis meses después de la finalización del tratamiento activo
-
-
Cambios en el número de días de escolares o laborales perdidos debido a los síntomas del eccema durante el tratamiento activo
-
Eventos adversos durante el período de tratamiento activo
Para las medidas de resultado anteriores:
-
las mediciones de los síntomas del eccema calificadas por los padres o calificadas por los cuidadores principales y los cuestionarios de la calidad de vida se refieren a los resultados informados por el padre o el cuidador principal cuando el paciente no podía completar las puntuaciones (p.ej. debido a que el paciente es un lactante o un niño pequeño);
-
cuando estuvieron disponibles, se usaron los cambios en la gravedad del eccema calificados por el participante, los padres o el cuidador principal en lugar de las evaluaciones de síntomas del eccemas específicos;
-
se evaluaron los cambios en la calidad de vida según lo medido por los participantes, sus padres o el cuidador principal en una escala publicada (p.ej. Chren 1997; Finlay 1996); y
-
además de la evaluación de la gravedad global de los síntomas/la enfermedad, cuando estuvieron disponibles, se evaluaron los cambios en una escala de calificación compuesta con el uso de una escala publicada designada (p.ej., Severity Scoring of Atopic Dermatitis [SCORAD] (Kunz 1997)). Cuando no se disponía de esta escala, se evaluó la modificación por parte del autor de revisión de dicha escala o la escala de calificación compuesta.
Métodos de búsqueda para la identificación de los estudios
We aimed to identify all relevant RCTs regardless of language or publication status (published, unpublished, in press, or in progress).
Búsquedas electrónicas
For this update, we revised all our search strategies in keeping with current Cochrane Skin practices. We have provided details of the previous search strategies in Boyle 2008. This review fully incorporates the results of searches conducted up to 26 January 2017.
-
Cochrane Skin Group Specialised Register, using the search strategy in Appendix 1.
-
Cochrane Central Register of Controlled Trials (CENTRAL; 2016, Issue 11), in the Cochrane Library, using the strategy presented in Appendix 2.
-
Global Resource of EczemA Trials (GREAT) database (Centre of Evidence Based Dermatology; accessed at www.greatdatabase.org.uk), using the browse function → Dietary interventions → Probiotics.
-
MEDLINE via Ovid (from 1946), using the strategy provided in Appendix 3.
-
Embase via Ovid (from 1974), using the strategy delineated in Appendix 4.
-
PsycINFO via Ovid (from 1806), using the strategy shown in Appendix 5.
-
Allied and Complementary Medicine Database (AMED) via Ovid (from 1985), using the strategy described in Appendix 6.
-
Latin American and Caribbean Health Science Information database (LILACS) (from 1982), using the strategy presented in Appendix 7.
We identified three additional reports of relevant trials through an update search conducted on 30 January 2018. We have added those three results to Studies awaiting classification and will incorporate them into the review at the next update.
Trials registers
We searched the following trials registers up to 10 March 2018, using the terms "eczema", "probiotic", and "probiotics".
-
International Standard Randomized Controlled Trials Number (ISRCTN) registry (www.isrctn.com).
-
ClinicalTrials.gov (www.clinicaltrials.gov).
-
Australian New Zealand Clinical Trials Registry (www.anzctr.org.au).
-
World Health Organization International Clinical Trials Registry Platform (ICTRP) (www.who.int/trialsearch).
-
EU Clinical Trials Register (www.clinicaltrialsregister.eu).
Búsqueda de otros recursos
References lists
We checked the bibliographies of included studies and some reviews for further references to relevant RCTs.
Unpublished literature
When possible, we contacted trial authors and investigators for further information regarding the nature and status of identified studies.
Adverse events
We did not perform a separate search for adverse effects of probiotics for this update, but review authors conducted such a search for the first publication of this review. For this update, we considered adverse effects described in the included RCTs, and we reported the findings from the original additional adverse events search.
Handsearching
For this update, we handsearched the following conference proceedings.
-
European Academy of Allergology and Clinical Immunology Annual Meeting 2013 and 2014.
-
American Academy of Asthma, Allergy and Immunology Annual Meeting 2013 and 2014.
-
American Association of Immunologists Annual Meeting 2013, 2014, and 2015.
-
International Congress of Immunology 2013.
-
American Association of Dermatologists Annual Meeting 2013 and 2014.
-
International Investigative Dermatology Congress 2013.
-
International Symposium for Atopic Dermatitis 2014.
Obtención y análisis de los datos
Selección de los estudios
Two review authors (RB and AM) independently checked titles and abstracts identified through the searches. We excluded studies that did not refer to a randomised controlled trial of orally ingested probiotics for treating eczema. The same two review authors (RB and AM) independently assessed each study to determine whether it met the predefined selection criteria. When necessary, we contacted the authors of studies in deciding their eligibility for inclusion in the review. No major differences of opinion arose between the review authors. One study was published in Russian (Ivankhnenko 2013), one in Chinese (Guo 2015), and another in Polish (Cukrowska 2008). We assessed these studies after translation.
Extracción y manejo de los datos
Two review authors (RB and AM) independently extracted study data. No major differences of opinion arose, and it did not prove necessary for a third review author to arbitrate over data extraction. We contacted trial authors for all included studies, some excluded studies, and ongoing studies by email or by post to obtain complete data sets.
We piloted a data collection form and used this information to summarise the trials. Two review authors (JL and AM) checked and entered the data. When complete data sets were available from trial authors, we used these data to calculate summary statistics such as mean and standard deviation before performing data entry.
Evaluación del riesgo de sesgo de los estudios incluidos
Two review authors (RB and AM) independently assessed studies for risk of bias using the Cochrane 'Risk of bias' tool (Chapter 8.5, in Higgins 2011), rating them as having 'low', 'unclear', or 'high' risk of bias. No major differences of opinion arose, and it was not necessary for a third review author to arbitrate over risk of bias assessment. Assessment of risk of bias included the following.
-
Method of generation of the randomisation sequence (selection bias): considered low risk of bias if the randomisation sequence resulted in unbiased allocation to any of the study groups by investigators and to comparable study groups.
-
Method of allocation concealment (selection bias): considered 'low risk' if it was clear from publications or correspondence with trial authors that the treatment assignment of each consecutive study participant could not be anticipated by investigators. For example, if treatment allocation was done by a third party such as a pharmacy department, we considered allocation concealment to have low risk of bias.
-
Blinding of participants and personnel (performance bias): judged as low risk if we found adequate information to ensure that study personnel and participants could not have knowledge of the allocated intervention.
-
Blinding of outcome assessor (detection bias): judged as low risk if we found adequate information to exclude knowledge of the allocated intervention by outcome assessors.
-
Incomplete outcome data (attrition bias): considered rates of loss to follow‐up in total and in each study group, along with reasons for these, and whether participants were analysed in the groups to which they were originally randomised (available case analysis), whether any participants were excluded after randomisation, and whether data were imputed for participants lost to follow‐up. We judged low risk of bias when data were missing and reasons for missing data could not have a clinically relevant impact on the effect size.
-
Selective reporting: considered low risk when all predefined outcomes of the study have been reported.
-
Other bias: considered low risk if we could detect no other sources of bias.
We defined studies with overall low risk of bias as studies when the randomisation process was clear; allocation concealment was clear and done; participants, clinicians, or outcome assessors were blinded; and we detected no attrition bias
Quality assessment
We also assessed factors contributing to the quality of the included trials.
-
Whether or not study aims, interventions (including doses of viable probiotic used, mode of administration, and duration of treatment), and outcome measures were clearly defined.
-
Whether treatment compliance was assessed.
-
Whether non‐study probiotics were adequately excluded from participants' diets.
Medidas del efecto del tratamiento
We calculated a weighted pooled treatment effect across studies using a random‐effects model.
For dichotomous outcomes, we expressed the results as risk ratios (RRs) and 95% confidence intervals (CIs) for analyses containing only parallel‐group trials, and we used odds ratios (ORs) when we included in the meta‐analysis data from both cross‐over and parallel‐group studies, because the method used for combining parallel‐group and cross‐over study findings in meta‐analysis did not allow findings to be expressed as RRs (Elbourne 2002). For analyses that included both cross‐over and parallel‐group studies, we combined conditional (paired) ORs from cross‐over studies with ORs from parallel‐group studies to estimate pooled ORs. We used conditional ORs because they can be used to pool data from cross‐over studies with data from parallel‐group studies (Duffy 1989).
We used mean differences (MDs) and 95% CIs or standardised mean differences (SMDs) and 95% CIs to express results for continuous outcomes. When studies reported participant‐ or investigator‐rated symptoms on categorical scales (e.g. Passeron 2006), we made the data dichotomous by defining a cutoff at good improvement in eczema versus mild improvement, no change, or worsening of eczema.
Trial sequential analysis
For this review update, we used post hoc retrospective trial sequential analysis (TSA) for our first primary outcome.
Meta‐analyses carry risk of type I errors (false significant results) due to limited data from few and small trials and repetitive testing on updates as data from new trials accumulate (Brok 2008; Wetterslev 2008). TSA is a method that quantifies the statistical reliability of data within a meta‐analysis (Brok 2009; Wetterslev 2009). We estimated information size (IS, i.e. the least number of participants needed for a statistically significant result) based on the mean difference derived through clinical consensus, using a two‐sided 5% significance level and 90% power, and we diversity‐adjusted the data to reflect the quantity of heterogeneity by performing a random‐effects meta‐analysis. For estimation of the mean in the control group, which is a necessary step during TSA, we pooled control event rates for any low risk of bias trials contributing to the relevant meta‐analysis. In TSA, when the cumulative z‐curve crosses the trial sequential monitoring boundary, sufficient evidence of an association can be concluded and no further trials are needed. However, if the cumulative z‐curve does not cross the boundary and the IS is not reached, evidence is insufficient to reach a conclusion and further trials are required.
Other Cochrane groups have used TSA in their reviews (e.g. Allingstrup 2016 ‐ Cochrane Anaesthesia, Critical and Emergency Care Group). We used post hoc TSA for our first primary outcome ‐ changes in participant‐, parent‐, or principal carer‐rated symptoms of eczema at the end of treatment (TSA software).
Cuestiones relativas a la unidad de análisis
We followed guidance from the Cochrane Handbook for Systematic Reviews of Interventions in addressing unit of analysis issues (Chapters 9 and 16, in Higgins 2011).
Cross‐over trials
When possible, we initially analysed cross‐over trials using appropriate paired analyses to estimate paired MDs (continuous outcomes) and paired ORs (dichotomous outcomes) with standard errors. We then combined outcome data from cross‐over trials and parallel‐group trials using the generic inverse variance method. We also analysed data from parallel‐group trials and cross‐over trials as separate subgroups, because cross‐over studies may not be appropriate for probiotic studies, as the duration of treatment effect is not well established.
Studies with multiple treatment groups
When studies reported more than one active intervention arm, we combined the two active interventions and analysed them together. We also analysed data from these studies in a separate stratified analysis to assess the effects of different strains of the probiotics.
Trials reporting non‐parametric statistics
When trials reported non‐parametric summary statistics, we attempted to convert data to parametric summary statistics by assuming that the reported median was the mean, and we estimated the standard error as interquartile range (IQR)/1.35 (Chapter 7.7.3.5, in Higgins 2011); however, we acknowledge that these are strong assumptions because many of the included trials did not include large sample sizes. Therefore we have added cautionary notes when we believe the impact of these assumptions could have strongly influenced the overall findings of the meta‐analysis. When non‐parametric statistics could not be converted to parametric statistics, we presented the data in an additional table (Table 2).
Manejo de los datos faltantes
We assessed pooled data using available case analysis rather than intention‐to‐treat analysis with imputation. When the nature of missing data was not clear, we contacted study authors for clarification. When studies failed to report summary statistics such as standard deviations, we contacted trial authors for further information.
Evaluación de la heterogeneidad
We assessed statistical heterogeneity using I². When we found substantial statistical heterogeneity between studies (I² > 50%), we explored possible reasons for this heterogeneity, including participant factors such as disease severity, treatment factors such as probiotic strain or dose, and study factors such as methodological quality criteria as described above. When we detected extreme levels of statistical heterogeneity between trials (e.g. I² > 85%), we considered whether it was appropriate to pool studies by considering their clinical and methodological differences.
Evaluación de los sesgos de notificación
We performed formal assessment of reporting bias using a funnel plot for continuous outcomes when the number of studies with data available for inclusion in primary analyses was greater than 10, and we performed statistical assessment using Egger's test.
Síntesis de los datos
When studies employed different tools to measure the same outcome, we calculated a pooled estimate of effect across studies using standardised mean differences (SMDs) and 95% CIs. When it was not possible to perform a meta‐analysis, we described the findings narratively.
Análisis de subgrupos e investigación de la heterogeneidad
We planned the following stratified analyses for this review.
-
Analysis by age (under 2 years vs 2 to 12 years vs over 12 years).
-
Concurrent treatment with antibiotics versus no concurrent treatment with antibiotics.
-
Atopic versus non‐atopic study participants, with atopy defined as at least one positive skin prick test (SPT) or radioallergosorbent test (RAST) to a common allergen.
-
Participants with a formally diagnosed (i.e. double‐blind placebo‐controlled food challenge) food allergy versus those without a formally diagnosed food allergy.
-
Participants with evidence of intestinal inflammation versus those without such evidence.
-
Participants with mild eczema (SCORAD < 15) versus moderate eczema (SCORAD 15 to 40) versus severe eczema (SCORAD > 40) at baseline.
We performed stratified analysis rather than subgroup analysis for the following reasons.
-
Some strata included small numbers of studies.
-
When differences were present, they were clearer to the observer.
-
Subgroup analysis assumes a fixed‐effect model, and the high heterogeneity seen even with subgroups suggests that this is not appropriate.
-
This approach is consistent with the approach used in the previous version of this review.
-
Use of multiple stratified analyses means that interpretation of 'significant' subgroup tests would be problematic due to the risk of chance spurious findings.
-
Several of the stratified analyses included more than one group with the same participant count, for example, in the 'any Lactobacillus species' group and in the 'other specific Lactobacillus species' groups.
Análisis de sensibilidad
When appropriate, we performed sensitivity analyses to examine the effects of excluding poor quality studies, defined as studies for which the randomisation process is unclear; allocation concealment is not clear or was not done; participants, clinicians, or outcome assessors were not blinded; no intention‐to‐treat analysis was performed; or risk of attrition bias is high.
We also performed, when appropriate, sensitivity analyses based on changes in scores from baseline to end of treatment to examine the effects of studies with baseline differences in eczema severity.
Assessment of quality of evidence
We applied the GRADE approach for the main comparisons to rate the quality of evidence for the prespecified outcomes included in Summary of findings table 1 (Atkins 2004). We selected our primary outcomes; the secondary outcome 'Changes in global eczema severity as measured by a trained investigator or a medical practitioner at the end of active treatment'; and adverse events for inclusion in the Summary of findings table 1.
Other
For this update, our consumer co‐author (AR) contributed to enhance the readability and clarity of the completed review.
Results
Description of studies
Results of the search
We updated the Electronic searches and fully incorporated the results to 26 January 2017. We identified 477 records from eight databases, five trials registers, and other sources. After removing duplicates, we (AM and RB) screened 472 records. We excluded 423 based on titles and abstracts, leaving a total of 49. Of these, six are ongoing studies (see Characteristics of ongoing studies), and five studies are awaiting classification (see Characteristics of studies awaiting classification).
We screened the remaining 38 records in full text when available. We excluded 11 records (see Characteristics of excluded studies). Combined with the eight studies excluded from the previous version of this review, the total of excluded studies is 19. We included 27 new studies. We identified 12 included studies in the earlier version of this review, for a total of 39 included studies overall (see Characteristics of included studies).
We identified three of the studies awaiting classification through an update search conducted on 30 January 2018 (Hulshof 2017; NCT02585986; Prakoeswa 2017). We have not fully assessed these, and we will incorporate them into the review at the next update.
We have presented the study flow diagram in Figure 1.
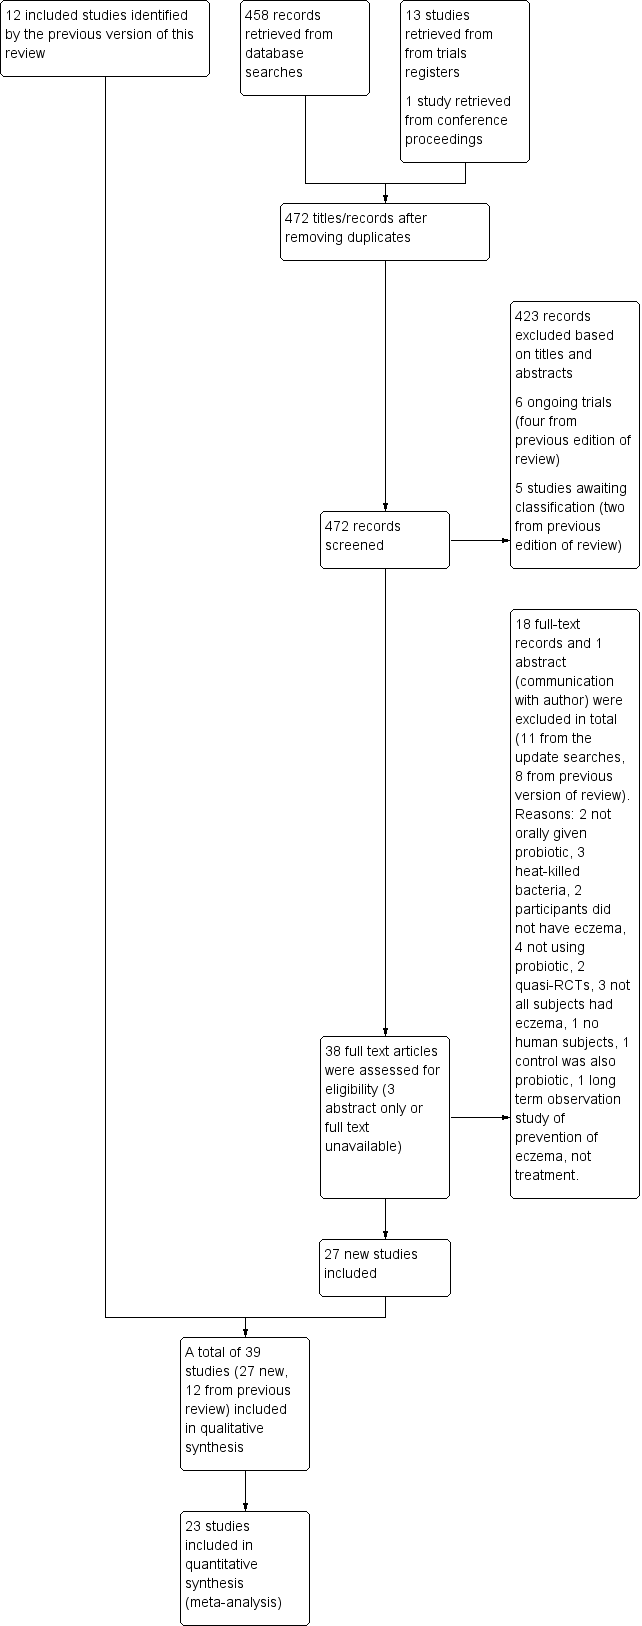
Study flow diagram.
Included studies
We included 39 studies with 2599 participants (12 studies with 781 participants from the first review, and 27 new studies with 1818 participants identified for this update) and have described all studies in the Characteristics of included studies section.
The authors of seven studies supplied complete data sets (Brouwer 2006; Goebel 2010; Han 2012; Passeron 2006; Rosenfeldt 2003; Sistek 2006; Weston 2005). The authors of five studies supplied summary data (Drago 2014; Flinterman 2007; Nermes 2010; Roessler 2007; Viljanen 2005). The authors of four studies responded to our requests by clarifying some questions relevant to their studies but did not provide additional data (Drago 2012; Iemoli 2012; Van der Aa 2010; Wang 2015). We received no response to requests for information from the authors of 17 studies (Cukrowska 2008; Farid 2011; Folster‐Holst 2006; Gruber 2007; Guo 2015; Isolauri 2000; Ivankhnenko 2013; Lin 2015; Majamaa 1997; Matsumoto 2014; Shafiei 2011; Taniuchi 2005; Woo 2010; Wu 2012; Wu 2015; Yang 2014; Yesilova 2012). The authors of one study responded that they were unable to supply their data for meta‐analysis (Kirjavainen 2003). We could not contact the authors of four studies (Gerasimov 2010; Hol 2008: invalid contact details; Gromert 2009: no contact details found; Yoshida 2010: no contact details found and no response from Sponsor Tokiwa Pharmaceuticals).
Design
All studies were randomised controlled trials; 37 were parallel‐group trials, and two were cross‐over trials.
Sample sizes
Studies involved sample sizes ranging from 13 to 252 participants.
Setting
Studies took place in primary or secondary care settings at European (24 studies), Australian and New Zealand (two studies), and Asian (13 studies in Korea, China, Iran, Japan, and Taiwan) centres.
Participants
Studies evaluated probiotics in children and adults of both genders. We could not calculate an accurate male/female ratio because data from some studies are not available. Participants in 14 studies were under the age of 18 months, and overall 33 studies assessed children up to the age of 18. The remaining six studies assessed only adults. Study authors did not mention the skin type of participants, and particularly did not mention whether studies included participants with skin of colour. All studies included participants with doctor‐diagnosed eczema.
Nineteen studies stated that eczema was diagnosed based on the criteria provided by Hanifin and Rajka. In three studies, the diagnosis was based on the UK Working Party criteria. In two studies, the diagnosis was based on the Consensus Guidelines for Diagnosis and Management of Atopic Dermatitis (Eichenfield 2004). One study used the definition of atopic eczema dermatitis syndrome (AEDS) for diagnosis. Another study based the diagnosis on the Guidelines for Management of Atopic Dermatitis provided by the Japanese Dermatological Association. In one study, the diagnosis was based on Erlangen score > 10 (atopic score of Diepgen) (Diepgen 1996). One study stated that the diagnosis of eczema was based on diagnostic criteria but did not specify which ones, and 11 studies did not specify the diagnostic criteria applied.
The severity of participants' eczema ranged from mild to severe. Eighteen studies did not prespecify the severity of eczema among participants (Brouwer 2006; Cukrowska 2008; Drago 2014; Flinterman 2007; Folster‐Holst 2006; Goebel 2010; Guo 2015; Hol 2008; Isolauri 2000; Ivankhnenko 2013; Kirjavainen 2003; Lin 2015; Majamaa 1997; Nermes 2010; Rosenfeldt 2003; Taniuchi 2005; Viljanen 2005; Yoshida 2010). Nine studies recruited participants with moderate to severe eczema (Drago 2012; Gerasimov 2010; Iemoli 2012; Matsumoto 2014; Shafiei 2011; Wang 2015; Weston 2005; Wu 2012; Yesilova 2012). Another study recruited participants with mild to severe eczema (Farid 2011). Nine studies recruited participants with eczema scored above a minimum Severity Scoring of Atopic Dermatitis (SCORAD) value (Gore 2011; Gruber 2007; Han 2012; Passeron 2006; Roessler 2007; Sistek 2006; Van der Aa 2010; Woo 2010; Wu 2015; with minimum SCORAD ≥ 10, 15 to 40, 20 to 50, 5 to 30, > 15, ≥ 25, ≥ 15, ≥ 10, and ≥ 15, respectively). One study recruited participants with moderate eczema (Gromert 2009). Another study recruited participants with mild to moderate eczema (Yang 2014).
Three studies assessed only children who had atopic eczema (Flinterman 2007; Sistek 2006; Wang 2015), and one study assessed only children with low levels of Bifidobacteria in their faeces (Taniuchi 2005).
Interventions
Twenty‐three studies used a single strain of probiotic with or without prebiotic (Brouwer 2006; Drago 2012; Drago 2014; Folster‐Holst 2006; Goebel 2010; Gore 2011; Gromert 2009; Gruber 2007; Han 2012; Isolauri 2000; Kirjavainen 2003; Lin 2015; Majamaa 1997; Matsumoto 2014; Nermes 2010; Passeron 2006; Taniuchi 2005; Van der Aa 2010; Weston 2005; Woo 2010; Wu 2012; Wu 2015; Yoshida 2010): 15 of these used Lactobacillus (L) species (L rhamnosus, L salivarius,L reuteri,L GG,L plantarum,L fermentum,L sakei) (Brouwer 2006; Drago 2012; Drago 2014; Folster‐Holst 2006; Gromert 2009; Gruber 2007; Han 2012; Kirjavainen 2003; Majamaa 1997; Nermes 2010; Passeron 2006; Weston 2005; Woo 2010; Wu 2012; Wu 2015); five used Bifidobacterium species (B lactis, B bifidum, B breve) with or without prebiotic (Lin 2015; Matsumoto 2014; Taniuchi 2005; Van der Aa 2010; Yoshida 2010); and three included one arm treated with Lactobacillus species and one with Bifidobacterium species (Goebel 2010; Gore 2011; Isolauri 2000).
Fifteen studies used probiotic mixtures of mainly Lactobacillus and Bifidobacteria species with or without prebiotic (Cukrowska 2008; Farid 2011; Flinterman 2007; Gerasimov 2010; Hol 2008; Iemoli 2012; Ivankhnenko 2013; Roessler 2007; Rosenfeldt 2003; Shafiei 2011; Sistek 2006; Viljanen 2005; Wu 2015; Yang 2014; Yesilova 2012). One study had three arms, all treated with Lactobacillus species (L paracasei,L fermentum); two arms used a single strain, and the third arm used a combination of the two strains (Wang 2015).
Trials identified no standard dose, and researchers used a variety of doses and concentrations of probiotics. They measured the daily dose most often in colony‐forming units (CFUs)/d or CFU/dose or CFU/gr or 100 mL of formula. Concentrations of probiotic bacteria varied from 10⁷/gr formula to 7.8 × 10¹⁰/d for different strains. One study reported the dose of probiotics in mgr (Wu 2015), and two studies gave no information on the concentrations of probiotics used (Guo 2015; Lin 2015).
Co‐interventions included extensively hydrolysed infant formula and prebiotic (Taniuchi 2005; Van der Aa 2010), extensively hydrolysed formula and elimination diets (non‐dairy, cow’s milk, or egg elimination diet) (Brouwer 2006; Gore 2011; Majamaa 1997; Viljanen 2005), extensively hydrolysed formula only (Hol 2008; Isolauri 2000; Kirjavainen 2003; Nermes 2010), a prebiotic (Farid 2011; Passeron 2006; Shafiei 2011; Wu 2012), and elimination diet alone (Cukrowska 2008; Ivankhnenko 2013). Placebo groups received the co‐intervention alone (Hol 2008; Kirjavainen 2003; Nermes 2010; Taniuchi 2005; Van der Aa 2010; Wu 2012), or they were given microcrystalline cellulose alone or with the study’s formula (Folster‐Holst 2006; Sistek 2006; Viljanen 2005; Wang 2015; Woo 2010), maltodextrin alone or with rice starch or anhydrous glucose or cellulose and silicone dioxide (Drago 2012; Drago 2014; Flinterman 2007; Gerasimov 2010; Goebel 2010; Gore 2011; Han 2012; Iemoli 2012; Weston 2005; Wu 2015), hydrolysed casein (Cukrowska 2008), skim milk powder with either dextrose or potato starch and lactose and prebiotic, sucrose, skim milk with glucose, inulin, dextrin, and silicon dioxide (Matsumoto 2014; Rosenfeldt 2003; Yesilova 2012), or glucose anhydrous crystalline powder (Yang 2014).
Seven studies did not specify the placebo (Brouwer 2006; Farid 2011; Gromert 2009; Gruber 2007; Ivankhnenko 2013; Roessler 2007; Yoshida 2010). One study provided no placebo, and the control group received no treatment (Lin 2015), and another study provided no placebo but participants in the control arm used the same topical treatment as those in the intervention arm (Guo 2015).
Outcomes
From 13 studies (Goebel 2010; Gruber 2007; Han 2012; Nermes 2010; Passeron 2006; Roessler 2007; Rosenfeldt 2003; Sistek 2006; Weston 2005; Woo 2010; Wu 2012; Yang 2014; Yoshida 2010), we obtained data for the first primary outcome of the review: changes in participant‐, parent‐, or principal carer‐rated symptoms of eczema at the end of active treatment. Five studies reported participant‐ or parent‐rated changes from baseline in eczema symptom scores at the end of active treatment (SCORAD part C or visual analogue scale (VAS) scores for pruritus and sleep loss) (Gerasimov 2010; Gruber 2007; Weston 2005; Wu 2015; Yang 2014), and the authors of four trials provided unpublished data for that outcome (Goebel 2010; Han 2012; Passeron 2006; Rosenfeldt 2003). Three of these studies reported parent‐ or participant‐rated overall change in eczema severity during study treatment (Passeron 2006; Rosenfeldt 2003; Weston 2005). One study (abstract only) reported this change narratively (Gromert 2009).
For the second primary outcome ‐ changes in quality of life at the end of active treatment ‐ 10 studies reported quality of life measures (Dermatology Life Quality Index (DLQI), Infant's Dermatology Quality of Life Index (IDQoL), Children's Dermatology Life Quality Index (CDLQI), Dermatitis Family Impact Scale (DFI), Skindex‐29) (Drago 2012; Gerasimov 2010; Gore 2011; Folster‐Holst 2006; Iemoli 2012; Wang 2015; Weston 2005; Wu 2012; Wu 2015; Yoshida 2010), and one study reported quality of life changes using a non‐validated questionnaire (Matsumoto 2014).
Three studies reported outcomes relevant to the first secondary outcome of the review ‐ changes in participant‐, parent‐, or principal carer‐rated symptoms of eczema within six months after active treatment had ceased (Han 2012; Sistek 2006; Weston 2005).
Three studies reported data relevant to the secondary outcome ‐ changes in quality of life within six months after active treatment has ceased (Iemoli 2012; Wang 2015; Weston 2005).
Eleven studies reported assessments of the need for other eczema treatment during the study intervention (Folster‐Holst 2006; Gerasimov 2010; Gore 2011; Gruber 2007; Han 2012; Rosenfeldt 2003; Van der Aa 2010; Weston 2005; Woo 2010; Wu 2012; Wu 2015), and two studies (one abstract only) reported this outcome narratively (Gromert 2009; Wang 2015).
For the fourth secondary outcome of the review, investigator‐rated eczema severity, 32 studies reported global eczema severity scores (total SCORAD index as absolute score or change from baseline) (Brouwer 2006; Cukrowska 2008; Drago 2012; Drago 2014; Farid 2011; Folster‐Holst 2006; Gerasimov 2010; Goebel 2010; Gore 2011; Gruber 2007; Han 2012; Hol 2008; Iemoli 2012; Ivankhnenko 2013; Lin 2015; Majamaa 1997; Nermes 2010; Passeron 2006; Roessler 2007; Rosenfeldt 2003; Shafiei 2011; Sistek 2006; Van der Aa 2010; Viljanen 2005; Wang 2015; Weston 2005; Woo 2010; Wu 2012; Wu 2015; Yang 2014; Yesilova 2012; Yoshida 2010), and one study provided unpublished data (Flinterman 2007). Eight studies reported investigator‐rated eczema severity scores (EASI, SCORAD part A/B, categorical presentation of total SCORAD changes) (Cukrowska 2008; Majamaa 1997; Passeron 2006; Shafiei 2011; Weston 2005; Woo 2010; Yang 2014; Yoshida 2010), and the authors of four trials provided unpublished data on this outcome (Brouwer 2006; Goebel 2010; Han 2012; Sistek 2006). One study (abstract only) reported investigator‐rated changes in eczema severity narratively only (Gromert 2009). Twelve studies reported outcomes for changes in eczema severity within six months after treatment had ceased (Cukrowska 2008; Folster‐Holst 2006; Han 2012; Iemoli 2012; Isolauri 2000; Ivankhnenko 2013; Majamaa 1997; Roessler 2007; Sistek 2006; Viljanen 2005; Wang 2015; Weston 2005). One study reported the rate of recurrence within three months after the end of treatment (Guo 2015).
Eleven studies reported adverse events (Folster‐Holst 2006; Gerasimov 2010; Gore 2011; Gruber 2007; Matsumoto 2014; Passeron 2006; Sistek 2006; Wang 2015; Weston 2005; Wu 2012; Wu 2015), and four studies mentioned them (Drago 2012; Farid 2011; Iemoli 2012; Shafiei 2011).
Excluded studies
We excluded from the review 19 publications reporting RCTs; we have described these in the Characteristics of excluded studies section.
For three studies (Burk 2013; Ou 2012; Rose 2010), we could not ascertain whether all participants had eczema.
In two studies (Arkwright 2003; Gueniche 2008), interventions were given topically, not orally as defined in the protocol of this review.
In four studies, the intervention was not a probiotic, but this was not clear from the published abstracts (Foekel 2009; Ikezawa 2004; Leung 2004; Shibata 2009).
Two studies were quasi‐RCTs (Aryayev 2006; Chernysov 2009).
In one study, the control was also a probiotic (Matsumoto 2007), and three studies used heat‐killed bacteria (Moroi 2011; Murosaki 2006; Torii 2011); we excluded these studies because they did not fulfil the criteria set in the review protocol for included studies.
One study did not study probiotics in humans (Ogawa 2006).
One study was a follow‐up study of probiotics used for prevention, not treatment, of eczema (Laitinen 2005).
In two studies (Arvola 2006; Kalliomaki 2003), participants did not have eczema.
Ongoing studies
Among the "ongoing studies" identified for the first review, the Land study (NCT00378300) was withdrawn before recruitment started because of lack of funding.
We identified four ongoing trials for this update: one examining a probiotic (IRT5) for the treatment of atopic dermatitis conducted in Korea and currently recruiting (KCT0000914; which started in November 2013); one conducted in Brazil to study a mixture of probiotics for atopic dermatitis in children (NCT02519556; which is recruiting); one undertaken in Spain to study probiotics in children (NCT02585986a; which started in January 2016 and has completed recruitment); and one reported from Italy to study Lactobacillus reuteri and vitamin D in children with atopic dermatitis (NCT02945683; which is currently recruiting) (see Characteristics of ongoing studies).
Studies awaiting classification
We have identified four trials awaiting classification. One study from Australia studied probiotics in the management of eczema with a start year of 2004 (ACTRN12605000615684). The current status is unknown. We contacted the investigators but have received no response. One trial from the Netherlands studied the use of amino acid‐based formula with synbiotics in infants with non‐IgE‐mediated cow's milk allergy (Candy 2016). Some of the participants have eczema, and SCORAD measurement is one of the secondary outcomes. Researchers have not yet presented results for clinical outcomes of the study (see Characteristics of studies awaiting classification).
Risk of bias in included studies
We have presented review authors' judgement for each risk of bias item across all studies in the 'Risk of bias' graph (Figure 2), and for each study in the 'Risk of bias' summary (Figure 3). We have presented in Table 3 the review authors' quality assessment of other parameters of the included studies (clarity of statement of aims, interventions and outcomes, compliance assessment, exclusion of non‐study probiotics).

Risk of bias graph: review authors' judgements about each risk of bias item presented as percentages across all included studies.

Risk of bias summary: review authors' judgements about each risk of bias item for each included study.
| Study | Clarity of methods | Compliance | Dietary management |
| Clear | No compliance measures described | Adequate exclusion of other probiotics during the study | |
| Total daily dose of intervention clear, but individual dose, frequency, and mode of administration not given | No compliance measures reported | Not stated | |
| Clear | Dose count (returned sachet packets counted by clinical investigator). Compliance measured for the 2 groups: 84.5% and 84.7%. No significant difference | Clear instructions given: no change in usual diet but avoid any type of fermented food containing live micro‐organisms | |
| Clear | No information provided | No information provided | |
| Aims and Interventions clear. Outcomes not clear and baseline severity (SCORAD) not given | No information given | Inadequate information | |
| Aims, interventions clear | Inadequate information | Inadequate information | |
| Clear | No compliance measures reported | Not stated | |
| Total daily dose of probiotics not clear. Remaining methods clear | Compliance checked from the parental report and the weight of remaining powder. Reported that there were no differences in compliance between the 2 groups | No information on adequate exclusion of other probiotics from the diet. Participants with challenge proved milk or egg allergy followed milk or egg elimination diet, respectively | |
| Clear | Compliance based on count of remaining capsules: average 94% for all groups and 93.6%, 95%, and 93.3% for Bifidobacterium, Lactobacillus, and placebo groups, respectively. No significant difference in compliance between the 3 groups (P = 0.6). No participating child had compliance lower than 72% | No information given | |
| All methods clear Reporting of adverse events suggests that these were the result of the change in formula but the numbers are totals from intervention and control groups, and it is not certain whether the AEs are associated with the formula or the probiotics | No compliance measures reported | Instructions given that other fermented or probiotic‐containing products were to be avoided | |
| Inadequate information available | No information | No information | |
| Unclear what the placebo was; otherwise clear | 92.5% of doses taken by probiotic group; 94.4% by placebo group | Not stated, other than encouragement to avoid allergens | |
| Dose and exact consistency of probiotics unclear | No information | No information | |
| Preparation of the intervention not clear. Otherwise clear | No compliance measure described | Clear instructions not to consume fermented food and products containing live micro‐organisms | |
| Trial designed to study effects of probiotics in participants with cow's milk allergy. Effects of probiotics on eczema ‐ secondary outcome. Aims, interventions, and outcome measures clear | Compliance measure not presented. "To optimise compliance, participants were supplied with study formula through the study team and batches were delivered at home" | No information provided | |
| Clear | Method: count of return sachets. Reported that compliance was similar in the 2 groups but no measures reported | Instructions given so that participants do not change their diet during trial but should avoid fermented food products containing live micro‐organisms | |
| Unclear ‐ dose and duration of probiotic treatment received not clearly described. Severity of participant eczema at baseline not described | No compliance measures reported | Not stated | |
| Placebo not described. Otherwise methods clear | No compliance measures reported | Not stated | |
| Unclear ‐ intended duration of study treatment not stated | No compliance measures reported | Not stated | |
| Exact dose of probiotics not given | No information provided | No information provided | |
| Unclear ‐ precise dose of probiotic received by participants not stated | No compliance measures described | Not stated | |
| Clear | No information provided | Clearly stated: "All patients were asked to avoid probiotic supplements, fermented milk, lactic acid bacterial drinks and fermented soybean (natto) during the experimental period…" | |
| Clear | No compliance measures reported | Not stated | |
| Clear | No compliance measures described | Not stated | |
| Clear | No compliance measures described | Adequate exclusion of prebiotics and probiotics 3 weeks before the start and during the 20 weeks of the intervention | |
| Clear | No compliance measures described | Adequate exclusion of other probiotics during study | |
| Intervention type not clear: synbiotic mixture of 7 strains of probiotics and fructo‐oligosaccharide. Dose, frequency of intake, and preparation clear Baseline characteristics given only for participants who completed the trial | No compliance measures reported | Unclear. Stated that participants did not change diet before or during the trial | |
| Clear | Assessed by 2 telephone calls | One participant noted to have taken non‐study probiotic | |
| Clear | No compliance measures described | Not stated | |
| Clear | No compliance measures reported. Participants' parents were keeping diary for formula intake and adverse events. Formula with intervention was given on demand and at the end of intervention. No significant differences in formula intake were noted between the 2 groups | Unclear | |
| Method for diagnosing eczema not described | No compliance measures described | Not stated | |
| All clear. In the publication, not clear what the placebo was, but this was clarified by the study author | Yes: capsule count performed | Yes Stated: "During the study…and other probiotics were not permitted" | |
| Clear | Sachet counts and parent‐completed sachet administration chart. Good compliance (94%) ‐ no differences between the 2 groups | Adequate exclusion of other probiotics during study | |
| Clear | No measure of compliance was reported, but it was stated that the 2 groups had no difference in compliance | No information provided | |
| Aims, interventions, and outcome measures clear. Exclusion criteria not given | Patients and parents were to return to investigators all unused intervention. No measure was reported | Instruction given to parents not to feed their children other probiotic preparations during the intervention | |
| Aims, interventions, and outcome measures clear. Dose of probiotic not given in colony‐forming units, or similar measure of bacterial numbers | Compliance recorded: assessed based on a count of returned medication | No information provided | |
| All clear | No information given | Instructions given to avoid any commercial probiotic‐containing products 2 weeks before study initiation. No comment about diet during the trial | |
| All clear | No information provided | No information provided | |
| Placebo not described. Otherwise clear | No compliance measures reported | No information given |
SCORAD: Severity Scoring of Atopic Dermatitis.
Allocation
Random sequence generation
For 20 studies, we judged the method used in generating the randomisation sequence as having low risk of bias, and for 17 of those (Drago 2012; Drago 2014; Gerasimov 2010; Goebel 2010; Han 2012; Hol 2008; Iemoli 2012; Passeron 2006; Roessler 2007; Shafiei 2011; Sistek 2006; Van der Aa 2010; Viljanen 2005; Wang 2015; Weston 2005; Wu 2012; Yang 2014), the randomisation sequence was computer generated. For 19 studies, trial authors did not describe the method used in generating the randomisation sequence, so we judged these studies as having unclear risk of bias; this group included one trial in which trial authors provided no information on the randomisation sequence generation method used, although we judged treatment allocation as adequate (Yesilova 2012). We found no trials to be at high risk of bias for random sequence generation.
Allocation concealment
Authors of 25 studies did not describe concealment of treatment allocation, and we judged risk of bias as unclear for this domain (Brouwer 2006; Cukrowska 2008; Drago 2014; Farid 2011; Folster‐Holst 2006; Gerasimov 2010; Gore 2011; Gromert 2009; Gruber 2007; Guo 2015; Hol 2008; Isolauri 2000; Ivankhnenko 2013; Kirjavainen 2003; Lin 2015; Majamaa 1997; Matsumoto 2014; Nermes 2010; Roessler 2007; Rosenfeldt 2003; Shafiei 2011; Taniuchi 2005; Woo 2010; Wu 2015; Yoshida 2010).
We considered 14 trials to have low risk of selection bias due to allocation concealment. One trial described treatment allocation by the "closed envelope method", which we judged as adequate (Yesilova 2012). For the remaining 13 included studies, we did not consider treatment allocation concealment adequate because the allocating process excluded access to the randomisation sequence and knowledge of the treatment given (Drago 2012; Flinterman 2007; Goebel 2010; Han 2012; Iemoli 2012; Passeron 2006; Sistek 2006; Van der Aa 2010; Viljanen 2005; Wang 2015; Weston 2005; Wu 2012; Yang 2014). For 10 of these studies, a pharmacy department or a blinded investigator provided treatment using a computer‐generated randomisation sequence (Drago 2012; Han 2012; Iemoli 2012; Passeron 2006; Sistek 2006; Van der Aa 2010; Viljanen 2005; Wang 2015; Weston 2005; Yang 2014). These studies adequately concealed treatment allocation ‐ the third party was not involved in screening or enrolling participants, and the clinical trial staff enrolling participants did not have access to the randomisation sequence. One study gave sealed boxes with allocation numbers to participants using a randomisation table (Flinterman 2007). Two studies packed treatment in numbered sealed boxes and gave them to participants using a computer‐generated randomisation sequence (Goebel 2010; Wu 2012).
We found no studies at high risk of bias for allocation concealment.
Blinding
We judged studies to be at low risk of performance bias when trial authors provided enough information to exclude knowledge of the allocated intervention by participants or parents and personnel involved in the trial. We judged studies to be at low risk of detection bias when trial authors provided enough information to exclude knowledge of the allocated intervention by outcome assessors, but also by participants or parents for participant‐ or parent‐rated outcomes.
One study was not blinded (open‐label), so we judged it to be at high risk of bias in both domains (Ivankhnenko 2013). We judged another study to be at high risk of performance bias because trial authors did not mention blinding and the control group received no treatment and no placebo; hence we determined it was unlikely that blinding was done (Lin 2015). The same study provided inadequate information on blinding of the outcome assessor, and so we judged this study to be at unclear risk of detection bias.
We judged 16 studies to be at low risk for both performance and detection bias (Drago 2012; Drago 2014; Flinterman 2007; Goebel 2010; Gore 2011; Han 2012; Hol 2008; Iemoli 2012; Nermes 2010; Passeron 2006; Roessler 2007; Sistek 2006; Van der Aa 2010; Viljanen 2005; Wang 2015; Wu 2012). Authors of eight of these studies stated that participants, clinicians, and outcome assessors were all blinded (Drago 2012; Gore 2011; Hol 2008; Roessler 2007; Sistek 2006; Van der Aa 2010; Wang 2015; Wu 2012). For another eight studies, we confirmed blinding of participants, clinicians, and outcome assessors through communication with trial authors (Drago 2014; Flinterman 2007; Goebel 2010; Han 2012; Iemoli 2012; Nermes 2010; Passeron 2006; Viljanen 2005).
We judged 18 studies to be at unclear risk of both performance and detection bias. Of these, trial authors described 14 studies as "double‐blind" without further clarification or provided no information on blinding (Brouwer 2006; Cukrowska 2008; Gromert 2009; Gruber 2007; Guo 2015; Isolauri 2000; Kirjavainen 2003; Majamaa 1997; Matsumoto 2014; Rosenfeldt 2003; Taniuchi 2005; Woo 2010; Wu 2015; Yoshida 2010). The remaining four studies provided information on some parts of the study but not on blinding of all participants/parents, clinicians, and outcome assessors (Folster‐Holst 2006; Weston 2005; Yang 2014; Yesilova 2012).
We judged Farid 2011 as having unclear risk of performance bias, as study authors did not provide enough information, but low risk of detection bias. Two studies provided enough information, and we judged them to be at low risk of performance bias, but information on outcome assessment was inadequate, and we judged them to be at unclear risk of detection bias (Gerasimov 2010; Shafiei 2011).
Incomplete outcome data
Follow‐up and exclusions
In this domain, we assessed rates of and reasons for losses to follow‐up for overall participants and for each intervention group, as well as exclusions from analysis for all outcomes.
We judged 24 studies to be at low risk of attrition bias with low rates of loss to follow‐up overall (ranging from 0 to 14%) and for each intervention group, and low exclusion rates (Brouwer 2006; Drago 2012; Drago 2014; Flinterman 2007; Folster‐Holst 2006; Gerasimov 2010; Goebel 2010; Gore 2011; Gruber 2007; Iemoli 2012; Ivankhnenko 2013; Nermes 2010; Roessler 2007; Shafiei 2011; Sistek 2006; Van der Aa 2010; Viljanen 2005; Wang 2015; Weston 2005; Woo 2010; Wu 2012; Wu 2015; Yesilova 2012; Yoshida 2010). We judged losses to follow‐up under 20% to show low risk of attrition bias and 20% or over to show high risk. Of these, one study used imputation for missing data (Gore 2011). Another study reported different rates of loss to follow‐up in the two groups (8.9% in the probiotic group and 21% in the placebo group, with overall loss to follow‐up of 14%) and found the difference to be statistically insignificant (P = 0.11) (Woo 2010).
Overall losses to follow‐up when reported were low, with the exception of four studies, which reported losses to follow‐up ranging from 23% to 30% (Cukrowska 2008; Farid 2011; Han 2012; Yang 2014). We judged all of these studies to be at high risk of attrition bias. Another study had high rates of exclusion from analysis (25.9%), and we judged it to be at high risk of attrition bias (Rosenfeldt 2003). Passeron 2006 reported overall low rates of loss to follow‐up, but these varied significantly between the two groups (8% in the placebo group and 29% in the probiotic group). We judged this difference and the reasons for it as likely to affect all outcomes, and we judged this study to be at high risk of attrition bias.
For the nine remaining studies, we judged risk of attrition bias as unclear because trial authors provided inadequate information on losses to follow‐up and exclusions (Gromert 2009; Guo 2015; Hol 2008; Isolauri 2000; Kirjavainen 2003; Lin 2015; Majamaa 1997; Matsumoto 2014; Taniuchi 2005).
Selective reporting
We found little evidence of reporting bias in the included studies. However, we judged two studies to be at high risk of reporting bias (Drago 2012; Han 2012). One of these did not report scores for eczema symptoms (pruritus and sleep loss) after treatment, but study authors provided this information to us after communication (Han 2012). The other study reported and discussed only outcomes that were significant for the probiotic group (Drago 2012).
We judged six studies to be at unclear risk of reporting bias (Farid 2011; Gromert 2009; Guo 2015; Matsumoto 2014; Shafiei 2011; Wu 2015). Two of these reported baseline characteristics only for participants who completed the study (Farid 2011; Shafiei 2011). One study provided inadequate information to permit a judgement (Gromert 2009). We found this report only as a conference abstract and could not find registration of the trial to determine whether all outcomes had been reported. One study described all outcomes but did not provide most of the data numerically and did not provide information on trial registration (Wu 2015). Another study reported all outcomes but not numerically (Matsumoto 2014). However, study authors particularly analysed any favourable information/outcome for probiotics even if it was not statistically significant. Another study did not provide information on the dose of the probiotic given and reported results only narratively (Guo 2015).
The other 31 studies provided no evidence of selective reporting, and we judged them as having low risk of bias in this domain. Trial authors reported all outcomes as described in the publication and/or the trial registration. One study did not report the SCORAD score for eczema, which was a secondary outcome, but provided this information on our request (Flinterman 2007).
Other potential sources of bias
For 16 studies, we identified no sources of other bias, and we judged studies to be at low risk of other bias (Brouwer 2006; Cukrowska 2008; Folster‐Holst 2006; Gerasimov 2010; Goebel 2010; Gore 2011; Gruber 2007; Isolauri 2000; Kirjavainen 2003; Nermes 2010; Roessler 2007; Rosenfeldt 2003; Taniuchi 2005; Weston 2005; Woo 2010; Wu 2012). In particular, study authors declared that they received funding for the study and stated "no conflicts of interest".
The probiotic supplier sponsored or co‐sponsored 12 studies (Drago 2012; Flinterman 2007; Han 2012; Hol 2008; Iemoli 2012; Matsumoto 2014; Van der Aa 2010; Viljanen 2005; Wang 2015; Wu 2015; Yang 2014; Yoshida 2010). For four of these studies (Drago 2012; Han 2012; Matsumoto 2014; Yoshida 2010), we judged that the sponsor was likely to have influenced the study outcome or reporting of the study outcome, and we judged these studies to be at high risk of other bias. In addition, for Han 2012, power calculations of the final numbers of participants suggest that the study did not meet target recruitment and was discontinued "after the second interim analysis showed statistically significant differences between the groups". In another of these studies (Yoshida 2010), researchers did not match probiotic and placebo groups for eczema severity (total SCORAD score) at baseline.
Overall we assessed 19 studies as having unclear risk of other bias (Drago 2014; Farid 2011; Flinterman 2007; Gromert 2009; Guo 2015; Hol 2008; Iemoli 2012; Ivankhnenko 2013; Lin 2015; Majamaa 1997; Passeron 2006; Shafiei 2011; Sistek 2006; Van der Aa 2010; Viljanen 2005; Wang 2015; Wu 2015; Yang 2014; Yesilova 2012). Six of these studies did not declare sponsorship of the trial nor conflicts of interest (Guo 2015; Ivankhnenko 2013; Majamaa 1997; Passeron 2006; Shafiei 2011; Yesilova 2012). Investigators reported one study in a conference abstract only and provided inadequate information for risk of bias assessment (Gromert 2009). One of these studies did not match probiotic and placebo groups for eczema severity (total SCORAD score) at baseline (Sistek 2006). For five studies (Drago 2014; Farid 2011; Iemoli 2012; Lin 2015; Wu 2015), trial authors did not make clear what role the supplier of the probiotic played in the study and did not declare trial sponsorship. The other seven studies were sponsored by the supplier of the intervention and the role of the sponsor in data analysis and publication was unclear (Flinterman 2007; Hol 2008; Van der Aa 2010; Viljanen 2005; Wang 2015; Wu 2015; Yang 2014); therefore, we judged them to be at unclear risk of bias.
Effects of interventions
See: Summary of findings for the main comparison
Primary outcomes
Changes in participant‐rated, parent‐rated, or principal carer‐rated symptoms of eczema at the end of active treatment
The authors of 13 studies with 795 randomised participants supplied published or unpublished data on parent‐ or participant‐rated symptom scores at the end of study treatments (SCORAD part C or equivalent) (Goebel 2010; Gruber 2007; Han 2012; Nermes 2010; Passeron 2006; Roessler 2007; Rosenfeldt 2003; Sistek 2006; Weston 2005; Woo 2010; Wu 2012; Yang 2014; Yoshida 2010). Researchers measured symptoms using a VAS for itch and sleep disturbance ranging from 0 to 10 for each symptom, then a combined score ranging from 0 to 20. Pooled available data from 754 participants in these studies show no significant improvement in favour of probiotic treatment (mean difference (MD) ‐0.44, 95% confidence interval (CI) ‐1.22 to 0.33; Analysis 1.1). Results show significant statistical heterogeneity between studies for this outcome measure (I² = 57%). The reason for this heterogeneity is not clear. We note here that authors of the Yang 2014 study reported their results in non‐parametric statistics, which we converted to parametric ones (see Methods: Unit of analysis issues). Inclusion of data from this study in the meta‐analysis did not change the overall significance of the outcome, but data conversion is based on the assumption that the data are not skewed. Trial sequential analysis shows that target sample sizes of 258 and 456, which are necessary to demonstrate a minimum mean difference of ‐2 (Figure 4) and ‐1.5 (Figure 5), respectively, with 90% power have been exceeded, suggesting that further trials with similar probiotic strains for this outcome may be futile. The sample size of 1026, which is necessary to demonstrate a minimum difference of ‐1 at 90% power, has not been reached (Figure 6). This suggests that further studies to determine whether these probiotics change the outcome by at least 1.5 points may be futile.

Trial sequential analysis for a minimum difference of ‐2 points difference in eczema symptoms (SCORAD part C; range 0 to 20) between probiotic and no probiotics at 90% power. The blue z‐curve of the meta‐analysis shows that the optimal heterogeneity‐adjusted information size of 258 has been reached. This suggests that future trials of similar interventions are unlikely to change the findings of no significant difference between probiotic and control for detection of at least a 2‐point difference.

Trial sequential analysis for a minimum difference of ‐1.5 points difference in eczema symptoms (SCORAD part C; range 0 to 20) between probiotics and no probiotics at 90% power. The blue z‐curve of the meta‐analysis has crossed the red v‐shaped line of futility and has reached the optimal heterogeneity‐adjusted information size of 456. This suggests that future trials of similar interventions are unlikely to change the findings of no significant difference between probiotic and control for detection of at least a 1.5‐point difference.

Trial sequential analysis for a minimum difference of ‐1 point difference in eczema symptoms (SCORAD part C; range 0 to 20) between probiotics and no probiotics at 90% power. The blue z‐curve of the meta‐analysis has not crossed the red v‐shaped line of futility and has not yet reached the optimal heterogeneity‐adjusted information size of 1026. This suggests that future trials of similar interventions may change the findings of no significant difference between probiotic and control for detection of at least a 1‐point difference.
Four trials reported parent‐rated overall evaluation of symptoms of eczema at the end of study treatment; however one trial did not provide any numerical data for this outcome and reported no significant differences between groups (Folster‐Holst 2006). Therefore, we included the remaining three trials with 150 randomised participants in the analysis, which comprised data for 135 participants (Passeron 2006; Rosenfeldt 2003; Weston 2005). We dichotomised the scale of two studies as 'better' versus 'worse' or 'the same' (Rosenfeldt 2003; Weston 2005), and the scale of one study measuring from 1 (worse) to 6 (much better) as '4 to 6' versus '1 to 3' (Passeron 2006). Pooling of data from these studies shows no significant reduction in the risk of worsened/unchanged eczema among probiotic‐treated individuals (odds ratio (OR) 0.40, 95% CI 0.14 to 1.15; Analysis 1.2). We detected moderate levels of statistical heterogeneity between trials (I² = 48%), which appeared to be related to the Rosenfeldt 2003 trial. Possible reasons for this heterogeneity include adequate exclusion of other probiotic sources from this cross‐over trial, or higher methodological quality of parallel‐group studies (defined as stating that an intention‐to‐treat analysis was performed, and that methods used for allocation concealment and randomisation sequence generation were adequate). Trial sequential analysis showed that the optimal information size for detecting a 30% difference in the probability of eczema improvement at 90% power is 1096, so that information is currently insufficient to conclude whether probiotics might have an impact on this outcome measure.
One study (abstract publication only) reported significant reduction in symptoms of itching and loss of sleep in the probiotic group (P = 0.024) (Gromert 2009).
Another study did not use a validated score for participant‐rated symptoms of eczema (Matsumoto 2014). Study authors reported that Itch improvement level in the probiotic group was significantly higher than that in the placebo group at week 8 (end of intervention) (P < 0.05). The proportion of participants whose condition improved and whose scores were 0 (improved remarkably) and 1 (improved) by diagnosis was significantly greater in the LKM512 group than in the placebo group at week 8 (P < 0.05). However, results show no significant differences between groups with respect to other symptomatic scores.
Nine further studies with 688 participants and available data from 627 participants reported changes from baseline in parent‐ or participant‐reported eczema symptoms and found no significant differences between the two groups (MD ‐0.70, 95% CI ‐1.47 to 0.06; Analysis 1.3) (Gerasimov 2010; Goebel 2010; Gruber 2007; Han 2012; Passeron 2006; Rosenfeldt 2003; Weston 2005; Wu 2015; Yang 2014). Results show moderate statistical heterogeneity (I² = 33%) between studies for this outcome measure, which is significantly reduced when Gerasimov 2010 is removed, but the reason for this heterogeneity is not clear. Also we should note here that we converted non‐parametric statistics from the Yang 2014 study to parametric ones (see Methods: Unit of analysis issues), although inclusion of data from this study did not alter the significance of the outcome of this analysis.
Changes in quality of life at the end of active treatment
Ten studies provided quality of life (QoL) data (Drago 2012; Folster‐Holst 2006; Gerasimov 2010; Gore 2011; Iemoli 2012; Matsumoto 2014; Wang 2015; Weston 2005; Wu 2012; Yoshida 2010). We included data from six studies with 569 randomised participants and available data from 552 participants using four different scales in the meta‐analysis (Gerasimov 2010; Gore 2011; Iemoli 2012; Matsumoto 2014; Wang 2015; Yoshida 2010), which show no differences in quality of life between treatment groups (standardised mean difference (SMD) 0.03, 95% CI ‐0.36 to 0.42; I² = 68%; Analysis 1.4). We noted significant statistical heterogeneity, but this finding may be related to the different scales used.
Three studies with 372 randomised participants assessed family QoL by using the Dermatitis Family Impact Questionnaire as described in Lawson 1998, and the Family Dermatology Life Quality Index as discussed in Basra 2007 (Gerasimov 2010; Wang 2015; Weston 2005); pooled data from 358 participants show no significant differences (SMD ‐0.19, 95% CI ‐0.56 to 0.18; Analysis 1.5). Reasons for the significant statistical heterogeneity (I² = 59%) are not clear, but it is reduced when the Gerasimov 2010 study is removed.
Wu 2015 reported no statistically significant differences between groups in results of the Infant Dermatology Life Quality Index (P = 0.71) and the Dermatitis Family Impact Scale (P = 0.61). Three studies with 153 participants reported no significant differences in QoL between groups at the end of treatment using the Dermatology Life Quality Index, a different published scale ‐ as described in Ruden 1999 ‐ and an unpublished scale, respectively (Drago 2012; Folster‐Holst 2006; Wu 2012).
Secondary outcomes
Changes in participant‐rated, parent‐rated, or principal carer‐rated symptoms of eczema during the six‐month period after active treatment has ceased
Data from three studies comprising 195 participants showing changes in eczema symptoms after active treatment had ceased were available and could be pooled (Han 2012; Sistek 2006; Weston 2005). These three trials reported SCORAD part C scores at four weeks, eight weeks, and two weeks after cessation of study treatment, respectively. A pooled analysis of the data shows significant improvement in the participant‐/parent‐rated symptom score in favour of probiotic treatment (MD ‐1.81, 95% CI ‐3.13 to ‐0.49 points on SCORAD part C; I² = 0%; Analysis 1.6). One of these studies also reported a dichotomised global assessment by parents after cessation of probiotic treatment but no significant long‐term differences in the risk of worsened or unchanged eczema between probiotic and placebo interventions (OR 0.63, 95% CI 0.21 to 1.88; data not presented) (Weston 2005).
Changes in quality of life within the six‐month period after active treatment has ceased
Three studies provided data for this outcome (Iemoli 2012; Wang 2015; Weston 2005). Two studies reported longest follow‐up of eight weeks (Iemoli 2012; Weston 2005), and one study described longest follow‐up of one month after cessation of treatment (Wang 2015). Weston 2005 reported that the median change in quality of life score eight weeks after the end of study treatment was ‐2.5 points for the probiotic group and ‐3.0 for the placebo group. Statistical comparison of available data was not possible due to lack of summary statistics. Pooled data from two studies with 261 participants show no significant differences between the two groups (SMD ‐0.08, 95% CI ‐0.35 to 0.20, I² = 0%; Analysis 1.7) (Iemoli 2012; Wang 2015).
One study reported QoL measures for 12, 18, and 36 months post treatment, showing no significant differences between groups (Gore 2011).
Changes in the need for other eczema treatment during active treatment and within the six‐month period after active treatment has ceased
Eleven studies with 634 participants reported this outcome but only for the period of active treatment (Table 4) (Folster‐Holst 2006; Gerasimov 2010; Gore 2011; Gruber 2007; Han 2012; Rosenfeldt 2003; Van der Aa 2010; Weston 2005; Woo 2010; Wu 2012; Wu 2015). We could not pool the data due to differences in reporting of this outcome. For nine of these studies, differences between treatment groups were not statistically significant (Folster‐Holst 2006; Gore 2011; Gruber 2007; Han 2012; Rosenfeldt 2003; Van der Aa 2010; Woo 2010; Wu 2012; Wu 2015), and for one study (Weston 2005), trial authors reported no statistical analysis. The only study that reported significant differences was Gerasimov 2010, which shows a less cumulative quantity of topical corticosteroids used in the probiotic group during the study period (P = 0.006); however, study authors reported no significant differences in the frequency of use of topical corticosteroids at the final visit (P = 0.130).
| Rosenfeldt 2003 | Gruber 2007 | Weston 2005 | Folster‐Holst 2006 | Gerasimov 2010 | Han 2012 | Wu 2012 | Woo 2010 | Van der Aa 2010 | Gore 2011 | Wu 2015 | |
| Median grams hydrocortisone butyrate applied (range) | Probiotic: 7.8 (0 to 67) Placebo: 6.0 (0 to 59) | ‐ | ‐ | ‐ | ‐ | ‐ | ‐ | ‐ | ‐ | ‐ | ‐ |
| Mean grams 1% hydrocortisone applied (SD) | ‐ | Probiotic: 0.8 (45.0) Placebo: 3.5 (29.8) | ‐ | ‐ | ‐ | ‐ | ‐ | ‐ | ‐ | ‐ | ‐ |
| Median change in topical corticosteroid use score (IQR) | ‐ | ‐ | Probiotic: 0.25 (‐6.7 to 7.0) Placebo: ‐1.0 (‐8.0 to 0.7) | ‐ | ‐ | ‐ | ‐ | ‐ | ‐ | ‐ | ‐ |
| Mean applications per week (SD) | ‐ | ‐ | ‐ | Probiotic: 3.0 (0.6) Placebo: 3.2 (0.9) | Probiotic: 0.8 (0.9) Placebo: 1.2 (1.4) | ‐ | ‐ | ‐ | ‐ | ‐ | ‐ |
| Number of participants using topical CS during study (%) | ‐ | ‐ | ‐ | ‐ | ‐ | Baseline Probiotics: 13/58 (22.4%) Placebo: 14/60 (23.3%) At end of treatment Probiotics: 13/44 (29.5%) Placebo: 14/39 (36%) | ‐ | Probiotic: 22/45 (49%) Placebo: 20/43 (46%) | Baseline Synbiotic: 25/45 (55.6%) Placebo: 22/44 (50%) At end of treatment Synbiotic: 22/41 (53.7%) Placebo: 24/42 (57.1%) | ‐ | ‐ |
| Mean grams 0.25% prednicarbate applied during study (SD) | ‐ | ‐ | ‐ | ‐ | ‐ | Probiotic: Placebo: | ‐ | ‐ | ‐ | ‐ | ‐ |
| Mean applications of CS or calcineurin inhibitor per month (SD) | ‐ | ‐ | ‐ | ‐ | ‐ | ‐ | Probiotic: 23.5 (19.1) Placebo: 19.1 (19) | ‐ | ‐ | ‐ | ‐ |
| Median grams of 0.1% prednicarbate during Intervention (range) | ‐ | ‐ | ‐ | ‐ | ‐ | ‐ | ‐ | Probiotic: Placebo: | ‐ | ‐ | ‐ |
| Median change in grams of 0.1% prednicarbate use during intervention (range) | ‐ | ‐ | ‐ | ‐ | ‐ | ‐ | ‐ | Probiotic: ‐0.5 (‐2.7 to 1.3) Placebo: ‐0.3 | ‐ | ‐ | ‐ |
| Number of participants using standard skin care at end of intervention | ‐ | ‐ | ‐ | ‐ | ‐ | ‐ | ‐ | ‐ | ‐ | Probiotic: 29/88 (33%) Placebo: 21/47 (45%) | ‐ |
| Number of participants using different potencies of TCS at end of intervention | ‐ | ‐ | ‐ | ‐ | ‐ | ‐ | ‐ | ‐ | ‐ | Emollients only Probiotic: 31/88 (35%) Placebo: 18/47 (38%) Mild Probiotic: 54/88 (61%) Placebo: 29/47 (62%) ≥ moderate/potent Probiotic: 3/88 (3%) Placebo: 0 | ‐ |
| Mean grams of TCS (hydrocortisone 1% or mometasone 0.1%) used during study (SD) | ‐ | ‐ | ‐ | ‐ | Probiotic: Placebo: | ‐ | ‐ | ‐ | ‐ | ‐ | ‐ |
| Median grams of TCS (hydrocortisone 1% or mometasone 0.1%) used during study (range) | ‐ | ‐ | ‐ | ‐ | Probiotic: 25.0 (0.0 to 45.0) Placebo: 35.0 (15.0 to 50.0) | ‐ | ‐ | ‐ | ‐ | ‐ | ‐ |
| Mean total amount (gr) of corticosteroid used during treatment period ± SD | ‐ | ‐ | ‐ | ‐ | ‐ | ‐ | ‐ | ‐ | ‐ | ‐ | Probiotic: 5.87 ± 7.48 Placebo: 4.73 ± 5.48 |
CS: corticosteroids.
IQR: interquartile range.
SD: standard deviation.
TCS: topical corticosteroids.
Two studies reported no recorded differences in steroid consumption between groups (Gromert 2009 (abstract publication only); Wang 2015).
The sole study reporting changes in the need for other eczema treatment after treatment had ceased found no significant differences between placebo and probiotic groups in median topical corticosteroid scores eight weeks after cessation of the study intervention (Weston 2005).
Investigator‐rated eczema severity
Changes in eczema severity as measured by a trained investigator or a medical practitioner at the end of active treatment
All studies reported assessments relevant to this outcome. Twenty‐four studies with 1639 participants reported mean total SCORAD (SCORAD parts A, B, C) scores at the end of treatment (Drago 2012; Drago 2014; Flinterman 2007; Folster‐Holst 2006; Goebel 2010; Gore 2011; Gruber 2007; Han 2012; Hol 2008; Iemoli 2012; Ivankhnenko 2013; Lin 2015; Nermes 2010; Passeron 2006; Roessler 2007; Rosenfeldt 2003; Sistek 2006; Viljanen 2005; Wang 2015; Weston 2005; Woo 2010; Wu 2012; Yesilova 2012; Yoshida 2010). Trial authors provided data for one of these studies (Drago 2014); however, the P value for the difference between the two groups calculated via a two‐sided unpaired t test shows a slight difference (P < 0.001) from that reported in the manuscript (P = 0.015). Pooled analysis of available data on 1596 participants from these studies shows significant differences between probiotic and control treatments, with a mean difference of ‐3.91 points in favour of probiotic treatment (95% CI ‐5.86 to ‐1.96; Analysis 1.8). We detected extreme levels of statistical heterogeneity between trials (I² = 79%), which seemed to be related to parallel‐group trials (I² = 81%). The reasons for heterogeneity were not clear. Two studies reported significant baseline differences in eczema severity between placebo‐ and probiotic‐treated groups, which might have accounted for the increased difference in end of treatment SCORAD scores (Sistek 2006; Yoshida 2010). Schram 2011 assessed the minimal clinically important difference (MCID) in SCORAD, EASI, and Patient‐Oriented Eczema Measure (POEM) scores; researchers used as anchor points changes in Patient and Investigator Global Assessment (PGA and IGA). Schram suggested that the MCID in total SCORAD is 8.7, which is higher than the difference of 3.91 points shown in our Analysis 1.8 (i.e. lower than this cutoff point). Although the study data came from adult patients only, the mean difference of 3.91 points found in this analysis is of uncertain clinical significance. Schram also suggested that a minimum change in total SCORAD of 4.1 is the optimal cutoff change that can predict change in IGA, which is closer to the difference we found in Analysis 1.8.
To explore this, we performed a sensitivity analysis using change scores (i.e. the difference in SCORAD score between start and end of treatment for each individual). Fourteen studies with 1086 randomised participants provided these data on 1035 participants (Farid 2011; Gerasimov 2010; Goebel 2010; Han 2012; Ivankhnenko 2013; Nermes 2010; Passeron 2006; Rosenfeldt 2003; Sistek 2006; Van der Aa 2010; Viljanen 2005; Weston 2005; Woo 2010; Wu 2015), which we have presented in Analysis 1.9. The data show a mean difference in SCORAD change of ‐4.46 points (95% CI ‐6.49 to ‐2.43) in favour of probiotic treatment, with substantial but diminished statistical heterogeneity between trials (I² = 51%). The reason for this is not clear, but it seems to be attributed most to the Farid 2011 study, which reported high rates of loss to follow‐up (23%), which researchers excluded from analysis.
We also performed a sensitivity analysis using total SCORAD scores at the end of treatment only for studies with low risk of bias (Analysis 1.10). We found nine studies with low risk of bias (Drago 2012; Flinterman 2007; Goebel 2010; Iemoli 2012; Sistek 2006; Van der Aa 2010; Viljanen 2005; Wang 2015; Wu 2012), but eight studies with 741 randomised participants provided data from 705 participants for analysis (Drago 2012; Flinterman 2007; Goebel 2010; Iemoli 2012; Sistek 2006; Viljanen 2005; Wang 2015; Wu 2012). Results show extreme levels of statistical heterogeneity (88%), and so we have pooled the data in the subtotal. The reasons for this heterogeneity were not clear, but it may be attributed to the use of different strains of probiotics.
The authors of 11 studies reported data for investigator‐rated eczema severity using objective SCORAD (parts A/B) scores (Brouwer 2006; Goebel 2010; Han 2012; Majamaa 1997; Passeron 2006; Shafiei 2011; Sistek 2006; Weston 2005; Woo 2010; Yang 2014; Yoshida 2010). Pooled data on 529 participants from 10 studies do not show a significant difference between groups (MD ‐2.24, 95% CI ‐4.69 to 0.20; I² = 54%; Analysis 1.11) (Brouwer 2006; Goebel 2010; Han 2012; Majamaa 1997; Passeron 2006; Sistek 2006; Weston 2005; Woo 2010; Yang 2014; Yoshida 2010). It is noted again that authors of the Yang 2014 and Majamaa 1997 studies reported their results using non‐parametric statistics, which we converted to parametric ones (see Methods; Unit of analysis issues). Inclusion of data from Yang 2014 in the meta‐analysis changed the overall significance of the outcome; this inclusion should be considered with caution.
In Cukrowska 2008, a categorical analysis of total SCORAD scores shows no significant differences between the two groups. Gromert 2009 (abstract publication only) reported that "the extension of the eczema was significantly decreased over time in the group given probiotic compared to the group given placebo (P = 0.024)".
We could not pool data from the other studies for this outcome measure. Taniuchi 2005 showed a significant reduction in symptom scores from baseline in both probiotic and placebo groups, but study authors did not present any statistical comparison between the two groups. Isolauri 2000 reported assessments as median scores with an interquartile range (shown in Table 2) and showed a statistically significant difference between end of treatment SCORAD scores for probiotic versus placebo groups. We could not pool the data from this study in Analysis 1.11, because SCORAD scores were so low that it could not be assumed that the median score approximates the mean. Kirjavainen 2003 reported mean total SCORAD score at the end of treatment (eight in the placebo group and five in the probiotic group) without statistical analysis of this difference; additionally, the duration of active treatment varied greatly between participants in this study. Passeron 2006 reported an investigator's global assessment scale of eczema improvement at the end of treatment for 39 participants; however, results show no significant differences in the risk of worse, unchanged, or mildly improved eczema between probiotic and no probiotic treatments (OR 0.41, 95% CI 0.07 to 2.38; data not presented as a forest plot). We could not include data from Shafiei 2011 in the meta‐analysis, but study authors reported no significant differences between groups. Matsumoto 2014 did not use a validated severity score and made no comment on study results in the publication. Guo 2015 did not use a validated score index to assess eczema severity but assessed improvement after interventions according to four grades: "complete resolution", "good response", "partial response", and "no response". Researchers considered participants who showed complete resolution and good response as responders, and those with partial and no response as non‐responders. At the end of treatment, study authors reported a response rate in the probiotic group of 91.1% and in the control arm of 76.7%, which they found to be statistically significant (P < 0.05).
Changes in global eczema severity or change in the number of eczema flares as measured by participants, parents, principal carers, or a medical practitioner in the six‐month period after active treatment has ceased
Seven studies with 581 participants and available data on 509 participants reported total SCORAD scores after active treatment had ceased for two (Han 2012; Roessler 2007), four (Ivankhnenko 2013; Sistek 2006; Wang 2015), and eight weeks post end of active treatment (Iemoli 2012; Weston 2005). Results show significant differences favouring probiotics over no probiotics (MD ‐7.72, 95% CI ‐11.85 to ‐3.59). We noted very high levels of statistical heterogeneity (83%) between studies of this analysis (Analysis 1.12), for which reasons are not clear but may involve differences in follow‐up times between studies. Pooling of data from parallel trials shows significant differences favouring only probiotics (MD ‐9.27, 95% CI ‐13.88 to ‐4.65), which exceeds the MCID of 8.7 in SCORAD demonstrated by Schram 2011. Even so, very high levels of heterogeneity (82%) may be due to differences in follow‐up duration between studies.
Majamaa 1997 reported median SCORAD scores of 16 (interquartile range (IQR) 6 to 25) in probiotic‐treated infants, and 14 (IQR 2 to 38) in placebo‐treated infants, one month after the study intervention had ceased with no statistical analysis presented. Isolauri 2000 reported median SCORAD scores of 0 in all active and placebo‐treated groups at six‐month follow‐up; however, the duration of study interventions provided in this study is not clear. Viljanen 2005 reported mean changes in SCORAD score four weeks after study interventions had ceased. Lactobacillus rhamnosus GG (LGG)‐treated infants had a mean reduction of 22.9 points, probiotic mix‐treated infants 20.4 points, and placebo‐treated infants 20.3 points, with no statistically significant differences between treatment groups at this time point. Finally, Folster‐Holst 2006 reported mean SCORAD scores four weeks after study interventions had ceased ‐ probiotic‐treated participants had a mean score of 32.8 versus 30.1 for placebo.
Pooled analysis of data from two studies with 102 participants show significant improvement in investigator‐rated eczema extent and severity (SCORAD parts A/B) in favour of probiotic treatment (MD ‐8.11, 95% CI ‐13.14 to ‐3.09) eight and four weeks, respectively, after cessation of treatment (Weston 2005; Sistek 2006; Analysis 1.13). We detected no statistical heterogeneity between these two studies (I² = 0%).
Cukrowska 2008 presented changes in total SCORAD five months after the end of intervention as categorical data (improvement vs no improvement or exacerbation) and showed no significant differences between groups.
Gore 2011 and Van der Aa 2010 reported total SCORAD scores for longer than six months post treatment, hence longer than the time period defined in our review protocol. Gore 2011 provided data for total SCORAD 12, 18, and 36 months post treatment showing no significant differences between probiotic and placebo. Van der Aa 2010 showed total SCORAD scores at one year post treatment without statistical analysis, reporting slightly higher scores in the probiotic group than in the placebo group (mean ± SD: 35.4 ± 10.8 and 33.9 ± 10.6 in probiotic and placebo groups, respectively).
Guo 2015 reported recurrence rates over a period of three months after the end of treatment: 26.7% of participants in the probiotic arm had recurrence versus 68.9% of those in the control arm, which researchers found to be statistically significant (P < 0.05).
Changes in the number of days lost from school or work due to eczema symptoms during active treatment
No study reported this outcome.
Adverse events during the treatment period
Eight studies reported adverse events (AEs) in 105/624 participants (Folster‐Holst 2006; Gruber 2007; Matsumoto 2014; Passeron 2006; Sistek 2006; Wang 2015; Weston 2005; Wu 2012). One of these participants with vomiting withdrew from the study. Pooled data on gastrointestinal adverse events among 402 participants from seven of those trials with 427 randomised participants show no significant differences in adverse event rates between probiotic and control groups (RR 1.54, 95% CI 0.90 to 2.63; I² = 0%; Analysis 1.14) (Folster‐Holst 2006; Gruber 2007; Matsumoto 2014; Passeron 2006; Sistek 2006; Weston 2005; Wu 2012). We could not pool data from Wang 2015 because it was not clear which of the adverse events happened in each group. Trial authors stated that there were "no group differences in bowel cramps, fecal frequency, and gastroenteritis".
Gerasimov 2010 found no significant differences in gastrointestinal and total adverse events. Investigators reported a total of 38 AEs in the probiotic group versus 35 in the control group, and a total of 14 gastrointestinal AEs (three diarrhoea, six constipation, five abdominal colic) in the probiotic group versus 12 (two diarrhoea, six constipation, four abdominal colic) in the control group. They considered no serious AEs (burn, croup, head injury, food poisoning) to be related to treatment.
Parents in Gore 2011 (42/137; 30.7%) reported some difficulties (e.g. green loose stools, increased vomiting, feed refusal, colic) that were considered related to changes in formula, and 24/137 (17.5%) stopped the formula. It is uncertain whether these difficulties were due only to the formula or to the probiotic, as researchers reported numbers from both groups.
Four studies reported no significant AEs during treatment (Drago 2012; Farid 2011; Iemoli 2012; Shafiei 2011). No other study provided any data on AEs.
Authors in Wu 2015 reported 35 AEs in the probiotic group and 37 in the control group but provided no details on the nature of these events or the statistical analysis. They stated that these events were not related to study products.
We did not update for this review update the separate search for adverse events that was done for the first review, which included non‐RCT data (Boyle 2006a). Please see Differences between protocol and review. This search revealed four case reports of sepsis related to probiotic use (Cherifi 2004; De Groote 2005; Lestin 2003; Riquelme 2003), including one death (Lestin 2003). It also revealed five reports of human safety assessments using probiotics (Burton 2006; Connolly 2005; Makelainen 2003; Srinivasan 2006; Wolf 1998), as well as four review articles on probiotic safety (Borriello 2003; Boyle 2006a; Ishibashi 2001; Salminen 1998). Safety assessments demonstrated no adverse effects of probiotics in humans, but case reports and review articles documented a total of 42 cases of suspected or proven probiotic sepsis (Boyle 2006a). Study authors did not definitively identify the probiotic origin of the infective organism in all of these 42 cases, and it is not possible to quantify the risk of such outcomes from available data. A subsequent report described increased risk of fatal bowel ischaemia in critically ill patients treated with one particular combination of probiotics (Besselink 2008). One review proposed some relative contraindications to probiotic use in view of the risk of sepsis (Boyle 2006a).
Stratified analyses
We undertook the following planned stratified analyses.
Analysis by age
We analysed global change in eczema symptoms and symptom scores (SCORAD part C) as well as global eczema severity scores from studies stratified by age (Analysis 1.15; Analysis 1.16; Analysis 1.17). Analysis of SCORAD part C scores shows no significant differences in symptom scores between probiotic and control treatments (age under 2 years: MD ‐0.39, 95% CI ‐2.20 to 1.42; I² = 58%; age 2 to 12 years: MD ‐0.63, 95% CI ‐2.04 to 0.78; I² = 64%; adults: MD 1.01, 95% CI ‐0.82 to 2.84; I² = 0%; Analysis 1.16).
Analysis of total SCORAD scores by age group shows no significant differences in total SCORAD between probiotic and control treatments among those under two years of age (MD ‐0.99, 95% CI ‐3.97 to 1.99; I² = 68%); however, data from older age groups show a significant difference in favour of probiotics (age 2 to 12 years: MD ‐6.08, 95% CI ‐9.68 to ‐2.48; I² = 0%; adults: MD ‐6.51, 95% CI ‐10.09 to ‐0.07; I² = 78%; Analysis 1.17).
Analysis by antibiotic use during study intervention
Viljanen 2005 separately evaluated participants not exposed to antibiotics during the intervention period but did not report any end‐of‐treatment outcomes for this group.
Analysis by atopy
Three studies included only participants with proven atopy (Flinterman 2007; Sistek 2006; Wang 2015), and another study separately evaluated treatment effects in participants with atopy (Viljanen 2005). We could not pool SCORAD scores at the end of treatment for these studies due to extreme levels of statistical heterogeneity between trials (I² = 91%). We noted a significant difference in total SCORAD scores between probiotic and no probiotic groups when we analysed studies with a mix of atopic and non‐atopic participants (MD ‐4.15, 95% CI ‐6.02 to ‐2.27), and we detected high levels of heterogeneity (I² = 74%) (Analysis 1.18).
Cukrowska 2008 presented results for IgE‐dependent and IgE‐independent eczema, defining IgE‐dependent eczema as raised total IgE or specific IgE to certain food allergens (not specified). Investigators reported data for total SCORAD as a dichotomous outcome ‐ "improvement versus no improvement/exacerbation" ‐ and noted a significant difference between groups favouring probiotics during the intervention period (P = 0.0329), but not during the five‐month post‐treatment period.
Van der Aa 2010, in a subgroup of participants with IgE‐associated eczema, found a significant difference in reduction of total SCORAD at the end of treatment compared with baseline, favouring probiotics (MD ‐4.6, 95% CI ‐9.1 to ‐0.1; P = 0.04). Researchers defined IgE‐associated atopic dermatitis as atopic dermatitis with raised total and/or specific serum IgE levels to house dust mites, cat, cow's milk, peanut, and egg at baseline.
In Gerasimov 2010, 53 out of 96 participants (25 in the probiotic group and 28 in the placebo group) had raised IgE (> 50 IU/mL). Data on the subgroup of participants with raised IgE show a significant difference in reduction of total SCORAD at the end of treatment favouring probiotics (P = 0.006). Data on the subgroup of participants without raised IgE (43 out of 96) show differences in the reduction of total SCORAD at the end of treatment that were not significant (P = 0.068). Study authors suggested that overall significant results for all participants favouring probiotics may be attributed to participants with IgE‐associated eczema, who constituted more than half of the study population.
Analysis by food allergy
Viljanen 2005 separately evaluated SCORAD scores in participants with proven cow's milk allergy. All participants in Ivankhnenko 2013 had proven cow's milk allergy. In Hol 2008, in which all participants had proven cow's milk allergy, data were available only for participants who had moderate to severe eczema. Results show no significant differences in end of treatment SCORAD scores between probiotic and placebo groups (MD ‐1.84, 95% CI ‐6.22 to 2.54) with extreme levels of statistical heterogeneity between trials (70%) (Analysis 1.19). We found significant differences in SCORAD scores favouring probiotics when we evaluated studies with a mix of food‐allergic and non‐food‐allergic participants (MD ‐3.21, 95% CI ‐5.63 to ‐0.79); however, we detected extreme levels of statistical heterogeneity between trials (I² = 76%) (Analysis 1.19)
Analysis by intestinal inflammation
No study provided data for this subgroup analysis.
Analysis by disease severity
Six studies with 421 participants provided sufficient data to stratify end of treatment SCORAD scores by disease severity (Analysis 1.20) (Goebel 2010; Gruber 2007; Han 2012; Passeron 2006; Sistek 2006; Weston 2005). No evidence shows a difference in treatment efficacy according to disease severity (severe eczema: MD ‐3.71, 95% CI ‐10.05 to 2.64; I² = 0%; moderate eczema: MD ‐2.95, 95% CI ‐7.65 to 1.74; I² = 62%; mild eczema: MD ‐5.53, 95% CI ‐15.29 to 4.23).
Gerasimov 2010 reported changes in total SCORAD scores by disease severity at the end of treatment. For both moderate and severe disease, the data favoured probiotics.
Analysis by probiotic species or strain
This stratified analysis was not a priori specified in the study protocol, but we undertook the analysis due to use of the same probiotic strain in some studies and heterogeneity between study results noted for some outcomes in this review. For this analysis, we analysed data for SCORAD part C and total SCORAD at end of treatment. We categorised studies as follows.
-
Lactobacillus GG, L rhamnosus, L salivarius, L casei and paracasei, and any Lactobacillus species alone or in combination with or without probiotics.
-
Bifidobacterium lactis, B breve, or any Bifidobacterium species alone or in combination with or without prebiotics.
-
Single versus multiple probiotics, with or without prebiotics
-
Probiotics without prebiotics.
Results show no significant differences in participant‐/parent‐rated symptoms of eczema (SCORAD part C) between groups for any of the probiotic subgroups (Analysis 1.21; Analysis 1.22; Analysis 1.23; Analysis 1.24).
Pooled data (Analysis 1.25) show significantly higher total SCORAD scores after treatment with Lactobacillus GG compared with placebo (MD 3.37, 95% CI 0.55 to 6.20; I² = 0%). A significant difference in total SCORAD scores favoured probiotics compared with no probiotics after treatment with Lactobacillus salivarius (MD ‐6.86, 95% CI ‐10.08 to ‐3.63; I² = 74%; data from six studies: Drago 2012; Drago 2014; Flinterman 2007; Iemoli 2012; Wu 2012; Yesilova 2012), or with any Lactobacillus species (MD ‐3.80, 95% CI ‐6.06 to ‐1.54; I² = 79%; data from 21 studies: Drago 2012; Drago 2014; Flinterman 2007; Folster‐Holst 2006; Goebel 2010; Gore 2011; Gruber 2007; Han 2012; Hol 2008; Iemoli 2012; Nermes 2010; Passeron 2006; Roessler 2007; Rosenfeldt 2003; Sistek 2006; Viljanen 2005; Wang 2015; Weston 2005; Woo 2010; Wu 2012; Yesilova 2012), but with significant heterogeneity. Results show no significant differences in total SCORAD scores between probiotics and no probiotics after treatment with L rhamnosus, L casei, and L paracasei, and no significant differences in total SCORAD scores between probiotics and no probiotics after treatment with Bifidobacterium lactis, B breve, and any Bifiidobacterium species (Analysis 1.26). Data show a significant difference in total SCORAD scores between probiotics and no probiotics when treatment consisted of a single or multiple probiotic species (Analysis 1.27). A significant difference in total SCORAD scores favoured probiotics compared with no probiotics after treatment with any probiotic alone with no prebiotic (Analysis 1.28) (MD ‐3.83, 95% CI ‐5.81 to ‐1.86), but data show very high levels of heterogeneity (I² = 80%).
For the stratified analyses Analysis 1.16,Analysis 1.21,Analysis 1.22,Analysis 1.23, and Analysis 1.24, we used data from Yang 2014, which we converted from non‐parametric to parametric statistics (see Methods: Unit of analysis issues). Inclusion of these data should be considered with caution but did not change the overall significance of the findings of analyses.
Assessment of reporting bias in the meta‐analyses
We created funnel plots for continuous outcomes for which an adequate number of included studies provided data: participant‐ or parent‐rated symptoms of eczema at the end of treatment (Analysis 1.1), global eczema severity score at the end of treatment (Analysis 1.8), and global eczema severity score/sensitivity analysis/change score (Analysis 1.9). See Figure 7, Figure 8 and Figure 9, respectively.

Egger's plot for Analysis 1.1: probiotic vs placebo for participant‐ or parent‐rated symptoms of eczema (SCORAD part C) at the end of treatment.
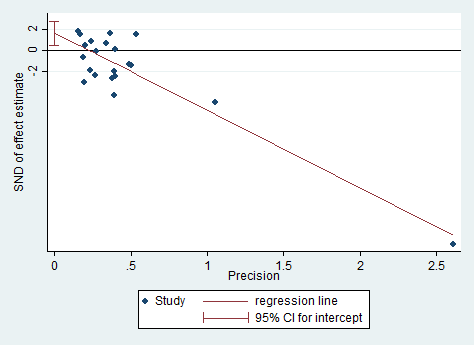
Egger's plot for Analysis 1.8: probiotic vs placebo for global eczema severity score (total SCORAD) at the end of treatment.

Egger's plot for Analysis 1.9: probiotic vs placebo for global eczema severity score (total SCORAD) at the end of treatment ‐ sensitivity analysis ‐ change score.
We performed Egger's test for asymmetry as a formal assessment of publication bias. For Analysis 1.1 and Analysis 1.9, P values from Egger's test show no significant asymmetry (P = 0.18 and P = 0.479, respectively; Figure 7 and Figure 9). However, for Analysis 1.8, the P value from Egger's test is significant, which indicates evidence of asymmetry in the plot for this outcome (P = 0.007) (Figure 8); however, the asymmetry appears to be related to an over‐influential study (Drago 2012). A sensitivity analysis excluding this study yielded a P value from Egger's test that was non‐significant (P = 0.357). Furthermore, we noted extreme levels of heterogeneity (I² = 79%) between studies for this outcome, which can lead to funnel plot asymmetry; therefore this interpretation should be considered with caution.
Discusión
Resumen de los resultados principales
Se incluyeron 39 ensayos controlados aleatorios (ECA) con 2599 participantes en la actualización de esta revisión. Los participantes incluían tanto a hombres como a mujeres y a neonatos y adultos, aunque la mayoría eran niños. Los probióticos usados en estos estudios fueron las especies Lactobacillus y Bifidobacteria, administrados como una cepa única o en mezclas de probióticos con o sin prebióticos. La evidencia muestra heterogeneidad significativa entre los estudios para la mayoría de los resultados de la revisión (Resumen de los hallazgos tabla 1). Además de la gran variedad de probióticos usados, la variedad de las dosis y las concentraciones de probióticos en las preparaciones usadas puede haber contribuido con la heterogeneidad. Para los siguientes resultados clave, el comparador fue ningún probiótico, el tratamiento activo varió de seis semanas a tres meses (además del resultado de la gravedad del eccema calificado por el investigador, para el que el límite superior del tratamiento activo fue de 16 semanas) y la medición de resultado ocurrió al final del tratamiento activo (excepto para los eventos adversos, que se midieron durante el período de tratamiento activo).
Los datos de 13 estudios con 754 participantes contribuyeron con el resultado primario (cambios en los síntomas del eccema calificados por el participante, el padre o el cuidador principal al final de tratamiento activo) y sugieren que los probióticos probablemente logran poco o ningún cambio en los síntomas del eccema (evidencia de calidad moderada). El análisis secuencial de ensayos post hoc muestra que el análisis excedió el tamaño de la muestra necesario para demostrar una diferencia mínima de 1,5 puntos en una escala de 20 puntos en los síntomas del eccema entre los probióticos y el placebo y sugirió que los ensayos adicionales de las cepas de probióticos similares para este resultado al final del tratamiento activo puede ser infructuoso.
Hubo datos de seis estudios con 552 participantes disponibles para el otro resultado primario ‐ cambios en la calidad de vida al final del tratamiento activo. No se halló evidencia de que los probióticos lograran un cambio en la calidad de vida para los pacientes con eccema (evidencia de baja calidad).
No se encontraron datos para el resultado secundario ‐ cambios en el número de días de ausentismo de la escuela o el trabajo debido a los síntomas del eccema durante el tratamiento con probióticos.
Para el cuarto resultado secundario ‐ gravedad del eccema calificada por el investigador ‐ los datos de 24 estudios con 1596 participantes indican que los probióticos pueden mejorar levemente la puntuación compuesta de la gravedad para la Severity Scoring of Atopic Dermatitis (SCORAD). Sin embargo, esta diferencia es de importancia clínica incierta (evidencia de baja calidad).
Siete estudios (402 participantes) informaron los efectos adversos durante el tratamiento activo, y no se halló evidencia de una diferencia entre el uso de probióticos y el uso de ningún probiótico (evidencia de baja calidad). Los eventos adversos relacionados con el tratamiento que se informaron durante el período de tratamiento fueron de naturaleza gastrointestinal (p.ej. diarrea, vómitos).
Para la actualización de esta revisión, no se realizó una nueva búsqueda de los eventos adversos. La búsqueda de eventos adversos realizada para la primera revisión encontró informes de casos de septicemia comprobada o presunta relacionada con el uso de probióticos (Boyle 2006a; Cherifi 2004; De Groote 2005; Lestin 2003; Riquelme 2003), con la inclusión de una muerte (Lestin 2003), y un informe describió un mayor riesgo de isquemia intestinal mortal en los pacientes en estado crítico tratados con una combinación particular de probióticos.
A pesar del número grande de estudios y participantes incluidos en esta revisión, todavía hay varias dudas importantes en cuanto a la administración de probióticos para el tratamiento del eccema. Lo anterior incluye: los motivos de la heterogeneidad entre los ensayos; la escasez de datos sobre la calidad de vida y otros resultados como la repercusión de los probióticos en los días de ausentismo de la escuela/trabajo o en la administración de otros tratamientos del eccema; el uso de puntuaciones de la calidad de vida no validadas o de las medidas de resultado recomendadas por la iniciativa HOME (Harmonizing Outcome Measures for Eczema); los efectos de los probióticos sobre grupos específicos de pacientes (es decir pacientes con atopia, alergias a los alimentos o piel de color); los efectos de los probióticos después del final del tratamiento; la identificación de la dosis/concentración óptima o de la cepa de probióticos; y efectos adversos de los probióticos.
Compleción y aplicabilidad general de las pruebas
El número de estudios y participantes incluidos después de una búsqueda actualizada fueron mayores que en la primera revisión. Los estudios incluyeron a todos los grupos etarios, aunque sólo seis estudios consideraron a los adultos. Aunque el agregado de los estudios a esta actualización dio lugar a intervalos de confianza más estrechos, aún se observa heterogeneidad estadística significativa entre los estudios para los resultados primarios y secundarios.
Los resultados de la revisión se aplican sólo a las cepas de probióticos disponibles y evaluadas actualmente y en las dosis usadas en los estudios incluidos, que incluyeron las especies Lactobacillus y Bifidobacteria administradas como una única cepa o en mezclas de probióticos con o sin prebióticos, y en dosis y concentraciones variadas. No se encontró ningún estudio sobre las bacterias ácidas no lácticas.
Sólo 11 estudios informaron los datos de la calidad de vida al final del tratamiento activo, y de los mismos sólo fue posible incluir en los análisis los datos de seis estudios. Los números relativamente pequeños de estudios y participantes que informan este resultado y las escalas variadas de evaluación de resultado utilizadas significan que las conclusiones con relación a la calidad de vida son limitadas.
Sólo ocho estudios declararon con claridad la presencia y la naturaleza de cualquier evento adverso y los grupos de tratamiento en los cuales ocurrieron.
Los estudios pueden ser suficientes para indicar si los cambios en los síntomas del eccema informados por los participantes o por los padres al final del tratamiento activo son influenciados por los probióticos estudiados en los ECA hasta la fecha. Sin embargo, para los cambios en los síntomas durante el período de seis meses después de la finalización del tratamiento activo y para otras medidas de resultado (es decir los cambios en la calidad de vida, los días de ausentismo de la escuela o el trabajo durante el tratamiento activo, los cambios en la necesidad de otro tratamiento del eccema durante el tratamiento activo o en el período de seis meses después de la finalización del tratamiento activo, los cambios en la gravedad global del eccema y los eventos adversos durante el tratamiento, así como para otros probióticos o los mismos probióticos pero en diferentes dosis/concentración), los estudios son insuficientes para proporcionar conclusiones claras. Una limitación de muchos de los estudios de los probióticos es que las concentraciones diversas y las dosis de las bacterias se usan sin estandarización. Se tuvieron que agrupar los estudios sin evaluar la justificación de la selección o la concentración de la cepa. Se realizó el análisis estratificado por especies de probióticos post hoc debido a que los estudios usaron muchos tipos diferentes de probióticos.
Los estudios han evaluado una gama amplia de participantes que cumplieron con los criterios de inclusión de la revisión: incluyeron a ambos sexos y a todos los grupos etarios e individuos de diferentes países de origen. El eccema varió de leve a grave. Esta revisión incluye datos de un gran número de ensayos que muestran los efectos de los probióticos sobre los síntomas del eccema, aunque aún hay varias dudas con respecto a los otros resultados de interés de la revisión, así como la dosis y la cepa de probióticos óptimas y los efectos de los probióticos en grupos específicos de pacientes (p.ej. los que presentan diferentes tipos de piel, pacientes atópicos). Esta revisión revela incertidumbre como resultado de la calidad metodológica subóptima de los estudios incluidos y la necesidad del uso de medidas de resultado validadas para facilitar la estandarización de los ensayos clínicos y la comparación de sus resultados.
Calidad de la evidencia
La calidad general de los estudios fue mixta, en gran parte debido a la información faltante con respecto a los procedimientos de asignación al azar, el cegamiento y las pérdidas durante el seguimiento. Se evaluaron sólo nueve estudios como en riesgo bajo de sesgo debido a que el proceso de asignación al azar estaba claro; la ocultación de la asignación estaba clara y fue realizada; se cegó a los participantes, a los médicos o a los evaluadores de resultado; y no se observó ningún sesgo de abandono. Uno de estos estudios informó un desequilibrio fortuito en la gravedad de las enfermedades al inicio (Sistek 2006), y cinco fueron patrocinados o copatrocinados por el proveedor de probióticos (Drago 2012; Flinterman 2007; Van der Aa 2010; Viljanen 2005; Wang 2015).
La calidad de la evidencia se evaluó mediante criterios GRADE para los resultados clave (Resumen de los hallazgos tabla 1). Para los “cambios en la puntuación de los síntomas del eccema calificados por el participante o el padre/cuidador principal al final del tratamiento activo” (medido con SCORAD parte C; resultados continuos), se disminuyó la calidad de la evidencia a moderada debido a la heterogeneidad significativa entre los estudios. Para el “cambio global en los síntomas del eccema calificados por el participante o el padre/cuidador al final del tratamiento activo” (medido como “peor/sin cambios o mejor”; resultados binarios), se disminuyó la calidad de la evidencia a baja debido al número pequeño de estudios que informaron este resultado y la heterogeneidad moderada entre ellos. Se disminuyó la calidad de la evidencia sobre los "cambios en la calidad de vida calificados por el participante o el padre al final del tratamiento activo" a baja debido al número muy pequeño de estudios que informaron de este resultado y a la heterogeneidad significativa observada entre ellos. Para “la calidad de vida de la familia calificada por el participante o el padre al final del tratamiento activo”, se disminuyó la certeza de la evidencia a muy baja debido al número muy pequeño de estudios que informaron este resultado y la heterogeneidad significativa. Para la “puntuación global de la gravedad del eccema al final del tratamiento activo”, se disminuyó la certeza de la evidencia a baja debido a los niveles extremos de heterogeneidad entre los estudios y la evidencia de sesgo de informe. Para los “eventos adversos”, se disminuyó la certeza de la evidencia a baja debido al número pequeño de estudios que informaron eventos adversos y el número pequeño de eventos que pudieron incluirse en el análisis.
Sesgos potenciales en el proceso de revisión
La incapacidad para establecer contacto con los autores de todos los ensayos para obtener los conjuntos de datos originales y aclaraciones puede haber introducido algunas dudas en el juicio sobre la inclusión de los estudios y en los resultados.
Los análisis de las puntuaciones del cambio de SCORAD y de las puntuaciones de SCORAD de los estudios en riesgo bajo de sesgo fueron análisis post hoc, justificados por el desequilibrio en la gravedad del tratamiento al inicio en un estudio incluido. Por lo tanto, debe observarse con cautela al establecer cualquier conclusión basada en estos datos. El análisis de subgrupos por cepa de probiótico usada no se definió previamente en el protocolo del estudio y este análisis se realizó debido a que algunos estudios usaron la misma cepa de probiótico. El análisis indica que algunas cepas de probióticos pueden ser más efectivas que otras para el tratamiento del eccema; sin embargo, las conclusiones basadas en este análisis post hoc también deben establecerse con cautela.
Además, los investigadores usaron concentraciones variables y dosis diarias de diferentes probióticos, lo cual puede haber influenciado los hallazgos del estudio. Algo de la heterogeneidad observada en los análisis de los resultados puede ser atribuible a la variación en el momento adecuado de la evaluación de resultados; sin embargo, no se realizó ningún análisis de subgrupos de acuerdo a la dosis de probióticos o la concentración.
Acuerdos y desacuerdos con otros estudios o revisiones
Los datos resumidos en esta revisión indican que las cepas de probióticos disponibles en la actualidad que se han evaluado en los ECA probablemente no son efectivas para el tratamiento de los síntomas del eccema y pueden no ser efectivas desde el punto de vista clínico para cambiar la gravedad del eccema.
Estudios anteriores encontraron una asociación entre la composición de la microflora intestinal y el eccema (Bjorksten 2001; Kalliomaki 2001), así como más síntomas gastrointestinales en los niños con eccema (Caffarelli 1998). Estos estudios anteriores indican que la composición de la microbiota intestinal es importante en la fisiopatología del eccema o que las anomalías de la mucosa intestinal asociadas con el eccema resultan en cambios secundarios de la microbiota intestinal residente. La evidencia indica que los probióticos pueden reducir la mayor permeabilidad intestinal asociada con el eccema (Rosenfeldt 2004), y los estudios como Kalliomaki 2001; Kukkonen 2007 y Moro 2006; y las revisiones sistemáticas incluida Dang 2013; Doege 2012; Mansfield 2014; Osborn 2007 y Zhu 2010 sugieren que la administración de algunos probióticos o prebióticos durante el período neonatal o el embarazo puede prevenir el desarrollo de eccema. Por lo tanto, los probióticos pueden ser inefectivos para tratar el eccema, según se observa en esta revisión actual, debido a que la disminución en la permeabilidad intestinal asociada con su uso es insuficiente para dar lugar a la resolución de las enfermedades establecidas o debido a que la duración del tratamiento no logra permitir una modulación suficiente de la composición o la función de la microbiota intestinal para dar lugar a un cambio clínicamente significativo.
En esta revisión, no se encontró ninguna diferencia significativa en los eventos adversos entre los probióticos y el control durante el tratamiento activo y los eventos adversos informados se relacionaron con el malestar gastrointestinal. Para la actualización de esta revisión, se encontraron tres revisiones sistemáticas sobre la seguridad de los probióticos, que incluían datos de ECA y de ensayos controlados no aleatorios. Una revisión sistemática no mostró un riesgo mayor estadísticamente significativo de eventos adversos asociados con los probióticos usados durante períodos cortos en el contexto de los ECA aunque observó una falta de informe sistemático de los eventos adversos en los estudios de las intervenciones con probióticos (Hempel 2011). Otra revisión sistemática no describió ningún evento adverso significativo en el contexto de los ECA (Didari 2014). Ambas revisiones encontraron informes de casos de bacteriemia/fungemia y septicemia e indicaron que los pacientes inmunocomprometidos, en estado crítico y posquirúrgicos pueden estar en mayor riesgo (Didari 2014; Hempel 2011). Los eventos adversos graves fueron poco frecuentes. Una revisión sistemática de la seguridad de los probióticos durante el embarazo no mostró ninguna diferencia en las tasas de cesárea, el peso al nacer y la edad gestacional entre los grupos de probióticos y de control (Dugoua 2009).
Tres revisiones sistemáticas recientes han examinado los estudios de los probióticos para el tratamiento del eccema (Chang 2016a; Huang 2017; Kim 2014). Todas las revisiones sistemáticas evaluaron un resultado primario de la puntuación total de SCORAD.
La revisión sistemática más reciente obtuvo datos de 13 estudios y 1070 participantes niños de hasta 18 años de edad y mostró una diferencia significativa en SCORAD a favor de los probióticos sobre el control, con una reducción media en SCORAD de 3,07 y un intervalo de confianza (IC) del 95% de ‐6,12 a ‐0,03 (Huang 2017). Esta revisión incluyó estudios publicados desde 2000 a 2017 y sólo los publicados en inglés. Los investigadores no encontraron este efecto a favor de los probióticos entre los niños menores de un año, sólo entre los niños de entre 1 y 18 años de edad (diferencia de medias [DM] ‐4,50, IC del 95%: ‐7:45 a ‐1,54). Estos resultados son consistentes con los datos proporcionados en la revisión, aunque en esta revisión, se les dio prioridad a los resultados informados por los pacientes y se señaló que el tamaño del efecto sobre SCORAD es de importancia clínica incierta. Huang 2017 encontró mayores diferencias a favor de los probióticos en los análisis de subgrupos por continente (Europa: ninguna diferencia; Asia: DM ‐5,39, IC del 95%: ‐8,91 a ‐1,87; Australia: DM ‐11,20, IC del 95%: ‐13,76 a ‐8,64).
Una segunda revisión sistemática limitó el foco al uso de probióticos en combinación con prebióticos (sinbióticos) (Chang 2016a), aunque los autores de la revisión también incluyeron ensayos de sinbióticos versus prebióticos. Esta revisión no tuvo un protocolo registrado y no usó criterios GRADE para evaluar la certeza de la evidencia. Los autores de la revisión identificaron seis ensayos con 369 participantes en niños de 0 a 14 años de edad, que estudiaban la función de los sinbióticos para tratar el eccema. La duración del tratamiento fue de entre ocho y 12 semanas, y los autores de la revisión utilizaron los cálculos agrupados para el cambio en SCORAD a las ocho semanas para evaluar los efectos clínicos. Una disminución en la puntuación SCORAD de 6,56 estuvo a favor de los sinbióticos con un IC del 95% de ‐11,43 a ‐1,68 y heterogeneidad estadística alta (I² = 77%). Los resultados de este estudio son levemente más favorables hacia los probióticos en comparación con los estudios incluidos en la revisión, con una disminución media alta en SCORAD, aunque reflejan un subconjunto pequeño de los estudios identificados en la revisión sistemática. Las diferencias en los hallazgos y las conclusiones pueden deberse a los diferentes criterios de elegibilidad, las diferentes medidas de resultado y un diferente enfoque metodológico.
Una revisión sistemática anterior con datos de 25 estudios y 1599 participantes de todos los grupos etarios informó una diferencia en la puntuación SCORAD de 4,51 puntos con un IC del 95% de ‐6,78 a ‐2,24 a favor de los probióticos, y el mismo efecto favorable de los probióticos en los individuos de 1 a 18 años de edad y en adultos (Kim 2014). Los resultados no muestran diferencias entre los probióticos y el placebo en los neonatos (< 1 año de edad).
Schram 2011 sugirió que la diferencia mínima clínicamente importante para la puntuación de SCORAD es 8,7.
Una declaración de consenso de posición de la World Allergy Organization no recomendó la administración de probióticos para el tratamiento de las enfermedades alérgicas, incluido el eccema (Fiocchi 2012). Esta revisión narrativa cualitativa de la evidencia estuvo disponible en la bibliografía hasta el momento de la publicación por parte de un panel de expertos.

Study flow diagram.

Risk of bias graph: review authors' judgements about each risk of bias item presented as percentages across all included studies.
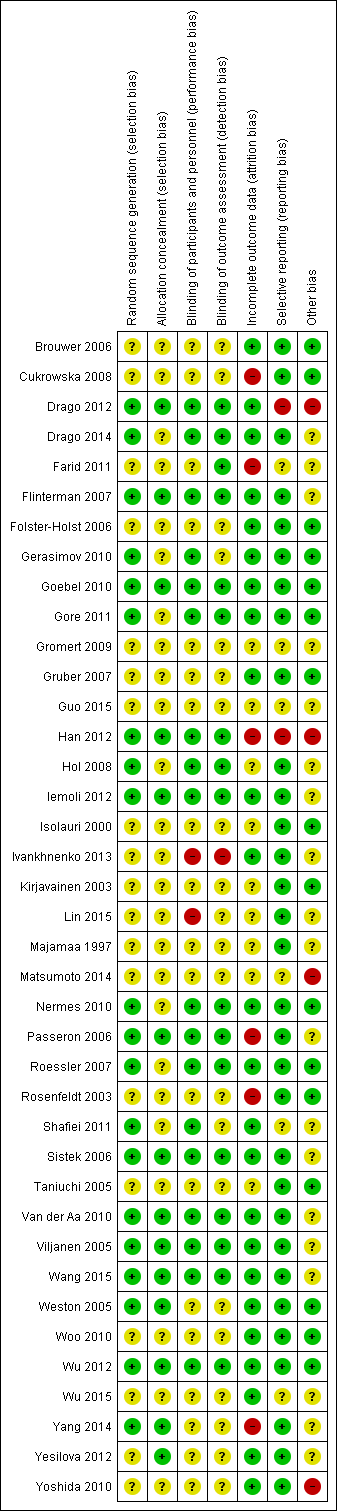
Risk of bias summary: review authors' judgements about each risk of bias item for each included study.

Trial sequential analysis for a minimum difference of ‐2 points difference in eczema symptoms (SCORAD part C; range 0 to 20) between probiotic and no probiotics at 90% power. The blue z‐curve of the meta‐analysis shows that the optimal heterogeneity‐adjusted information size of 258 has been reached. This suggests that future trials of similar interventions are unlikely to change the findings of no significant difference between probiotic and control for detection of at least a 2‐point difference.
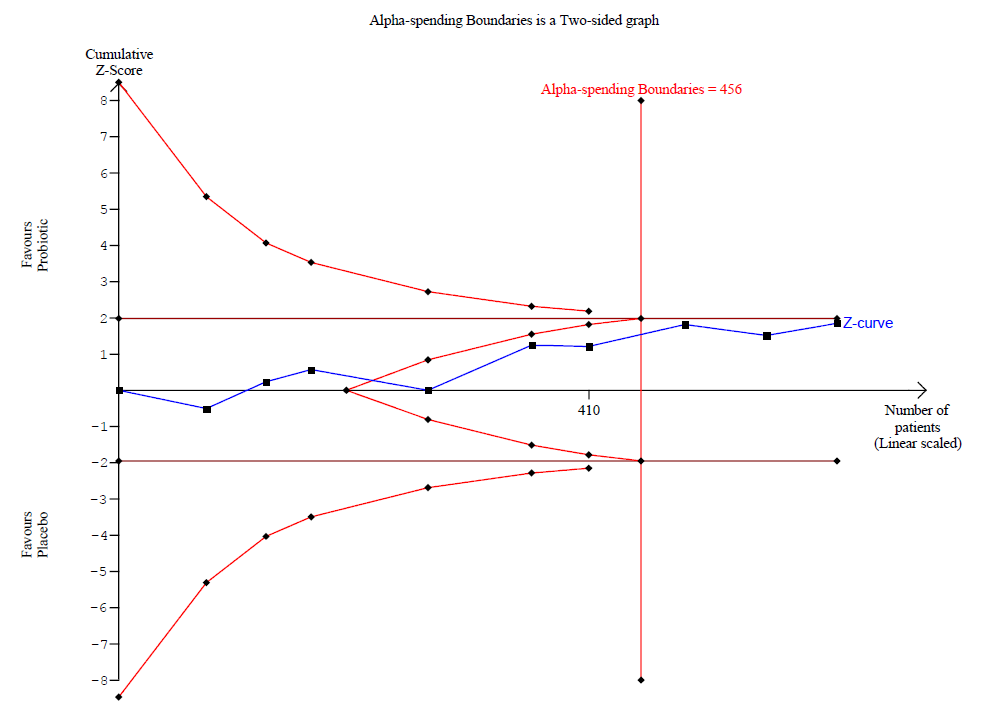
Trial sequential analysis for a minimum difference of ‐1.5 points difference in eczema symptoms (SCORAD part C; range 0 to 20) between probiotics and no probiotics at 90% power. The blue z‐curve of the meta‐analysis has crossed the red v‐shaped line of futility and has reached the optimal heterogeneity‐adjusted information size of 456. This suggests that future trials of similar interventions are unlikely to change the findings of no significant difference between probiotic and control for detection of at least a 1.5‐point difference.

Trial sequential analysis for a minimum difference of ‐1 point difference in eczema symptoms (SCORAD part C; range 0 to 20) between probiotics and no probiotics at 90% power. The blue z‐curve of the meta‐analysis has not crossed the red v‐shaped line of futility and has not yet reached the optimal heterogeneity‐adjusted information size of 1026. This suggests that future trials of similar interventions may change the findings of no significant difference between probiotic and control for detection of at least a 1‐point difference.

Egger's plot for Analysis 1.1: probiotic vs placebo for participant‐ or parent‐rated symptoms of eczema (SCORAD part C) at the end of treatment.

Egger's plot for Analysis 1.8: probiotic vs placebo for global eczema severity score (total SCORAD) at the end of treatment.

Egger's plot for Analysis 1.9: probiotic vs placebo for global eczema severity score (total SCORAD) at the end of treatment ‐ sensitivity analysis ‐ change score.

Comparison 1 Probiotic vs placebo, Outcome 1 Participant‐ or parent‐rated symptoms of eczema (SCORAD part C) at the end of treatment.

Comparison 1 Probiotic vs placebo, Outcome 2 Participant‐ or parent‐rated global change in eczema symptoms at the end of treatment (binary outcome).
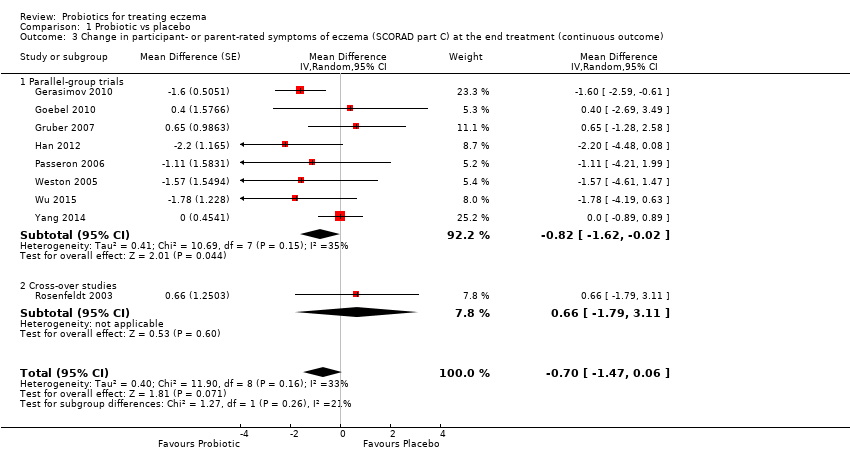
Comparison 1 Probiotic vs placebo, Outcome 3 Change in participant‐ or parent‐rated symptoms of eczema (SCORAD part C) at the end treatment (continuous outcome).

Comparison 1 Probiotic vs placebo, Outcome 4 Participant‐ or patient‐related quality of life score at the end of treatment.

Comparison 1 Probiotic vs placebo, Outcome 5 Participant‐ or patient‐related quality of life score at the end of treatment.

Comparison 1 Probiotic vs placebo, Outcome 6 Parent‐ or participant‐rated eczema severity (SCORAD part C) within 6 months after treatment has ceased.

Comparison 1 Probiotic vs placebo, Outcome 7 Participant‐ or parent‐related quality of life within 6 months after treatment has ceased.

Comparison 1 Probiotic vs placebo, Outcome 8 Global eczema severity score (total SCORAD) at the end of treatment.
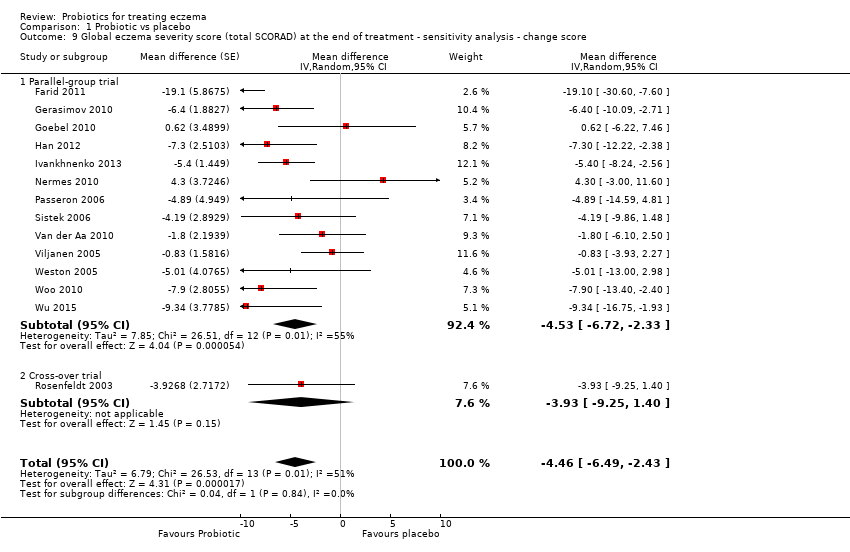
Comparison 1 Probiotic vs placebo, Outcome 9 Global eczema severity score (total SCORAD) at the end of treatment ‐ sensitivity analysis ‐ change score.

Comparison 1 Probiotic vs placebo, Outcome 10 Global eczema severity score (total SCORAD) at the end of treatment ‐ low risk of bias studies only.

Comparison 1 Probiotic vs placebo, Outcome 11 Investigator‐rated eczema severity (SCORAD parts A/B) at the end of treatment ‐ continuous outcome.
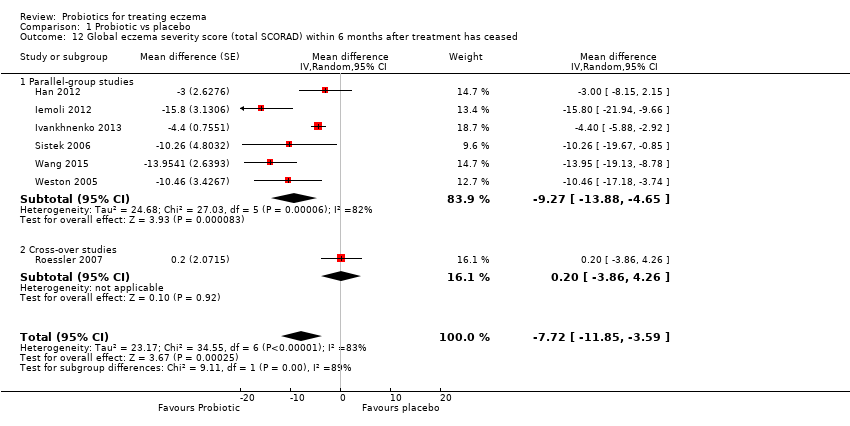
Comparison 1 Probiotic vs placebo, Outcome 12 Global eczema severity score (total SCORAD) within 6 months after treatment has ceased.
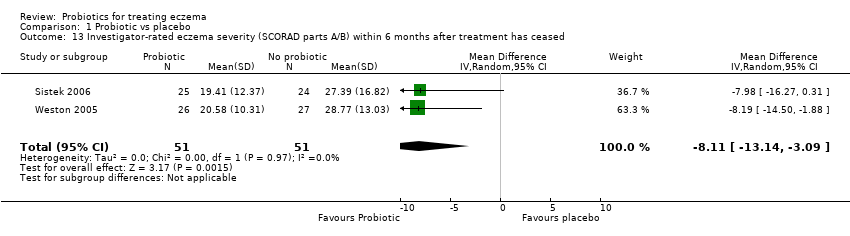
Comparison 1 Probiotic vs placebo, Outcome 13 Investigator‐rated eczema severity (SCORAD parts A/B) within 6 months after treatment has ceased.

Comparison 1 Probiotic vs placebo, Outcome 14 Adverse events (short term).

Comparison 1 Probiotic vs placebo, Outcome 15 Participant/parent‐rated global change in symptoms of eczema at the end of treatment ‐ stratified by age groups.

Comparison 1 Probiotic vs placebo, Outcome 16 Participant/parent‐rated symptoms of eczema (SCORAD part C) at the end of treatment ‐ stratified by age groups.

Comparison 1 Probiotic vs placebo, Outcome 17 Global eczema severity score (total SCORAD) at the end of treatment ‐ stratified by age groups.

Comparison 1 Probiotic vs placebo, Outcome 18 Global eczema severity score (total SCORAD) at the end of treatment ‐ stratified by presence of atopy.

Comparison 1 Probiotic vs placebo, Outcome 19 Global eczema severity score (total SCORAD) at the end of treatment ‐ stratified by challenge‐proven food allergy.

Comparison 1 Probiotic vs placebo, Outcome 20 Global eczema severity score (total SCORAD) at the end of treatment ‐ stratified by eczema severity.
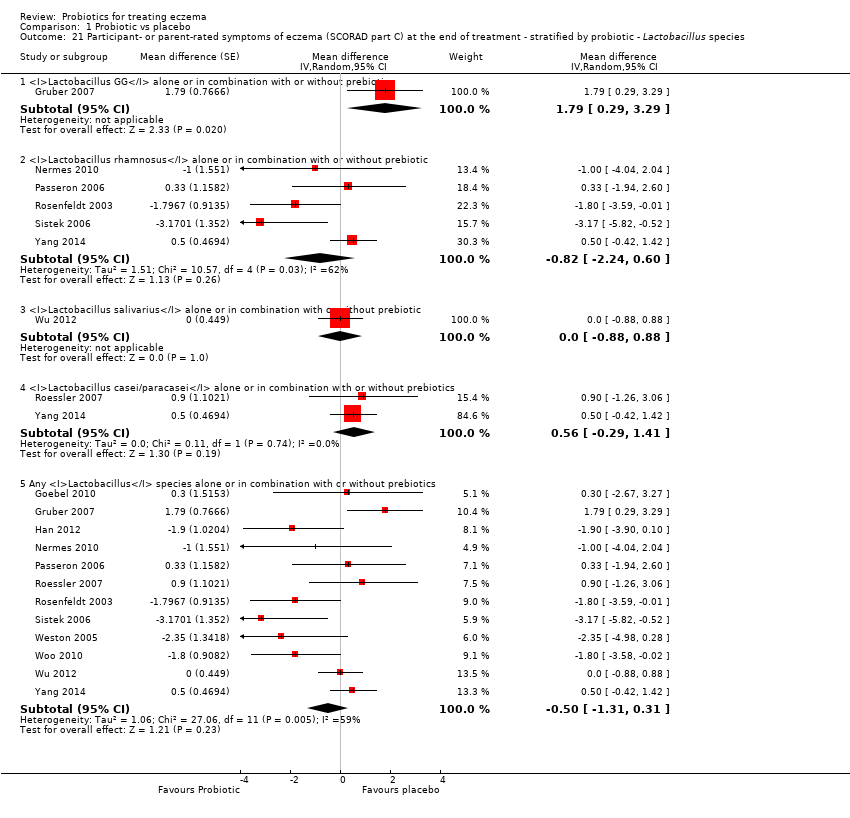
Comparison 1 Probiotic vs placebo, Outcome 21 Participant‐ or parent‐rated symptoms of eczema (SCORAD part C) at the end of treatment ‐ stratified by probiotic ‐ Lactobacillus species.

Comparison 1 Probiotic vs placebo, Outcome 22 Participant‐ or parent‐rated symptoms of eczema (SCORAD part C) at the end of treatment ‐ stratified by probiotic ‐ Bifidobacterium species.
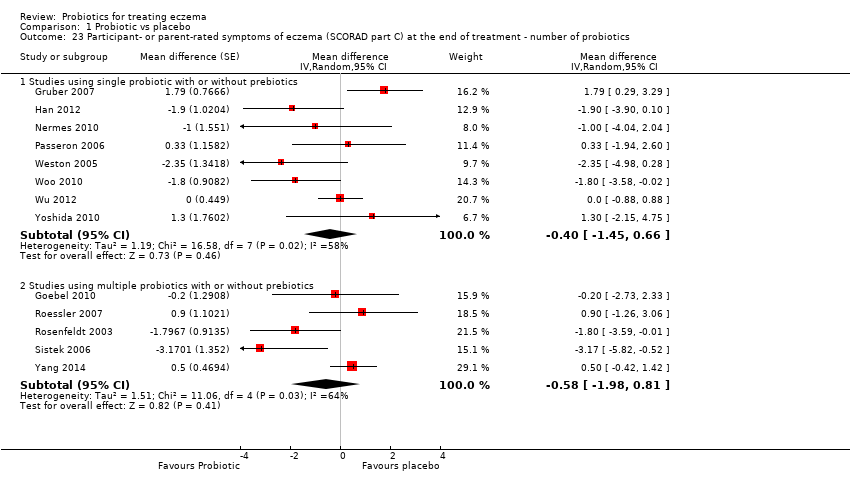
Comparison 1 Probiotic vs placebo, Outcome 23 Participant‐ or parent‐rated symptoms of eczema (SCORAD part C) at the end of treatment ‐ number of probiotics.

Comparison 1 Probiotic vs placebo, Outcome 24 Participant‐ or parent‐rated symptoms of eczema (SCORAD part C) at the end of treatment ‐ probiotics with no prebiotics.

Comparison 1 Probiotic vs placebo, Outcome 25 Global eczema severity score (total SCORAD) at the end of treatment ‐ stratified by probiotic ‐ Lactobacillus species.
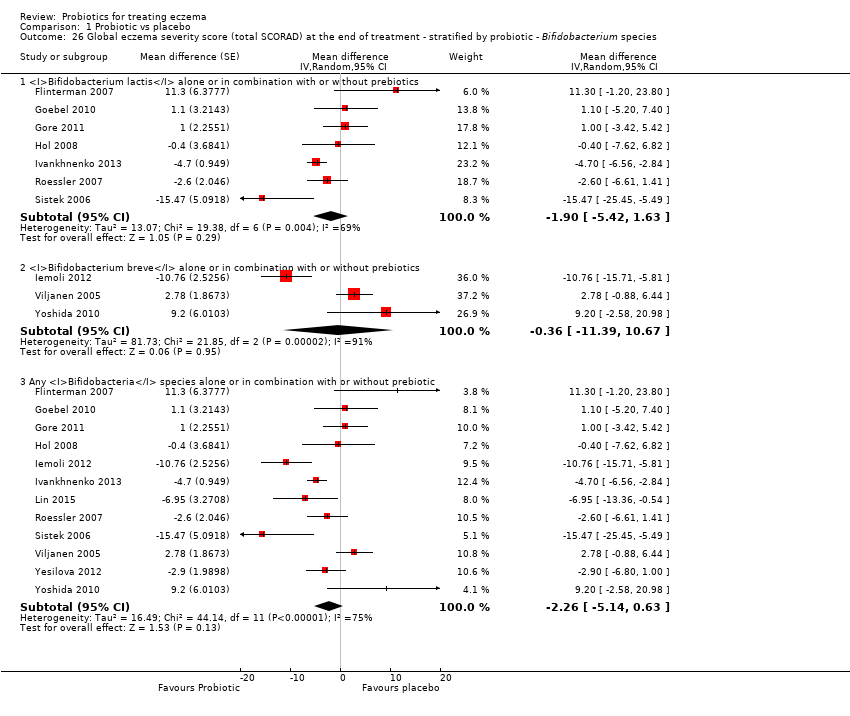
Comparison 1 Probiotic vs placebo, Outcome 26 Global eczema severity score (total SCORAD) at the end of treatment ‐ stratified by probiotic ‐ Bifidobacterium species.

Comparison 1 Probiotic vs placebo, Outcome 27 Global eczema severity score (total SCORAD) at the end of treatment ‐ stratified by probiotic ‐ number of probiotics.

Comparison 1 Probiotic vs placebo, Outcome 28 Global eczema severity score (total SCORAD) at the end of treatment ‐ stratified by probiotic ‐ probiotics with no prebiotics.
| Comparison: probiotics vs no probiotics for treating eczema | ||||||
| Patient or population: male and female patients 0 to 55 years of age with physician‐diagnosed eczema Settings: primary or secondary care. Europe: 22 studies with 1390 participants. Asia: 8 studies with 500 participants. Australasia: 2 studies with 116 participants Intervention: probiotics ± prebiotics Comparison: no probiotics | ||||||
| Outcomes | Illustrative comparative risks* (95% CI) | Relative effect | No. of participants | Quality of the evidence | Comments | |
| Assumed risk | Corresponding risk | |||||
| No probiotics | Probiotics | |||||
| Primary outcome 1: participant‐ or parent‐rated symptoms of eczema (SCORAD part C) at the end of active treatment Visual analogue scale for itch and sleep disturbance ranging from 0 to 10 for each symptom and combined ranging from 0 to 20. The higher the score, the more severe the symptoms Duration of follow‐up from baseline until end of active treatment from 6 weeks to 3 months | Mean SCORAD part C score ranged across control groups from 2 to 7.9 | Mean SCORAD part C score in the intervention groups was 0.44 points lower (1.22 lower to 0.33 higher) | ‐ | 754 | ⊕⊕⊕⊝ | Two cross‐over studies included. Significant heterogeneity between studies Post hoc trial sequential analysis showed no effects of probiotics over control and suggests that further studies of currently available probiotic strains for this outcome may be futile |
| Primary outcome 1: participant‐ or parent‐rated global change in eczema symptoms at the end of active treatment (binary outcome) Change in risk for worsened/unchanged eczema Duration of follow‐up from baseline until end of active treatment from 6 weeks to 3 months | Low‐risk population | OR 0.40 (0.14 to 1.15) | 135 | ⊕⊕⊝⊝ | One cross‐over study included. Number of studies for this outcome was small. Moderate heterogeneity between studies | |
| 300 per 1000 | 146 per 1000 | |||||
| Medium‐risk population | ||||||
| 400 per 1000 | 210 per 1000 | |||||
| High‐risk population | ||||||
| 500 per 1000 | 286 per 1000 | |||||
| Primary outcome 2: participant‐ or parent‐rated participant quality of life score at the end of active treatment Scales used: DLQI, IDQoL, Skindex‐29, CDLQI. On those scales, the higher the score, the more severely the quality of life is affected Duration of follow‐up from baseline until end of active treatment from 8 weeks to 3 months | Mean DLQI score ranged across control groups from | Mean participant quality of life score in the intervention groups was | ‐ | 552 (6) | ⊕⊕⊝⊝ | Small number of studies for this outcome. Significant heterogeneity |
| Primary outcome 2: participant‐ or parent‐rated family quality of life score at the end of active treatment Scale used: DFI, FDLQI. On those scales, the higher the score, the more severely the quality of life is affected Duration of follow‐up from baseline until end of active treatment from 8 weeks to 3 months | Mean change in DFI score during treatment ranged across control groups from ‐2 points to ‐3 points | Mean family quality of life score in the intervention groups was 0.19 standard deviations lower (0.56 lower to 0.18 higher) | ‐ | 358 | ⊕⊝⊝⊝ | Very small number of studies for this outcome. Significant heterogeneity |
| Secondary outcome 4: global eczema severity score (total SCORAD) at the end of active treatment (Investigator‐rated eczema severity) Scale used: total SCORAD ranging from 0 to 103. The higher the score, the more severe the disease Duration of follow‐up from baseline until end of active treatment from 8 weeks to 16 weeks | Mean total SCORAD ranged across control groups from | Mean total SCORAD score in the intervention groups was 3.91 points lower (5.86 to 1.96 points lower) | ‐ | 1596 | ⊕⊕⊝⊝ | Two cross‐over studies included. Extreme levels of heterogeneity for this outcome. Evidence of reporting bias |
| Secondary outcome 6: adverse events (gastrointestinal symptoms) during active treatment Duration of follow‐up from baseline until end of active treatment from 8 weeks to 3 months | Low‐risk population | RR 1.54 (0.90 to 2.63) | 402 (7) | ⊕⊕⊝⊝ | Small number of studies reported adverse events. Small number of events were included in this analysis | |
| 0 per 1000 | 0 per 1000 | |||||
| Medium‐risk population | ||||||
| 100 per 1000 | 154 per 1000 | |||||
| High‐risk population | ||||||
| 200 per 1000 | 308 per 1000 | |||||
| *The basis for the assumed risk (e.g. the median control group risk across studies) is provided in footnotes. The corresponding risk (and its 95% confidence interval) is based on the assumed risk in the comparison group and the relative effect of the intervention (and its 95% CI). | ||||||
| GRADE Working Group grades of evidence. | ||||||
| aDowngraded by one level due to inconsistency as there was significant heterogeneity among studies (I² = 57%). bDowngraded by two levels due to small number of studies for this outcome (imprecision) and because of moderate levels of heterogeneity among studies (I² = 48%). cDowngraded by two levels due to small number of studies for this outcome (imprecision) and because of significant levels of heterogeneity among studies (I² = 68%). dDowngraded by three levels due to inconsistency (one level) as there was significant heterogeneity among studies (I² = 57%) and because of very small number of studies (imprecision) for this outcome (two levels). eDowngraded by two levels because of extreme levels of heterogeneity among studies (I² = 79%) and because of evidence of reporting bias. fDowngraded by two levels because of small number of studies reporting adverse events and small number of events in the meta‐analysis for this outcome (imprecision). | ||||||
| Forms of eczema included | Forms of eczema excluded |
| Atopic eczema | Seborrhoeic eczema |
| Atopic dermatitis | Contact eczema |
| Besnier's prurigo | Allergic contact eczema |
| Neurodermatitis atopica (German) | Irritant contact eczema |
| Flexural eczema/dermatitis | Discoid/nummular eczema |
| Periorbital eczema | Asteatotic eczema |
| Childhood eczema | Varicose/stasis eczema |
| Infantile eczema | Photo‐/light‐sensitive eczema |
| 'Eczema' unspecified | Chronic actinic dermatitis |
| Constitutional eczema | Dyshidrotic eczema |
| Endogenous eczema | Pompholyx eczema |
| Chronic eczema | Hand eczema |
| Neurodermatitis | Frictional lichenoid dermatitis |
| Neurodermatitis (German) | Lichen simplex |
| Occupational dermatitis | |
| Prurigo |
| Isolauri 2mo LGG | Isolauri 2mo Bb12 | Isolauri 2mo placebo | |
| N | 9 | 9 | 9 |
| Median | 1 | 0 | 13.4 |
| IQR | 0.1 to 8.7 | 0 to 3.8 | 4.5 to 18.2 |
| IQR: interquartile range. | |||
| Study | Clarity of methods | Compliance | Dietary management |
| Clear | No compliance measures described | Adequate exclusion of other probiotics during the study | |
| Total daily dose of intervention clear, but individual dose, frequency, and mode of administration not given | No compliance measures reported | Not stated | |
| Clear | Dose count (returned sachet packets counted by clinical investigator). Compliance measured for the 2 groups: 84.5% and 84.7%. No significant difference | Clear instructions given: no change in usual diet but avoid any type of fermented food containing live micro‐organisms | |
| Clear | No information provided | No information provided | |
| Aims and Interventions clear. Outcomes not clear and baseline severity (SCORAD) not given | No information given | Inadequate information | |
| Aims, interventions clear | Inadequate information | Inadequate information | |
| Clear | No compliance measures reported | Not stated | |
| Total daily dose of probiotics not clear. Remaining methods clear | Compliance checked from the parental report and the weight of remaining powder. Reported that there were no differences in compliance between the 2 groups | No information on adequate exclusion of other probiotics from the diet. Participants with challenge proved milk or egg allergy followed milk or egg elimination diet, respectively | |
| Clear | Compliance based on count of remaining capsules: average 94% for all groups and 93.6%, 95%, and 93.3% for Bifidobacterium, Lactobacillus, and placebo groups, respectively. No significant difference in compliance between the 3 groups (P = 0.6). No participating child had compliance lower than 72% | No information given | |
| All methods clear Reporting of adverse events suggests that these were the result of the change in formula but the numbers are totals from intervention and control groups, and it is not certain whether the AEs are associated with the formula or the probiotics | No compliance measures reported | Instructions given that other fermented or probiotic‐containing products were to be avoided | |
| Inadequate information available | No information | No information | |
| Unclear what the placebo was; otherwise clear | 92.5% of doses taken by probiotic group; 94.4% by placebo group | Not stated, other than encouragement to avoid allergens | |
| Dose and exact consistency of probiotics unclear | No information | No information | |
| Preparation of the intervention not clear. Otherwise clear | No compliance measure described | Clear instructions not to consume fermented food and products containing live micro‐organisms | |
| Trial designed to study effects of probiotics in participants with cow's milk allergy. Effects of probiotics on eczema ‐ secondary outcome. Aims, interventions, and outcome measures clear | Compliance measure not presented. "To optimise compliance, participants were supplied with study formula through the study team and batches were delivered at home" | No information provided | |
| Clear | Method: count of return sachets. Reported that compliance was similar in the 2 groups but no measures reported | Instructions given so that participants do not change their diet during trial but should avoid fermented food products containing live micro‐organisms | |
| Unclear ‐ dose and duration of probiotic treatment received not clearly described. Severity of participant eczema at baseline not described | No compliance measures reported | Not stated | |
| Placebo not described. Otherwise methods clear | No compliance measures reported | Not stated | |
| Unclear ‐ intended duration of study treatment not stated | No compliance measures reported | Not stated | |
| Exact dose of probiotics not given | No information provided | No information provided | |
| Unclear ‐ precise dose of probiotic received by participants not stated | No compliance measures described | Not stated | |
| Clear | No information provided | Clearly stated: "All patients were asked to avoid probiotic supplements, fermented milk, lactic acid bacterial drinks and fermented soybean (natto) during the experimental period…" | |
| Clear | No compliance measures reported | Not stated | |
| Clear | No compliance measures described | Not stated | |
| Clear | No compliance measures described | Adequate exclusion of prebiotics and probiotics 3 weeks before the start and during the 20 weeks of the intervention | |
| Clear | No compliance measures described | Adequate exclusion of other probiotics during study | |
| Intervention type not clear: synbiotic mixture of 7 strains of probiotics and fructo‐oligosaccharide. Dose, frequency of intake, and preparation clear Baseline characteristics given only for participants who completed the trial | No compliance measures reported | Unclear. Stated that participants did not change diet before or during the trial | |
| Clear | Assessed by 2 telephone calls | One participant noted to have taken non‐study probiotic | |
| Clear | No compliance measures described | Not stated | |
| Clear | No compliance measures reported. Participants' parents were keeping diary for formula intake and adverse events. Formula with intervention was given on demand and at the end of intervention. No significant differences in formula intake were noted between the 2 groups | Unclear | |
| Method for diagnosing eczema not described | No compliance measures described | Not stated | |
| All clear. In the publication, not clear what the placebo was, but this was clarified by the study author | Yes: capsule count performed | Yes Stated: "During the study…and other probiotics were not permitted" | |
| Clear | Sachet counts and parent‐completed sachet administration chart. Good compliance (94%) ‐ no differences between the 2 groups | Adequate exclusion of other probiotics during study | |
| Clear | No measure of compliance was reported, but it was stated that the 2 groups had no difference in compliance | No information provided | |
| Aims, interventions, and outcome measures clear. Exclusion criteria not given | Patients and parents were to return to investigators all unused intervention. No measure was reported | Instruction given to parents not to feed their children other probiotic preparations during the intervention | |
| Aims, interventions, and outcome measures clear. Dose of probiotic not given in colony‐forming units, or similar measure of bacterial numbers | Compliance recorded: assessed based on a count of returned medication | No information provided | |
| All clear | No information given | Instructions given to avoid any commercial probiotic‐containing products 2 weeks before study initiation. No comment about diet during the trial | |
| All clear | No information provided | No information provided | |
| Placebo not described. Otherwise clear | No compliance measures reported | No information given | |
| SCORAD: Severity Scoring of Atopic Dermatitis. | |||
| Rosenfeldt 2003 | Gruber 2007 | Weston 2005 | Folster‐Holst 2006 | Gerasimov 2010 | Han 2012 | Wu 2012 | Woo 2010 | Van der Aa 2010 | Gore 2011 | Wu 2015 | |
| Median grams hydrocortisone butyrate applied (range) | Probiotic: 7.8 (0 to 67) Placebo: 6.0 (0 to 59) | ‐ | ‐ | ‐ | ‐ | ‐ | ‐ | ‐ | ‐ | ‐ | ‐ |
| Mean grams 1% hydrocortisone applied (SD) | ‐ | Probiotic: 0.8 (45.0) Placebo: 3.5 (29.8) | ‐ | ‐ | ‐ | ‐ | ‐ | ‐ | ‐ | ‐ | ‐ |
| Median change in topical corticosteroid use score (IQR) | ‐ | ‐ | Probiotic: 0.25 (‐6.7 to 7.0) Placebo: ‐1.0 (‐8.0 to 0.7) | ‐ | ‐ | ‐ | ‐ | ‐ | ‐ | ‐ | ‐ |
| Mean applications per week (SD) | ‐ | ‐ | ‐ | Probiotic: 3.0 (0.6) Placebo: 3.2 (0.9) | Probiotic: 0.8 (0.9) Placebo: 1.2 (1.4) | ‐ | ‐ | ‐ | ‐ | ‐ | ‐ |
| Number of participants using topical CS during study (%) | ‐ | ‐ | ‐ | ‐ | ‐ | Baseline Probiotics: 13/58 (22.4%) Placebo: 14/60 (23.3%) At end of treatment Probiotics: 13/44 (29.5%) Placebo: 14/39 (36%) | ‐ | Probiotic: 22/45 (49%) Placebo: 20/43 (46%) | Baseline Synbiotic: 25/45 (55.6%) Placebo: 22/44 (50%) At end of treatment Synbiotic: 22/41 (53.7%) Placebo: 24/42 (57.1%) | ‐ | ‐ |
| Mean grams 0.25% prednicarbate applied during study (SD) | ‐ | ‐ | ‐ | ‐ | ‐ | Probiotic: Placebo: | ‐ | ‐ | ‐ | ‐ | ‐ |
| Mean applications of CS or calcineurin inhibitor per month (SD) | ‐ | ‐ | ‐ | ‐ | ‐ | ‐ | Probiotic: 23.5 (19.1) Placebo: 19.1 (19) | ‐ | ‐ | ‐ | ‐ |
| Median grams of 0.1% prednicarbate during Intervention (range) | ‐ | ‐ | ‐ | ‐ | ‐ | ‐ | ‐ | Probiotic: Placebo: | ‐ | ‐ | ‐ |
| Median change in grams of 0.1% prednicarbate use during intervention (range) | ‐ | ‐ | ‐ | ‐ | ‐ | ‐ | ‐ | Probiotic: ‐0.5 (‐2.7 to 1.3) Placebo: ‐0.3 | ‐ | ‐ | ‐ |
| Number of participants using standard skin care at end of intervention | ‐ | ‐ | ‐ | ‐ | ‐ | ‐ | ‐ | ‐ | ‐ | Probiotic: 29/88 (33%) Placebo: 21/47 (45%) | ‐ |
| Number of participants using different potencies of TCS at end of intervention | ‐ | ‐ | ‐ | ‐ | ‐ | ‐ | ‐ | ‐ | ‐ | Emollients only Probiotic: 31/88 (35%) Placebo: 18/47 (38%) Mild Probiotic: 54/88 (61%) Placebo: 29/47 (62%) ≥ moderate/potent Probiotic: 3/88 (3%) Placebo: 0 | ‐ |
| Mean grams of TCS (hydrocortisone 1% or mometasone 0.1%) used during study (SD) | ‐ | ‐ | ‐ | ‐ | Probiotic: Placebo: | ‐ | ‐ | ‐ | ‐ | ‐ | ‐ |
| Median grams of TCS (hydrocortisone 1% or mometasone 0.1%) used during study (range) | ‐ | ‐ | ‐ | ‐ | Probiotic: 25.0 (0.0 to 45.0) Placebo: 35.0 (15.0 to 50.0) | ‐ | ‐ | ‐ | ‐ | ‐ | ‐ |
| Mean total amount (gr) of corticosteroid used during treatment period ± SD | ‐ | ‐ | ‐ | ‐ | ‐ | ‐ | ‐ | ‐ | ‐ | ‐ | Probiotic: 5.87 ± 7.48 Placebo: 4.73 ± 5.48 |
| CS: corticosteroids. | |||||||||||
| Outcome or subgroup title | No. of studies | No. of participants | Statistical method | Effect size |
| 1 Participant‐ or parent‐rated symptoms of eczema (SCORAD part C) at the end of treatment Show forest plot | 13 | Mean difference (Random, 95% CI) | ‐0.44 [‐1.22, 0.33] | |
| 1.1 Parallel‐group trials | 11 | Mean difference (Random, 95% CI) | ‐0.42 [‐1.27, 0.43] | |
| 1.2 Cross‐over trials | 2 | Mean difference (Random, 95% CI) | ‐0.52 [‐3.16, 2.12] | |
| 2 Participant‐ or parent‐rated global change in eczema symptoms at the end of treatment (binary outcome) Show forest plot | 3 | Odds ratio (Random, 95% CI) | 0.40 [0.14, 1.15] | |
| 2.1 Parallel‐group trials | 2 | Odds ratio (Random, 95% CI) | 0.70 [0.27, 1.77] | |
| 2.2 Cross‐over trials | 1 | Odds ratio (Random, 95% CI) | 0.18 [0.05, 0.60] | |
| 3 Change in participant‐ or parent‐rated symptoms of eczema (SCORAD part C) at the end treatment (continuous outcome) Show forest plot | 9 | Mean Difference (Random, 95% CI) | ‐0.70 [‐1.47, 0.06] | |
| 3.1 Parallel‐group trials | 8 | Mean Difference (Random, 95% CI) | ‐0.82 [‐1.62, ‐0.02] | |
| 3.2 Cross‐over studies | 1 | Mean Difference (Random, 95% CI) | 0.66 [‐1.79, 3.11] | |
| 4 Participant‐ or patient‐related quality of life score at the end of treatment Show forest plot | 6 | Std. Mean Difference (Random, 95% CI) | 0.03 [‐0.36, 0.42] | |
| 4.1 Infant's Dermatitis Quality of Life Index (IDQoL) | 2 | Std. Mean Difference (Random, 95% CI) | 0.35 [0.08, 0.62] | |
| 4.2 Dermatology Life Quality Index | 1 | Std. Mean Difference (Random, 95% CI) | ‐0.33 [‐0.95, 0.29] | |
| 4.3 Skindex‐29 Questionnaire | 2 | Std. Mean Difference (Random, 95% CI) | ‐0.66 [‐4.24, 2.92] | |
| 4.4 Children's Dermatology Quality of Life Index | 1 | Std. Mean Difference (Random, 95% CI) | ‐0.39 [‐0.70, ‐0.08] | |
| 5 Participant‐ or patient‐related quality of life score at the end of treatment Show forest plot | 3 | Std. Mean Difference (Random, 95% CI) | ‐0.19 [‐0.56, 0.18] | |
| 5.1 Dermatitis Family Impact Questionnaire (DFI) | 2 | Std. Mean Difference (Random, 95% CI) | ‐0.31 [‐0.86, 0.24] | |
| 5.2 Family Dermatology Dermatology Life Quality Index | 1 | Std. Mean Difference (Random, 95% CI) | ‐0.01 [‐0.32, 0.30] | |
| 6 Parent‐ or participant‐rated eczema severity (SCORAD part C) within 6 months after treatment has ceased Show forest plot | 3 | 185 | Mean Difference (IV, Random, 95% CI) | ‐1.81 [‐3.13, ‐0.49] |
| 7 Participant‐ or parent‐related quality of life within 6 months after treatment has ceased Show forest plot | 2 | 261 | Std. Mean Difference (IV, Random, 95% CI) | ‐0.08 [‐0.35, 0.20] |
| 7.1 Dermatology Life Quality Index | 1 | 46 | Std. Mean Difference (IV, Random, 95% CI) | ‐0.14 [‐0.75, 0.48] |
| 7.2 Child Dermatology Life Quality Index | 1 | 215 | Std. Mean Difference (IV, Random, 95% CI) | ‐0.06 [‐0.37, 0.25] |
| 8 Global eczema severity score (total SCORAD) at the end of treatment Show forest plot | 24 | Mean difference (Random, 95% CI) | ‐3.91 [‐5.86, ‐1.96] | |
| 8.1 Parallel‐group studies | 22 | Mean difference (Random, 95% CI) | ‐3.84 [‐5.95, ‐1.72] | |
| 8.2 Cross‐over studies | 2 | Mean difference (Random, 95% CI) | ‐4.14 [‐7.68, ‐0.59] | |
| 9 Global eczema severity score (total SCORAD) at the end of treatment ‐ sensitivity analysis ‐ change score Show forest plot | 14 | Mean difference (Random, 95% CI) | ‐4.46 [‐6.49, ‐2.43] | |
| 9.1 Parallel‐group trial | 13 | Mean difference (Random, 95% CI) | ‐4.53 [‐6.72, ‐2.33] | |
| 9.2 Cross‐over trial | 1 | Mean difference (Random, 95% CI) | ‐3.93 [‐9.25, 1.40] | |
| 10 Global eczema severity score (total SCORAD) at the end of treatment ‐ low risk of bias studies only Show forest plot | 8 | Mean difference (Random, 95% CI) | Totals not selected | |
| 10.1 Parallel‐group studies | 8 | Mean difference (Random, 95% CI) | 0.0 [0.0, 0.0] | |
| 11 Investigator‐rated eczema severity (SCORAD parts A/B) at the end of treatment ‐ continuous outcome Show forest plot | 10 | 529 | Mean Difference (IV, Random, 95% CI) | ‐2.24 [‐4.69, 0.20] |
| 12 Global eczema severity score (total SCORAD) within 6 months after treatment has ceased Show forest plot | 7 | Mean difference (Random, 95% CI) | ‐7.72 [‐11.85, ‐3.59] | |
| 12.1 Parallel‐group studies | 6 | Mean difference (Random, 95% CI) | ‐9.27 [‐13.88, ‐4.65] | |
| 12.2 Cross‐over studies | 1 | Mean difference (Random, 95% CI) | 0.2 [‐3.86, 4.26] | |
| 13 Investigator‐rated eczema severity (SCORAD parts A/B) within 6 months after treatment has ceased Show forest plot | 2 | 102 | Mean Difference (IV, Random, 95% CI) | ‐8.11 [‐13.14, ‐3.09] |
| 14 Adverse events (short term) Show forest plot | 7 | Risk Ratio (M‐H, Random, 95% CI) | Subtotals only | |
| 14.1 Gastrointestinal symptoms | 7 | 402 | Risk Ratio (M‐H, Random, 95% CI) | 1.54 [0.90, 2.63] |
| 15 Participant/parent‐rated global change in symptoms of eczema at the end of treatment ‐ stratified by age groups Show forest plot | 3 | Odds ratio (Random, 95% CI) | Totals not selected | |
| 15.1 Age under 2 years | 1 | Odds ratio (Random, 95% CI) | 0.0 [0.0, 0.0] | |
| 15.2 Age 2 to 12 years | 1 | Odds ratio (Random, 95% CI) | 0.0 [0.0, 0.0] | |
| 15.3 Age not categorised | 1 | Odds ratio (Random, 95% CI) | 0.0 [0.0, 0.0] | |
| 16 Participant/parent‐rated symptoms of eczema (SCORAD part C) at the end of treatment ‐ stratified by age groups Show forest plot | 12 | Mean difference (Random, 95% CI) | Subtotals only | |
| 16.1 Age under 2 years | 5 | Mean difference (Random, 95% CI) | ‐0.39 [‐2.20, 1.42] | |
| 16.2 Age 2 to 12 years | 4 | Mean difference (Random, 95% CI) | ‐0.63 [‐2.04, 0.78] | |
| 16.3 Age not categorised | 2 | Mean difference (Random, 95% CI) | ‐2.23 [‐3.71, ‐0.74] | |
| 16.4 Adults only | 2 | Mean difference (Random, 95% CI) | 1.01 [‐0.82, 2.84] | |
| 17 Global eczema severity score (total SCORAD) at the end of treatment ‐ stratified by age groups Show forest plot | 24 | Mean difference (Random, 95% CI) | Subtotals only | |
| 17.1 Age under 2 years | 10 | Mean difference (Random, 95% CI) | ‐0.99 [‐3.97, 1.99] | |
| 17.2 Age 2 to 12 years | 3 | Mean difference (Random, 95% CI) | ‐6.08 [‐9.68, ‐2.48] | |
| 17.3 Age not categorised | 7 | Mean difference (Random, 95% CI) | ‐5.25 [‐10.43, ‐0.07] | |
| 17.4 Adults only | 5 | Mean difference (Random, 95% CI) | ‐6.51 [‐10.09, ‐2.93] | |
| 18 Global eczema severity score (total SCORAD) at the end of treatment ‐ stratified by presence of atopy Show forest plot | 23 | Mean difference (Random, 95% CI) | Subtotals only | |
| 18.1 Participants with atopy | 4 | Mean difference (Random, 95% CI) | ‐3.90 [‐15.52, 7.73] | |
| 18.2 Participants with unknown atopic status | 19 | Mean difference (Random, 95% CI) | ‐4.15 [‐6.02, ‐2.27] | |
| 19 Global eczema severity score (total SCORAD) at the end of treatment ‐ stratified by challenge‐proven food allergy Show forest plot | 21 | Mean difference (Random, 95% CI) | Subtotals only | |
| 19.1 Food allergy present | 3 | Mean difference (Random, 95% CI) | ‐1.84 [‐6.22, 2.54] | |
| 19.2 Unknown food allergic status | 18 | Mean difference (Random, 95% CI) | ‐3.21 [‐5.63, ‐0.79] | |
| 20 Global eczema severity score (total SCORAD) at the end of treatment ‐ stratified by eczema severity Show forest plot | 6 | Mean Difference (IV, Random, 95% CI) | Subtotals only | |
| 20.1 Severe eczema (SCORAD over 40) | 5 | 95 | Mean Difference (IV, Random, 95% CI) | ‐3.71 [‐10.05, 2.64] |
| 20.2 Moderate eczema (SCORAD 15 to 40) | 6 | 279 | Mean Difference (IV, Random, 95% CI) | ‐2.95 [‐7.65, 1.74] |
| 20.3 Mild eczema (SCORAD under 15) | 1 | 8 | Mean Difference (IV, Random, 95% CI) | ‐5.53 [‐15.29, 4.23] |
| 21 Participant‐ or parent‐rated symptoms of eczema (SCORAD part C) at the end of treatment ‐ stratified by probiotic ‐ Lactobacillus species Show forest plot | 12 | Mean difference (Random, 95% CI) | Subtotals only | |
| 21.1 Lactobacillus GG alone or in combination with or without prebiotic | 1 | Mean difference (Random, 95% CI) | 1.79 [0.29, 3.29] | |
| 21.2 Lactobacillus rhamnosus alone or in combination with or without prebiotic | 5 | Mean difference (Random, 95% CI) | ‐0.82 [‐2.24, 0.60] | |
| 21.3 Lactobacillus salivarius alone or in combination with or without prebiotic | 1 | Mean difference (Random, 95% CI) | 0.0 [‐0.88, 0.88] | |
| 21.4 Lactobacillus casei/paracasei alone or in combination with or without prebiotics | 2 | Mean difference (Random, 95% CI) | 0.56 [‐0.29, 1.41] | |
| 21.5 Any Lactobacillus species alone or in combination with or without prebiotics | 12 | Mean difference (Random, 95% CI) | ‐0.50 [‐1.31, 0.31] | |
| 22 Participant‐ or parent‐rated symptoms of eczema (SCORAD part C) at the end of treatment ‐ stratified by probiotic ‐ Bifidobacterium species Show forest plot | 5 | Mean difference (Random, 95% CI) | Subtotals only | |
| 22.1 Bifidobacterium lactis alone or in combination with or without prebiotics | 4 | Mean difference (Random, 95% CI) | ‐0.34 [‐1.92, 1.24] | |
| 22.2 Bifidobacterium breve alone or in combination with or without prebiotics | 1 | Mean difference (Random, 95% CI) | 1.3 [‐2.15, 4.75] | |
| 22.3 Any Bifidobacteria species alone or in combination with or without prebiotic | 5 | Mean difference (Random, 95% CI) | ‐0.11 [‐1.47, 1.25] | |
| 23 Participant‐ or parent‐rated symptoms of eczema (SCORAD part C) at the end of treatment ‐ number of probiotics Show forest plot | 13 | Mean difference (Random, 95% CI) | Subtotals only | |
| 23.1 Studies using single probiotic with or without prebiotics | 8 | Mean difference (Random, 95% CI) | ‐0.40 [‐1.45, 0.66] | |
| 23.2 Studies using multiple probiotics with or without prebiotics | 5 | Mean difference (Random, 95% CI) | ‐0.58 [‐1.98, 0.81] | |
| 24 Participant‐ or parent‐rated symptoms of eczema (SCORAD part C) at the end of treatment ‐ probiotics with no prebiotics Show forest plot | 13 | Mean difference (Random, 95% CI) | ‐0.44 [‐1.22, 0.33] | |
| 25 Global eczema severity score (total SCORAD) at the end of treatment ‐ stratified by probiotic ‐ Lactobacillus species Show forest plot | 21 | Mean difference (Random, 95% CI) | Subtotals only | |
| 25.1 Lactobacillus GG alone or in combination with or without prebiotic | 3 | Mean difference (Random, 95% CI) | 3.37 [0.55, 6.20] | |
| 25.2 Lactobacillus rhamnosus alone or in combination with or without prebiotic | 5 | Mean difference (Random, 95% CI) | ‐3.49 [‐9.81, 2.83] | |
| 25.3 Lactobacillus salivarius alone or in combination with or without prebiotic | 6 | Mean difference (Random, 95% CI) | ‐6.86 [‐10.08, ‐3.63] | |
| 25.4 Lactobacillus casei/paracasei alone or in combination with or without prebiotics | 6 | Mean difference (Random, 95% CI) | ‐2.58 [‐7.21, 2.05] | |
| 25.5 Any Lactobacillus species alone or in combination with or without prebiotics | 21 | Mean difference (Random, 95% CI) | ‐3.80 [‐6.06, ‐1.54] | |
| 26 Global eczema severity score (total SCORAD) at the end of treatment ‐ stratified by probiotic ‐ Bifidobacterium species Show forest plot | 12 | Mean difference (Random, 95% CI) | Subtotals only | |
| 26.1 Bifidobacterium lactis alone or in combination with or without prebiotics | 7 | Mean difference (Random, 95% CI) | ‐1.90 [‐5.42, 1.63] | |
| 26.2 Bifidobacterium breve alone or in combination with or without prebiotics | 3 | Mean difference (Random, 95% CI) | ‐0.36 [‐11.39, 10.67] | |
| 26.3 Any Bifidobacteria species alone or in combination with or without prebiotic | 12 | Mean difference (Random, 95% CI) | ‐2.26 [‐5.14, 0.63] | |
| 27 Global eczema severity score (total SCORAD) at the end of treatment ‐ stratified by probiotic ‐ number of probiotics Show forest plot | 24 | Mean difference (Random, 95% CI) | Subtotals only | |
| 27.1 Studies using single probiotic with or without prebiotics | 13 | Mean difference (Random, 95% CI) | ‐4.90 [‐7.66, ‐2.15] | |
| 27.2 Studies using multiple probiotics with or without prebiotics | 12 | Mean difference (Random, 95% CI) | ‐3.54 [‐6.50, ‐0.58] | |
| 28 Global eczema severity score (total SCORAD) at the end of treatment ‐ stratified by probiotic ‐ probiotics with no prebiotics Show forest plot | 24 | Mean difference (Random, 95% CI) | ‐3.83 [‐5.81, ‐1.86] | |