Probióticos para el tratamiento del eccema
Information
- DOI:
- https://doi.org/10.1002/14651858.CD006135.pub3Copy DOI

- Database:
-
- Cochrane Database of Systematic Reviews
- Version published:
-
- 21 November 2018see what's new
- Type:
-
- Intervention
- Stage:
-
- Review
- Cochrane Editorial Group:
-
Cochrane Skin Group
- Copyright:
-
- Copyright © 2018 The Cochrane Collaboration. Published by John Wiley & Sons, Ltd.
Article metrics
Altmetric:
Cited by:
Authors
Contributions of authors
Linking with editorial base and co‐ordinating contributions from co‐reviewers (AM).
Drafting protocol (RB with contributions from all co‐reviewers of the first review).
Running the search (Cochrane trial search co‐ordinator and AM).
Identifying relevant titles and abstracts from searches (AM and RB).
Obtaining copies of trials (AM).
Selecting trials (AM and RB).
Extracting data from trials (RB and AM).
Entering data into RevMan (JL and AM).
Carrying out analyses (JL, AM, and RB).
Interpreting data (RB, AM, and JL).
Drafting final review (AM, RB, with contributions from all co‐reviewers).
Checking readability and clarity of the review (AR).
Disclaimer
This project was supported by the National Institute for Health Research, via Cochrane Infrastructure funding to the Cochrane Skin Group. The views and opinions expressed therein are those of the review authors and do not necessarily reflect those of the Systematic Reviews Programme, NIHR, NHS, or the Department of Health.
Sources of support
Internal sources
-
Murdoch Children's Research Institute, Australia.
-
University of Melbourne, Australia.
-
Royal Children's Hospital, Australia.
-
Department of Paediatrics, Imperial College, London, UK.
-
Western Infirmary, Glasgow, UK.
Library Services
External sources
-
The National Institute for Health Research (NIHR), UK.
The NIHR, UK, is the largest single funder of the Cochrane Skin Group.
Declarations of interest
Robert Boyle: "I have received speaker honoraria, support for travel to a conference, and a research grant from Danone Research, whose parent company market products containing probiotics. I undertook a consultancy project for an infant formula company (Dairy Goat Cooperative) in 2017, to help them design a robust and ethical clinical trial of an infant formula milk. The project related to prevention of eczema, but did not involve probiotics or eczema treatment".
Mimi Tang: "My conflicts of interest are as follows:
-
past member of global scientific advisory board Danone Nutricia (resigned December 2016);
-
past member of medical advisory board for Oceania Nestle Nutrition Institute (resigned);
-
speaker fees at symposia sponsored by Danone Nutricia, Abbott, and Nestle Health Science;
-
consultant to Deerfield, GLG, and Bayer;
-
employee with shares/share options Prota Therapeutics;
-
inventor on a patent owned by MCRI (Murdoch Children's Research Institute);
-
grant, received from my institution, from Prota Therapeutics;
-
royalties from Wiley, as an author of a book Kids Food Allergies for Dummies; and
-
payment for development of educational presentations from MD Linx ‐ I developed a GP education module: 'Microbiota and Immune Development'".
Areti Makrygeorgou: "I have received speaker honorarium by Celgene and support to travel to a conference by Novartis".
Jo Leonardi‐Bee: nothing to declare.
Fiona J Bath‐Hextall: nothing to declare.
Dedee F Murrell: "I run a clinical trials centre for a variety of skin diseases, including atopic dermatitis and give lectures on this topic. I am a Councillor (a voluntary position) representing Australia on the International Eczema Council. I have received travel expenses and payment for lectures from Sanofi. My institution has received grants for my role as investigator on atopic dermatitis clinical trials assessing crisaborole (Anacor Pharmaceuticals), dupilumab (Regeneron), tralokinumab (MedImmune), and nemolizumab (Galderma)."
Amanda Roberts: nothing to declare.
Nerys Roberts (clinical referee): "I am the Steering Committee chair of the Atopic Dermatitis Anti‐IgE Paediatric Trial (ADAPT)".
Raja Sivamani (clinical referee): "I serve as a Scientific Advisor for Dermveda".
Acknowledgements
We are grateful to Judy Taylor and George Varigos for their contributions in writing the protocol for this review.
Cochrane Skin wishes to thank Gloria Sanclemente, who was the Cochrane Dermatology Editor for this review; Sally Wilkes, who was the Statistical Editor; Ching‐Chi Chi, who was the Methods Editor; the clinical referees, Nerys Roberts and Raja Sivamani; and the review's copy‐editor, Dolores Matthews. The review authors would like to thank the Australasian Cochrane Centre for expertise and advice regarding completion of this review, and Damian Jolly for statistical advice.
For the update of the review: we are grateful to Daniel Munblit and Gregor Harris for help with translation of Russian articles and communication with study authors, to Agata Dunsmore and Maciej Studzinski for help with translation of one Polish article and efforts for communication with its author, and to Ivy Ngu for help with translation of a Chinese article.
Version history
| Published | Title | Stage | Authors | Version |
| 2018 Nov 21 | Probiotics for treating eczema | Review | Areti Makrgeorgou, Jo Leonardi‐Bee, Fiona J Bath‐Hextall, Dedee F Murrell, Mimi LK Tang, Amanda Roberts, Robert J Boyle | |
| 2008 Oct 08 | Probiotics for treating eczema | Review | Robert John Boyle, Fiona J Bath‐Hextall, Jo Leonardi‐Bee, Dedee F Murrell, Mimi LK Tang | |
| 2006 Jul 19 | Probiotics for atopic eczema | Protocol | Robert John Boyle, Fiona J Bath‐Hextall, S Donath, Dedee F Murrell, Mimi LK Tang, Judy Taylor, George Varigos | |
Differences between protocol and review
Changes between protocol and first or updated review
We changed the title, which was "Probiotics for atopic eczema" in the protocol to "Probiotics for treating eczema", on the advice of the referees.
We made small changes to the Background on the advice of referees of the first review.
We made small changes to the Criteria for considering studies for this review section to clarify issues.
In the protocol, we used the terms "short term" and "long term" for primary and secondary outcomes. We have replaced these terms with the phrases "at the end of active treatment" and "within six months after active treatment has ceased", respectively. We did this for clarity.
RB and FB completed data extraction in the first review, in place of RB and MT in the protocol, due to time availability.
In the review, when complete data sets were available from trial authors, we used these data to calculate summary statistics such as mean and standard deviation before data entry, but this was not stated in the protocol.
In the review, when studies reported participant‐ or investigator‐rated symptoms on categorical scales (e.g. Passeron 2006), we made the data dichotomous by defining a cutoff at good improvement in eczema versus mild improvement, no change, or worsening of eczema. This was not predefined in the protocol.
In the protocol, expressing numbers needed to treat was mentioned, but not in this review. We were going to estimate numbers needed to treat provided clinically positive results favoured probiotics; therefore this was not done.
In the review, we had to deal with data from studies with multiple treatment groups by combining the data from these groups and by converting non‐parametric statistics to parametric summary statistics, but this was not mentioned in the protocol.
In the protocol, it was not described that for analyses with extreme heterogeneity (e.g. I² statistic > 85%), we would consider not undertaking a meta‐analysis.
In the review, we calculated the pooled estimate using standardised mean differences when studies used different tools to measure the same outcome, which had not been stated in the protocol.
In the protocol, we did not mention that we would use available case analysis, rather than intention‐to‐treat analysis with imputation.
In the protocol, we had planned some subgroup analyses, but in the review, we presented the data in a stratified analysis. We have explained reasons for this in the Methods section and in the subsection Subgroup analysis and investigation of heterogeneity.
In the review, we performed analysis stratified by severity (mild, moderate, severe) of eczema based on the Severity Scoring of Atopic Dermatitis (SCORAD), which had not been clearly stated in the protocol. In the protocol, it was stated that we would split the eczema into mild, moderate, and severe if enough data were available, but not that a stratified analysis would take place.
Extra stratified analyses were undertaken in the review, and this had not been specified in the protocol ‐ outcome data were analysed according to the probiotic strain used (Analysis 1.21 to Analysis 1.28). We undertook these analyses because of unexplained heterogeneity between studies for primary and secondary outcomes and use of the same probiotic strain in several studies. As discussed above, conclusions from this analysis must be guarded due to its post hoc nature.
We edited the Objectives in line with MECIR reporting standards.
Selection of studies: for the protocol, RB and MT performed study selection; for the review update, RB and AM performed study selection. We encountered no differences that would require an arbitration.
For the update, RB and AM performed data extraction, but for the protocol, this was performed by RB and MT, and in the first review, by RB and FB.
In the protocol and in the first review, RB and FB checked the data, but in the updated review, it was JL and AM.
Assessment of risk of bias in the updated version of the review: we used the Cochrane 'Risk of bias' tool (Chapter 8.5, in Higgins 2011), which is not given in the protocol.
We reported dichotomous outcome data as odds ratios (ORs) in the first review, and risk ratios (RRs) were planned in the protocol. In the update for dichotomous outcomes, we expressed the results as RRs and 95% confidence intervals (CIs) for analyses containing only parallel‐group trials, and we used ORs when data from cross‐over studies were included in the meta‐analysis, in keeping with the methods stated in Elbourne 2002 and Duffy 1989.
We performed sensitivity analyses based on change in scores from baseline for both first and updated reviews and for studies with low risk of bias in the update. In the update, we defined studies with overall low risk of bias as those studies for which the randomisation process was clear; allocation concealment was clear and done; participants, clinicians, or outcome assessors were blinded; and there was no attrition bias.
We assessed the quality of evidence in the update of the review by using the GRADE tool, as is now recommended by Cochrane.
We used trial sequential analysis for our primary outcome in the update of this review (please see Methods).
For the update of the review, we performed assessments of reporting bias.
For the updated review, we revised the search methods in line with current Cochrane Skin practices. We included a search of the GREAT database (Global Resources of Eczema Trials) and of the following trials registers: the Australian New Zealand Clinical Trials Register (ANZCTR), the World Health Organization International Clinical Trials Registry platform, and the EU Clinical Trials Register. We did not update previous searches of ISI Web of Science, or of the Ongoing Skin Trials Register, whose content has now been migrated to ANZCTR. For full details of previous searches for the earlier review, see Boyle 2008.
Previously, we searched MEDLINE for adverse effects of probiotics. We did not perform an adverse events search for this update, but we recorded adverse events reported in included and excluded trials. Adverse events of probiotics have been well established, and we have referred only to relevant review articles.
We added a consumer (AR) to the review authors' group, as required by Cochrane for the review update. We also added a new review author (AM) to the review authors' group.
In this update, we presented 'Summary of findings' tables, but this was not stated in the protocol and was not done in the first review.
Keywords
MeSH
Medical Subject Headings (MeSH) Keywords
Medical Subject Headings Check Words
Adolescent; Adult; Child; Child, Preschool; Female; Humans; Infant; Male; Middle Aged; Young Adult;
PICOs

Risk of bias graph: review authors' judgements about each risk of bias item presented as percentages across all included studies.
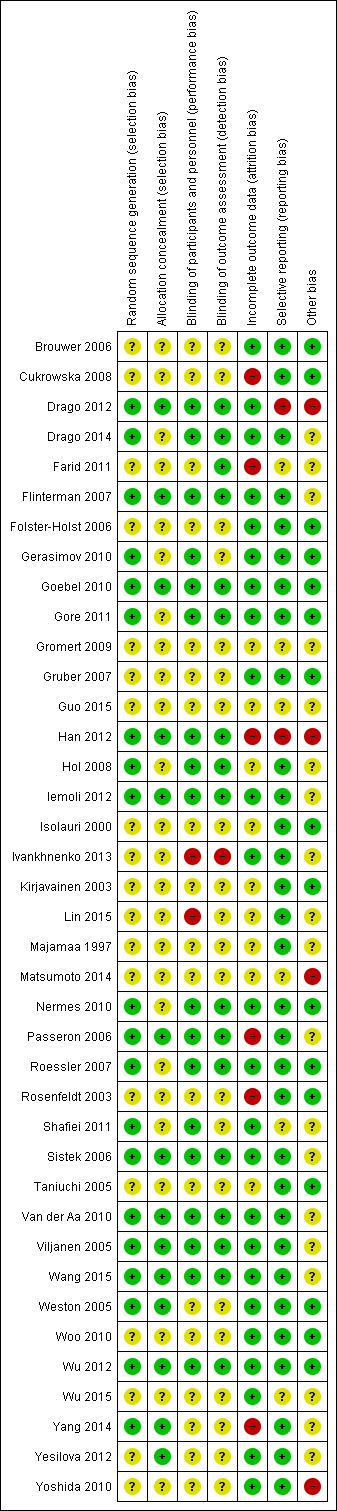
Risk of bias summary: review authors' judgements about each risk of bias item for each included study.

Trial sequential analysis for a minimum difference of ‐2 points difference in eczema symptoms (SCORAD part C; range 0 to 20) between probiotic and no probiotics at 90% power. The blue z‐curve of the meta‐analysis shows that the optimal heterogeneity‐adjusted information size of 258 has been reached. This suggests that future trials of similar interventions are unlikely to change the findings of no significant difference between probiotic and control for detection of at least a 2‐point difference.

Trial sequential analysis for a minimum difference of ‐1.5 points difference in eczema symptoms (SCORAD part C; range 0 to 20) between probiotics and no probiotics at 90% power. The blue z‐curve of the meta‐analysis has crossed the red v‐shaped line of futility and has reached the optimal heterogeneity‐adjusted information size of 456. This suggests that future trials of similar interventions are unlikely to change the findings of no significant difference between probiotic and control for detection of at least a 1.5‐point difference.

Trial sequential analysis for a minimum difference of ‐1 point difference in eczema symptoms (SCORAD part C; range 0 to 20) between probiotics and no probiotics at 90% power. The blue z‐curve of the meta‐analysis has not crossed the red v‐shaped line of futility and has not yet reached the optimal heterogeneity‐adjusted information size of 1026. This suggests that future trials of similar interventions may change the findings of no significant difference between probiotic and control for detection of at least a 1‐point difference.

Egger's plot for Analysis 1.1: probiotic vs placebo for participant‐ or parent‐rated symptoms of eczema (SCORAD part C) at the end of treatment.
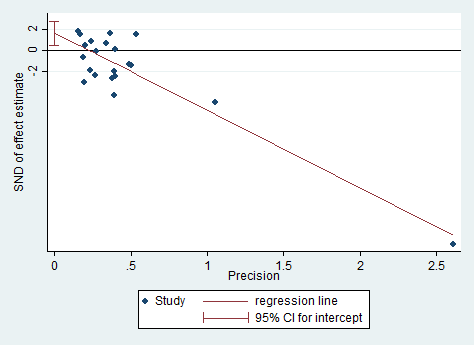
Egger's plot for Analysis 1.8: probiotic vs placebo for global eczema severity score (total SCORAD) at the end of treatment.

Egger's plot for Analysis 1.9: probiotic vs placebo for global eczema severity score (total SCORAD) at the end of treatment ‐ sensitivity analysis ‐ change score.

Comparison 1 Probiotic vs placebo, Outcome 1 Participant‐ or parent‐rated symptoms of eczema (SCORAD part C) at the end of treatment.

Comparison 1 Probiotic vs placebo, Outcome 2 Participant‐ or parent‐rated global change in eczema symptoms at the end of treatment (binary outcome).

Comparison 1 Probiotic vs placebo, Outcome 3 Change in participant‐ or parent‐rated symptoms of eczema (SCORAD part C) at the end treatment (continuous outcome).

Comparison 1 Probiotic vs placebo, Outcome 4 Participant‐ or patient‐related quality of life score at the end of treatment.

Comparison 1 Probiotic vs placebo, Outcome 5 Participant‐ or patient‐related quality of life score at the end of treatment.

Comparison 1 Probiotic vs placebo, Outcome 6 Parent‐ or participant‐rated eczema severity (SCORAD part C) within 6 months after treatment has ceased.

Comparison 1 Probiotic vs placebo, Outcome 7 Participant‐ or parent‐related quality of life within 6 months after treatment has ceased.

Comparison 1 Probiotic vs placebo, Outcome 8 Global eczema severity score (total SCORAD) at the end of treatment.

Comparison 1 Probiotic vs placebo, Outcome 9 Global eczema severity score (total SCORAD) at the end of treatment ‐ sensitivity analysis ‐ change score.

Comparison 1 Probiotic vs placebo, Outcome 10 Global eczema severity score (total SCORAD) at the end of treatment ‐ low risk of bias studies only.

Comparison 1 Probiotic vs placebo, Outcome 11 Investigator‐rated eczema severity (SCORAD parts A/B) at the end of treatment ‐ continuous outcome.

Comparison 1 Probiotic vs placebo, Outcome 12 Global eczema severity score (total SCORAD) within 6 months after treatment has ceased.

Comparison 1 Probiotic vs placebo, Outcome 13 Investigator‐rated eczema severity (SCORAD parts A/B) within 6 months after treatment has ceased.

Comparison 1 Probiotic vs placebo, Outcome 14 Adverse events (short term).

Comparison 1 Probiotic vs placebo, Outcome 15 Participant/parent‐rated global change in symptoms of eczema at the end of treatment ‐ stratified by age groups.

Comparison 1 Probiotic vs placebo, Outcome 16 Participant/parent‐rated symptoms of eczema (SCORAD part C) at the end of treatment ‐ stratified by age groups.

Comparison 1 Probiotic vs placebo, Outcome 17 Global eczema severity score (total SCORAD) at the end of treatment ‐ stratified by age groups.

Comparison 1 Probiotic vs placebo, Outcome 18 Global eczema severity score (total SCORAD) at the end of treatment ‐ stratified by presence of atopy.

Comparison 1 Probiotic vs placebo, Outcome 19 Global eczema severity score (total SCORAD) at the end of treatment ‐ stratified by challenge‐proven food allergy.

Comparison 1 Probiotic vs placebo, Outcome 20 Global eczema severity score (total SCORAD) at the end of treatment ‐ stratified by eczema severity.

Comparison 1 Probiotic vs placebo, Outcome 21 Participant‐ or parent‐rated symptoms of eczema (SCORAD part C) at the end of treatment ‐ stratified by probiotic ‐ Lactobacillus species.

Comparison 1 Probiotic vs placebo, Outcome 22 Participant‐ or parent‐rated symptoms of eczema (SCORAD part C) at the end of treatment ‐ stratified by probiotic ‐ Bifidobacterium species.

Comparison 1 Probiotic vs placebo, Outcome 23 Participant‐ or parent‐rated symptoms of eczema (SCORAD part C) at the end of treatment ‐ number of probiotics.

Comparison 1 Probiotic vs placebo, Outcome 24 Participant‐ or parent‐rated symptoms of eczema (SCORAD part C) at the end of treatment ‐ probiotics with no prebiotics.

Comparison 1 Probiotic vs placebo, Outcome 25 Global eczema severity score (total SCORAD) at the end of treatment ‐ stratified by probiotic ‐ Lactobacillus species.

Comparison 1 Probiotic vs placebo, Outcome 26 Global eczema severity score (total SCORAD) at the end of treatment ‐ stratified by probiotic ‐ Bifidobacterium species.

Comparison 1 Probiotic vs placebo, Outcome 27 Global eczema severity score (total SCORAD) at the end of treatment ‐ stratified by probiotic ‐ number of probiotics.

Comparison 1 Probiotic vs placebo, Outcome 28 Global eczema severity score (total SCORAD) at the end of treatment ‐ stratified by probiotic ‐ probiotics with no prebiotics.
| Comparison: probiotics vs no probiotics for treating eczema | ||||||
| Patient or population: male and female patients 0 to 55 years of age with physician‐diagnosed eczema Settings: primary or secondary care. Europe: 22 studies with 1390 participants. Asia: 8 studies with 500 participants. Australasia: 2 studies with 116 participants Intervention: probiotics ± prebiotics Comparison: no probiotics | ||||||
| Outcomes | Illustrative comparative risks* (95% CI) | Relative effect | No. of participants | Quality of the evidence | Comments | |
| Assumed risk | Corresponding risk | |||||
| No probiotics | Probiotics | |||||
| Primary outcome 1: participant‐ or parent‐rated symptoms of eczema (SCORAD part C) at the end of active treatment Visual analogue scale for itch and sleep disturbance ranging from 0 to 10 for each symptom and combined ranging from 0 to 20. The higher the score, the more severe the symptoms Duration of follow‐up from baseline until end of active treatment from 6 weeks to 3 months | Mean SCORAD part C score ranged across control groups from 2 to 7.9 | Mean SCORAD part C score in the intervention groups was 0.44 points lower (1.22 lower to 0.33 higher) | ‐ | 754 | ⊕⊕⊕⊝ | Two cross‐over studies included. Significant heterogeneity between studies Post hoc trial sequential analysis showed no effects of probiotics over control and suggests that further studies of currently available probiotic strains for this outcome may be futile |
| Primary outcome 1: participant‐ or parent‐rated global change in eczema symptoms at the end of active treatment (binary outcome) Change in risk for worsened/unchanged eczema Duration of follow‐up from baseline until end of active treatment from 6 weeks to 3 months | Low‐risk population | OR 0.40 (0.14 to 1.15) | 135 | ⊕⊕⊝⊝ | One cross‐over study included. Number of studies for this outcome was small. Moderate heterogeneity between studies | |
| 300 per 1000 | 146 per 1000 | |||||
| Medium‐risk population | ||||||
| 400 per 1000 | 210 per 1000 | |||||
| High‐risk population | ||||||
| 500 per 1000 | 286 per 1000 | |||||
| Primary outcome 2: participant‐ or parent‐rated participant quality of life score at the end of active treatment Scales used: DLQI, IDQoL, Skindex‐29, CDLQI. On those scales, the higher the score, the more severely the quality of life is affected Duration of follow‐up from baseline until end of active treatment from 8 weeks to 3 months | Mean DLQI score ranged across control groups from | Mean participant quality of life score in the intervention groups was | ‐ | 552 (6) | ⊕⊕⊝⊝ | Small number of studies for this outcome. Significant heterogeneity |
| Primary outcome 2: participant‐ or parent‐rated family quality of life score at the end of active treatment Scale used: DFI, FDLQI. On those scales, the higher the score, the more severely the quality of life is affected Duration of follow‐up from baseline until end of active treatment from 8 weeks to 3 months | Mean change in DFI score during treatment ranged across control groups from ‐2 points to ‐3 points | Mean family quality of life score in the intervention groups was 0.19 standard deviations lower (0.56 lower to 0.18 higher) | ‐ | 358 | ⊕⊝⊝⊝ | Very small number of studies for this outcome. Significant heterogeneity |
| Secondary outcome 4: global eczema severity score (total SCORAD) at the end of active treatment (Investigator‐rated eczema severity) Scale used: total SCORAD ranging from 0 to 103. The higher the score, the more severe the disease Duration of follow‐up from baseline until end of active treatment from 8 weeks to 16 weeks | Mean total SCORAD ranged across control groups from | Mean total SCORAD score in the intervention groups was 3.91 points lower (5.86 to 1.96 points lower) | ‐ | 1596 | ⊕⊕⊝⊝ | Two cross‐over studies included. Extreme levels of heterogeneity for this outcome. Evidence of reporting bias |
| Secondary outcome 6: adverse events (gastrointestinal symptoms) during active treatment Duration of follow‐up from baseline until end of active treatment from 8 weeks to 3 months | Low‐risk population | RR 1.54 (0.90 to 2.63) | 402 (7) | ⊕⊕⊝⊝ | Small number of studies reported adverse events. Small number of events were included in this analysis | |
| 0 per 1000 | 0 per 1000 | |||||
| Medium‐risk population | ||||||
| 100 per 1000 | 154 per 1000 | |||||
| High‐risk population | ||||||
| 200 per 1000 | 308 per 1000 | |||||
| *The basis for the assumed risk (e.g. the median control group risk across studies) is provided in footnotes. The corresponding risk (and its 95% confidence interval) is based on the assumed risk in the comparison group and the relative effect of the intervention (and its 95% CI). | ||||||
| GRADE Working Group grades of evidence. | ||||||
| aDowngraded by one level due to inconsistency as there was significant heterogeneity among studies (I² = 57%). bDowngraded by two levels due to small number of studies for this outcome (imprecision) and because of moderate levels of heterogeneity among studies (I² = 48%). cDowngraded by two levels due to small number of studies for this outcome (imprecision) and because of significant levels of heterogeneity among studies (I² = 68%). dDowngraded by three levels due to inconsistency (one level) as there was significant heterogeneity among studies (I² = 57%) and because of very small number of studies (imprecision) for this outcome (two levels). eDowngraded by two levels because of extreme levels of heterogeneity among studies (I² = 79%) and because of evidence of reporting bias. fDowngraded by two levels because of small number of studies reporting adverse events and small number of events in the meta‐analysis for this outcome (imprecision). | ||||||
| Forms of eczema included | Forms of eczema excluded |
| Atopic eczema | Seborrhoeic eczema |
| Atopic dermatitis | Contact eczema |
| Besnier's prurigo | Allergic contact eczema |
| Neurodermatitis atopica (German) | Irritant contact eczema |
| Flexural eczema/dermatitis | Discoid/nummular eczema |
| Periorbital eczema | Asteatotic eczema |
| Childhood eczema | Varicose/stasis eczema |
| Infantile eczema | Photo‐/light‐sensitive eczema |
| 'Eczema' unspecified | Chronic actinic dermatitis |
| Constitutional eczema | Dyshidrotic eczema |
| Endogenous eczema | Pompholyx eczema |
| Chronic eczema | Hand eczema |
| Neurodermatitis | Frictional lichenoid dermatitis |
| Neurodermatitis (German) | Lichen simplex |
| Occupational dermatitis | |
| Prurigo |
| Isolauri 2mo LGG | Isolauri 2mo Bb12 | Isolauri 2mo placebo | |
| N | 9 | 9 | 9 |
| Median | 1 | 0 | 13.4 |
| IQR | 0.1 to 8.7 | 0 to 3.8 | 4.5 to 18.2 |
| IQR: interquartile range. | |||
| Study | Clarity of methods | Compliance | Dietary management |
| Clear | No compliance measures described | Adequate exclusion of other probiotics during the study | |
| Total daily dose of intervention clear, but individual dose, frequency, and mode of administration not given | No compliance measures reported | Not stated | |
| Clear | Dose count (returned sachet packets counted by clinical investigator). Compliance measured for the 2 groups: 84.5% and 84.7%. No significant difference | Clear instructions given: no change in usual diet but avoid any type of fermented food containing live micro‐organisms | |
| Clear | No information provided | No information provided | |
| Aims and Interventions clear. Outcomes not clear and baseline severity (SCORAD) not given | No information given | Inadequate information | |
| Aims, interventions clear | Inadequate information | Inadequate information | |
| Clear | No compliance measures reported | Not stated | |
| Total daily dose of probiotics not clear. Remaining methods clear | Compliance checked from the parental report and the weight of remaining powder. Reported that there were no differences in compliance between the 2 groups | No information on adequate exclusion of other probiotics from the diet. Participants with challenge proved milk or egg allergy followed milk or egg elimination diet, respectively | |
| Clear | Compliance based on count of remaining capsules: average 94% for all groups and 93.6%, 95%, and 93.3% for Bifidobacterium, Lactobacillus, and placebo groups, respectively. No significant difference in compliance between the 3 groups (P = 0.6). No participating child had compliance lower than 72% | No information given | |
| All methods clear Reporting of adverse events suggests that these were the result of the change in formula but the numbers are totals from intervention and control groups, and it is not certain whether the AEs are associated with the formula or the probiotics | No compliance measures reported | Instructions given that other fermented or probiotic‐containing products were to be avoided | |
| Inadequate information available | No information | No information | |
| Unclear what the placebo was; otherwise clear | 92.5% of doses taken by probiotic group; 94.4% by placebo group | Not stated, other than encouragement to avoid allergens | |
| Dose and exact consistency of probiotics unclear | No information | No information | |
| Preparation of the intervention not clear. Otherwise clear | No compliance measure described | Clear instructions not to consume fermented food and products containing live micro‐organisms | |
| Trial designed to study effects of probiotics in participants with cow's milk allergy. Effects of probiotics on eczema ‐ secondary outcome. Aims, interventions, and outcome measures clear | Compliance measure not presented. "To optimise compliance, participants were supplied with study formula through the study team and batches were delivered at home" | No information provided | |
| Clear | Method: count of return sachets. Reported that compliance was similar in the 2 groups but no measures reported | Instructions given so that participants do not change their diet during trial but should avoid fermented food products containing live micro‐organisms | |
| Unclear ‐ dose and duration of probiotic treatment received not clearly described. Severity of participant eczema at baseline not described | No compliance measures reported | Not stated | |
| Placebo not described. Otherwise methods clear | No compliance measures reported | Not stated | |
| Unclear ‐ intended duration of study treatment not stated | No compliance measures reported | Not stated | |
| Exact dose of probiotics not given | No information provided | No information provided | |
| Unclear ‐ precise dose of probiotic received by participants not stated | No compliance measures described | Not stated | |
| Clear | No information provided | Clearly stated: "All patients were asked to avoid probiotic supplements, fermented milk, lactic acid bacterial drinks and fermented soybean (natto) during the experimental period…" | |
| Clear | No compliance measures reported | Not stated | |
| Clear | No compliance measures described | Not stated | |
| Clear | No compliance measures described | Adequate exclusion of prebiotics and probiotics 3 weeks before the start and during the 20 weeks of the intervention | |
| Clear | No compliance measures described | Adequate exclusion of other probiotics during study | |
| Intervention type not clear: synbiotic mixture of 7 strains of probiotics and fructo‐oligosaccharide. Dose, frequency of intake, and preparation clear Baseline characteristics given only for participants who completed the trial | No compliance measures reported | Unclear. Stated that participants did not change diet before or during the trial | |
| Clear | Assessed by 2 telephone calls | One participant noted to have taken non‐study probiotic | |
| Clear | No compliance measures described | Not stated | |
| Clear | No compliance measures reported. Participants' parents were keeping diary for formula intake and adverse events. Formula with intervention was given on demand and at the end of intervention. No significant differences in formula intake were noted between the 2 groups | Unclear | |
| Method for diagnosing eczema not described | No compliance measures described | Not stated | |
| All clear. In the publication, not clear what the placebo was, but this was clarified by the study author | Yes: capsule count performed | Yes Stated: "During the study…and other probiotics were not permitted" | |
| Clear | Sachet counts and parent‐completed sachet administration chart. Good compliance (94%) ‐ no differences between the 2 groups | Adequate exclusion of other probiotics during study | |
| Clear | No measure of compliance was reported, but it was stated that the 2 groups had no difference in compliance | No information provided | |
| Aims, interventions, and outcome measures clear. Exclusion criteria not given | Patients and parents were to return to investigators all unused intervention. No measure was reported | Instruction given to parents not to feed their children other probiotic preparations during the intervention | |
| Aims, interventions, and outcome measures clear. Dose of probiotic not given in colony‐forming units, or similar measure of bacterial numbers | Compliance recorded: assessed based on a count of returned medication | No information provided | |
| All clear | No information given | Instructions given to avoid any commercial probiotic‐containing products 2 weeks before study initiation. No comment about diet during the trial | |
| All clear | No information provided | No information provided | |
| Placebo not described. Otherwise clear | No compliance measures reported | No information given | |
| SCORAD: Severity Scoring of Atopic Dermatitis. | |||
| Rosenfeldt 2003 | Gruber 2007 | Weston 2005 | Folster‐Holst 2006 | Gerasimov 2010 | Han 2012 | Wu 2012 | Woo 2010 | Van der Aa 2010 | Gore 2011 | Wu 2015 | |
| Median grams hydrocortisone butyrate applied (range) | Probiotic: 7.8 (0 to 67) Placebo: 6.0 (0 to 59) | ‐ | ‐ | ‐ | ‐ | ‐ | ‐ | ‐ | ‐ | ‐ | ‐ |
| Mean grams 1% hydrocortisone applied (SD) | ‐ | Probiotic: 0.8 (45.0) Placebo: 3.5 (29.8) | ‐ | ‐ | ‐ | ‐ | ‐ | ‐ | ‐ | ‐ | ‐ |
| Median change in topical corticosteroid use score (IQR) | ‐ | ‐ | Probiotic: 0.25 (‐6.7 to 7.0) Placebo: ‐1.0 (‐8.0 to 0.7) | ‐ | ‐ | ‐ | ‐ | ‐ | ‐ | ‐ | ‐ |
| Mean applications per week (SD) | ‐ | ‐ | ‐ | Probiotic: 3.0 (0.6) Placebo: 3.2 (0.9) | Probiotic: 0.8 (0.9) Placebo: 1.2 (1.4) | ‐ | ‐ | ‐ | ‐ | ‐ | ‐ |
| Number of participants using topical CS during study (%) | ‐ | ‐ | ‐ | ‐ | ‐ | Baseline Probiotics: 13/58 (22.4%) Placebo: 14/60 (23.3%) At end of treatment Probiotics: 13/44 (29.5%) Placebo: 14/39 (36%) | ‐ | Probiotic: 22/45 (49%) Placebo: 20/43 (46%) | Baseline Synbiotic: 25/45 (55.6%) Placebo: 22/44 (50%) At end of treatment Synbiotic: 22/41 (53.7%) Placebo: 24/42 (57.1%) | ‐ | ‐ |
| Mean grams 0.25% prednicarbate applied during study (SD) | ‐ | ‐ | ‐ | ‐ | ‐ | Probiotic: Placebo: | ‐ | ‐ | ‐ | ‐ | ‐ |
| Mean applications of CS or calcineurin inhibitor per month (SD) | ‐ | ‐ | ‐ | ‐ | ‐ | ‐ | Probiotic: 23.5 (19.1) Placebo: 19.1 (19) | ‐ | ‐ | ‐ | ‐ |
| Median grams of 0.1% prednicarbate during Intervention (range) | ‐ | ‐ | ‐ | ‐ | ‐ | ‐ | ‐ | Probiotic: Placebo: | ‐ | ‐ | ‐ |
| Median change in grams of 0.1% prednicarbate use during intervention (range) | ‐ | ‐ | ‐ | ‐ | ‐ | ‐ | ‐ | Probiotic: ‐0.5 (‐2.7 to 1.3) Placebo: ‐0.3 | ‐ | ‐ | ‐ |
| Number of participants using standard skin care at end of intervention | ‐ | ‐ | ‐ | ‐ | ‐ | ‐ | ‐ | ‐ | ‐ | Probiotic: 29/88 (33%) Placebo: 21/47 (45%) | ‐ |
| Number of participants using different potencies of TCS at end of intervention | ‐ | ‐ | ‐ | ‐ | ‐ | ‐ | ‐ | ‐ | ‐ | Emollients only Probiotic: 31/88 (35%) Placebo: 18/47 (38%) Mild Probiotic: 54/88 (61%) Placebo: 29/47 (62%) ≥ moderate/potent Probiotic: 3/88 (3%) Placebo: 0 | ‐ |
| Mean grams of TCS (hydrocortisone 1% or mometasone 0.1%) used during study (SD) | ‐ | ‐ | ‐ | ‐ | Probiotic: Placebo: | ‐ | ‐ | ‐ | ‐ | ‐ | ‐ |
| Median grams of TCS (hydrocortisone 1% or mometasone 0.1%) used during study (range) | ‐ | ‐ | ‐ | ‐ | Probiotic: 25.0 (0.0 to 45.0) Placebo: 35.0 (15.0 to 50.0) | ‐ | ‐ | ‐ | ‐ | ‐ | ‐ |
| Mean total amount (gr) of corticosteroid used during treatment period ± SD | ‐ | ‐ | ‐ | ‐ | ‐ | ‐ | ‐ | ‐ | ‐ | ‐ | Probiotic: 5.87 ± 7.48 Placebo: 4.73 ± 5.48 |
| CS: corticosteroids. | |||||||||||
| Outcome or subgroup title | No. of studies | No. of participants | Statistical method | Effect size |
| 1 Participant‐ or parent‐rated symptoms of eczema (SCORAD part C) at the end of treatment Show forest plot | 13 | Mean difference (Random, 95% CI) | ‐0.44 [‐1.22, 0.33] | |
| 1.1 Parallel‐group trials | 11 | Mean difference (Random, 95% CI) | ‐0.42 [‐1.27, 0.43] | |
| 1.2 Cross‐over trials | 2 | Mean difference (Random, 95% CI) | ‐0.52 [‐3.16, 2.12] | |
| 2 Participant‐ or parent‐rated global change in eczema symptoms at the end of treatment (binary outcome) Show forest plot | 3 | Odds ratio (Random, 95% CI) | 0.40 [0.14, 1.15] | |
| 2.1 Parallel‐group trials | 2 | Odds ratio (Random, 95% CI) | 0.70 [0.27, 1.77] | |
| 2.2 Cross‐over trials | 1 | Odds ratio (Random, 95% CI) | 0.18 [0.05, 0.60] | |
| 3 Change in participant‐ or parent‐rated symptoms of eczema (SCORAD part C) at the end treatment (continuous outcome) Show forest plot | 9 | Mean Difference (Random, 95% CI) | ‐0.70 [‐1.47, 0.06] | |
| 3.1 Parallel‐group trials | 8 | Mean Difference (Random, 95% CI) | ‐0.82 [‐1.62, ‐0.02] | |
| 3.2 Cross‐over studies | 1 | Mean Difference (Random, 95% CI) | 0.66 [‐1.79, 3.11] | |
| 4 Participant‐ or patient‐related quality of life score at the end of treatment Show forest plot | 6 | Std. Mean Difference (Random, 95% CI) | 0.03 [‐0.36, 0.42] | |
| 4.1 Infant's Dermatitis Quality of Life Index (IDQoL) | 2 | Std. Mean Difference (Random, 95% CI) | 0.35 [0.08, 0.62] | |
| 4.2 Dermatology Life Quality Index | 1 | Std. Mean Difference (Random, 95% CI) | ‐0.33 [‐0.95, 0.29] | |
| 4.3 Skindex‐29 Questionnaire | 2 | Std. Mean Difference (Random, 95% CI) | ‐0.66 [‐4.24, 2.92] | |
| 4.4 Children's Dermatology Quality of Life Index | 1 | Std. Mean Difference (Random, 95% CI) | ‐0.39 [‐0.70, ‐0.08] | |
| 5 Participant‐ or patient‐related quality of life score at the end of treatment Show forest plot | 3 | Std. Mean Difference (Random, 95% CI) | ‐0.19 [‐0.56, 0.18] | |
| 5.1 Dermatitis Family Impact Questionnaire (DFI) | 2 | Std. Mean Difference (Random, 95% CI) | ‐0.31 [‐0.86, 0.24] | |
| 5.2 Family Dermatology Dermatology Life Quality Index | 1 | Std. Mean Difference (Random, 95% CI) | ‐0.01 [‐0.32, 0.30] | |
| 6 Parent‐ or participant‐rated eczema severity (SCORAD part C) within 6 months after treatment has ceased Show forest plot | 3 | 185 | Mean Difference (IV, Random, 95% CI) | ‐1.81 [‐3.13, ‐0.49] |
| 7 Participant‐ or parent‐related quality of life within 6 months after treatment has ceased Show forest plot | 2 | 261 | Std. Mean Difference (IV, Random, 95% CI) | ‐0.08 [‐0.35, 0.20] |
| 7.1 Dermatology Life Quality Index | 1 | 46 | Std. Mean Difference (IV, Random, 95% CI) | ‐0.14 [‐0.75, 0.48] |
| 7.2 Child Dermatology Life Quality Index | 1 | 215 | Std. Mean Difference (IV, Random, 95% CI) | ‐0.06 [‐0.37, 0.25] |
| 8 Global eczema severity score (total SCORAD) at the end of treatment Show forest plot | 24 | Mean difference (Random, 95% CI) | ‐3.91 [‐5.86, ‐1.96] | |
| 8.1 Parallel‐group studies | 22 | Mean difference (Random, 95% CI) | ‐3.84 [‐5.95, ‐1.72] | |
| 8.2 Cross‐over studies | 2 | Mean difference (Random, 95% CI) | ‐4.14 [‐7.68, ‐0.59] | |
| 9 Global eczema severity score (total SCORAD) at the end of treatment ‐ sensitivity analysis ‐ change score Show forest plot | 14 | Mean difference (Random, 95% CI) | ‐4.46 [‐6.49, ‐2.43] | |
| 9.1 Parallel‐group trial | 13 | Mean difference (Random, 95% CI) | ‐4.53 [‐6.72, ‐2.33] | |
| 9.2 Cross‐over trial | 1 | Mean difference (Random, 95% CI) | ‐3.93 [‐9.25, 1.40] | |
| 10 Global eczema severity score (total SCORAD) at the end of treatment ‐ low risk of bias studies only Show forest plot | 8 | Mean difference (Random, 95% CI) | Totals not selected | |
| 10.1 Parallel‐group studies | 8 | Mean difference (Random, 95% CI) | 0.0 [0.0, 0.0] | |
| 11 Investigator‐rated eczema severity (SCORAD parts A/B) at the end of treatment ‐ continuous outcome Show forest plot | 10 | 529 | Mean Difference (IV, Random, 95% CI) | ‐2.24 [‐4.69, 0.20] |
| 12 Global eczema severity score (total SCORAD) within 6 months after treatment has ceased Show forest plot | 7 | Mean difference (Random, 95% CI) | ‐7.72 [‐11.85, ‐3.59] | |
| 12.1 Parallel‐group studies | 6 | Mean difference (Random, 95% CI) | ‐9.27 [‐13.88, ‐4.65] | |
| 12.2 Cross‐over studies | 1 | Mean difference (Random, 95% CI) | 0.2 [‐3.86, 4.26] | |
| 13 Investigator‐rated eczema severity (SCORAD parts A/B) within 6 months after treatment has ceased Show forest plot | 2 | 102 | Mean Difference (IV, Random, 95% CI) | ‐8.11 [‐13.14, ‐3.09] |
| 14 Adverse events (short term) Show forest plot | 7 | Risk Ratio (M‐H, Random, 95% CI) | Subtotals only | |
| 14.1 Gastrointestinal symptoms | 7 | 402 | Risk Ratio (M‐H, Random, 95% CI) | 1.54 [0.90, 2.63] |
| 15 Participant/parent‐rated global change in symptoms of eczema at the end of treatment ‐ stratified by age groups Show forest plot | 3 | Odds ratio (Random, 95% CI) | Totals not selected | |
| 15.1 Age under 2 years | 1 | Odds ratio (Random, 95% CI) | 0.0 [0.0, 0.0] | |
| 15.2 Age 2 to 12 years | 1 | Odds ratio (Random, 95% CI) | 0.0 [0.0, 0.0] | |
| 15.3 Age not categorised | 1 | Odds ratio (Random, 95% CI) | 0.0 [0.0, 0.0] | |
| 16 Participant/parent‐rated symptoms of eczema (SCORAD part C) at the end of treatment ‐ stratified by age groups Show forest plot | 12 | Mean difference (Random, 95% CI) | Subtotals only | |
| 16.1 Age under 2 years | 5 | Mean difference (Random, 95% CI) | ‐0.39 [‐2.20, 1.42] | |
| 16.2 Age 2 to 12 years | 4 | Mean difference (Random, 95% CI) | ‐0.63 [‐2.04, 0.78] | |
| 16.3 Age not categorised | 2 | Mean difference (Random, 95% CI) | ‐2.23 [‐3.71, ‐0.74] | |
| 16.4 Adults only | 2 | Mean difference (Random, 95% CI) | 1.01 [‐0.82, 2.84] | |
| 17 Global eczema severity score (total SCORAD) at the end of treatment ‐ stratified by age groups Show forest plot | 24 | Mean difference (Random, 95% CI) | Subtotals only | |
| 17.1 Age under 2 years | 10 | Mean difference (Random, 95% CI) | ‐0.99 [‐3.97, 1.99] | |
| 17.2 Age 2 to 12 years | 3 | Mean difference (Random, 95% CI) | ‐6.08 [‐9.68, ‐2.48] | |
| 17.3 Age not categorised | 7 | Mean difference (Random, 95% CI) | ‐5.25 [‐10.43, ‐0.07] | |
| 17.4 Adults only | 5 | Mean difference (Random, 95% CI) | ‐6.51 [‐10.09, ‐2.93] | |
| 18 Global eczema severity score (total SCORAD) at the end of treatment ‐ stratified by presence of atopy Show forest plot | 23 | Mean difference (Random, 95% CI) | Subtotals only | |
| 18.1 Participants with atopy | 4 | Mean difference (Random, 95% CI) | ‐3.90 [‐15.52, 7.73] | |
| 18.2 Participants with unknown atopic status | 19 | Mean difference (Random, 95% CI) | ‐4.15 [‐6.02, ‐2.27] | |
| 19 Global eczema severity score (total SCORAD) at the end of treatment ‐ stratified by challenge‐proven food allergy Show forest plot | 21 | Mean difference (Random, 95% CI) | Subtotals only | |
| 19.1 Food allergy present | 3 | Mean difference (Random, 95% CI) | ‐1.84 [‐6.22, 2.54] | |
| 19.2 Unknown food allergic status | 18 | Mean difference (Random, 95% CI) | ‐3.21 [‐5.63, ‐0.79] | |
| 20 Global eczema severity score (total SCORAD) at the end of treatment ‐ stratified by eczema severity Show forest plot | 6 | Mean Difference (IV, Random, 95% CI) | Subtotals only | |
| 20.1 Severe eczema (SCORAD over 40) | 5 | 95 | Mean Difference (IV, Random, 95% CI) | ‐3.71 [‐10.05, 2.64] |
| 20.2 Moderate eczema (SCORAD 15 to 40) | 6 | 279 | Mean Difference (IV, Random, 95% CI) | ‐2.95 [‐7.65, 1.74] |
| 20.3 Mild eczema (SCORAD under 15) | 1 | 8 | Mean Difference (IV, Random, 95% CI) | ‐5.53 [‐15.29, 4.23] |
| 21 Participant‐ or parent‐rated symptoms of eczema (SCORAD part C) at the end of treatment ‐ stratified by probiotic ‐ Lactobacillus species Show forest plot | 12 | Mean difference (Random, 95% CI) | Subtotals only | |
| 21.1 Lactobacillus GG alone or in combination with or without prebiotic | 1 | Mean difference (Random, 95% CI) | 1.79 [0.29, 3.29] | |
| 21.2 Lactobacillus rhamnosus alone or in combination with or without prebiotic | 5 | Mean difference (Random, 95% CI) | ‐0.82 [‐2.24, 0.60] | |
| 21.3 Lactobacillus salivarius alone or in combination with or without prebiotic | 1 | Mean difference (Random, 95% CI) | 0.0 [‐0.88, 0.88] | |
| 21.4 Lactobacillus casei/paracasei alone or in combination with or without prebiotics | 2 | Mean difference (Random, 95% CI) | 0.56 [‐0.29, 1.41] | |
| 21.5 Any Lactobacillus species alone or in combination with or without prebiotics | 12 | Mean difference (Random, 95% CI) | ‐0.50 [‐1.31, 0.31] | |
| 22 Participant‐ or parent‐rated symptoms of eczema (SCORAD part C) at the end of treatment ‐ stratified by probiotic ‐ Bifidobacterium species Show forest plot | 5 | Mean difference (Random, 95% CI) | Subtotals only | |
| 22.1 Bifidobacterium lactis alone or in combination with or without prebiotics | 4 | Mean difference (Random, 95% CI) | ‐0.34 [‐1.92, 1.24] | |
| 22.2 Bifidobacterium breve alone or in combination with or without prebiotics | 1 | Mean difference (Random, 95% CI) | 1.3 [‐2.15, 4.75] | |
| 22.3 Any Bifidobacteria species alone or in combination with or without prebiotic | 5 | Mean difference (Random, 95% CI) | ‐0.11 [‐1.47, 1.25] | |
| 23 Participant‐ or parent‐rated symptoms of eczema (SCORAD part C) at the end of treatment ‐ number of probiotics Show forest plot | 13 | Mean difference (Random, 95% CI) | Subtotals only | |
| 23.1 Studies using single probiotic with or without prebiotics | 8 | Mean difference (Random, 95% CI) | ‐0.40 [‐1.45, 0.66] | |
| 23.2 Studies using multiple probiotics with or without prebiotics | 5 | Mean difference (Random, 95% CI) | ‐0.58 [‐1.98, 0.81] | |
| 24 Participant‐ or parent‐rated symptoms of eczema (SCORAD part C) at the end of treatment ‐ probiotics with no prebiotics Show forest plot | 13 | Mean difference (Random, 95% CI) | ‐0.44 [‐1.22, 0.33] | |
| 25 Global eczema severity score (total SCORAD) at the end of treatment ‐ stratified by probiotic ‐ Lactobacillus species Show forest plot | 21 | Mean difference (Random, 95% CI) | Subtotals only | |
| 25.1 Lactobacillus GG alone or in combination with or without prebiotic | 3 | Mean difference (Random, 95% CI) | 3.37 [0.55, 6.20] | |
| 25.2 Lactobacillus rhamnosus alone or in combination with or without prebiotic | 5 | Mean difference (Random, 95% CI) | ‐3.49 [‐9.81, 2.83] | |
| 25.3 Lactobacillus salivarius alone or in combination with or without prebiotic | 6 | Mean difference (Random, 95% CI) | ‐6.86 [‐10.08, ‐3.63] | |
| 25.4 Lactobacillus casei/paracasei alone or in combination with or without prebiotics | 6 | Mean difference (Random, 95% CI) | ‐2.58 [‐7.21, 2.05] | |
| 25.5 Any Lactobacillus species alone or in combination with or without prebiotics | 21 | Mean difference (Random, 95% CI) | ‐3.80 [‐6.06, ‐1.54] | |
| 26 Global eczema severity score (total SCORAD) at the end of treatment ‐ stratified by probiotic ‐ Bifidobacterium species Show forest plot | 12 | Mean difference (Random, 95% CI) | Subtotals only | |
| 26.1 Bifidobacterium lactis alone or in combination with or without prebiotics | 7 | Mean difference (Random, 95% CI) | ‐1.90 [‐5.42, 1.63] | |
| 26.2 Bifidobacterium breve alone or in combination with or without prebiotics | 3 | Mean difference (Random, 95% CI) | ‐0.36 [‐11.39, 10.67] | |
| 26.3 Any Bifidobacteria species alone or in combination with or without prebiotic | 12 | Mean difference (Random, 95% CI) | ‐2.26 [‐5.14, 0.63] | |
| 27 Global eczema severity score (total SCORAD) at the end of treatment ‐ stratified by probiotic ‐ number of probiotics Show forest plot | 24 | Mean difference (Random, 95% CI) | Subtotals only | |
| 27.1 Studies using single probiotic with or without prebiotics | 13 | Mean difference (Random, 95% CI) | ‐4.90 [‐7.66, ‐2.15] | |
| 27.2 Studies using multiple probiotics with or without prebiotics | 12 | Mean difference (Random, 95% CI) | ‐3.54 [‐6.50, ‐0.58] | |
| 28 Global eczema severity score (total SCORAD) at the end of treatment ‐ stratified by probiotic ‐ probiotics with no prebiotics Show forest plot | 24 | Mean difference (Random, 95% CI) | ‐3.83 [‐5.81, ‐1.86] | |