| 1 Participant‐ or parent‐rated symptoms of eczema (SCORAD part C) at the end of treatment Show forest plot | 13 | | Mean difference (Random, 95% CI) | ‐0.44 [‐1.22, 0.33] |
|
| 1.1 Parallel‐group trials | 11 | | Mean difference (Random, 95% CI) | ‐0.42 [‐1.27, 0.43] |
| 1.2 Cross‐over trials | 2 | | Mean difference (Random, 95% CI) | ‐0.52 [‐3.16, 2.12] |
| 2 Participant‐ or parent‐rated global change in eczema symptoms at the end of treatment (binary outcome) Show forest plot | 3 | | Odds ratio (Random, 95% CI) | 0.40 [0.14, 1.15] |
|
| 2.1 Parallel‐group trials | 2 | | Odds ratio (Random, 95% CI) | 0.70 [0.27, 1.77] |
| 2.2 Cross‐over trials | 1 | | Odds ratio (Random, 95% CI) | 0.18 [0.05, 0.60] |
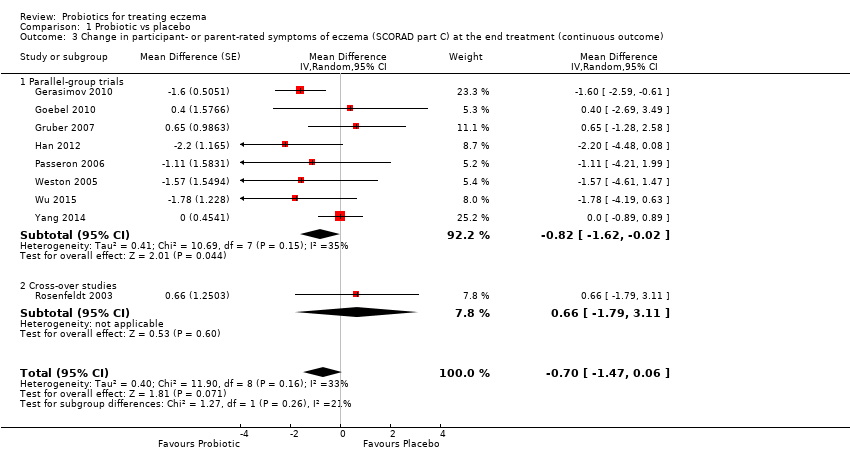
| 3 Change in participant‐ or parent‐rated symptoms of eczema (SCORAD part C) at the end treatment (continuous outcome) Show forest plot | 9 | | Mean Difference (Random, 95% CI) | ‐0.70 [‐1.47, 0.06] |
|
| 3.1 Parallel‐group trials | 8 | | Mean Difference (Random, 95% CI) | ‐0.82 [‐1.62, ‐0.02] |
| 3.2 Cross‐over studies | 1 | | Mean Difference (Random, 95% CI) | 0.66 [‐1.79, 3.11] |
| 4 Participant‐ or patient‐related quality of life score at the end of treatment Show forest plot | 6 | | Std. Mean Difference (Random, 95% CI) | 0.03 [‐0.36, 0.42] |
|
| 4.1 Infant's Dermatitis Quality of Life Index (IDQoL) | 2 | | Std. Mean Difference (Random, 95% CI) | 0.35 [0.08, 0.62] |
| 4.2 Dermatology Life Quality Index | 1 | | Std. Mean Difference (Random, 95% CI) | ‐0.33 [‐0.95, 0.29] |
| 4.3 Skindex‐29 Questionnaire | 2 | | Std. Mean Difference (Random, 95% CI) | ‐0.66 [‐4.24, 2.92] |
| 4.4 Children's Dermatology Quality of Life Index | 1 | | Std. Mean Difference (Random, 95% CI) | ‐0.39 [‐0.70, ‐0.08] |
| 5 Participant‐ or patient‐related quality of life score at the end of treatment Show forest plot | 3 | | Std. Mean Difference (Random, 95% CI) | ‐0.19 [‐0.56, 0.18] |
|
| 5.1 Dermatitis Family Impact Questionnaire (DFI) | 2 | | Std. Mean Difference (Random, 95% CI) | ‐0.31 [‐0.86, 0.24] |
| 5.2 Family Dermatology Dermatology Life Quality Index | 1 | | Std. Mean Difference (Random, 95% CI) | ‐0.01 [‐0.32, 0.30] |
| 6 Parent‐ or participant‐rated eczema severity (SCORAD part C) within 6 months after treatment has ceased Show forest plot | 3 | 185 | Mean Difference (IV, Random, 95% CI) | ‐1.81 [‐3.13, ‐0.49] |
|
| 7 Participant‐ or parent‐related quality of life within 6 months after treatment has ceased Show forest plot | 2 | 261 | Std. Mean Difference (IV, Random, 95% CI) | ‐0.08 [‐0.35, 0.20] |
|
| 7.1 Dermatology Life Quality Index | 1 | 46 | Std. Mean Difference (IV, Random, 95% CI) | ‐0.14 [‐0.75, 0.48] |
| 7.2 Child Dermatology Life Quality Index | 1 | 215 | Std. Mean Difference (IV, Random, 95% CI) | ‐0.06 [‐0.37, 0.25] |
| 8 Global eczema severity score (total SCORAD) at the end of treatment Show forest plot | 24 | | Mean difference (Random, 95% CI) | ‐3.91 [‐5.86, ‐1.96] |
|
| 8.1 Parallel‐group studies | 22 | | Mean difference (Random, 95% CI) | ‐3.84 [‐5.95, ‐1.72] |
| 8.2 Cross‐over studies | 2 | | Mean difference (Random, 95% CI) | ‐4.14 [‐7.68, ‐0.59] |
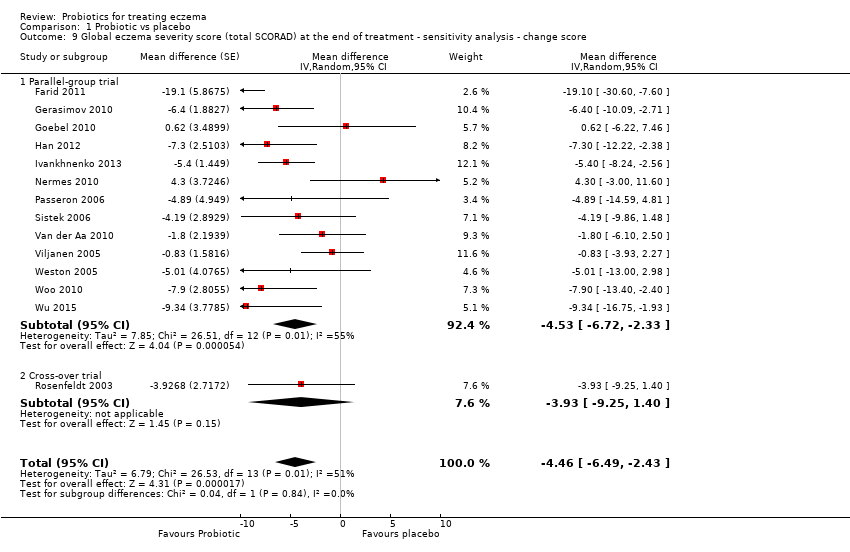
| 9 Global eczema severity score (total SCORAD) at the end of treatment ‐ sensitivity analysis ‐ change score Show forest plot | 14 | | Mean difference (Random, 95% CI) | ‐4.46 [‐6.49, ‐2.43] |
|
| 9.1 Parallel‐group trial | 13 | | Mean difference (Random, 95% CI) | ‐4.53 [‐6.72, ‐2.33] |
| 9.2 Cross‐over trial | 1 | | Mean difference (Random, 95% CI) | ‐3.93 [‐9.25, 1.40] |
| 10 Global eczema severity score (total SCORAD) at the end of treatment ‐ low risk of bias studies only Show forest plot | 8 | | Mean difference (Random, 95% CI) | Totals not selected |
|
| 10.1 Parallel‐group studies | 8 | | Mean difference (Random, 95% CI) | 0.0 [0.0, 0.0] |
| 11 Investigator‐rated eczema severity (SCORAD parts A/B) at the end of treatment ‐ continuous outcome Show forest plot | 10 | 529 | Mean Difference (IV, Random, 95% CI) | ‐2.24 [‐4.69, 0.20] |
|
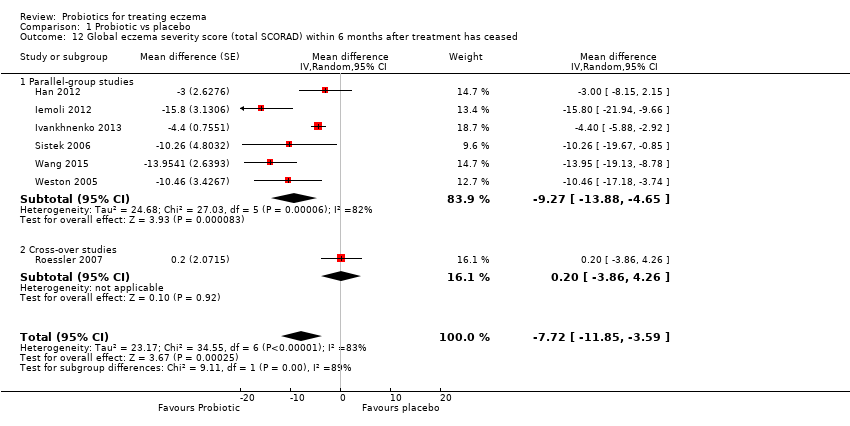
| 12 Global eczema severity score (total SCORAD) within 6 months after treatment has ceased Show forest plot | 7 | | Mean difference (Random, 95% CI) | ‐7.72 [‐11.85, ‐3.59] |
|
| 12.1 Parallel‐group studies | 6 | | Mean difference (Random, 95% CI) | ‐9.27 [‐13.88, ‐4.65] |
| 12.2 Cross‐over studies | 1 | | Mean difference (Random, 95% CI) | 0.2 [‐3.86, 4.26] |
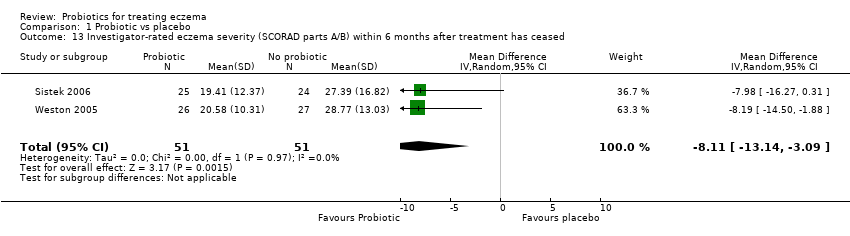
| 13 Investigator‐rated eczema severity (SCORAD parts A/B) within 6 months after treatment has ceased Show forest plot | 2 | 102 | Mean Difference (IV, Random, 95% CI) | ‐8.11 [‐13.14, ‐3.09] |
|
| 14 Adverse events (short term) Show forest plot | 7 | | Risk Ratio (M‐H, Random, 95% CI) | Subtotals only |
|
| 14.1 Gastrointestinal symptoms | 7 | 402 | Risk Ratio (M‐H, Random, 95% CI) | 1.54 [0.90, 2.63] |
| 15 Participant/parent‐rated global change in symptoms of eczema at the end of treatment ‐ stratified by age groups Show forest plot | 3 | | Odds ratio (Random, 95% CI) | Totals not selected |
|
| 15.1 Age under 2 years | 1 | | Odds ratio (Random, 95% CI) | 0.0 [0.0, 0.0] |
| 15.2 Age 2 to 12 years | 1 | | Odds ratio (Random, 95% CI) | 0.0 [0.0, 0.0] |
| 15.3 Age not categorised | 1 | | Odds ratio (Random, 95% CI) | 0.0 [0.0, 0.0] |
| 16 Participant/parent‐rated symptoms of eczema (SCORAD part C) at the end of treatment ‐ stratified by age groups Show forest plot | 12 | | Mean difference (Random, 95% CI) | Subtotals only |
|
| 16.1 Age under 2 years | 5 | | Mean difference (Random, 95% CI) | ‐0.39 [‐2.20, 1.42] |
| 16.2 Age 2 to 12 years | 4 | | Mean difference (Random, 95% CI) | ‐0.63 [‐2.04, 0.78] |
| 16.3 Age not categorised | 2 | | Mean difference (Random, 95% CI) | ‐2.23 [‐3.71, ‐0.74] |
| 16.4 Adults only | 2 | | Mean difference (Random, 95% CI) | 1.01 [‐0.82, 2.84] |
| 17 Global eczema severity score (total SCORAD) at the end of treatment ‐ stratified by age groups Show forest plot | 24 | | Mean difference (Random, 95% CI) | Subtotals only |
|
| 17.1 Age under 2 years | 10 | | Mean difference (Random, 95% CI) | ‐0.99 [‐3.97, 1.99] |
| 17.2 Age 2 to 12 years | 3 | | Mean difference (Random, 95% CI) | ‐6.08 [‐9.68, ‐2.48] |
| 17.3 Age not categorised | 7 | | Mean difference (Random, 95% CI) | ‐5.25 [‐10.43, ‐0.07] |
| 17.4 Adults only | 5 | | Mean difference (Random, 95% CI) | ‐6.51 [‐10.09, ‐2.93] |
| 18 Global eczema severity score (total SCORAD) at the end of treatment ‐ stratified by presence of atopy Show forest plot | 23 | | Mean difference (Random, 95% CI) | Subtotals only |
|
| 18.1 Participants with atopy | 4 | | Mean difference (Random, 95% CI) | ‐3.90 [‐15.52, 7.73] |
| 18.2 Participants with unknown atopic status | 19 | | Mean difference (Random, 95% CI) | ‐4.15 [‐6.02, ‐2.27] |
| 19 Global eczema severity score (total SCORAD) at the end of treatment ‐ stratified by challenge‐proven food allergy Show forest plot | 21 | | Mean difference (Random, 95% CI) | Subtotals only |
|
| 19.1 Food allergy present | 3 | | Mean difference (Random, 95% CI) | ‐1.84 [‐6.22, 2.54] |
| 19.2 Unknown food allergic status | 18 | | Mean difference (Random, 95% CI) | ‐3.21 [‐5.63, ‐0.79] |
| 20 Global eczema severity score (total SCORAD) at the end of treatment ‐ stratified by eczema severity Show forest plot | 6 | | Mean Difference (IV, Random, 95% CI) | Subtotals only |
|
| 20.1 Severe eczema (SCORAD over 40) | 5 | 95 | Mean Difference (IV, Random, 95% CI) | ‐3.71 [‐10.05, 2.64] |
| 20.2 Moderate eczema (SCORAD 15 to 40) | 6 | 279 | Mean Difference (IV, Random, 95% CI) | ‐2.95 [‐7.65, 1.74] |
| 20.3 Mild eczema (SCORAD under 15) | 1 | 8 | Mean Difference (IV, Random, 95% CI) | ‐5.53 [‐15.29, 4.23] |
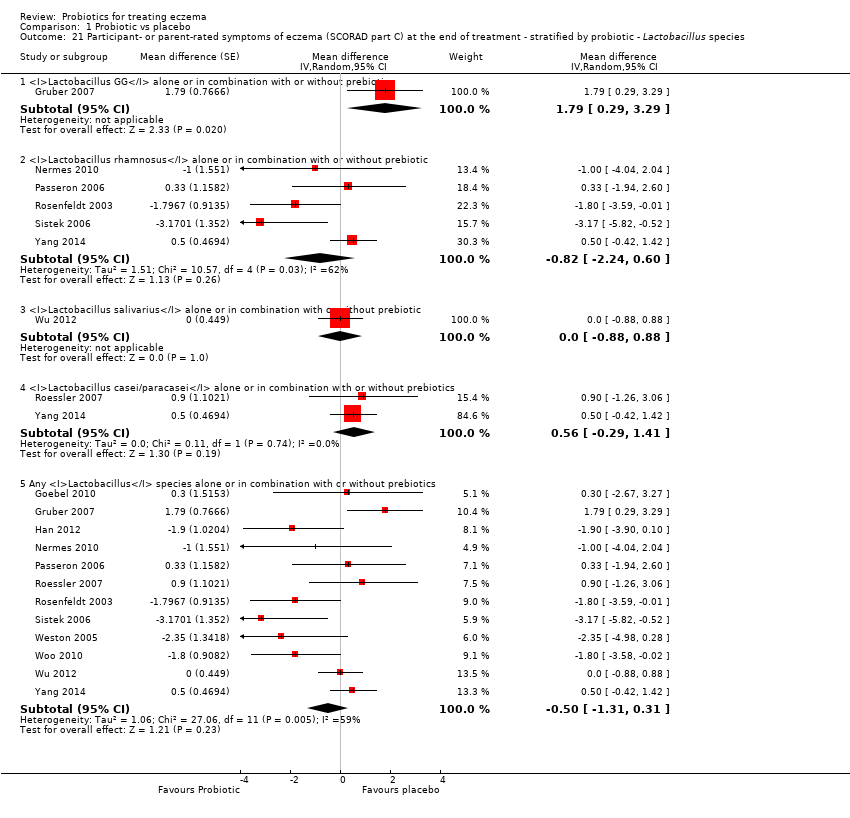
| 21 Participant‐ or parent‐rated symptoms of eczema (SCORAD part C) at the end of treatment ‐ stratified by probiotic ‐ Lactobacillus species Show forest plot | 12 | | Mean difference (Random, 95% CI) | Subtotals only |
|
| 21.1 Lactobacillus GG alone or in combination with or without prebiotic | 1 | | Mean difference (Random, 95% CI) | 1.79 [0.29, 3.29] |
| 21.2 Lactobacillus rhamnosus alone or in combination with or without prebiotic | 5 | | Mean difference (Random, 95% CI) | ‐0.82 [‐2.24, 0.60] |
| 21.3 Lactobacillus salivarius alone or in combination with or without prebiotic | 1 | | Mean difference (Random, 95% CI) | 0.0 [‐0.88, 0.88] |
| 21.4 Lactobacillus casei/paracasei alone or in combination with or without prebiotics | 2 | | Mean difference (Random, 95% CI) | 0.56 [‐0.29, 1.41] |
| 21.5 Any Lactobacillus species alone or in combination with or without prebiotics | 12 | | Mean difference (Random, 95% CI) | ‐0.50 [‐1.31, 0.31] |
| 22 Participant‐ or parent‐rated symptoms of eczema (SCORAD part C) at the end of treatment ‐ stratified by probiotic ‐ Bifidobacterium species Show forest plot | 5 | | Mean difference (Random, 95% CI) | Subtotals only |
|
| 22.1 Bifidobacterium lactis alone or in combination with or without prebiotics | 4 | | Mean difference (Random, 95% CI) | ‐0.34 [‐1.92, 1.24] |
| 22.2 Bifidobacterium breve alone or in combination with or without prebiotics | 1 | | Mean difference (Random, 95% CI) | 1.3 [‐2.15, 4.75] |
| 22.3 Any Bifidobacteria species alone or in combination with or without prebiotic | 5 | | Mean difference (Random, 95% CI) | ‐0.11 [‐1.47, 1.25] |
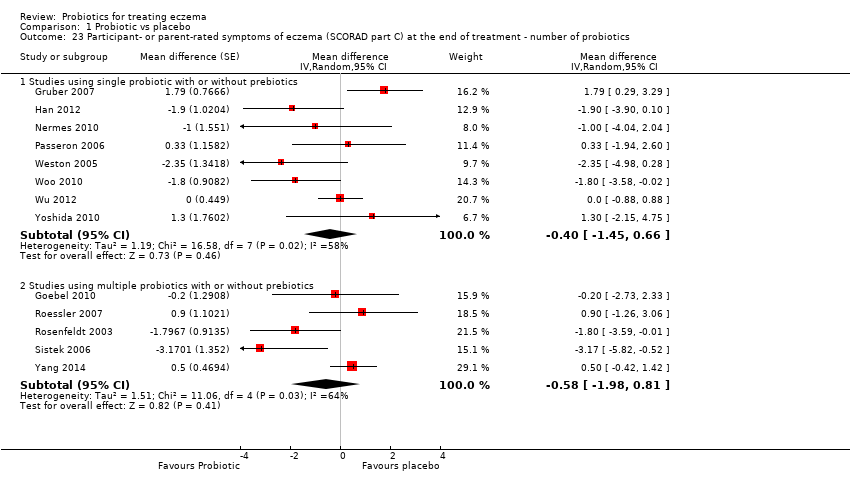
| 23 Participant‐ or parent‐rated symptoms of eczema (SCORAD part C) at the end of treatment ‐ number of probiotics Show forest plot | 13 | | Mean difference (Random, 95% CI) | Subtotals only |
|
| 23.1 Studies using single probiotic with or without prebiotics | 8 | | Mean difference (Random, 95% CI) | ‐0.40 [‐1.45, 0.66] |
| 23.2 Studies using multiple probiotics with or without prebiotics | 5 | | Mean difference (Random, 95% CI) | ‐0.58 [‐1.98, 0.81] |
| 24 Participant‐ or parent‐rated symptoms of eczema (SCORAD part C) at the end of treatment ‐ probiotics with no prebiotics Show forest plot | 13 | | Mean difference (Random, 95% CI) | ‐0.44 [‐1.22, 0.33] |
|
| 25 Global eczema severity score (total SCORAD) at the end of treatment ‐ stratified by probiotic ‐ Lactobacillus species Show forest plot | 21 | | Mean difference (Random, 95% CI) | Subtotals only |
|
| 25.1 Lactobacillus GG alone or in combination with or without prebiotic | 3 | | Mean difference (Random, 95% CI) | 3.37 [0.55, 6.20] |
| 25.2 Lactobacillus rhamnosus alone or in combination with or without prebiotic | 5 | | Mean difference (Random, 95% CI) | ‐3.49 [‐9.81, 2.83] |
| 25.3 Lactobacillus salivarius alone or in combination with or without prebiotic | 6 | | Mean difference (Random, 95% CI) | ‐6.86 [‐10.08, ‐3.63] |
| 25.4 Lactobacillus casei/paracasei alone or in combination with or without prebiotics | 6 | | Mean difference (Random, 95% CI) | ‐2.58 [‐7.21, 2.05] |
| 25.5 Any Lactobacillus species alone or in combination with or without prebiotics | 21 | | Mean difference (Random, 95% CI) | ‐3.80 [‐6.06, ‐1.54] |
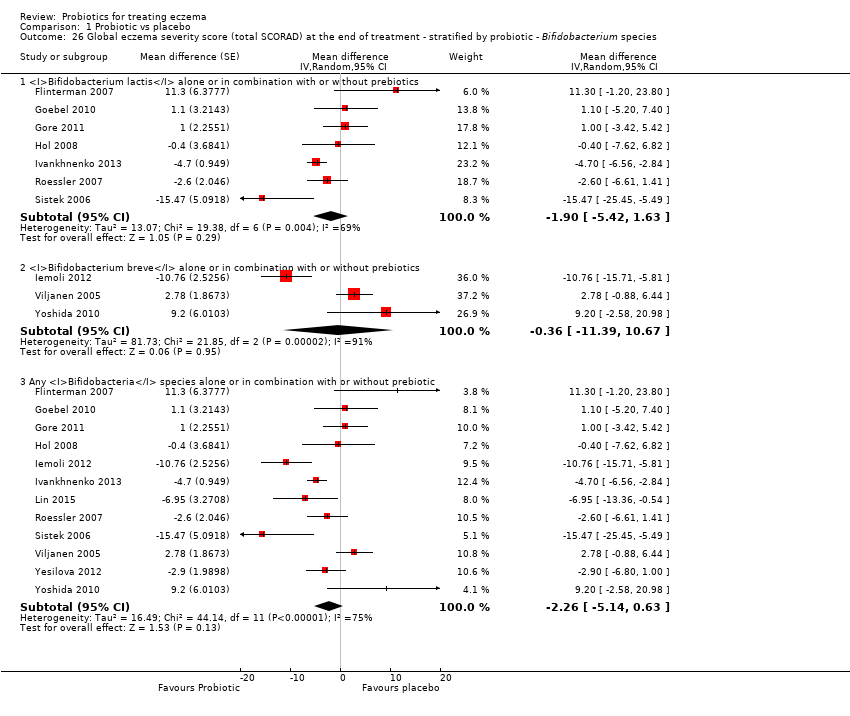
| 26 Global eczema severity score (total SCORAD) at the end of treatment ‐ stratified by probiotic ‐ Bifidobacterium species Show forest plot | 12 | | Mean difference (Random, 95% CI) | Subtotals only |
|
| 26.1 Bifidobacterium lactis alone or in combination with or without prebiotics | 7 | | Mean difference (Random, 95% CI) | ‐1.90 [‐5.42, 1.63] |
| 26.2 Bifidobacterium breve alone or in combination with or without prebiotics | 3 | | Mean difference (Random, 95% CI) | ‐0.36 [‐11.39, 10.67] |
| 26.3 Any Bifidobacteria species alone or in combination with or without prebiotic | 12 | | Mean difference (Random, 95% CI) | ‐2.26 [‐5.14, 0.63] |
| 27 Global eczema severity score (total SCORAD) at the end of treatment ‐ stratified by probiotic ‐ number of probiotics Show forest plot | 24 | | Mean difference (Random, 95% CI) | Subtotals only |
|
| 27.1 Studies using single probiotic with or without prebiotics | 13 | | Mean difference (Random, 95% CI) | ‐4.90 [‐7.66, ‐2.15] |
| 27.2 Studies using multiple probiotics with or without prebiotics | 12 | | Mean difference (Random, 95% CI) | ‐3.54 [‐6.50, ‐0.58] |
| 28 Global eczema severity score (total SCORAD) at the end of treatment ‐ stratified by probiotic ‐ probiotics with no prebiotics Show forest plot | 24 | | Mean difference (Random, 95% CI) | ‐3.83 [‐5.81, ‐1.86] |
|