Scolaris Content Display Scolaris Content Display

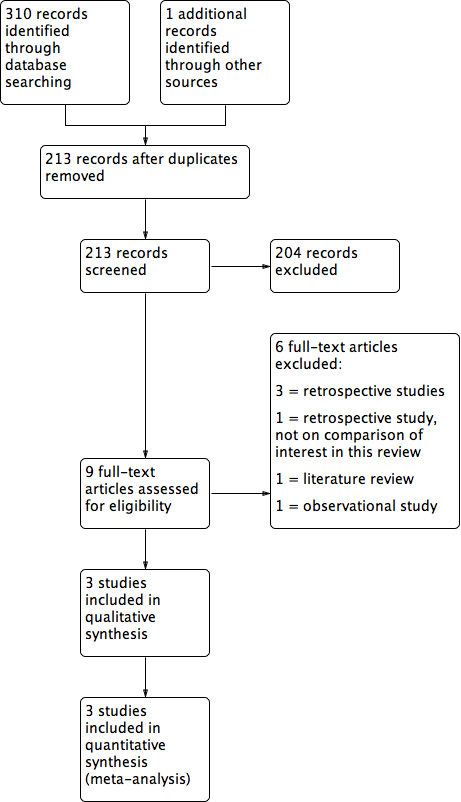
Study flow diagram.
Figuras y tablas -
Figure 1

Study flow diagram.

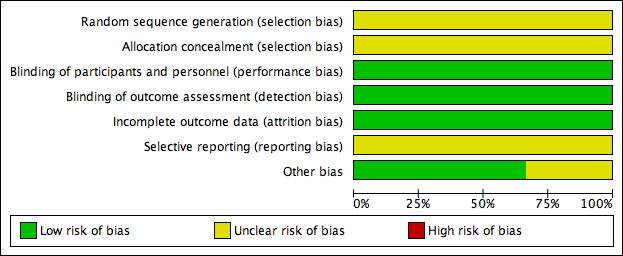
Risk of bias graph: review authors' judgements about each risk of bias item presented as percentages across all included studies.
Figuras y tablas -
Figure 2

Risk of bias graph: review authors' judgements about each risk of bias item presented as percentages across all included studies.

Risk of bias summary: review authors' judgements about each risk of bias item for each included study.
Figuras y tablas -
Figure 3

Risk of bias summary: review authors' judgements about each risk of bias item for each included study.

Forest plot of comparison: 1 Cyst aspiration versus conservative management, outcome: 1.1 NEW Clinical Pregnancy Rate.
Figuras y tablas -
Figure 4

Forest plot of comparison: 1 Cyst aspiration versus conservative management, outcome: 1.1 NEW Clinical Pregnancy Rate.

Forest plot of comparison: 1 Cyst aspiration versus conservative management, outcome: 1.2 Number of Follicles Recruited.
Figuras y tablas -
Figure 5

Forest plot of comparison: 1 Cyst aspiration versus conservative management, outcome: 1.2 Number of Follicles Recruited.

Comparison 1 Cyst aspiration versus conservative management, Outcome 1 Clinical Pregnancy Rate.
Figuras y tablas -
Analysis 1.1

Comparison 1 Cyst aspiration versus conservative management, Outcome 1 Clinical Pregnancy Rate.

Comparison 1 Cyst aspiration versus conservative management, Outcome 2 Number of Follicles Recruited.
Figuras y tablas -
Analysis 1.2

Comparison 1 Cyst aspiration versus conservative management, Outcome 2 Number of Follicles Recruited.

Comparison 1 Cyst aspiration versus conservative management, Outcome 3 Number of Oocytes Collected.
Figuras y tablas -
Analysis 1.3

Comparison 1 Cyst aspiration versus conservative management, Outcome 3 Number of Oocytes Collected.

Comparison 1 Cyst aspiration versus conservative management, Outcome 4 Cancellation rate.
Figuras y tablas -
Analysis 1.4

Comparison 1 Cyst aspiration versus conservative management, Outcome 4 Cancellation rate.

Summary of findings for the main comparison. Cyst aspiration versus conservative management for subfertility

Cyst aspiration versus conservative management for subfertility

Population: women with subfertility
Settings: infertility and IVF centres in Jordan, Iran and the United Kingdom (London)
Intervention: cyst aspiration versus conservative management

Outcomes

Illustrative comparative risks* (95% CI)

Relative effect
(95% CI)

No of participants
(studies)

Quality of the evidence
(GRADE)

Comments

Assumed risk

Corresponding risk

Conservative management

Cyst aspiration

Live birth rate

This primary review outcome was not reported in any of the included studies

Not estimable

Adverse events rate

This primary review outcome was not reported in any of the included studies

Not estimable

Clinical pregnancy rate
Ultrasound diagnosis of intrauterine pregnancy

62 per 1,000

72 per 1,000

(21 to 220)

OR 1.19

(0.33 to 4.29)

159
(2 studies)

⊕⊝⊝⊝
Very low1,2

Number of follicles recruited
Ultrasound diagnosis

The mean number of follicles recruited in the cyst aspiration groups was
0.55 higher (0.48 lower to 1.59 higher)

159
(2 studies)

⊕⊝⊝⊝
Very low1,2

Number of oocytes collected
Transvaginal oocyte aspiration

The mean number of oocytes collected in the cyst aspiration groups was
0.41 higher (0.04 lower to 0.85 higher)

339
(3 studies)

⊕⊕⊝⊝
low1,3

Cancellation rate per cycle

239 per 1,000

237 per 1,000

(117 to 423)

OR 0.99

(0.42 to 2.33)

122
(1 study)

⊝⊝⊝⊝
Very low1,2

Each woman had only one cycle

*The basis for the assumed risk is the median control group risk across studies. The corresponding risk (and its 95% confidence interval) is based on the assumed risk in the comparison group and the relative effect of the intervention (and its 95% CI).
CI: Confidence interval; OR: Odds ratio

GRADE Working Group grades of evidence
High quality: Further research is very unlikely to change our confidence in the estimate of effect.
Moderate quality: Further research is likely to have an important impact on our confidence in the estimate of effect and may change the estimate.
Low quality: Further research is very likely to have an important impact on our confidence in the estimate of effect and is likely to change the estimate.
Very low quality: We are very uncertain about the estimate.

1 Downgraded one level for serious risk of bias; none of the studies adequately described their methods of randomization and allocation concealment
2 Downgraded two levels for very serious imprecision: wide confidence interval compatible with benefit in either group or no effect, and/or very low event rate
3 Downgraded one level for serious imprecision: wide confidence interval compatible with benefit in either group or no effect

Figuras y tablas -
Summary of findings for the main comparison. Cyst aspiration versus conservative management for subfertility
Table 1. Firouzabadi 2010

Treatment group

Control

P

Randomised

90

90

Cycles cancelled prior

to egg collection

2

13

Completed

88

77

Live birth rate

Not available

Not available

Clinical pregnancy rate

10.6%

14.3%

> 0.05

Number of follicles recruited

Not available

Not available

Number of oocytes collected

5.6±2.1

5.2±1.8

> 0.05

Figuras y tablas -
Table 1. Firouzabadi 2010
Table 2. Qublan 2005  

Treatment group

Control

Randomised

76

46

Cycle cancelled (poor response)

17

12

Completed

59

34

Live birth rate

Not available

Not available

Clinical pregnancy rate

10.2%

8.8%

> 0.05

Number of follicles recruited

5.4 ± 3.1

5 ± 2.9

> 0.05

Number of oocytes collected

5.6 ± 1.8

5.2 ± 2.1

> 0.05

Figuras y tablas -
Table 2. Qublan 2005  
Table 3. Rizk 1990  

Treatment group

Control

P

Randomised

18

19

Discontinued

0

0

Completed

18

19

Live birth rate

Not available

Not available

Clinical pregnancy rate

1 out of 18 (5.56%)

1 out of 19 (5.26%)

> 0.05

Number of follicles recruited

10.9 ± 5.33

8.9 ± 5.05

> 0.05

Number of oocytes collected

7.33 ± 4.0

6.7 ± 5.15

> 0.05

Figuras y tablas -
Table 3. Rizk 1990  
Comparison 1. Cyst aspiration versus conservative management

Outcome or subgroup title

No. of studies

No. of participants

Statistical method

Effect size

1 Clinical Pregnancy Rate Show forest plot

2

159

Odds Ratio (M‐H, Fixed, 95% CI)

1.19 [0.33, 4.29]

2 Number of Follicles Recruited Show forest plot

2

159

Mean Difference (IV, Fixed, 95% CI)

0.55 [‐0.48, 1.59]

3 Number of Oocytes Collected Show forest plot

3

339

Mean Difference (IV, Fixed, 95% CI)

0.41 [‐0.04, 0.85]

4 Cancellation rate Show forest plot

1

122

Odds Ratio (M‐H, Fixed, 95% CI)

0.99 [0.42, 2.33]

Figuras y tablas -
Comparison 1. Cyst aspiration versus conservative management