Exercise for acutely hospitalised older medical patients
Abstract
Background
Approximately 30% of hospitalised older adults experience hospital‐associated functional decline. Exercise interventions that promote in‐hospital activity may prevent deconditioning and thereby maintain physical function during hospitalisation. This is an update of a Cochrane Review first published in 2007.
Objectives
To evaluate the benefits and harms of exercise interventions for acutely hospitalised older medical inpatients on functional ability, quality of life (QoL), participant global assessment of success and adverse events compared to usual care or a sham‐control intervention.
Search methods
We used standard, extensive Cochrane search methods. The latest search date was May 2021.
Selection criteria
We included randomised or quasi‐randomised controlled trials evaluating an in‐hospital exercise intervention in people aged 65 years or older admitted to hospital with a general medical condition. We excluded people admitted for elective reasons or surgery.
Data collection and analysis
We used standard Cochrane methods. Our major outcomes were 1. independence with activities of daily living; 2. functional mobility; 3. new incidence of delirium during hospitalisation; 4. QoL; 5. number of falls during hospitalisation; 6. medical deterioration during hospitalisation and 7. participant global assessment of success. Our minor outcomes were 8. death during hospitalisation; 9. musculoskeletal injuries during hospitalisation; 10. hospital length of stay; 11. new institutionalisation at hospital discharge; 12. hospital readmission and 13. walking performance. We used GRADE to assess certainty of evidence for each major outcome.
We categorised exercise interventions as: rehabilitation‐related activities (interventions designed to increase physical activity or functional recovery, but did not follow a specified exercise protocol); structured exercise (interventions that included an exercise intervention protocol but did not include progressive resistance training); and progressive resistance exercise (interventions that included an element of progressive resistance training).
Main results
We included 24 studies (nine rehabilitation‐related activity interventions, six structured exercise interventions and nine progressive resistance exercise interventions) with 7511 participants. All studies compared exercise interventions to usual care; two studies, in addition to usual care, used sham interventions. Mean ages ranged from 73 to 88 years, and 58% of participants were women.
Several studies were at high risk of bias. The most common domain assessed at high risk of bias was measurement of the outcome, and five studies (21%) were at high risk of bias arising from the randomisation process.
Exercise may have no clinically important effect on independence in activities of daily living at discharge from hospital compared to controls (16 studies, 5174 participants; low‐certainty evidence). Five studies used the Barthel Index (scale: 0 to 100, higher scores representing greater independence). Mean scores at discharge in the control groups ranged from 42 to 96 points, and independence in activities of daily living was 1.8 points better (0.43 worse to 4.12 better) with exercise compared to controls. The minimally clinical important difference (MCID) is estimated to be 11 points.
We are uncertain regarding the effect of exercise on functional mobility at discharge from the hospital compared to controls (8 studies, 2369 participants; very low‐certainty evidence). Three studies used the Short Physical Performance Battery (SPPB) (scale: 0 to 12, higher scores representing better function) to measure functional mobility. Mean scores at discharge in the control groups ranged from 3.7 to 4.9 points on the SPPB, and the estimated effect of the exercise interventions was 0.78 points better (0.02 worse to 1.57 better). A change of 1 point on the SPPB represents an MCID.
We are uncertain regarding the effect of exercise on the incidence of delirium during hospitalisation compared to controls (7 trials, 2088 participants; very low‐certainty evidence). The incidence of delirium during hospitalisation was 88/1091 (81 per 1000) in the control group compared with 70/997 (73 per 1000; range 47 to 114) in the exercise group (RR 0.90, 95% CI 0.58 to 1.41).
Exercise interventions may result in a small clinically unimportant improvement in QoL at discharge from the hospital compared to controls (4 studies, 875 participants; low‐certainty evidence). Mean QoL on the EuroQol 5 Dimensions (EQ‐5D) visual analogue scale (VAS) (scale: 0 to 100, higher scores representing better QoL) ranged between 48.9 and 64.7 in the control group at discharge from the hospital, and QoL was 6.04 points better (0.9 better to 11.18 better) with exercise. A change of 10 points on the EQ‐5D VAS represents an MCID.
No studies measured participant global assessment of success.
Exercise interventions did not affect the risk of falls during hospitalisation (moderate‐certainty evidence). The incidence of falls was 31/899 (34 per 1000) in the control group compared with 31/888 (34 per 1000; range 20 to 57) in the exercise group (RR 0.99, 95% CI 0.59 to 1.65).
We are uncertain regarding the effect of exercise on the incidence of medical deterioration during hospitalisation (very low‐certainty evidence). The incidence of medical deterioration in the control group was 101/1417 (71 per 1000) compared with 96/1313 (73 per 1000; range 44 to 120) in the exercise group (RR 1.02, 95% CI 0.62 to 1.68).
Subgroup analyses by different intervention categories and by the use of a sham intervention were not meaningfully different from the main analyses.
Authors' conclusions
Exercise may make little difference to independence in activities of daily living or QoL, but probably does not result in more falls in older medical inpatients. We are uncertain about the effect of exercise on functional mobility, incidence of delirium and medical deterioration. Certainty of evidence was limited by risk of bias and inconsistency. Future primary research on the effect of exercise on acute hospitalisation could focus on more consistent and uniform reporting of participant's characteristics including their baseline level of functional ability, as well as exercise dose, intensity and adherence that may provide an insight into the reasons for the observed inconsistencies in findings.
PICO
Plain language summary
Exercise for older patients during unplanned hospital stays
Key messages
There may be a benefit in some exercise treatments for older adults during an unplanned hospital stay, but we cannot be certain. Exercise interventions probably do not cause harm; we found no increase in the risk of falling for older adults when they were in hospital.
What is the problem?
Older adults often lose the ability to carry out their usual day‐to‐day activities following an unplanned hospital admission. One reason for this is that people are less active in hospital than they would normally be at home when well. Being inactive in hospital may also contribute to other problems, such as a greater risk of becoming confused, difficulty moving about and a reduced quality of life when discharged from hospital.
What did we want to find out?
Does helping older people to exercise whilst in hospital improve their recovery and ability to manage their usual day‐to‐day activities when they are discharged?
What did we do?
We searched medical databases for studies that compared exercise programmes to usual care (with or without a sham (fake) intervention). Usual care was the treatment that would normally be given to patients who were not part of the research studies. Two studies used sham interventions in addition to usual care. The sham interventions were not designed to impact the patients' recovery, but to add a level of trustworthiness to the research studies.
What did we find?
We found 24 studies with 7511 participants, of whom 58% were women. The average ages of participants in the studies ranged from 73 to 88 years. Thirteen studies were from Europe, six from Oceania, four from North America and one from South America. Participants were admitted to hospital with a wide range of illnesses or medical conditions such as infections, heart failure, kidney failure, bleeding in the stomach or gut, and vertigo.
The types of exercise treatments and the amount of exercise that people were asked to do varied considerably. Nine studies classified the exercise treatment as rehabilitation‐related activities (treatments designed to increase physical activity, but that did not follow a specific exercise programme). Six studies consisted of structured exercise (a specific exercise programme that every person in the treatment group performed). The exercise may have varied depending on the individual person's ability, but the treatment did not involve progressive strength training. With progressive strength training people exercise their muscles against some type of resistance that is progressively increased as their strength improves. Nine studies provided an element of progressive resistance training.
Main findings
Exercise programmes may result in little to no difference compared to usual care in people's ability to carry out usual day‐to‐day activities (scoring 1.8% better, ranging from 0.43% worse to 4.12% better).
Compared to usual care (with or without sham treatments), exercise treatment resulted in 6.5% better (0.2% better to 13.1% better) scores in the ability to walk and move around. However, due to the quality of evidence we are very uncertain as to the true effect of exercise programmes.
Ten per cent fewer people (42% fewer to 41% more) who received exercise programmes compared to those who received usual care experienced new confusion during hospitalisation, but we are uncertain about the results.
No studies measured whether the people who took part in the research thought that the exercise treatment was successful.
Exercise programmes may not clinically improve quality of life at discharge from hospital compared to usual care (6.0% better, ranging from 0.9% better to 15.5% better).
Exercise programmes probably make little difference to the number of people who fall during hospitalisation compared to usual care (1% fewer people, ranging from 41% fewer to 65% more).
Two per cent more people (38% fewer to 68% more) who received exercise programmes became more unwell during hospitalisation compared to those who received usual care. However, due to the quality of evidence, we are very uncertain as to the true effect of exercise programmes.
We remain uncertain if any particular type of exercise provides more benefit than another.
What are the limitations of the evidence?
The quality of evidence was generally low or very low for most of the outcomes that we included in this review. Some studies were designed in a way that reduced the trustworthiness of their results, but there were also important differences between the findings of different studies and much uncertainty as to the true effect of the exercise treatments.
How up to date is the evidence?
This Cochrane Review is current to May 2021.
Authors' conclusions
Summary of findings
| Exercise interventions compared to usual care with or without sham interventions for acutely hospitalised older medical patients | ||||||
| Patient or population: acutely hospitalised medical patients | ||||||
| Outcomes | Anticipated absolute effects* (95% CI) | Relative effect | № of participants | Certainty of the evidence | Comments | |
|---|---|---|---|---|---|---|
| Risk with usual care ± sham interventions | Risk with exercise interventions | |||||
| Functional ability: independence with activities of daily living at discharge from hospital | The mean functional ability: independence with activities of daily living at discharge from hospital ranged from 42 to 96 points on the Barthel Indexa | MD 1.8 points on the Barthel Index higher | ‐ | 5174 | ⊕⊕⊝⊝ | Exercise interventions may result in little to no difference in independence with activities of daily living at discharge from hospital (SMD 0.09, 95% CI −0.02 to 0.19). A change of 11 points on the Barthel Index is thought to represent a minimally clinically important difference (MCID). |
| Functional ability: functional mobility at discharge from hospital | The mean functional ability: functional mobility at discharge from hospital ranged from 3.7 to 4.9 points on the Short Physical Performance Battery e | MD 0.78 points on the Short Physical Performance Battery higher | ‐ | 2369 | ⊕⊝⊝⊝ | The evidence is very uncertain about the effect of exercise on functional mobility at discharge from hospital (SMD 0.28, 95% CI −0.01 to 0.56). A change of 1.0 points on the Short Physical Performance Battery is thought to represent an MCID. |
| Functional ability: new incidence of delirium during hospitalisation | 81 per 1000 | 73 per 1000 | RR 0.90 | 2088 | ⊕⊝⊝⊝ | The evidence suggests that exercise results in little to no difference in incidence of delirium during hospitalisation. |
| Quality of life at discharge from hospital | The mean quality of life at discharge from hospital ranged from 48.7 to 64.7 points on the EQ‐5D VAS | MD 6.04 points on the EQ‐5D VAS higher | ‐ | 875 | ⊕⊕⊝⊝ | Exercise interventions may result in a small clinically unimportant improvement in quality of life at discharge from hospital. A change of 10 points on the EQ‐5D VAS is thought to represent a MCID. |
| Falls during hospitalisation | 34 per 1000 | 34 per 1000 | RR 0.99 | 1787 | ⊕⊕⊕⊝ | Exercise interventions probably result in little to no difference in falls during hospitalisation. |
| Medical deterioration during hospitalisation | 71 per 1000 | 73 per 1000 | RR 1.02 | 2730 | ⊕⊝⊝⊝ | Exercise interventions may have no effect on medical deterioration during hospitalisation. |
| Participant global assessment of success | Not pooled | Not pooled | Not pooled | (0 studies) | ‐ | No studies reported participant global assessment of success. |
| *The risk in the intervention group (and its 95% confidence interval) is based on the assumed risk in the comparison group and the relative effect of the intervention (and its 95% CI). | ||||||
| GRADE Working Group grades of evidence | ||||||
| See interactive version of this table: https://gdt.gradepro.org/presentations/#/isof/isof_question_revman_web_423027971375700878. | ||||||
| a Range based on the seven studies that measured activities of daily living using a Barthel Index (range 0–100). | ||||||
| Rehabilitation‐related activity interventions compared to usual care with or without sham interventions for acutely hospitalised older medical patients | ||||||
| Patient or population: acutely hospitalised older medical patients | ||||||
| Outcomes | Anticipated absolute effects* (95% CI) | Relative effect | № of participants | Certainty of the evidence | Comments | |
|---|---|---|---|---|---|---|
| Risk with usual care ± sham interventions | Risk with rehabilitation‐related activities | |||||
| Functional ability: independence with activities of daily living at discharge from hospital | The mean functional ability: independence with activities of daily living at discharge from hospital was 42 points on the Barthel Indexa | MD 0 points on the Barthel Index | ‐ | 2838 | ⊕⊕⊝⊝ | Rehabilitation‐related activities may result in little to no difference in independence with activities of daily living at discharge from hospital (standardised mean difference (SMD) 0.00, 95% CI −0.12 to 0.13). A change of 11 points on the Barthel Index is thought to represent a minimally clinically important difference (MCID). |
| Functional ability: functional mobility at discharge from hospital | The mean functional ability: functional mobility at discharge from hospital was 5 points on the Physical Performance and Mobility Examination | MD 0.14 points on the Physical Performance and Mobility Examination higher | ‐ | 975 | ‐ | Included only 1 study categorised as delivering a rehabilitation‐related activity intervention. The effect of rehabilitation‐related activities on functional mobility at discharge from hospital was very uncertain. |
| Incidence of new delirium during hospitalisation | 107 per 1000 | 92 per 1000 | RR 0.86 | 732 | ⊕⊝⊝⊝ | The evidence was very uncertain with regard to the effect of rehabilitation‐related activity interventions on incidence of delirium during hospitalisation. |
| Falls during hospitalisation | 24 per 1000 | 32 per 1000 | RR 1.33 | 250 | ‐ | Only 1 study categorised as delivering a rehabilitation‐related activity intervention was included. The effect of rehabilitation‐related activities on falls during hospitalisation was very uncertain. |
| Quality of life at discharge from hospital | The mean quality of life at discharge from hospital was 48.9 points on the EQ‐5D VAS | MD 2.2 points on the EQ‐5D VAS higher | ‐ | 350 | ‐ | Only 1 study reported a quality‐of‐life outcome at hospital discharge. The effect of rehabilitation‐related activities on the incidence of delirium during hospitalisation was very uncertain. |
| Medical deterioration during hospitalisation | 107 per 1000 | 92 per 1000 | RR 0.86 | 732 | ⊕⊝⊝⊝ | The evidence was very uncertain with regard to the effect of rehabilitation‐related activity interventions on incidence of medical deterioration during hospitalisation. |
| Participant global assessment of success | Not pooled | Not pooled | Not pooled | (0 studies) | ‐ | No studies reported participant global assessment of success. |
| *The risk in the intervention group (and its 95% confidence interval) is based on the assumed risk in the comparison group and the relative effect of the intervention (and its 95% CI). | ||||||
| GRADE Working Group grades of evidence | ||||||
| See interactive version of this table: https://gdt.gradepro.org/presentations/#/isof/isof_question_revman_web_423062461138566957. | ||||||
| a Based on the one study that measured activities of daily living using a Barthel Index (range of possible scores 0–100). | ||||||
| Structured exercise interventions compared to usual care with or without sham interventions for acutely hospitalised older medical patients | ||||||
| Patient or population: acutely hospitalised older medical patients | ||||||
| Outcomes | Anticipated absolute effects* (95% CI) | Relative effect | № of participants | Certainty of the evidence | Comments | |
|---|---|---|---|---|---|---|
| Risk with usual care ± sham interventions | Risk with structured exercise interventions | |||||
| Functional ability: independence with activities of daily living at discharge from hospital | The mean functional ability: independence with activities of daily living at discharge from hospital ranged from 55 to 56 points on the Barthel Indexa | MD 2.6 points on the Barthel Index higher | ‐ | 648 | ⊕⊕⊝⊝ | Structured exercise may result in little to no difference in independence with activities of daily living at discharge from hospital (standardised mean difference (SMD) 0.12, 95% CI −0.21 to 0.45). A change of 11 points on the Barthel Index is thought to represent a minimally clinically important difference (MCID). |
| Functional ability: functional mobility at discharge from hospital | The mean functional ability: functional mobility at discharge from hospital was 14.13 units on the Elderly Mobility Scalee | MD 1.79 units on the Elderly Mobility Scale higher | ‐ | 416 | ⊕⊝⊝⊝ | The evidence was very uncertain with regard to the effect of structured exercise programmes on functional mobility at discharge from hospital (SMD 0.30 95% CI, ‐0.96, 1.57). A change of 2 points on the Elderly Mobility Scale is thought to represent an MCID. |
| Functional ability: new incidence of delirium during hospitalisation | Only 1 study reported the outcome. The study found only 1 incidence of delirium in the intervention group and 0 in the control group. | 100 | ‐ | Included only 1 study categorised as delivering a structured exercise intervention. The effect of structured exercise on the incidence of new delirium during hospitalisation was very uncertain. | ||
| Quality of life at discharge from hospital | The mean quality of life at discharge from hospital was 64.74 points on the EQ‐5D VAS | MD 3.74 points on the EQ‐5D VAS higher | ‐ | 76 | ‐ | Only 1 study reported a quality‐of‐life outcome at hospital discharge. The effect of structured exercise interventions on quality of life at discharge from hospital was very uncertain. |
| Falls during hospitalisation | 40 per 1000 | 31 per 1000 | RR 0.76 | 542 | ⊕⊕⊝⊝ | Structured exercise interventions may result in little to no difference in falls during hospitalisation. |
| Medical deterioration during hospitalisation | 20 per 1000 | 51 per 1000 | RR 2.56 | 200 | ⊕⊝⊝⊝ | The evidence was very uncertain with regard to the effect of structured exercise programmes on medical deterioration during hospitalisation. |
| Participant global assessment of success | Not pooled | Not pooled | Not pooled | (0 studies) | ‐ | No studies reported participant global assessment of success. |
| *The risk in the intervention group (and its 95% confidence interval) is based on the assumed risk in the comparison group and the relative effect of the intervention (and its 95% CI). | ||||||
| GRADE Working Group grades of evidence | ||||||
| See interactive version of this table: https://gdt.gradepro.org/presentations/#/isof/isof_question_revman_web_423064120727928815. | ||||||
| a Range based on the two studies that measured activities of daily living using a Barthel Index (range of possible scores 0–100). | ||||||
| Progressive resistance exercise interventions compared to usual care with or without sham interventions for acutely hospitalised older medical patients | ||||||
| Patient or population: acutely hospitalised older medical patients | ||||||
| Outcomes | Anticipated absolute effects* (95% CI) | Relative effect | № of participants | Certainty of the evidence | Comments | |
|---|---|---|---|---|---|---|
| Risk with usual care ± sham interventions | Risk with progressive resistance exercise | |||||
| Functional ability: independence with activities of daily living at discharge from hospital | The mean functional ability: independence with activities of daily living at discharge from hospital ranged from 75 to 96 points on the Barthel Indexa | MD 0.14 points on the Barthel Index higher | ‐ | 1688 | ⊕⊕⊝⊝ | The evidence is classified as very uncertain with regard to the effect of progressive resistance exercise on independence with activities of daily living at discharge from hospital (SMD 0.14, 95% CI −0.05 to 0.32). A change of 11 points on the Barthel Index is thought to represent a minimally clinically important difference (MCID). |
| Functional ability: functional mobility at discharge from hospital | The mean functional ability: functional mobility at discharge from hospital ranged from 3.7 to 4.9 points on the Short Physical Performance Battery e | MD 0.24 points on the Short Physical Performance Battery higher | ‐ | 978 | ⊕⊝⊝⊝ | The evidence is classified as very uncertain with regard to the effect of progressive resistance exercise on functional mobility at discharge from hospital. (SMD 0.63, 95% CI‐0.28, 1.55). A change of 1.0 points on the Short Physical Performance Battery is thought to represent a MCID. |
| Functional ability: new incidence of delirium during hospitalisation | 71 per 1000 | 68 per 1000 | RR 0.96 | 1256 | ⊕⊕⊝⊝ | The evidence is classified as very uncertain with regard to the effect of progressive resistance exercise on incidence of delirium during hospitalisation. |
| Quality of life at discharge from hospital | The mean quality of life at discharge from hospital ranged from 57.5 to 62.4 points on the EQ‐5D VAS | MD 8.9 points on the EQ‐5D VAS higher | ‐ | 449 | ⊕⊕⊕⊝ | Progressive resistance exercise probably increases quality of life at discharge from hospital slightly. A change of 10 points on the EQ‐5D VAS is thought to represent a MCID. |
| Falls during hospitalisation | 34 per 1000 | 33 per 1000 | RR 0.96 | 995 | ⊕⊕⊝⊝ | Progressive resistance exercise may result in little to no difference in falls during hospitalisation. |
| Medical deterioration during hospitalisation | 62 per 1000 | 61 per 1000 | RR 0.99 | 1798 | ⊕⊝⊝⊝ | The evidence is classified as very uncertain with regard to the effect of progressive resistance exercise on medical deterioration during hospitalisation. |
| Participant global assessment of success | Not pooled | Not pooled | Not pooled | (0 studies) | ‐ | This outcome was not measured by any of the included studies. |
| *The risk in the intervention group (and its 95% confidence interval) is based on the assumed risk in the comparison group and the relative effect of the intervention (and its 95% CI). | ||||||
| GRADE Working Group grades of evidence | ||||||
| See interactive version of this table: https://gdt.gradepro.org/presentations/#/isof/isof_question_revman_web_423057317911555615. | ||||||
| a Range based on the four studies that measured activities of daily living using a Barthel Index (range of possible scores 0–100). | ||||||
Background
Description of the condition
Older adults often experience a reduction in functional ability during acute illness or hospitalisation (Clegg 2013). The degree of loss of function is thought to be dependent on pre‐existing physical and cognitive frailty and the severity of the illness (Covinsky 2011; Lafont 2011). It is suggested that for people admitted to hospital, hospital care itself may impede functional recovery or even lead to further loss of function (Lafont 2011; Sourdet 2015; Zisberg 2015). Terms such as hospital‐associated functional decline (Zisberg 2015) and hospital‐associated deconditioning (Kortebein 2009) have been used to refer to this phenomenon.
Approximately 30% of hospitalised older adults experience hospital‐associated functional decline (Loyd 2020), defined as an increased dependence in activities of daily living (ADL) (Loyd 2020). However, many also experience a reduction in functional mobility (Lyons 2019), cognition (Cole 2015; McCusker 2001), and quality of life (Davydow 2013). Furthermore, hospital‐associated functional decline is associated with length of hospital stay (Zisberg 2015), new‐institutionalisation (Fortinsky 1999; Lyons 2019), readmission (Hoyer 2014; Tonkikh 2016), progressive disability and mortality (Gill 2015).
Description of the intervention
The World Health Organization (WHO) have defined exercise as "a subcategory of physical activity that is planned, structured, repetitive, and purposive, in the sense that the improvement or maintenance of one or more components of physical fitness is the objective. The terms 'exercise' and 'exercise training' are frequently used interchangeably and generally refer to physical activity performed during leisure time with the primary purpose of improving or maintaining physical fitness, physical performance, or health" (WHO 2020).
For pragmatic reasons, this review has adopted a broader definition of exercise to include the interventions that fit the WHO definition, plus those that describe rehabilitation‐related activities. We defined these as interventions designed to increase physical activity or functional recovery but without explicit description of an exercise protocol. In keeping with the original review (de Morton 2007a), this definition included studies with any of the following in their description of the intervention.
-
An environment (e.g. hospital ward) with one or more dedicated physiotherapists or occupational therapists that was compared to a control environment with no access to therapists or access was via referral only.
-
An environment with nursing staff trained to focus on functional assessment and management of their patients that was compared to a control environment where nurses did not receive such training.
-
An environment with a model of care based on a previous publication describing either of the above, that was compared to a control environment with no such modifications.
In addition to the subgroup defined as 'rehabilitation‐related activities', we included two further subgroups, 'structured exercise interventions' and 'progressive resistance exercise interventions'. Structured exercise interventions were defined as interventions such as walking programmes that included an exercise protocol but did not include progressive resistance training. Progressive resistance exercises were defined as interventions that included an exercise intervention protocol with a progressive resistance training component.
How the intervention might work
A suggested mechanism of hospital‐associated functional decline is loss of muscle strength or 'acute sarcopenia' due to inactivity and bed rest (Hartley 2021; Kortebein 2008; Zisberg 2015). Therefore, exercise interventions that promote in‐hospital activity may prevent deconditioning and thereby maintain physical function during hospitalisation.
Given the multifactorial nature of acute sarcopenia (Welch 2018), it may be the case that more‐specific exercise such as progressive strength training is required to counter the negative effects of acute hospitalisation (Falvey 2015). Progressive resistance strength training is an effective intervention for improving physical functioning in older people (Liu 2009). For this reason, our defined subgroups of interventions differentiated between exercise interventions with and without progressive resistance training components. There is also evidence that exercise interventions may improve cognitive function in older adults (Heyn 2004), and may have an effect in the prevention of delirium (Inouye 2003).
Why it is important to do this review
This review was last published in 2007. Over the past 14 years, several important papers have been published on this topic. New research is available that justifies the update of this systematic review.
The original review reported inconclusive evidence to support exercise for acutely hospitalised older adults to improve functional outcomes (de Morton 2007). However, it also reported 'silver' level evidence that multidisciplinary interventions that include exercise may increase the proportion of patients discharged to home and reduce length and cost of hospital stay.
Given the significant clinical implications that hospital‐associated functional decline has for both patients and health services, updating this review will provide evidence to drive decision‐making regarding systems of hospital care for older adults.
Objectives
1. To evaluate the benefits and harms of exercise interventions for acutely hospitalised older medical inpatients on functional ability, quality of life (QoL), participant global assessment of success and adverse events compared to usual care or a sham‐control intervention.
2. To determine the effect of exercise interventions for acutely hospitalised older medical inpatients on walking performance and hospital outcomes including length of hospital stay, new institutionalisations and hospital readmissions.
3. To determine if the type of exercise (rehabilitation‐related activities, structured exercise or progressive resistance exercise) showed differences in benefit in any of the outcomes.
Methods
Criteria for considering studies for this review
Types of studies
We included prospective randomised controlled trials (RCT) or quasi‐randomised controlled clinical trials (QRCT) (e.g. alternate allocation, date of birth, medical record number) comparing exercise for medical inpatients to usual care or a sham intervention.
Types of participants
We included studies if participants were aged 65 years or older, admitted to a hospital medical or geriatric ward, or admitted to hospital with an acute medical condition. This review excluded people admitted to inpatient rehabilitation hospitals or intensive care units. Trials were only included if 95% of the study participants were aged at least 65 years and were randomly allocated to study group within three days of hospital admission. We excluded studies of people exclusively experiencing cerebrovascular accidents or a non‐general medical condition (e.g. a respiratory‐specific condition such as an exacerbation of chronic obstructive pulmonary disorder) and animal studies.
Types of interventions
We considered any trial that investigated the effects of either exercise interventions or exercise prescribed as a component of a multidisciplinary intervention for inclusion. We defined exercise as any physical activity intervention programme designed to maintain or improve participant strength or function.
Comparator interventions were either 'usual care' (i.e. no change in hospital care, which might include physiotherapy) or a sham‐control intervention (i.e. an intervention that was not expected to affect physical or cognitive functioning, such as relaxation exercises, breathing exercises, gentle stretches). In the main analyses, we did not plan separate analyses for studies that used sham interventions, but combined these studies with those that compared an exercise intervention to usual care alone. This decision was made based on the original review (de Morton 2007a), and our knowledge of subsequently published studies. We expected significant variation across the three decades of included studies, across the different healthcare systems and countries, and between different types of ward (e.g. geriatric versus medical wards) in what constituted usual care. Due to the lack of standardisation in usual care, we did not think that a sham intervention would represent greater interstudy variability than already existed.
As described in the Background, we classified interventions in one of the following subgroups: rehabilitation‐related activities, structured exercise interventions and progressive resistance exercise interventions. These subgroups were defined a priori, based on our knowledge from the original review (de Morton 2007a), and our knowledge of subsequently published papers.
Types of outcome measures
Major outcomes
-
Functional ability, which was subcategorised into three groups (if more than one measure was provided within the subcategories, we preferentially extracted the measure most frequently reported among the other included studies):
-
independence with activities of daily living (ADL) (including but not limited to the Barthel Index and Functional Independence Measure);
-
functional mobility (including but not limited to: Elderly Mobility Scale, de Morton Mobility Index, Hierarchical Assessment of Balance and Mobility, Functional Ambulatory Category);
-
new incidence of delirium during hospitalisation.
-
-
Quality of life.
-
Number of falls during hospitalisation.
-
Medical deterioration during hospitalisation (defined as any medical deterioration described in the study report including development of delirium, but excluding death).
-
Participant global assessment of success.
Minor outcomes
-
Death during hospitalisation.
-
Musculoskeletal injuries during hospitalisation.
-
Hospital length of stay.
-
New institutionalisation at hospital discharge.
-
Hospital readmission.
-
Walking performance (including but not limited to the Timed Up and Go test and the 10 m or 6 m walk test).
Timing of outcome assessments
Discharge from hospital was the time point for between‐group comparisons of all major outcomes.
The time point for between‐group comparisons of all minor outcomes was discharge from hospital, apart from readmission to hospital which, in order to reduce loss to follow‐up, was taken as the first data collection time point after discharge reported by the individual studies.
Search methods for identification of studies
Electronic searches
We adapted the original search strategy to improve identification of relevant studies (de Morton 2007a). Therefore, the search was not limited to the time after the original review, but from inception of each database. We searched the following databases from inception to May 2021.
-
Cochrane Central Register of Controlled Trials (CENTRAL; Appendix 1).
-
MEDLINE via Ovid (Appendix 2).
-
Embase via Ovid (Appendix 3).
We also searched the following databases registries for ongoing and recently completed studies (May 2021).
-
ClinicalTrials.gov (clinicaltrials.gov; Appendix 4).
-
WHO Clinical Trials Registry Platform (trialsearch.who.int/Default.aspx;Appendix 5).
Searching other resources
We searched all reference lists of included studies for other potentially relevant studies missed by the electronic search of databases.
Data collection and analysis
Selection of studies
Two review authors (PH and MR or KJ or JK or TS) independently examined all titles and abstracts by using the predefined eligibility criteria. If a reason for exclusion was not evident, we obtained the full manuscript. Two review authors (PH and MR or KJ or JK or TS) independently examined the full manuscripts of all remaining studies. We resolved disagreement by discussion other review authors (MR, KJ, JK, TS). All review authors agreed on the final list of included studies. We used Covidence to manage the screening and storage of studies.
Data extraction and management
Two review authors (PH and MR or KJ or JK or TS) independently extracted relevant data for each included study including study location, population description, outcome measures used, participant and hospital outcome data, and details of the intervention based on the TIDieR checklist (Hoffmann 2014):
-
intervention name;
-
rationale, theory or goal of the elements essential to the intervention;
-
description of any materials used in the intervention;
-
description of the procedures and activities used in the intervention;
-
description of who provided the intervention, including expertise and specific training;
-
description of modes of delivery (e.g. one‐to‐one or group sessions);
-
description of where the intervention occurred;
-
description of the dose of the intervention (frequency, duration, intensity);
-
description of how the intervention was personalised, titrated or adapted;
-
description of any modifications made to the intervention during the course of the study;
-
description of how fidelity to the intervention was assessed;
-
description of the observed fidelity.
We resolved disagreements by discussion with other review authors (MR, KJ, JK, TS). We contacted trial authors for additional information regarding the outcome data if required.
Main comparison
The main comparison was exercise intervention versus usual care or a sham‐control intervention. The subgroup comparisons were:
-
rehabilitation‐related activities versus usual care or a sham‐control intervention;
-
structured exercise versus usual care or a sham‐control intervention;
-
progressive resistance training versus usual care or a sham‐control intervention.
We used Covidence to manage the extracted data.
Assessment of risk of bias in included studies
Two review authors (PH and MR or KJ or JK or TS) independently assessed risk of bias using the Cochrane RoB 2 tool (Higgins 2022a). We assessed risk of bias for all outcomes included in the review at the time points included in the meta‐analyses (i.e. at hospital discharge for all outcomes apart from readmission to hospital which was taken as the first data collection time point after discharge reported by the individual studies). We resolved disagreements through discussion with other review authors (MR, KJ, JK, TS), and approached the Cochrane Central Executive Methods Team for guidance. The RoB 2 tool covers the following domains:
-
bias arising from the randomisation process;
-
bias due to deviations from intended interventions;
-
bias due to missing outcome data;
-
bias in measurement of the outcome;
-
bias in selection of the reported result.
Risk of bias assessments are outcome specific for all domains other than bias arising from the randomisation process, which is study specific. For both outcome‐specific and study‐specific assessments, the possible risk of bias judgements are: low risk of bias; some concerns and high risk of bias. We made overall judgements of risk of bias using the published signalling questions and algorithms. We assessed risk of bias based on the effect of assignment to the intervention as opposed to the effect of adherence to the intervention. We used Covidence to manage the risk of bias assessment using a customised risk of bias set up.
Two review authors (JK, KJ) conducted included studies. They were not involved in the risk of bias assessments of their studies.
Measures of treatment effect
For dichotomised data (e.g. the number of participants experiencing an adverse event), we calculated the risk ratio (RR) and associated 95% confidence intervals (CIs).
For continuous data, we calculated the standardised mean difference (SMD) or the mean difference (MD) and associated 95% CIs. We used the MD when outcome measures in pooled trials were measured using the same scale. We used the SMD when studies used different instruments to assess comparable factors. We re‐expressed the SMD as the MD of a common instrument for interpretation, by multiplying the SMD and associated CIs by the (estimated) standard deviation (SD) of measurements of the intervention groups at discharge (postintervention). We obtained this estimate of the SD by calculating a weighted mean of measurements taken across all intervention groups of all studies that used the instrument (Higgins 2022b).
Unit of analysis issues
Where a trial reported multiple arms, we included only the relevant arms. If two comparisons were combined in the same meta‐analysis, we halved the control group to avoid double‐counting. One trial contained three arms consisting of a control group and two groups that were given exercise programmes; one of the two had the exercises supervised by a researcher and the other received daily reminders to exercise but no supervision (Hu 2020). To avoid the dilution of treatment effect caused by the absence of supervision, the intervention group that did not receive supervision was omitted from analysis.
We listed all treatment arms in the Characteristics of included studies table, even if they are not used in the review.
Dealing with missing data
We attempted to contact study authors if any data were missing or unclear. This included details of participant numbers, interventions, and outcome data.
We imputed certain missing data if they were unobtainable. Where studies reported only medians, we used these as direct best estimates of the group mean. We converted associated interquartile ranges (IQRs) to best estimates of the SDs by dividing the IQR by 1.35 (Higgins 2022b).
We derived SDs from related statistics (standard errors, CIs, t statistics and P values) when necessary using methods described in the Cochrane Handbook for Systematic Reviews of Interventions (Higgins 2022b). We conducted sensitivity analyses by reanalysing after removing all imputed data.
Assessment of heterogeneity
We assessed clinical and methodological diversity in terms of participants, interventions, outcomes and study characteristics for the included studies to determine whether a meta‐analysis was appropriate using the data from the Characteristics of included studies table.
We used the I² statistic to quantify inconsistency amongst the trials in each analysis and planned to use the following guide for the interpretation of an I² value (Deeks 2022):
-
0% to 40% might not be important;
-
30% to 60% may represent moderate heterogeneity;
-
50% to 90% may represent substantial heterogeneity;
-
75% to 100% represents considerable heterogeneity.
We considered that the observed value of the I2 statistic depends on: magnitude and direction of effects, and strength of evidence for heterogeneity (e.g. P value from the Chi² test, or a CI for the I² statistic: uncertainty in the value of the I² statistic is substantial when the number of studies is small).
We interpreted the Chi² test with P ≤ 0.10 indicating evidence of statistical heterogeneity.
We assessed heterogeneity by calculating the I2 statistic and prediction intervals (PIs) (Deeks 2022). We calculated PIs using R software (R), and the metafor package (Viechtbauer 2010).
Assessment of reporting biases
We assessed reporting bias for the major outcomes by comparison between the planned analysis reported for each the individual studies and the available results, and by visual examination of contour‐enhanced funnel plots when a meta‐analysis included at least 10 studies (Page 2022).
For all included studies, we attempted to obtain the protocol or the trial's registry record, or both. We compared these and the statistical analysis plan to the available results.
Contour‐enhanced funnel plots were produced with R (R) using the metafor package (Viechtbauer 2010). The funnel plots were visually assessed for asymmetry.
Data synthesis
We conducted pair‐wise meta‐analyses using Review Manager Web (Review Manager Web).
Based on the original review (de Morton 2007a), we concluded that methodological and clinical variation precluded the assumption of fixed‐effect models, that is that all effect estimates are estimating the same underlying treatment effect (Deeks 2022). Therefore, meta‐analyses using random effects models was conducted. If insufficient data were available to include a study in a meta‐analysis, or if fewer than two studies measured the outcome of interest, a narrative summary of the intervention effect was reported.
Primary meta‐analyses included all studies with the relevant outcomes regardless of risk of bias scoring.
Subgroup analysis and investigation of heterogeneity
We conducted the following subgroup analyses to examine heterogeneity based on the type of exercise intervention. Subgroups are defined in the Description of the intervention section.
-
Rehabilitation‐related activities versus usual care or a sham‐control intervention
-
Structured exercise versus usual care or a sham‐control intervention
-
Progressive resistance training versus usual care or a sham‐control intervention
We performed further post‐hoc subgroup analyses to examine the effect of sham interventions in addition to usual care for the outcomes: independence with ADL at hospital discharge and functional mobility at hospital discharge. We compared exercise interventions to usual care (excluding studies using sham‐control interventions) and separately compared exercise interventions to sham‐control interventions.
Sensitivity analysis
We conducted two sensitivity analyses for all meta‐analyses.
-
To examine the effect of risk of bias, we removed all studies scored as 'high risk of bias' for the relevant outcomes from meta‐analysis of that outcome; the meta‐analysis was then conducted if a minimum of two studies assessed at low risk of bias or with some concerns were available.
-
To examine the effect of data imputation, we conducted a sensitivity analysis removing all studies with imputed data, providing there were at least two studies remaining with complete data (either reported or supplied by the authors) included in the original meta‐analysis.
Summary of findings and assessment of the certainty of the evidence
We followed the guidelines in the Cochrane Handbook for Systematic Reviews of Interventions, Chapters 14 and 15 (Schünemann 2022a; Schünemann 2022b), for interpreting results, and were aware of distinguishing a lack of evidence of effect from a lack of effect. We based our conclusions only on findings from the quantitative synthesis of included studies for this review. We avoid making recommendations for practice, and our implications for research suggest priorities for future research and outline what the remaining uncertainties are in the area. The summary of findings tables presents outcome‐specific information concerning the overall certainty of evidence, the magnitude of effect of the interventions examined and the sum of available data on the main outcomes.
The following outcomes are presented in the summary of findings tables.
-
Independence with ADL at hospital discharge.
-
Functional mobility at hospital discharge.
-
New incidence of delirium during hospitalisation.
-
Quality of life at hospital discharge.
-
Number of falls during hospitalisation.
-
Medical deterioration during hospitalisation.
-
Participant global assessment of success at hospital discharge.
We presented the following summary of findings tables.
-
Exercise intervention (including all three subgroups – general rehabilitation activities; structured exercise and progressive resistance training) compared to usual care or a sham intervention.
-
Rehabilitation‐related activity interventions compared to usual care or a sham intervention.
-
Structured exercise interventions compared to usual care or a sham intervention.
-
Progressive resistance exercise interventions compared to usual care or a sham intervention.
Two review authors (PH, JK) independently assessed the certainty of the evidence using GRADE and resolved disagreements by discussion or involving a third review author (KJ) (Schünemann 2022a). We used the five GRADE considerations (study limitations (overall risk of bias), consistency of effect, imprecision, indirectness and publication bias) to assess the certainty of the body of evidence as it related to the studies that contributed data to the analyses for the prespecified outcomes, and reported the certainty of evidence as high, moderate, low or very low. We justified, documented and incorporated judgements into reporting of results for each outcome.
We used GRADEpro GDT software to prepare the summary of findings tables (GRADEpro GDT). We justified all decisions to downgrade the certainty of evidence for each outcome using footnotes and we made comments to aid the reader's understanding of the review where necessary.
Results
Description of studies
See: Characteristics of included studies; Characteristics of excluded studies; Characteristics of studies awaiting classification; and Characteristics of ongoing studies tables.
Results of the search
The search returned 14,971 references. After Covidence automatically removed duplicates, this left 12,278 references for title and abstract review. After title and abstract screening, 108 were carried forward for full‐text review, of which 24 studies (35 references) were eligible for inclusion, 70 articles were excluded, one article is awaiting classification and two studies are ongoing.
Included studies
Population
The studies included 7511 participants and 58% were women. The median of the studies' reported mean age was 82.5 years (range 73 to 88 years). Of the 24 studies, 13 were from Europe, six from Oceania, four from North America and one from South America.
Design
Six studies were classified as quasi‐RCTs, in three, group allocation was based on the availability of beds (Ekerstad 2017; Mudge 2019; Zelada 2009); in two allocation was based on alternation (Killey 2006; Slaets 1997), and one used four‐ to eight‐week randomisation blocks (Ortiz‐Alonso 2020). One study provided no information of the randomisation process other than to report participants were randomised (Blanc‐Bisson 2008). de Morton 2007 randomised at ward‐level (i.e. the intervention ward was designated via coin toss). All other studies randomised participants individually.
Intervention and comparison
Brief descriptions of the interventions are provided in Table 1 with more detailed description based on the TIDieR checklist provided in Characteristics of included studies table.
| Study ID | Usual care setting and description | Control/sham intervention | Intervention group setting and description | Intervention subgroup category | Exercise component of intervention | Exercise dose prescription | Exercise intervention adherence |
|---|---|---|---|---|---|---|---|
| Acute geriatric unit. Geriatrician‐led care, physiotherapy requested by the geriatrician as required. | None. | Usual care conditions with additional occupational therapy interventions. | Rehabilitation‐related activities. | Occupational therapy including practice of activities of daily living. | 45 minutes, 5 times per week (Monday–Friday), for the duration of hospital admission. | Mean 5 sessions per participant. | |
| Medical ward. Internist‐led care, physiotherapy and occupational therapy not routinely available. No geriatrician. | None. | Acute geriatric ward. Care provided by both geriatricians and internists. Multidisciplinary team included physiotherapists, occupational therapists and dietitians. Emphasis on interdisciplinary care. | Rehabilitation‐related activities. | Exercise component not specifically described, intervention included early start of rehabilitation and routine physiotherapy and occupational therapy assessments. | No information. | No information. | |
| Acute care geriatric medicine unit. Physiotherapy provided from day 3 of admission, for 3 sessions per week until discharge. | None. | Usual care conditions with additional physiotherapy. | Structured exercise. | Early physiotherapy starting from day 1–2 of admission consisting of bed and standing exercises. | 30 minutes, 2 times per day, 5 times per week, until deemed clinically stable. | No information. | |
| Medical ward. Physicians could order physiotherapy services. | Usual care with daily 15‐ to 20‐minute visits from research assistants, up to twice daily, 7 days per week. Participants requested to keep a diary of their visitors. | Usual care conditions + mobility programme, and encouragement to increase time out of bed. | Structured exercise | Assisted/ supervised mobility programme with behavioural intervention to encourage additional physical activity outside the supervised intervention. | 15–20 minutes, up to twice per day, 7 days per week, for the duration of hospital admission. | 122/238 (51.3%) potential walks were completed. | |
| Usual care units. Not described.
| None. | Acute Care for Elders Unit Renovated ward with a physiotherapy room. Daily interdisciplinary team rounds provided by geriatrician medical director and geriatric clinical nurse specialist who created care plans. Care processes designed to promote functional independence. | Rehabilitation related activities. | Exercise component not specifically described, intervention included a mobility protocol and physiotherapy. | No information. | No information. | |
| Medical ward. Routine care, discharge planning and rehabilitation advice normally provided. | None. | Usual care with additional exercise. | Progressive resistance exercise. | With 72 hours of admission a care plan was produced by a nurse and physiotherapist which included: facilitated stretching, balance training, walking and strengthening exercises. | Walking for up to 15 minutes (duration of other exercise not specified), up to 2–4 times per week, for the duration of the hospital admission. | No information regarding in‐hospital adherence. | |
| Medical wards. Daily medical assessment, and allied health service on referral. | None. | Usual care with additional exercise. | Progressive resistance exercise. | Supervised strengthening and mobility exercise. | 20–30 minutes, twice per day, 5 days per week, for the duration of the hospital admission. | No information. | |
| Acute medical care unit. Care led by physicians specialising in internal medicine. Physiotherapy/ occupational therapy available for counselling only. | None. | Comprehensive geriatric assessment unit. Structured comprehensive geriatric assessment and care led by physicians specialising in internal medicine, family medicine, geriatrics or a combination. Unit staff included physiotherapists and occupational therapists. | Rehabilitation‐related activities. | Exercise component not specifically described, intervention included routine physiotherapy and occupational therapy. | No information. | No information. | |
| Medical or surgical floors. Description not provided other than 'standard medical care'. | None. | Senior Care Unit Functional assessment on admission, 3 clinical team meetings and 1 administration meeting weekly. Geriatric assessment team included nurse co‐ordinators and a physiotherapist. Emphasise interdisciplinary comprehensive geriatric assessment and intervention. | Rehabilitation‐related activities. | Exercise component not specifically described, intervention included routine functional assessment and physiotherapy. | No information. | No information. | |
| Geriatric unit. Care led by a geriatrician and provided by multidisciplinary team. | None. | Usual care with a walking intervention guided by geriatrician, delivered by nurses. | Structured exercise. | Assisted walking programme. | 20–30 minutes, daily, 5 days per week, for the duration of hospitalisation. | A mean time of 32 minutes per session (range 10–67), with a mean distance of 89 m (range 0–260). Mean number of intervention days for each participant was 5.8. | |
| Medical wards. Not described. | None. | Usual care conditions with mobility programme. | Structured exercise. | Assisted or supervised exercise, including balance, pedalling and mobility activities. | Up to 30 minutes per day, for the duration of hospital admission. | No information. | |
| Medical unit. Daily medical assessment and allied health professionals available via referral. | None. | Usual care conditions with additional exercise and orientation. | Progressive resistance exercise. | Progressive resistance exercise and mobility training. | 20–30 minutes per day (Monday–Friday), twice per day, for the duration of hospitalisation. | Median of 1.4 therapy sessions per day or 38 minutes per day (including weekends and routine therapy). This was equivalent to approximately 1.4 sessions or 42 minutes of additional therapy per weekday compared to the control group. | |
| General medical wards. Allied health interventions including physiotherapy available. | None. | Usual care conditions with additional exercise. | Progressive resistance exercise. | Individualised assisted or supervised strength, balance and functional exercises. | 30 minutes, twice per day for the duration of hospitalisation. | Median of 160 minutes (IQR 120–360) participating in the exercise intervention. | |
| Medical units. Physiotherapy available. | None. | Usual care conditions with additional assisted/ supervised walking. | Structured exercise. | Assisted or supervised walking programme. | Twice per day, 7 days per week, for 7 days. The distance walked was the maximum distance able to be comfortably walked as decided by that individual at that time. | No information. | |
| General medical unit. Care led by attending physician, nursing:participant ratio approximately 1:2. Access to hospital wide support services including physiotherapy. | None. | Acute Care for Elders Unit Care led by medical and nursing directors. Increased funded multidisciplinary team hours compared to usual care (including physiotherapy) with care protocols and ward environment designed to promote independence and early discharge. | Rehabilitation‐related activities | Exercise component not specifically described, intervention included a mobility protocol and physiotherapy. | No information. | No information. | |
| Acute Care for the Elderly Unit. Care led by a geriatrician with routine physiotherapy available when needed. | None | Usual care conditions with additional exercise. | Progressive resistance exercise | Supervised morning sessions included progressive resistance, balance and walking exercises. Unsupervised functional exercises in evenings. | 20 minutes, twice per day for 5–7 consecutive days (including weekends). | The mean number of completed morning sessions per participant was 5 (SD 1) and evening sessions was 4 (SD 1). Adherence to the intervention was 95.8% for the morning sessions (i.e. 806 successfully completed sessions of 841 total possible sessions) and 83.4% in the evening sessions (574 of 688 successfully completed sessions). | |
| All wards admitting older medical patients. Physiotherapy available to all participants (mean 3 sessions per week).
| Usual care with twice‐daily sessions (Monday–Friday) each 20–30 minutes of stretching and relaxation exercises in lying or sitting. Participants encouraged to talk about their condition and exercise, none given education, encouragement or assisted to exercise or walk more. | Usual care with additional exercise. | Progressive resistance exercise. | Assisted or supervised tailored strengthening, balance and gait exercises. | Up to 30 minutes, 2 times per day (Monday–Friday) for the duration of hospital admission. | 63/95 participants completed ≥ 75% of possible exercise sessions; 16/95 participants completed 50–74% of possible exercise sessions. 13/95 participants completed 25–49% of possible exercise sessions. 3/95 participants completed < 25% of possible exercise sessions. | |
| Acute medical wards for older people. Not described. | None. | Usual care with additional pedalling exercise. | Structured exercise. | Unsupervised pedalling exercise. | 5 minutes, 3 times per day. | The median number of revolutions cycled throughout the entire study period with the pedal exerciser was 152 (IQR 43.5–464.5) revolutions. The median time spent on the pedal exerciser was 5.08 (IQR 2.03–20.05) minutes across the whole study period. | |
| Medical ward. Multidisciplinary care included daily discussion of participant progress and discharge plan. Referrals made to physiotherapy or occupational therapy when needed. | None. | Medical ward Usual care with additional exercise and cognitive group therapy to encourage mobility. Intervention ward staff, participants and carers educated to encourage mobility and functional independence. | Progressive resistance exercise. | Graduated and tailored supervised exercise programme. | Twice per day for the duration of hospital admission. | 92% of participants in the intervention group received an exercise diary and made some record of exercise; 1/3 completed their diary every day. | |
| Acute care of older patient units Not described. | None. | Usual care with additional exercise. | Progressive resistance exercise. | Supervised walking and sit to stand exercises. | 1–3 sessions per day, with a total duration of approximately 20 minutes per day (Monday–Friday). | Participants performed a median of 3 training days (IQR 2) and 2 training sessions per day (IQR 2), with a mean total exercise time per day of 20 minutes (for each session, the median duration of the walking part was 5 minutes (IQR 4, range 0–10), and participants performed a mean of 9 (SD 6, range 0 to 30) sit‐to‐stands). | |
| Acute medical ward and internal medicine ward. National targets to assess function and nutrition and make an appropriate plan within 24–48 hours of admission. Rehabilitation often started during hospitalisation. | None. | Usual care with additional exercise and protein supplements. | Progressive resistance exercise. | Supervised progressive strength training based on sit to stand exercises. | 20 minutes daily (Monday–Friday) for the duration of hospital admission. | 78.8% of participants started the intervention 0–2 days after admission. Overall (during and after hospitalisation), 43% (18/42) of the participants randomised to the intervention group were very compliant with the intervention (80% of sessions performed with 2 sets of 8 repetitions). | |
| General medical elderly care wards. Therapy provided by ward occupational therapist and physiotherapist on weekdays only. | None. | General medical elderly care wards. Therapy provided by community therapy team including occupational therapist and physiotherapist 7 days per week if appropriate. | Rehabilitation related activities. | Exercise component not specifically described, intervention included daily rehabilitation with a physiotherapist or occupational therapist. | Daily, duration dependent on needs. | No information. | |
| General medical unit. Description not provided. | None. | General Medical Unit. In addition to usual care, a geriatric team consisting of a geriatrician, physiotherapist and liaison nurse provided care including daily physiotherapy. The aim of the team was to optimise function and mobility. | Rehabilitation related activities | Exercise component not specifically described, intervention included daily physiotherapy. | No information. | No information. | |
| Internal medical care unit. Care led by internist physician and had access to physical and occupational therapy by referral. | None. | Geriatric care unit. Care led by geriatrician and ward team included physiotherapist and occupational therapist. | Rehabilitation‐related activities | Exercise component not specifically described, intervention included a mobility protocol and physiotherapy. | No information. | No information. |
IQR: interquartile range; SD: standard deviation.
Nine interventions were classified as rehabilitation‐related activities (Abizanda 2011; Asplund 2000; Counsell 2000; Ekerstad 2017; Fretwell 1990; Landefeld 1995; Sahota 2017; Slaets 1997; Zelada 2009), six as structured exercise (Blanc‐Bisson 2008; Brown 2016; Gazineo 2021; Hu 2020; Killey 2006; McGowan 2018a), and nine as progressive resistance training (Courtney 2009; de Morton 2007; Jeffs 2013; Jones 2006; Martinez‐Velilla 2019; McCullagh 2020; Mudge 2008; Ortiz‐Alonso 2020; Pedersen 2019).
Seven of the nine studies classified as rehabilitation‐related activities typically compared medical wards to new geriatric wards or geriatric services (Asplund 2000; Counsell 2000; Ekerstad 2017; Fretwell 1990; Landefeld 1995; Slaets 1997; Zelada 2009). Medical wards were generally described as not having routine physiotherapy, and geriatric wards/services as focused on multidisciplinary working including routine physiotherapy, and often described as having an emphasis on rehabilitation and optimisation of function. The other three studies compared additional therapy time to usual care in the same setting. Abizanda 2011 provided additional daily occupational therapy sessions to the intervention group and Sahota 2017 compared usual care that provided weekday therapy (occupational therapy and physiotherapy) only to a 'seven days per week' therapy service.
All six studies classified as structured exercise used the same setting for their control and intervention arms. In four cases, the setting was medical wards (Brown 2016; Hu 2020; Killey 2006; McGowan 2018a), in the remaining two, the setting was geriatric wards (Blanc‐Bisson 2008; Gazineo 2021). Five studies supervised the exercise interventions (Blanc‐Bisson 2008; Brown 2016; Gazineo 2021; Hu 2020; Killey 2006). In two cases, this was by research staff (Brown 2016; Hu 2020), two by nursing staff (Gazineo 2021; Killey 2006), and in one by a physiotherapist (Blanc‐Bisson 2008). Most studies appeared to focus on the frequency and total dose of exercise. In addition to frequency and dose, Blanc‐Bisson 2008 also modified the time to first physiotherapy treatment in the intervention group.
All nine studies classified as progressive resistance training used the same setting for their control and intervention arms. In five cases, this was medical wards (de Morton 2007; Jeffs 2013; Mudge 2008; Pedersen 2019; Pedersen 2019), in three it was geriatric wards (Jones 2006; Martinez‐Velilla 2019; Ortiz‐Alonso 2020), and in one, it was both medical and geriatric wards (McCullagh 2020). All exercise interventions were supervised, in five cases by a physiotherapist (de Morton 2007; Jones 2006; McCullagh 2020; Mudge 2008; Pedersen 2019), two by a fitness specialist (Martinez‐Velilla 2019; Ortiz‐Alonso 2020), one by a combination of a nurse and physiotherapist (Courtney 2009), and one by a certified allied health assistant (Jeffs 2013).
Due to the varying settings of 'usual care', specifically medical wards or geriatric wards in some cases, what would be the intervention in one study (i.e. in the rehabilitation‐related activity subgroup) was very similar to usual care in another. It is apparent that there were differences between countries in terms of what usual care within the same specialities or settings consisted of. For example, Pedersen 2019, a Danish study, referred to national targets to assess function and nutrition and make an appropriate plan within 24 to 48 hours of admission. However, considerable differences in the details reported prevented more detailed comparisons of usual care.
Two studies used a sham intervention in addition to usual care as their control (Brown 2016; McCullagh 2020). Participants in the control arm of Brown 2016 received visits up to twice per day from research assistants "to control for the daily attention" that the exercise intervention group received. Participants in the control arm of McCullagh 2020 received twice‐daily supervised stretching and relaxation exercises in lying or sitting positions only.
Of the studies that reported the frequency of sessions, 10 were twice per day (Blanc‐Bisson 2008; Brown 2016; de Morton 2007; Jeffs 2013; Jones 2006; Killey 2006; Martinez‐Velilla 2019; McCullagh 2020; Mudge 2008; Ortiz‐Alonso 2020), five were once per day (Abizanda 2011; Gazineo 2021; Hu 2020; Pedersen 2019; Sahota 2017), one was three times per day (McGowan 2018a), and one was two to four times per week (Courtney 2009).
Adherence to the interventions and total 'dose' of the intervention varied considerably, see Table 1. For example, participants in McGowan 2018a averaged five minutes of exercise across the entire study period, approximately 8% of the prescribed dose, whereas participants in Martinez‐Velilla 2019 had an estimated mean of 150 minutes of exercise in total, and an adherence of approximately 90% to the prescribed dose.
Outcomes
We used SMDs to estimate the effect size for independence in ADL at discharge from hospital (Analysis 1.1); functional mobility at discharge from hospital (Analysis 1.2); and walking performance at discharge from hospital (Analysis 2.5).
Studies measured independence in ADL at discharge using the Barthel Index (scale 0 to 100) (Abizanda 2011; de Morton 2007; Gazineo 2021; Jeffs 2013; Jones 2006; Killey 2006; Martinez‐Velilla 2019), a customised version of the Barthel Index (scale 0 to 90) (Mudge 2008), or the modified Barthel Index (scale 0 to 20) (Pedersen 2019), a Katz ADL scale (from 0 to 6) (Ortiz‐Alonso 2020), a modified Katz ADL scale (from 0 to 5) (Counsell 2000; Landefeld 1995), a modified Katz ADL scale (from 7 to 21) (Brown 2016; Hu 2020), or a modified Katz ADL scale (from 0 to 12) (Blanc‐Bisson 2008), or the ADL staircase (scale 0 to 9) (Ekerstad 2017). In all studies apart from three (Blanc‐Bisson 2008; Brown 2016; Ekerstad 2017), a higher outcome measure score represented higher levels of independence with ADL.
Studies measured functional mobility using the Short Physical Performance Battery scale (0 to 12) (Martinez‐Velilla 2019; McCullagh 2020; Ortiz‐Alonso 2020), Physical Performance and Mobility Examination (scale not reported) (Counsell 2000), Functional Ambulation Category (scale 1 to 6) (de Morton 2007), Braden Activity subscale (scale 1 to 4) (Gazineo 2021), Elderly Mobility Scale (scale 0 to 20) (McGowan 2018a), and de Morton Mobility Index (scale 0 to 100) (Pedersen 2019).
Studies measured walking performance using the Timed Up and Go test (de Morton 2007; Ekerstad 2017; Hu 2020; Jones 2006), distance able to be walked (Killey 2006), and walking speed over 4 m (Pedersen 2019).
Excluded studies
We excluded 70 studies/reports based on reading the full‐text manuscripts. The most common reason was the study's setting (14 were base in inpatient rehabilitation, five in the community, one in critical care). Other reasons for exclusion included that participants were randomised after 72 hours of their hospital admission (eight) and not general medical populations (eight). See Figure 1 and Characteristics of excluded studies table for a full list of reasons for exclusion.

Study flow diagram
Studies awaiting classification
One study is awaiting classification as our literature search identified the study registration, but it was not completed by the time we submitted the review (Kojaie‐Bidgoli 2021). See Characteristics of studies awaiting classification table.
Ongoing studies
There are two ongoing studies (NCT03604640; NCT04600453). See Characteristics of ongoing studies table.
Risk of bias in included studies
See risk of bias judgements for each outcome in the Characteristics of included studies table, and at the side of the forest plots. The summarised justifications for each judgement are found in the Risk of bias section, and full justifications with answers to each signalling question are available at: 10.6084/m9.figshare.16685023. Common reasons for a study outcome to be judged at high risk were bias due to the randomisation process and bias in the measurement of the outcome. Five studies were at high risk of bias arising from the randomisation process (Ekerstad 2017; Killey 2006; Mudge 2008; Ortiz‐Alonso 2020; Zelada 2009). In all cases, this was due to methods of intervention allocation lacking concealment, either due to a predictable randomisation sequence (e.g. alternating) or allocation based on availability of beds and the decisions of the admitting clinicians.
Several major outcomes had high proportions of studies assessed at high risk of bias (independence of ADL 11/16, functional mobility 6/8, incidence of delirium 3/7, falls 2/4 and medical deterioration 2/11). The most common domain at high risk of bias was measurement of the outcome. This included the outcomes: independence of ADL and functional mobility. Of the 11 studies judged at high risk of bias overall for ADL, eight were at high risk of bias in measurement of the outcome, four due to the randomisation process, three due to missing outcome data and one for deviation from the intended interventions. Of the six studies measuring functional mobility that were at high risk of bias overall, five were at high risk of bias in measurement of the outcome, one due to missing outcome data and one due to the randomisation process (in addition to high risk of bias in measurement of the outcome).
Effects of interventions
See: Summary of findings 1 Summary of findings table ‐ Exercise interventions compared to usual care with or without sham interventions for acutely hospitalised older medical patients; Summary of findings 2 Summary of findings table ‐ Rehabilitation‐related activity interventions compared to usual care with or without sham interventions for acutely hospitalised older medical patients; Summary of findings 3 Summary of findings table ‐ Structured exercise interventions compared to usual care with or without sham interventions for acutely hospitalised older medical patients; Summary of findings 4 Summary of findings table ‐ Progressive resistance exercise interventions compared to usual care with or without sham interventions for acutely hospitalised older medical patients
Exercise interventions compared to usual care with or without sham interventions for acutely hospitalised older medical patients
Results are presented for overall (summary of findings Table 1) and subgroup analyses by type of exercise shown in summary of findings Table 2; summary of findings Table 3; and summary of findings Table 4.
Major outcomes
1.1 Functional ability: independence in activities of daily living at discharge from hospital
We identified 18 trials that reported independence in ADL at discharge following inpatient exercise or usual care for older people admitted to hospital for medical illnesses (Analysis 1.1). Sixteen were included in a meta‐analysis. Two trials reported this outcome as a categorical outcome rather than continuous (Slaets 1997; Zelada 2009).
There was little to no difference in independence in ADL at hospital discharge in people receiving exercise compared to usual care (SMD 0.09, 95% CI −0.02 to 0.19; 16 trials, 5174 participants; low‐certainty evidence downgraded for risk of bias and inconsistency). Of the seven studies that measured independence with ADL using the Barthel Index (scale 0 to 100, with 100 representing highest level of independence), the scores in the control group ranged from 42 to 96 points at discharge from hospital, and the estimated SMD was equivalent to a 1.84 (95% CI 0.43 lower to 4.12 higher) points better on the Barthel Index at discharge from hospital in the exercise intervention group. We approximated a minimally clinically important difference in the Barthel Index using the methodology described by Norman 2003 of half an SD. Half of the pooled baseline SD of the studies using the Barthel Index was 11. Therefore, the SMD and CI do not represent a meaningful benefit. We downgraded the certainty of evidence to low due to inconsistency (I² = 66%, 95% PI for SMD −0.25 to 0.42) and risk of bias due to bias in randomisation, missing data and measurement of the outcome. There was no publication bias detected from visual inspection of the funnel plot (Figure 2).

Funnel plot: independence with activities of daily living at discharge from hospital.
We performed a sensitivity analysis by removing studies judged at high risk of bias (Blanc‐Bisson 2008; Counsell 2000; de Morton 2007; Ekerstad 2017; Gazineo 2021; Hu 2020; Killey 2006; Landefeld 1995; Mudge 2008; Ortiz‐Alonso 2020; Pedersen 2019). There was no meaningful change of the estimate of the effect (SMD 0.06, 95% CI −0.20 to 0.33; 5 trials, 1502 participants) and imputed data did not suggest a clinically meaningful benefit (SMD 0.21, 95% CI 0.05 to 0.37; 8 trials, 2939 participants).
Subgroup analysis of studies that did not use a sham intervention (i.e. all studies other than Brown 2016) did not meaningfully change the estimate of the effect (SMD 0.11, 95% CI −0.00 to 0.21; 15 trials, 5080 participants). Brown 2016 reported no difference between ADL score at discharge (8.1 (SD 0.29) in the intervention group versus 8.0 (SD 0.25) in the control group; scale 7 to 21, with 7 representing the greatest independence with ADL; P = 0.96).
Two studies were not included in meta‐analyses (Slaets 1997; Zelada 2009). Slaets 1997 reported a greater proportion of participants in the intervention group improved their Barthel Index scores from admission to discharge than those in the control group (61.3% with intervention versus 45.7% with control) and fewer deteriorated (2.5% with intervention versus 14.1% with control). Zelada 2009 reported 13 (19.1%) participants in the intervention group exhibited functional deterioration on discharge relative to 30 (40%) participants admitted to the conventional care unit. Both studies were at high risk of bias due to lack of a blinded assessor.
Subgroup meta‐analyses by type of exercise did not differ meaningfully from the overall analyses (rehabilitation‐related activities subgroup: SMD 0.00, 95% CI −0.12 to 0.13; 4 trials, 2838 participants; summary of findings Table 2); structured exercise subgroup: SMD 0.12, 95% CI −0.21 to 0.45; 5 trials, 648 participants; summary of findings Table 3; progressive resistance exercise subgroup: SMD 0.14, 95% CI −0.05 to 0.32; 7 trials, 1688; summary of findings Table 4; low‐certainty evidence downgraded for bias and inconsistency).
1.2 Functional ability: functional mobility at discharge from hospital
Nine studies reported a measure of functional mobility at discharge from hospital. Eight were included in the meta‐analysis (Analysis 1.2). One study reported this outcome with categorical rather than continuous data (Slaets 1997), so results are included as a narrative description only.
The evidence is very uncertain about the effect of exercise on functional mobility at discharge from hospital compared to usual care (SMD 0.28, 95% CI −0.01 to 0.56; 8 trials, 2369 participants; summary of findings Table 1; very low‐certainty evidence downgraded for bias and inconsistency). Of the three studies that measured functional mobility using the Short Physical Performance Battery (possible scores range from 0 to 12, with 12 representing best level of function), the scores in the control group ranged from 3.7 to 4.9 at discharge from hospital and the estimated SMD was equivalent to 0.78 (95% CI 0.02 lower to 1.57 higher) points better in the exercise intervention group. A minimally clinically important difference in the Short Physical Performance Battery has been reported as 1.0 point in older adults (Perera 2006). The certainty of evidence was downgraded two levels due to high inconsistency (I² = 90%, 95% PI for SMD −0.52 to 1.07), and one level for risk of bias due to bias in randomisation, missing data and measurement of the outcome.
Slaets 1997 reported that 47.9% of the intervention group improved their mobility scores compared to 43.5% in the control group and none in the intervention group deteriorated in mobility compared to 6.5% in the control group. The study is at high risk of bias due to the lack of a blinded assessor.
We performed a sensitivity analysis after removing studies at high risk of bias. There was benefit in favour of the intervention (SMD 0.52, 95% CI 0.31 to 0.74; 2 trials, 478 participants). Sensitivity analysis after removing studies with imputed data did not differ meaningfully from the overall analyses (SMD 0.22, 95% CI −0.02 to 0.45; 6 trials, 1953 participants).
Subgroup analysis of only studies that did not use a sham intervention (i.e. all studies other than McCullagh 2020) did not result in a meaningful change from the overall analyses (SMD 0.26, 95% CI −0.06 to 0.58; 7 trials, 2194 participants). McCullagh 2020 reported a benefit in the Short Physical Performance Battery in favour of the intervention group at discharge from hospital (MD 0.88, 95% CI 0.20 to 1.57; P = 0.01). The results of McCullagh 2020 do not differ meaningfully from Analysis 1.2.
Subgroup analysis of rehabilitation‐related activities was not possible as only one study reported the outcome: Counsell 2000 reported an MD of 0.63 (95% CI 0.09 to 1.17) in the Physical Performance and Mobility Examination at discharge, favouring the exercise intervention group. There was no effect with structured exercise or progressive resistance training (structures exercise: SMD 0.39, 95% CI −0.75 to 1.53; 2 trials, 416 participants; summary of findings Table 3; progressive resistance training: SMD 0.24, 95% CI −0.09 to 0.56; 5 trials, 978 participants; summary of findings Table 4; very low‐certainty evidence downgraded for bias, imprecision and inconsistency). Subgroup analysis did not explain the inconsistency observed, and we were unable to identify the cause of the high inconsistency.
1.3 Functional ability: new incidence of delirium during hospitalisation
There was little to no difference in the incidence of delirium during hospitalisation between groups (73 per 1000 participants, 95% CI 47 to 114 per 1000 with exercise versus 81 per 1000 participants with control group; RR 0.90, 95% CI 0.58 to 1.41; 7 trials, 2088 participants; Analysis 1.3; summary of findings Table 1; very low‐certainty evidence). We downgraded the certainty of the evidence due to risk of bias in randomisation and measurement of the outcome, inconsistency (I² = 39%, 95% PI for RR 0.40 to 2.05), and imprecision. We downgraded certainty for imprecision as there were fewer than 200 events in total and a control event rate of approximately 10%; hence an optimal information size was unlikely to have been met (Guyatt 2011). In addition, the CIs around the pooled effect included appreciable benefit and appreciable harm (i.e. an RR of less than 0.75 and greater than 1.25).
We performed a sensitivity analysis removing studies at high risk of bias (Asplund 2000; Brown 2016; Mudge 2008). There was no meaningful change from the main analysis (RR 0.88, 95% CI 0.50 to 1.55; 4 trials, 1451 participants). Subgroup analysis of rehabilitation‐related activities and progressive resistance training did not differ meaningfully from the main analysis (rehabilitation‐related activities: RR 0.86, 95% CI 0.30 to 2.50; 2 trials, 732 participants; summary of findings Table 2; progressive resistance training: RR 0.96, 95% CI 0.55 to 1.68; 4 trials, 1256 participants; summary of findings Table 4). Subgroup analysis of the structured exercise group was not possible as only one study reported this outcome. The study found only one incidence of delirium in the intervention group and none in the control group (Brown 2016).
1.4 Quality of life at discharge from hospital
We identified five studies that reported a measure of quality of life at discharge from hospital (Analysis 1.4). The mean quality of life scores on the EQ‐5D visual analogue scale (VAS) ranged between 48.7 and 64.7 in the control groups at discharge from hospital. Participants who received an exercise intervention may have had better quality of life (EQ‐5D VAS, higher scores indicate better quality of life) at discharge from hospital than those in the control group (MD 6.04 points higher, 95% CI 0.90 to 11.18; I² = 70%; 4 trials, 875 participants; low‐certainty evidence downgraded twice for inconsistency; 95% PI for MD −3.77 to 15.86; summary of findings Table 1), but this improvement was not clinically important. A minimally clinically important difference in the EQ‐5D VAS was approximated at 10 points, using the distribution‐based methods described by Norman 2003.
We performed a sensitivity analysis after removing studies judged at high risk of bias (Ekerstad 2017; Hu 2020). There was no change from the main analysis (MD 8.90 points higher, 95% CI 2.35 to 15.45; 2 trials, 449 participants).
The subgroup analysis of the progressive resistance exercise group showed a benefit (MD 8.90 points higher, 95% CI 2.35 to 15.45; 2 trials, 449 participants). Subgroup analysis was not possible for the rehabilitation‐related activities or structured exercise programme groups as they both included only one study. Ekerstad 2017 reported an MD of 2.20 points (95% CI −1.9 to 6.3) with rehabilitation‐related activities. Hu 2020 reported an MD of 3.7 points (95% CI −6.32 lower to 13.8 higher) with the structured exercise programme. Both of these studies were at high risk of bias.
1.5 Falls during hospitalisation
We identified nine studies that reported the number of falls during hospitalisation. There was no evidence of a difference in risk of falls during hospitalisation between exercise intervention and usual care groups (RR 0.99, 95% CI 0.59 to 1.65; 9 trials, 1787 participants). This is equivalent to 34 per 1000 participants in the control groups experiencing a fall compared to 34 per 1000 participants (95% CI 20 to 57) in the intervention groups (moderate‐certainty evidence; Analysis 1.5; summary of findings Table 1). We downgraded certainty for imprecision due to there being fewer than 60 events in total and a control event rate of approximately 2.5%, and an OIS is unlikely to have been met (Guyatt 2011). The CIs included appreciable benefit and harm (i.e. an RR less than 0.75 or more than 1.25).
We performed a sensitivity analysis after removing studies judged at high risk of bias (Killey 2006; Mudge 2008). There was no meaningful change from the main analysis (RR 1.20, 95% CI 0.67 to 2.13; 7 trials, 1608 participants).
Subgroup analysis was not possible for the rehabilitation‐related activities subgroup as only one study provided this outcome. Sahota 2017 reported four falls during hospitalisation in the intervention group and three in the control group. In the structured exercise group and progressive resistance training group, there was no evidence of a difference from the main analysis (structure exercise: RR 0.76, 95% CI 0.23 to 2.53; 3 trials, 542 participants; summary of findings Table 3; progressive resistance training: RR 0.96, 95% CI 0.48 to 1.91; 5 trials, 995 participants; summary of findings Table 4).
1.6 Medical deterioration during hospitalisation
There was no evidence of a difference in risk of medical deterioration during hospitalisation between exercise and usual care groups (RR 1.02, 95% CI 0.62 to 1.68; 11 trials, 2730 participants; Analysis 1.6; summary of findings Table 1; very low‐certainty evidence). This is equivalent to 71 participants per 1000 experiencing medical deterioration in the control group compared to 73 per 1000 (95% CI 44 to 120) in the intervention group. We downgraded certainty of the evidence for inconsistency (I2 = 51%, 95% PI for RR 0.33 to 3.19), imprecision as there were fewer than 200 events and a control rate of approximately 7%, hence an OIS was unlikely to have been met (Guyatt 2011). In addition, the CI around the estimated effect indicated that the true effect could range from appreciable harm to benefit; and indirectness, as outcomes varied between studies (i.e. some studies reported general medical deterioration (such as admission to critical care), some reported new incidences of delirium and some studies reported both). There was no publication bias from visual inspection of the funnel plot (Figure 3).

Funnel plot: medical deterioration during hospitalisation.
We performed a sensitivity analysis by removing the studies judged at high risk of bias (Asplund 2000; Mudge 2008). There was no meaningful change in the results (RR 1.06, 95% CI 0.58 to 1.92; 9 trials, 2193 participants). Subgroup analyses of the rehabilitation‐related activities and progressive resistance training groups did not differ meaningfully from the main analysis (rehabilitation‐related activities: RR 0.86, 95% CI 0.30 to 2.50; 2 trials, 732 participants; summary of findings Table 2; progressive resistance training: RR 0.99, 95% CI 0.52 to 1.87; 7 trials, 1798 participants; summary of findings Table 4). Subgroup analyses of the structured exercise programme showed no evidence of a difference with CIs including both a benefit and harm (RR 2.56, 95% CI 0.48 to 13.54; 2 trials, 200 participants; summary of findings Table 3).
1.7 Participant global assessment of success at discharge from hospital
No studies reported participant global assessment of success at discharge from hospital.
Minor outcomes
2.1 Death during hospitalisation
There was no evidence of a difference in risk of mortality during hospitalisation between exercise and usual care groups (RR 0.98, 95% CI 0.79 to 1.22; 20 trials, 6822 participants; Analysis 2.1; moderate‐certainty evidence). This is equivalent to 46 in 1000 participants dying during hospitalisation in the control group compared to 45 per 1000 participants (95% CI 37 to 56) in the intervention group. We downgraded the certainty of the evidence once for imprecision. There was no publication bias from visual inspection of the funnel plot (Figure 4). Sensitivity and subgroup analysis showed no difference between groups.

Funnel plot: mortality during hospitalisation.
2.2 Musculoskeletal injuries during hospitalisation
No studies reported the incidence of musculoskeletal injuries that occurred during hospitalisation; one study reported that no injuries occurred during treatment sessions (Abizanda 2011).
2.3 Hospital length of stay
Exercise interventions resulted in little to no difference in the length of hospital stay (MD −0.25 days, 95% CI −0.62 to 0.12 days; 22 trials, 7182 participants; Analysis 2.2; Figure 5; very low‐certainty evidence downgraded for inconsistency, imprecision and possible publication bias).

Funnel plot: length of hospital stay.
Sensitivity analysis after removing studies judged at high risk of bias and imputed data did not meaningfully differ from the main results. Subgroup analysis of the rehabilitation‐related activities group showed that there may be a benefit (MD −0.55 days, 95% CI −1.42 to 0.32 days; 9 trials, 4388; low‐certainty evidence downgraded for inconsistency and imprecision). Subgroup analysis of the structured exercise group and progressive resistance training group showed little to no difference in length of hospital stay.
2.4 New institutionalisation at hospital discharge
Exercise interventions resulted in no difference to the risk of new institutionalisation at hospital discharge (RR 0.91, 95% CI 0.74 to 1.12; 5 trials, 2364 participants; Analysis 2.3; moderate‐certainty evidence downgraded for imprecision). Sensitivity and subgroup analysis showed no difference between groups.
2.5 Readmission to hospital
Exercise interventions during hospitalisation resulted in no change to the risk of hospital readmission (RR 0.95, 95% CI 0.81 to 1.11; 14 trials, 4689 participants; Analysis 2.4; moderate‐certainty evidence downgraded for imprecision). Sensitivity analysis and subgroup analysis of the rehabilitation‐related activities and progressive resistance exercise groups did not differ meaningfully from the main analysis. Subgroup analysis of the structured exercise was not conducted as only one study measured hospital readmissions. Gazineo 2021 reported 33/174 participants in the intervention group versus 40/165 participants in the control group required hospital readmission within 30 days of discharge from hospital. There was no publication bias from visual inspection of the funnel plot (Figure 6).

Funnel plot: readmissions to hospital.
2.6 Walking performance at discharge from hospital
Exercise interventions had little to no effect on walking performance at discharge from hospital (SMD −0.13, 95% CI −0.35 to 0.09; 6 trials, 682 participants; Analysis 2.5; very low‐certainty evidence downgraded for inconsistency, imprecision and bias). One study was not included in the meta‐analysis as it presented results as categories (Mudge 2008). The study reported similar proportions of participants in each category of the Timed Up and Go (less than 20 seconds: 56% with intervention versus 50% with control; 20 to 40 seconds: 29% with intervention versus 24.2% with control; greater than 40 seconds or unable to complete test: 14.5% with intervention versus 26.8% with control; P = 0.37 for all three categories).
Sensitivity analysis was not possible as all studies were at high risk of bias. We performed a sensitivity analysis after removing studies with imputed data. There was no meaningful change from the overall analyses (SMD −0.16, 95% CI −0.47 to 0.15; 4 trials, 553 participants). Subgroup analysis of the structured exercise and progressive resistance exercise groups showed no difference between groups.
Discussion
Summary of main results
Twenty‐four studies (7511 participants) met the inclusion criteria for this review. Exercise interventions may provide little to no improvements in independence with ADL and may slightly improve the quality of life at discharge from hospital, although the certainty of evidence was low. There is very low‐certainty evidence on the effect of exercise interventions on functional mobility and walking performance at discharge from hospital and the incidence of new delirium during hospitalisation. Of the included adverse events outcomes, exercise interventions have no effect on the number of falls (moderate‐certainty evidence) or mortality during hospitalisation (moderate‐certainty evidence). We are uncertain whether exercise interventions affect medical deterioration during hospitalisation (very low‐certainty evidence). There were no studies reporting incidence of musculoskeletal injuries during hospitalisation. In addition, no studies reported participant global assessment of success. The exercise interventions resulted in non‐meaningful differences in length of hospital stay (very low‐certainty evidence), new institutionalisation (moderate‐certainty evidence), and hospital readmissions (moderate‐certainty evidence).
Subgroup analyses of the nine studies investigating the effect of interventions classified as rehabilitation‐related activities showed very‐low certainty evidence with regard to the effect of the intervention on independence with ADL at hospital discharge, incidence of new delirium during hospitalisation, and medical deterioration during hospitalisation. Rehabilitation‐related activity interventions reduced the length of hospital stay by over half a day (low‐certainty evidence), but appeared to have no meaningful effect on new institutionalisation at discharge from hospital (moderate‐certainty evidence), or hospital readmissions (moderate‐certainty evidence). Meta‐analysis to estimate the effect of rehabilitation‐related activities on functional mobility, quality of life or walking performance at hospital discharge, or the incidence of falls during hospitalisation was not possible, since only one study reported each outcome.
As with the main analysis, subgroup analysis of structured exercise interventions suggested a small but not clinically meaningful improvement in independence with ADL at hospital discharge in the intervention group, and a non‐meaningful effect on the number of falls, but the certainty of evidence was assessed as being low for both outcomes. The evidence for the effects of structured exercise on functional mobility and walking performance at hospital discharge, or medical deterioration during hospitalisation were of very low certainty. The structured exercise interventions had no effect on mortality during hospitalisation (moderate‐certainty evidence) or length of stay (low‐certainty evidence). There were insufficient data to perform meta‐analyses on the effect of structured exercise interventions on the incidence of delirium during hospitalisation (one study), quality of life at hospital discharge (one study), hospital readmissions (one study), or new institutionalisation at hospital discharge (no studies).
In the subgroup analyses of the nine studies investigating the effect of interventions that included progressive resistance training, there was no meaningful difference to the main overall analysis in the direction or size of the intervention effect for all outcomes.
Subgroup analyses separating studies that used sham‐control interventions and those that did not for the outcomes of independence with ADL at hospital discharge and functional mobility at hospital discharge, did not produce meaningfully different results or explain the observed heterogeneity in the main analyses.
Overall completeness and applicability of evidence
The main limitations in generalising the findings of the review are that they are limited to general medical populations and participants who were recruited in the first days of an acute hospital admission.
We conducted meta‐analyses for all major and minor outcomes other than participant global assessment of success and musculoskeletal injuries during hospitalisation. However, the certainty of evidence was generally low or very low, and further high‐quality research may not produce substantially different effects but could improve the certainty of the evidence. Inconsistencies in future analyses may be reduced if trials are conducted using consistent descriptions of sample characteristics, using the same outcome measures, such as a uniform measure of baseline level of function, and consistent reporting of exercise dose, intensity and adherence.
Certain outcomes should be interpreted with additional caveats. The effect of exercise interventions on hospital outcomes such as length of stay and readmissions may vary considerably depending on the context, in particular the health and social care systems in which they are conducted and the opportunities that exist within these systems to modify such outcomes. As such, the generalisability of the outcomes may be very limited. Walking performance at hospital discharge was treated as a continuous outcome and does not allow for differences in the number of participants in each arm who were able to walk. Finally, as noted in an individual participant data meta‐analysis using the data from de Morton 2007 and Jones 2006 (two studies included in this review), a ceiling effect in the Barthel Index is believed to limit the ability to accurately measure change in more functionally independent people (de Morton 2007b). This was also apparent in two further studies included in this review. Pedersen 2019 reported modified Barthel Index scores of 20/20 in both the intervention and control groups at discharge; Jeffs 2013 reported mean discharge scores in the Barthel Index of 95/100 in the intervention group and 96/100 in the control group. This may have reduced the size of the effect observed in the meta‐analysis of independence in ADL at hospital discharge.
Other than hospital readmissions, the time point used for the analysis of all outcomes was at hospital discharge. This time point was selected as the most likely time to observe a treatment effect should one exist. The results cannot be generalised to a longer follow‐up period.
One study is awaiting classification to be included in the next update of this review (Kojaie‐Bidgoli 2021). The study registration was identified in our literature search but was not completed at the time we submitted the review. It is believed that the data are unlikely to change the conclusions of this current review. We will update this review as more trials become available.
Quality of the evidence
Using the GRADE criteria, we downgraded the certainty of the evidence for all outcomes. This was predominantly due to risk of bias, inconsistency and imprecision. Inconsistency and heterogeneity did not appear to be explained by the combining of the subgroups of interventions in the meta‐analysis, as heterogeneity within the subgroups was highly prevalent. Exercise dose and adherence varied considerably and may explain some heterogeneity, but inconsistency in the reporting of the interventions and adherence prevents further inference. Imprecision was particularly prevalent in the binary outcomes due to low numbers of events and consequently, the meta‐analysis did not reach an optimal information size to provide confidence in the derived results.
The main difference in risk of bias by outcome was between 'soft' outcomes (i.e. required judgement by the assessor or participant or could be influenced by the assessor's behaviour) and 'hard' outcomes. Soft outcomes included: independence in ADL at discharge from hospital, functional mobility at discharge from hospital, incidence of delirium during hospitalisation, quality of life at discharge from hospital and walking performance at discharge from hospital. As only nine of 24 studies used blinded outcome assessors, these soft outcomes would result in a high risk of bias for measurement of the outcome in the studies with non‐blinded assessors. Consequently, the meta‐analyses of all five soft outcomes had a high risk of bias for 50% or more of the included studies, compared to the 'hard' outcomes such as falls during hospitalisation, medical deterioration during hospitalisation, mortality during hospitalisation, length of stay and hospital readmissions, which all had less than 30% of included studies with a judgement of being at high risk of bias. Typically, a lack of outcome‐assessor blinding for hard outcomes led to a judgement of 'some concerns' for the 'measurement of the outcome' domain. The GRADE rating of certainty was downgraded due to risk of bias for ADL at discharge from hospital, functional mobility at discharge from hospital and incidence of delirium during hospitalisation, and results need to be interpreted accordingly.
The other notable distinction in risk of bias by outcome was for walking performance. Five of six studies included in the analysis were at high risk of bias due to missing data. This reason for missing data was presumed or known to be dependent on the true value as participants were unable to walk.
Publication bias may explain the asymmetry seen in the funnel plot of length of hospital stay (Figure 5). Given the lack of a meaningful effect size, imprecision and inconsistency, it is unlikely that if publication bias did exist, it has had a meaningful effect on the findings.
The highest certainty of evidence was for the number of falls during hospitalisation (overall analysis), which was at moderate certainty. The outcome was downgraded for imprecision, as due to only 62 events an optimal information size is unlikely to have been met (Guyatt 2011), and the 95% CIs included both an appreciable harm and a benefit. The outcome was not downgraded further for imprecision as we made an a priori decision to downgrade two levels only for outcomes with fewer than 50 events. The outcome was not downgraded for risk of bias, as removal of two of nine studies assessed at high risk of bias did not meaningfully change the estimate of the effect, neither was it downgraded for imprecision (I2 = 0%). Further, publication bias was not assessed as there were fewer than 10 studies, and the outcome was not considered as indirect.
Potential biases in the review process
Adverse events during hospitalisation were initially planned to be reported as a combined outcome. As adverse events were expected to be defined differently by different studies, the plan was to include any and all data for mortality, falls, medical deterioration and musculoskeletal injury as a combined adverse‐event outcome. However, we changed this for three reasons.
-
Combining the outcomes might have led to double counting of participants who experienced an adverse event (e.g. if the same participant experienced both a fall and medical deterioration).
-
The estimate of baseline risk of experiencing an adverse event would have been very different depending on the number and type of adverse events reported by the different studies.
-
Interpretation of the analysis for the combined outcome would be very challenging due to the very different natures of the individual outcomes.
Therefore, we decided not to combine the outcomes, but to analyse each separately. However, this had the effect of reducing precision, since there were lower numbers of events for each outcome than would have been available if a combined outcome had been used.
We made the decision not to distinguish between studies that used a sham‐control intervention and those that did not. This decision introduced the potential for methodological diversity to increase the statistical heterogeneity in the analyses. We theorised that the large variation in usual care (i.e. the clinical diversity) would represent more interstudy variability in the control arm than the inclusion of a sham intervention. This appears to be supported by the lack of significant differences in the estimate of effect or observed heterogeneity in the post‐hoc subgroup analyses that we performed for the outcomes: independence with ADL at hospital discharge and functional mobility at hospital discharge.
Two review authors (JK, KJ) conducted included studies. They were not involved in the risk of bias assessments of their studies.
Agreements and disagreements with other studies or reviews
Six previous reviews have investigated exercise for acutely hospitalised older adults, albeit with differences in methodology and focus (de Morton 2007a; Kosse 2013; Martínez‐Velilla 2016; Kanach 2018; Valenzuela 2020; Reynolds 2021).
The original Cochrane Review concluded that "exercise sessions may not lead to any difference in function, harms, length of stay in hospital or whether they go home or to a nursing home or other care facility" (de Morton 2007a). However, it had more positive conclusions for exercise prescribed as a component of a multidisciplinary intervention, suggesting that although it 'may not lead to any difference in function or harms', it 'may slightly reduce the length of stay in hospital' (de Morton 2007a). The favourable findings regarding length of stay were based on a meta‐analysis of five studies, which estimated a mean reduction in length of stay of one day, which is more than the reduction of half a day observed in the rehabilitation‐related activities meta‐analysis in this review. This is partly explained by the exclusion of two of the five studies in the original review from this review because they included elective and surgical patients.
The narrative review of Kosse 2013 concluded that "at time of discharge, patients who had participated in a multidisciplinary programme or exercise programme improved more on physical functional tests […] In addition, multidisciplinary programmes reduced the length of hospital stay significantly." Their conclusion was based on two of nine studies showing effects in favour of an exercise intervention benefiting independence with ADL at discharge; three of seven studies showing effects in favour of an exercise intervention benefiting physical performance; and three of five studies showing effects in favour of a multidisciplinary intervention reducing length of hospital stay. The results of Kosse 2013 appear similar to this review, in that there is considerable uncertainty regarding the effect of exercise on functional and hospital outcomes.
The narrative review of Martínez‐Velilla 2016 found inconsistent results for functional improvement at the time of discharge from hospital, but did conclude that the mean length of stay was reduced for participants in multidisciplinary interventions. The narrative review of Kanach 2018 focused exclusively on structured exercise interventions, excluding exercise prescribed as a component of a multidisciplinary intervention. The authors concluded that they were able to add little to the conclusions of de Morton 2007a, in that they found evidence of the effectiveness of exercise interventions to be inconsistent. The findings of both Martínez‐Velilla 2016 and Kanach 2018 appear in keeping with this review.
The meta‐analysis of Valenzuela 2020 had similar aims to this review, though had stricter definitions of what constituted an exercise intervention, and included non‐general medical populations (e.g. respiratory and cardiac‐specific populations) and studies that randomised at any point during hospitalisation (as opposed to the criterion of this current review of requiring randomisation within the first 72 hours after hospital admission). Most results are in keeping with this review. The authors concluded that there was no evidence that, compared to usual care, exercise interventions reduced length of hospital stay, or affected the risk of readmission or mortality. They found that participants who received an exercise intervention were likely to have greater independence with ADL at discharge (SMD 0.64, 95% CI 0.19 to 1.08; 5 trials, 870 participants) and a higher level of physical performance at discharge (SMD 0.57, 95% CI 0.18 to 0.95; 7 trials, 1052 participants) than those who received usual care. The effect size estimates were more favourable to the exercise intervention than were the estimates in this review. Nevertheless, in keeping with our findings, the reported CIs include meaningful benefit and non‐meaningful benefit when analysed using the estimates of MCID applied in this review.
The review of Reynolds 2021 investigated the effect of unstructured mobility interventions in hospitalised older adults. With similar findings to this current review, the authors concluded that although the interventions may have improved physical activity and function during hospitalisation there was low certainty of evidence.
In summary, we do not believe that our findings are significantly different from other reviews, and although some individual studies show meaningful benefit, this does not translate to a high certainty of evidence when the studies are pooled. Investigating the causes of the inconsistencies observed in all of the above reviews could be a focus of future research.
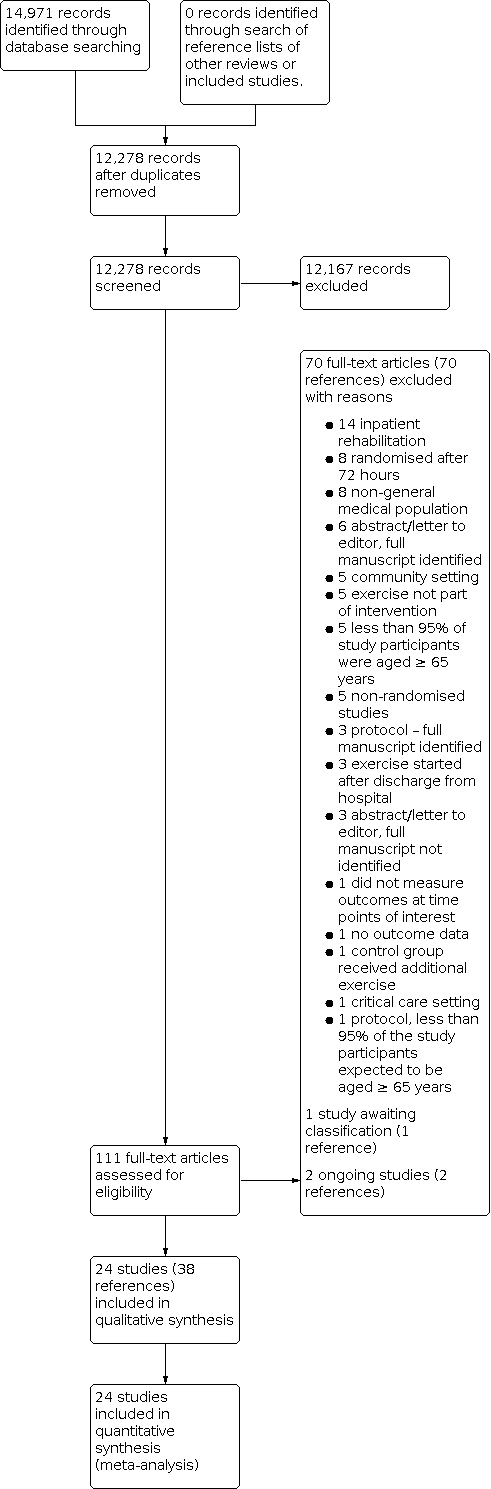
Study flow diagram

Funnel plot: independence with activities of daily living at discharge from hospital.

Funnel plot: medical deterioration during hospitalisation.

Funnel plot: mortality during hospitalisation.
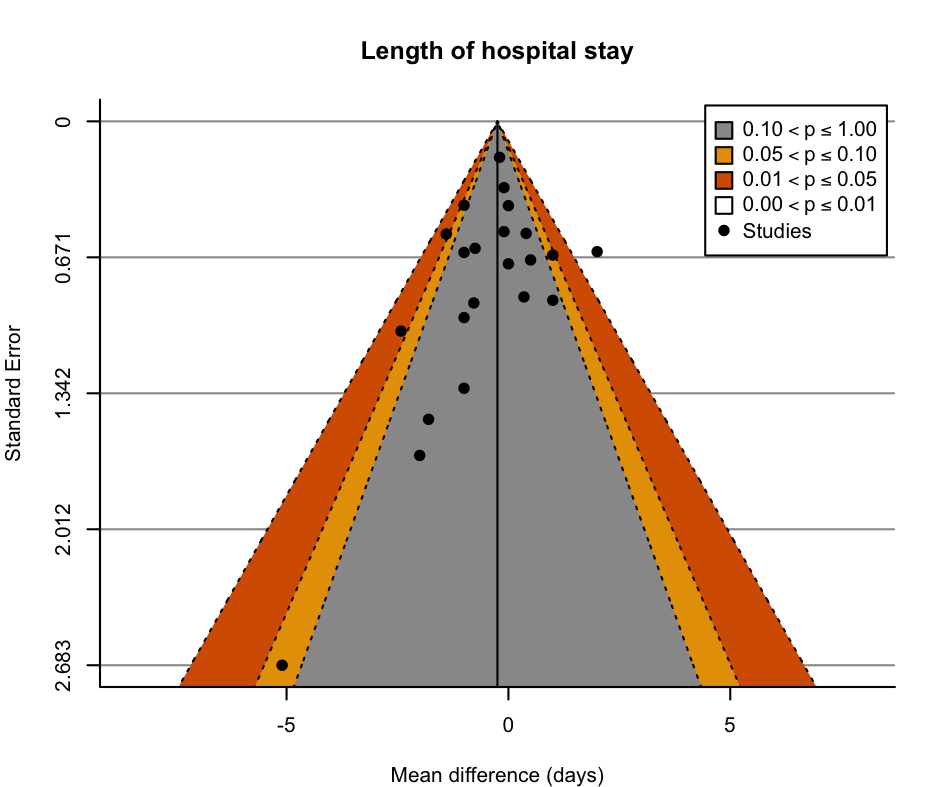
Funnel plot: length of hospital stay.

Funnel plot: readmissions to hospital.

Comparison 1: Major outcomes, Outcome 1: Functional ability: independence with activities of daily living at discharge from hospital

Comparison 1: Major outcomes, Outcome 2: Functional ability: functional mobility at discharge from hospital

Comparison 1: Major outcomes, Outcome 3: Functional ability: new incidence of delirium during hospitalisation

Comparison 1: Major outcomes, Outcome 4: Quality of life at discharge from hospital

Comparison 1: Major outcomes, Outcome 5: Falls during hospitalisation

Comparison 1: Major outcomes, Outcome 6: Medical deterioration during hospitalisation

Comparison 2: Minor outcomes, Outcome 1: Death during hospitalisation

Comparison 2: Minor outcomes, Outcome 2: Hospital length of stay (days)

Comparison 2: Minor outcomes, Outcome 3: New institutionalisation at hospital discharge

Comparison 2: Minor outcomes, Outcome 4: Hospital readmission

Comparison 2: Minor outcomes, Outcome 5: Walking performance at discharge from hospital
| Exercise interventions compared to usual care with or without sham interventions for acutely hospitalised older medical patients | ||||||
| Patient or population: acutely hospitalised medical patients | ||||||
| Outcomes | Anticipated absolute effects* (95% CI) | Relative effect | № of participants | Certainty of the evidence | Comments | |
|---|---|---|---|---|---|---|
| Risk with usual care ± sham interventions | Risk with exercise interventions | |||||
| Functional ability: independence with activities of daily living at discharge from hospital | The mean functional ability: independence with activities of daily living at discharge from hospital ranged from 42 to 96 points on the Barthel Indexa | MD 1.8 points on the Barthel Index higher | ‐ | 5174 | ⊕⊕⊝⊝ | Exercise interventions may result in little to no difference in independence with activities of daily living at discharge from hospital (SMD 0.09, 95% CI −0.02 to 0.19). A change of 11 points on the Barthel Index is thought to represent a minimally clinically important difference (MCID). |
| Functional ability: functional mobility at discharge from hospital | The mean functional ability: functional mobility at discharge from hospital ranged from 3.7 to 4.9 points on the Short Physical Performance Battery e | MD 0.78 points on the Short Physical Performance Battery higher | ‐ | 2369 | ⊕⊝⊝⊝ | The evidence is very uncertain about the effect of exercise on functional mobility at discharge from hospital (SMD 0.28, 95% CI −0.01 to 0.56). A change of 1.0 points on the Short Physical Performance Battery is thought to represent an MCID. |
| Functional ability: new incidence of delirium during hospitalisation | 81 per 1000 | 73 per 1000 | RR 0.90 | 2088 | ⊕⊝⊝⊝ | The evidence suggests that exercise results in little to no difference in incidence of delirium during hospitalisation. |
| Quality of life at discharge from hospital | The mean quality of life at discharge from hospital ranged from 48.7 to 64.7 points on the EQ‐5D VAS | MD 6.04 points on the EQ‐5D VAS higher | ‐ | 875 | ⊕⊕⊝⊝ | Exercise interventions may result in a small clinically unimportant improvement in quality of life at discharge from hospital. A change of 10 points on the EQ‐5D VAS is thought to represent a MCID. |
| Falls during hospitalisation | 34 per 1000 | 34 per 1000 | RR 0.99 | 1787 | ⊕⊕⊕⊝ | Exercise interventions probably result in little to no difference in falls during hospitalisation. |
| Medical deterioration during hospitalisation | 71 per 1000 | 73 per 1000 | RR 1.02 | 2730 | ⊕⊝⊝⊝ | Exercise interventions may have no effect on medical deterioration during hospitalisation. |
| Participant global assessment of success | Not pooled | Not pooled | Not pooled | (0 studies) | ‐ | No studies reported participant global assessment of success. |
| *The risk in the intervention group (and its 95% confidence interval) is based on the assumed risk in the comparison group and the relative effect of the intervention (and its 95% CI). | ||||||
| GRADE Working Group grades of evidence | ||||||
| See interactive version of this table: https://gdt.gradepro.org/presentations/#/isof/isof_question_revman_web_423027971375700878. | ||||||
| a Range based on the seven studies that measured activities of daily living using a Barthel Index (range 0–100). | ||||||
| Rehabilitation‐related activity interventions compared to usual care with or without sham interventions for acutely hospitalised older medical patients | ||||||
| Patient or population: acutely hospitalised older medical patients | ||||||
| Outcomes | Anticipated absolute effects* (95% CI) | Relative effect | № of participants | Certainty of the evidence | Comments | |
|---|---|---|---|---|---|---|
| Risk with usual care ± sham interventions | Risk with rehabilitation‐related activities | |||||
| Functional ability: independence with activities of daily living at discharge from hospital | The mean functional ability: independence with activities of daily living at discharge from hospital was 42 points on the Barthel Indexa | MD 0 points on the Barthel Index | ‐ | 2838 | ⊕⊕⊝⊝ | Rehabilitation‐related activities may result in little to no difference in independence with activities of daily living at discharge from hospital (standardised mean difference (SMD) 0.00, 95% CI −0.12 to 0.13). A change of 11 points on the Barthel Index is thought to represent a minimally clinically important difference (MCID). |
| Functional ability: functional mobility at discharge from hospital | The mean functional ability: functional mobility at discharge from hospital was 5 points on the Physical Performance and Mobility Examination | MD 0.14 points on the Physical Performance and Mobility Examination higher | ‐ | 975 | ‐ | Included only 1 study categorised as delivering a rehabilitation‐related activity intervention. The effect of rehabilitation‐related activities on functional mobility at discharge from hospital was very uncertain. |
| Incidence of new delirium during hospitalisation | 107 per 1000 | 92 per 1000 | RR 0.86 | 732 | ⊕⊝⊝⊝ | The evidence was very uncertain with regard to the effect of rehabilitation‐related activity interventions on incidence of delirium during hospitalisation. |
| Falls during hospitalisation | 24 per 1000 | 32 per 1000 | RR 1.33 | 250 | ‐ | Only 1 study categorised as delivering a rehabilitation‐related activity intervention was included. The effect of rehabilitation‐related activities on falls during hospitalisation was very uncertain. |
| Quality of life at discharge from hospital | The mean quality of life at discharge from hospital was 48.9 points on the EQ‐5D VAS | MD 2.2 points on the EQ‐5D VAS higher | ‐ | 350 | ‐ | Only 1 study reported a quality‐of‐life outcome at hospital discharge. The effect of rehabilitation‐related activities on the incidence of delirium during hospitalisation was very uncertain. |
| Medical deterioration during hospitalisation | 107 per 1000 | 92 per 1000 | RR 0.86 | 732 | ⊕⊝⊝⊝ | The evidence was very uncertain with regard to the effect of rehabilitation‐related activity interventions on incidence of medical deterioration during hospitalisation. |
| Participant global assessment of success | Not pooled | Not pooled | Not pooled | (0 studies) | ‐ | No studies reported participant global assessment of success. |
| *The risk in the intervention group (and its 95% confidence interval) is based on the assumed risk in the comparison group and the relative effect of the intervention (and its 95% CI). | ||||||
| GRADE Working Group grades of evidence | ||||||
| See interactive version of this table: https://gdt.gradepro.org/presentations/#/isof/isof_question_revman_web_423062461138566957. | ||||||
| a Based on the one study that measured activities of daily living using a Barthel Index (range of possible scores 0–100). | ||||||
| Structured exercise interventions compared to usual care with or without sham interventions for acutely hospitalised older medical patients | ||||||
| Patient or population: acutely hospitalised older medical patients | ||||||
| Outcomes | Anticipated absolute effects* (95% CI) | Relative effect | № of participants | Certainty of the evidence | Comments | |
|---|---|---|---|---|---|---|
| Risk with usual care ± sham interventions | Risk with structured exercise interventions | |||||
| Functional ability: independence with activities of daily living at discharge from hospital | The mean functional ability: independence with activities of daily living at discharge from hospital ranged from 55 to 56 points on the Barthel Indexa | MD 2.6 points on the Barthel Index higher | ‐ | 648 | ⊕⊕⊝⊝ | Structured exercise may result in little to no difference in independence with activities of daily living at discharge from hospital (standardised mean difference (SMD) 0.12, 95% CI −0.21 to 0.45). A change of 11 points on the Barthel Index is thought to represent a minimally clinically important difference (MCID). |
| Functional ability: functional mobility at discharge from hospital | The mean functional ability: functional mobility at discharge from hospital was 14.13 units on the Elderly Mobility Scalee | MD 1.79 units on the Elderly Mobility Scale higher | ‐ | 416 | ⊕⊝⊝⊝ | The evidence was very uncertain with regard to the effect of structured exercise programmes on functional mobility at discharge from hospital (SMD 0.30 95% CI, ‐0.96, 1.57). A change of 2 points on the Elderly Mobility Scale is thought to represent an MCID. |
| Functional ability: new incidence of delirium during hospitalisation | Only 1 study reported the outcome. The study found only 1 incidence of delirium in the intervention group and 0 in the control group. | 100 | ‐ | Included only 1 study categorised as delivering a structured exercise intervention. The effect of structured exercise on the incidence of new delirium during hospitalisation was very uncertain. | ||
| Quality of life at discharge from hospital | The mean quality of life at discharge from hospital was 64.74 points on the EQ‐5D VAS | MD 3.74 points on the EQ‐5D VAS higher | ‐ | 76 | ‐ | Only 1 study reported a quality‐of‐life outcome at hospital discharge. The effect of structured exercise interventions on quality of life at discharge from hospital was very uncertain. |
| Falls during hospitalisation | 40 per 1000 | 31 per 1000 | RR 0.76 | 542 | ⊕⊕⊝⊝ | Structured exercise interventions may result in little to no difference in falls during hospitalisation. |
| Medical deterioration during hospitalisation | 20 per 1000 | 51 per 1000 | RR 2.56 | 200 | ⊕⊝⊝⊝ | The evidence was very uncertain with regard to the effect of structured exercise programmes on medical deterioration during hospitalisation. |
| Participant global assessment of success | Not pooled | Not pooled | Not pooled | (0 studies) | ‐ | No studies reported participant global assessment of success. |
| *The risk in the intervention group (and its 95% confidence interval) is based on the assumed risk in the comparison group and the relative effect of the intervention (and its 95% CI). | ||||||
| GRADE Working Group grades of evidence | ||||||
| See interactive version of this table: https://gdt.gradepro.org/presentations/#/isof/isof_question_revman_web_423064120727928815. | ||||||
| a Range based on the two studies that measured activities of daily living using a Barthel Index (range of possible scores 0–100). | ||||||
| Progressive resistance exercise interventions compared to usual care with or without sham interventions for acutely hospitalised older medical patients | ||||||
| Patient or population: acutely hospitalised older medical patients | ||||||
| Outcomes | Anticipated absolute effects* (95% CI) | Relative effect | № of participants | Certainty of the evidence | Comments | |
|---|---|---|---|---|---|---|
| Risk with usual care ± sham interventions | Risk with progressive resistance exercise | |||||
| Functional ability: independence with activities of daily living at discharge from hospital | The mean functional ability: independence with activities of daily living at discharge from hospital ranged from 75 to 96 points on the Barthel Indexa | MD 0.14 points on the Barthel Index higher | ‐ | 1688 | ⊕⊕⊝⊝ | The evidence is classified as very uncertain with regard to the effect of progressive resistance exercise on independence with activities of daily living at discharge from hospital (SMD 0.14, 95% CI −0.05 to 0.32). A change of 11 points on the Barthel Index is thought to represent a minimally clinically important difference (MCID). |
| Functional ability: functional mobility at discharge from hospital | The mean functional ability: functional mobility at discharge from hospital ranged from 3.7 to 4.9 points on the Short Physical Performance Battery e | MD 0.24 points on the Short Physical Performance Battery higher | ‐ | 978 | ⊕⊝⊝⊝ | The evidence is classified as very uncertain with regard to the effect of progressive resistance exercise on functional mobility at discharge from hospital. (SMD 0.63, 95% CI‐0.28, 1.55). A change of 1.0 points on the Short Physical Performance Battery is thought to represent a MCID. |
| Functional ability: new incidence of delirium during hospitalisation | 71 per 1000 | 68 per 1000 | RR 0.96 | 1256 | ⊕⊕⊝⊝ | The evidence is classified as very uncertain with regard to the effect of progressive resistance exercise on incidence of delirium during hospitalisation. |
| Quality of life at discharge from hospital | The mean quality of life at discharge from hospital ranged from 57.5 to 62.4 points on the EQ‐5D VAS | MD 8.9 points on the EQ‐5D VAS higher | ‐ | 449 | ⊕⊕⊕⊝ | Progressive resistance exercise probably increases quality of life at discharge from hospital slightly. A change of 10 points on the EQ‐5D VAS is thought to represent a MCID. |
| Falls during hospitalisation | 34 per 1000 | 33 per 1000 | RR 0.96 | 995 | ⊕⊕⊝⊝ | Progressive resistance exercise may result in little to no difference in falls during hospitalisation. |
| Medical deterioration during hospitalisation | 62 per 1000 | 61 per 1000 | RR 0.99 | 1798 | ⊕⊝⊝⊝ | The evidence is classified as very uncertain with regard to the effect of progressive resistance exercise on medical deterioration during hospitalisation. |
| Participant global assessment of success | Not pooled | Not pooled | Not pooled | (0 studies) | ‐ | This outcome was not measured by any of the included studies. |
| *The risk in the intervention group (and its 95% confidence interval) is based on the assumed risk in the comparison group and the relative effect of the intervention (and its 95% CI). | ||||||
| GRADE Working Group grades of evidence | ||||||
| See interactive version of this table: https://gdt.gradepro.org/presentations/#/isof/isof_question_revman_web_423057317911555615. | ||||||
| a Range based on the four studies that measured activities of daily living using a Barthel Index (range of possible scores 0–100). | ||||||
| Study ID | Usual care setting and description | Control/sham intervention | Intervention group setting and description | Intervention subgroup category | Exercise component of intervention | Exercise dose prescription | Exercise intervention adherence |
|---|---|---|---|---|---|---|---|
| Acute geriatric unit. Geriatrician‐led care, physiotherapy requested by the geriatrician as required. | None. | Usual care conditions with additional occupational therapy interventions. | Rehabilitation‐related activities. | Occupational therapy including practice of activities of daily living. | 45 minutes, 5 times per week (Monday–Friday), for the duration of hospital admission. | Mean 5 sessions per participant. | |
| Medical ward. Internist‐led care, physiotherapy and occupational therapy not routinely available. No geriatrician. | None. | Acute geriatric ward. Care provided by both geriatricians and internists. Multidisciplinary team included physiotherapists, occupational therapists and dietitians. Emphasis on interdisciplinary care. | Rehabilitation‐related activities. | Exercise component not specifically described, intervention included early start of rehabilitation and routine physiotherapy and occupational therapy assessments. | No information. | No information. | |
| Acute care geriatric medicine unit. Physiotherapy provided from day 3 of admission, for 3 sessions per week until discharge. | None. | Usual care conditions with additional physiotherapy. | Structured exercise. | Early physiotherapy starting from day 1–2 of admission consisting of bed and standing exercises. | 30 minutes, 2 times per day, 5 times per week, until deemed clinically stable. | No information. | |
| Medical ward. Physicians could order physiotherapy services. | Usual care with daily 15‐ to 20‐minute visits from research assistants, up to twice daily, 7 days per week. Participants requested to keep a diary of their visitors. | Usual care conditions + mobility programme, and encouragement to increase time out of bed. | Structured exercise | Assisted/ supervised mobility programme with behavioural intervention to encourage additional physical activity outside the supervised intervention. | 15–20 minutes, up to twice per day, 7 days per week, for the duration of hospital admission. | 122/238 (51.3%) potential walks were completed. | |
| Usual care units. Not described.
| None. | Acute Care for Elders Unit Renovated ward with a physiotherapy room. Daily interdisciplinary team rounds provided by geriatrician medical director and geriatric clinical nurse specialist who created care plans. Care processes designed to promote functional independence. | Rehabilitation related activities. | Exercise component not specifically described, intervention included a mobility protocol and physiotherapy. | No information. | No information. | |
| Medical ward. Routine care, discharge planning and rehabilitation advice normally provided. | None. | Usual care with additional exercise. | Progressive resistance exercise. | With 72 hours of admission a care plan was produced by a nurse and physiotherapist which included: facilitated stretching, balance training, walking and strengthening exercises. | Walking for up to 15 minutes (duration of other exercise not specified), up to 2–4 times per week, for the duration of the hospital admission. | No information regarding in‐hospital adherence. | |
| Medical wards. Daily medical assessment, and allied health service on referral. | None. | Usual care with additional exercise. | Progressive resistance exercise. | Supervised strengthening and mobility exercise. | 20–30 minutes, twice per day, 5 days per week, for the duration of the hospital admission. | No information. | |
| Acute medical care unit. Care led by physicians specialising in internal medicine. Physiotherapy/ occupational therapy available for counselling only. | None. | Comprehensive geriatric assessment unit. Structured comprehensive geriatric assessment and care led by physicians specialising in internal medicine, family medicine, geriatrics or a combination. Unit staff included physiotherapists and occupational therapists. | Rehabilitation‐related activities. | Exercise component not specifically described, intervention included routine physiotherapy and occupational therapy. | No information. | No information. | |
| Medical or surgical floors. Description not provided other than 'standard medical care'. | None. | Senior Care Unit Functional assessment on admission, 3 clinical team meetings and 1 administration meeting weekly. Geriatric assessment team included nurse co‐ordinators and a physiotherapist. Emphasise interdisciplinary comprehensive geriatric assessment and intervention. | Rehabilitation‐related activities. | Exercise component not specifically described, intervention included routine functional assessment and physiotherapy. | No information. | No information. | |
| Geriatric unit. Care led by a geriatrician and provided by multidisciplinary team. | None. | Usual care with a walking intervention guided by geriatrician, delivered by nurses. | Structured exercise. | Assisted walking programme. | 20–30 minutes, daily, 5 days per week, for the duration of hospitalisation. | A mean time of 32 minutes per session (range 10–67), with a mean distance of 89 m (range 0–260). Mean number of intervention days for each participant was 5.8. | |
| Medical wards. Not described. | None. | Usual care conditions with mobility programme. | Structured exercise. | Assisted or supervised exercise, including balance, pedalling and mobility activities. | Up to 30 minutes per day, for the duration of hospital admission. | No information. | |
| Medical unit. Daily medical assessment and allied health professionals available via referral. | None. | Usual care conditions with additional exercise and orientation. | Progressive resistance exercise. | Progressive resistance exercise and mobility training. | 20–30 minutes per day (Monday–Friday), twice per day, for the duration of hospitalisation. | Median of 1.4 therapy sessions per day or 38 minutes per day (including weekends and routine therapy). This was equivalent to approximately 1.4 sessions or 42 minutes of additional therapy per weekday compared to the control group. | |
| General medical wards. Allied health interventions including physiotherapy available. | None. | Usual care conditions with additional exercise. | Progressive resistance exercise. | Individualised assisted or supervised strength, balance and functional exercises. | 30 minutes, twice per day for the duration of hospitalisation. | Median of 160 minutes (IQR 120–360) participating in the exercise intervention. | |
| Medical units. Physiotherapy available. | None. | Usual care conditions with additional assisted/ supervised walking. | Structured exercise. | Assisted or supervised walking programme. | Twice per day, 7 days per week, for 7 days. The distance walked was the maximum distance able to be comfortably walked as decided by that individual at that time. | No information. | |
| General medical unit. Care led by attending physician, nursing:participant ratio approximately 1:2. Access to hospital wide support services including physiotherapy. | None. | Acute Care for Elders Unit Care led by medical and nursing directors. Increased funded multidisciplinary team hours compared to usual care (including physiotherapy) with care protocols and ward environment designed to promote independence and early discharge. | Rehabilitation‐related activities | Exercise component not specifically described, intervention included a mobility protocol and physiotherapy. | No information. | No information. | |
| Acute Care for the Elderly Unit. Care led by a geriatrician with routine physiotherapy available when needed. | None | Usual care conditions with additional exercise. | Progressive resistance exercise | Supervised morning sessions included progressive resistance, balance and walking exercises. Unsupervised functional exercises in evenings. | 20 minutes, twice per day for 5–7 consecutive days (including weekends). | The mean number of completed morning sessions per participant was 5 (SD 1) and evening sessions was 4 (SD 1). Adherence to the intervention was 95.8% for the morning sessions (i.e. 806 successfully completed sessions of 841 total possible sessions) and 83.4% in the evening sessions (574 of 688 successfully completed sessions). | |
| All wards admitting older medical patients. Physiotherapy available to all participants (mean 3 sessions per week).
| Usual care with twice‐daily sessions (Monday–Friday) each 20–30 minutes of stretching and relaxation exercises in lying or sitting. Participants encouraged to talk about their condition and exercise, none given education, encouragement or assisted to exercise or walk more. | Usual care with additional exercise. | Progressive resistance exercise. | Assisted or supervised tailored strengthening, balance and gait exercises. | Up to 30 minutes, 2 times per day (Monday–Friday) for the duration of hospital admission. | 63/95 participants completed ≥ 75% of possible exercise sessions; 16/95 participants completed 50–74% of possible exercise sessions. 13/95 participants completed 25–49% of possible exercise sessions. 3/95 participants completed < 25% of possible exercise sessions. | |
| Acute medical wards for older people. Not described. | None. | Usual care with additional pedalling exercise. | Structured exercise. | Unsupervised pedalling exercise. | 5 minutes, 3 times per day. | The median number of revolutions cycled throughout the entire study period with the pedal exerciser was 152 (IQR 43.5–464.5) revolutions. The median time spent on the pedal exerciser was 5.08 (IQR 2.03–20.05) minutes across the whole study period. | |
| Medical ward. Multidisciplinary care included daily discussion of participant progress and discharge plan. Referrals made to physiotherapy or occupational therapy when needed. | None. | Medical ward Usual care with additional exercise and cognitive group therapy to encourage mobility. Intervention ward staff, participants and carers educated to encourage mobility and functional independence. | Progressive resistance exercise. | Graduated and tailored supervised exercise programme. | Twice per day for the duration of hospital admission. | 92% of participants in the intervention group received an exercise diary and made some record of exercise; 1/3 completed their diary every day. | |
| Acute care of older patient units Not described. | None. | Usual care with additional exercise. | Progressive resistance exercise. | Supervised walking and sit to stand exercises. | 1–3 sessions per day, with a total duration of approximately 20 minutes per day (Monday–Friday). | Participants performed a median of 3 training days (IQR 2) and 2 training sessions per day (IQR 2), with a mean total exercise time per day of 20 minutes (for each session, the median duration of the walking part was 5 minutes (IQR 4, range 0–10), and participants performed a mean of 9 (SD 6, range 0 to 30) sit‐to‐stands). | |
| Acute medical ward and internal medicine ward. National targets to assess function and nutrition and make an appropriate plan within 24–48 hours of admission. Rehabilitation often started during hospitalisation. | None. | Usual care with additional exercise and protein supplements. | Progressive resistance exercise. | Supervised progressive strength training based on sit to stand exercises. | 20 minutes daily (Monday–Friday) for the duration of hospital admission. | 78.8% of participants started the intervention 0–2 days after admission. Overall (during and after hospitalisation), 43% (18/42) of the participants randomised to the intervention group were very compliant with the intervention (80% of sessions performed with 2 sets of 8 repetitions). | |
| General medical elderly care wards. Therapy provided by ward occupational therapist and physiotherapist on weekdays only. | None. | General medical elderly care wards. Therapy provided by community therapy team including occupational therapist and physiotherapist 7 days per week if appropriate. | Rehabilitation related activities. | Exercise component not specifically described, intervention included daily rehabilitation with a physiotherapist or occupational therapist. | Daily, duration dependent on needs. | No information. | |
| General medical unit. Description not provided. | None. | General Medical Unit. In addition to usual care, a geriatric team consisting of a geriatrician, physiotherapist and liaison nurse provided care including daily physiotherapy. The aim of the team was to optimise function and mobility. | Rehabilitation related activities | Exercise component not specifically described, intervention included daily physiotherapy. | No information. | No information. | |
| Internal medical care unit. Care led by internist physician and had access to physical and occupational therapy by referral. | None. | Geriatric care unit. Care led by geriatrician and ward team included physiotherapist and occupational therapist. | Rehabilitation‐related activities | Exercise component not specifically described, intervention included a mobility protocol and physiotherapy. | No information. | No information. | |
| IQR: interquartile range; SD: standard deviation. | |||||||
| Outcome or subgroup title | No. of studies | No. of participants | Statistical method | Effect size |
| 1.1 Functional ability: independence with activities of daily living at discharge from hospital Show forest plot | 16 | 5174 | Std. Mean Difference (IV, Random, 95% CI) | 0.09 [‐0.02, 0.19] |
| 1.1.1 Rehabilitation‐related activities | 4 | 2838 | Std. Mean Difference (IV, Random, 95% CI) | 0.00 [‐0.12, 0.13] |
| 1.1.2 Structured exercise | 5 | 648 | Std. Mean Difference (IV, Random, 95% CI) | 0.12 [‐0.21, 0.45] |
| 1.1.3 Progressive resistance exercise | 7 | 1688 | Std. Mean Difference (IV, Random, 95% CI) | 0.14 [‐0.05, 0.32] |
| 1.2 Functional ability: functional mobility at discharge from hospital Show forest plot | 8 | 2369 | Mean Difference (IV, Random, 95% CI) | 0.54 [0.09, 0.99] |
| 1.2.1 Rehabilitation‐related activities | 1 | 975 | Mean Difference (IV, Random, 95% CI) | 0.60 [0.06, 1.14] |
| 1.2.2 Structured exercise | 2 | 416 | Mean Difference (IV, Random, 95% CI) | 0.30 [‐0.96, 1.57] |
| 1.2.3 Progressive resistance exercise | 5 | 978 | Mean Difference (IV, Random, 95% CI) | 0.63 [‐0.28, 1.55] |
| 1.3 Functional ability: new incidence of delirium during hospitalisation Show forest plot | 7 | 2088 | Risk Ratio (M‐H, Random, 95% CI) | 0.90 [0.58, 1.41] |
| 1.3.1 Rehabilitation‐related activities | 2 | 732 | Risk Ratio (M‐H, Random, 95% CI) | 0.86 [0.30, 2.50] |
| 1.3.2 Structured exercise | 1 | 100 | Risk Ratio (M‐H, Random, 95% CI) | 3.00 [0.13, 71.92] |
| 1.3.3 Progressive resistance exercise | 4 | 1256 | Risk Ratio (M‐H, Random, 95% CI) | 0.96 [0.55, 1.68] |
| 1.4 Quality of life at discharge from hospital Show forest plot | 4 | 875 | Mean Difference (IV, Random, 95% CI) | 6.04 [0.90, 11.18] |
| 1.4.1 Rehabilitation‐related activities | 1 | 350 | Mean Difference (IV, Random, 95% CI) | 2.20 [‐1.90, 6.30] |
| 1.4.2 Structured exercise | 1 | 76 | Mean Difference (IV, Random, 95% CI) | 3.74 [‐6.32, 13.80] |
| 1.4.3 Progressive resistance exercise | 2 | 449 | Mean Difference (IV, Random, 95% CI) | 8.90 [2.35, 15.45] |
| 1.5 Falls during hospitalisation Show forest plot | 9 | 1787 | Risk Ratio (IV, Random, 95% CI) | 0.99 [0.59, 1.65] |
| 1.5.1 Rehabilitation‐related activities | 1 | 250 | Risk Ratio (IV, Random, 95% CI) | 1.33 [0.30, 5.84] |
| 1.5.2 Structured exercise | 3 | 542 | Risk Ratio (IV, Random, 95% CI) | 0.76 [0.23, 2.53] |
| 1.5.3 Progressive resistance exercise | 5 | 995 | Risk Ratio (IV, Random, 95% CI) | 0.96 [0.48, 1.91] |
| 1.6 Medical deterioration during hospitalisation Show forest plot | 11 | 2730 | Risk Ratio (M‐H, Random, 95% CI) | 1.02 [0.62, 1.68] |
| 1.6.1 Rehabilitation‐related activities | 2 | 732 | Risk Ratio (M‐H, Random, 95% CI) | 0.86 [0.30, 2.50] |
| 1.6.2 Structured exercise | 2 | 200 | Risk Ratio (M‐H, Random, 95% CI) | 2.56 [0.48, 13.54] |
| 1.6.3 Progressive resistance exercise | 7 | 1798 | Risk Ratio (M‐H, Random, 95% CI) | 0.99 [0.52, 1.87] |
| Outcome or subgroup title | No. of studies | No. of participants | Statistical method | Effect size |
| 2.1 Death during hospitalisation Show forest plot | 20 | 6822 | Risk Ratio (M‐H, Random, 95% CI) | 0.98 [0.79, 1.22] |
| 2.1.1 Rehabilitation‐related activities | 7 | 3926 | Risk Ratio (M‐H, Random, 95% CI) | 1.03 [0.78, 1.34] |
| 2.1.2 Structured exercise | 5 | 740 | Risk Ratio (M‐H, Random, 95% CI) | 0.92 [0.54, 1.56] |
| 2.1.3 Progressive resistance exercise | 8 | 2156 | Risk Ratio (M‐H, Random, 95% CI) | 0.89 [0.54, 1.48] |
| 2.2 Hospital length of stay (days) Show forest plot | 22 | 7182 | Mean Difference (IV, Random, 95% CI) | ‐0.25 [‐0.62, 0.12] |
| 2.2.1 Rehabilitation‐related activities | 9 | 4388 | Mean Difference (IV, Random, 95% CI) | ‐0.55 [‐1.42, 0.32] |
| 2.2.2 Structured exercise | 4 | 635 | Mean Difference (IV, Random, 95% CI) | ‐0.02 [‐0.93, 0.89] |
| 2.2.3 Progressive resistance exercise | 9 | 2159 | Mean Difference (IV, Random, 95% CI) | ‐0.24 [‐0.63, 0.16] |
| 2.3 New institutionalisation at hospital discharge Show forest plot | 5 | 2364 | Risk Ratio (M‐H, Random, 95% CI) | 0.91 [0.74, 1.12] |
| 2.3.1 Rehabilitation‐related activities | 3 | 2004 | Risk Ratio (M‐H, Random, 95% CI) | 0.92 [0.74, 1.13] |
| 2.3.2 Progressive resistance exercise | 2 | 360 | Risk Ratio (M‐H, Random, 95% CI) | 0.86 [0.37, 2.01] |
| 2.4 Hospital readmission Show forest plot | 14 | 4689 | Risk Ratio (M‐H, Random, 95% CI) | 0.95 [0.81, 1.11] |
| 2.4.1 Rehabilitation‐related activities | 6 | 2960 | Risk Ratio (M‐H, Random, 95% CI) | 0.95 [0.78, 1.16] |
| 2.4.2 Structured exercise | 1 | 339 | Risk Ratio (M‐H, Random, 95% CI) | 0.78 [0.52, 1.18] |
| 2.4.3 Progressive resistance exercise | 7 | 1390 | Risk Ratio (M‐H, Random, 95% CI) | 0.99 [0.72, 1.36] |
| 2.5 Walking performance at discharge from hospital Show forest plot | 6 | 682 | Std. Mean Difference (IV, Random, 95% CI) | ‐0.13 [‐0.35, 0.09] |
| 2.5.1 Rehabilitation‐related activities | 1 | 273 | Std. Mean Difference (IV, Random, 95% CI) | ‐0.29 [‐0.53, ‐0.05] |
| 2.5.2 Structured exercise | 2 | 131 | Std. Mean Difference (IV, Random, 95% CI) | ‐0.32 [‐0.80, 0.16] |
| 2.5.3 Progressive resistance exercise | 3 | 278 | Std. Mean Difference (IV, Random, 95% CI) | 0.09 [‐0.15, 0.33] |
| Bias | ||||||||||||
|---|---|---|---|---|---|---|---|---|---|---|---|---|
| Study | Randomisation process | Deviations from intended interventions | Missing outcome data | Measurement of the outcome | Selection of the reported results | Overall | ||||||
| Subgroup 1.1.1 Rehabilitation‐related activities | ||||||||||||
| Abizanda 2011 |  | | | | | | ||||||
| Allocation sequence was random (computer generated random numbers). Allocation occurred after enrolment by an investigator not involved in the participants' clinical management. Higher number of participants admitted with a stroke in the intervention group (39 vs. 16), in addition, the 'Others' subgroup the Barthel index is higher in the control group than the intervention group (29.1 vs. 23.1). This is thought to be compatible with chance. | ||||||||||||
| Its assumed participants and the Occupational Therapist (OT) delivering the intervention were aware of the assigned intervention allocation. All participants received their allocated intervention. Therefore, even though intention to treat analysis not specified, analysis deemed appropriate. | ||||||||||||
| Given the nature of this population (older adults during and after acute hospitalisation) we considered a threshold of 90% of participants with data as sufficient. We felt this would be consistent with measurements outside of a trial context. When accounting for mortality, 95% and 94% assessed at discharge in intervention and control arms respectively. | ||||||||||||
| The use of the Barthel Index to measure independence with ADLs is considered appropriate, and there were no differences in measurement or ascertainment of the outcomes between groups. The OT assessor was blinded. | ||||||||||||
| The data analyst was blinded, and followed a pre‐specified statistical plan. It is not thought that results were from multiple outcome measurements or multiple analyses. | ||||||||||||
| The study is judged to be at low risk of bias in all domains for this outcome. | ||||||||||||
| Counsell 2000 | |  | |  | | | ||||||
| Allocation sequence was random (computer generated random numbers) and sequence concealed (opaque sealed envelope). Participant characteristics were balanced. | ||||||||||||
| Participants and those delivering the interventions were aware of intervention assignments. Seventy‐nine participants were not admitted to the unit to which they were assigned. Deviations may have affected the effect estimate, however they were well‐balanced between groups. Intention to treat analysis was used. | ||||||||||||
| Functional data was obtained in 1476 of 1483 of surviving patients (99.5%) at discharge. | ||||||||||||
| The Katz ADL score is considered appropriate, and there were no differences in the measurement or ascertainment between groups. The assessors were not blinded, and it was therefore considered likely that knowledge of the intervention could influence the outcome, given the likely strong belief in the benefits of the intervention ward. | ||||||||||||
| A pre‐specified statistical plan was not found, but it is not thought that the results were from multiple outcome measures or multiple analyses. | ||||||||||||
| The study is judged to be at high risk of bias due to measurement of the outcome. | ||||||||||||
| Ekerstad 2017 | | | | | | | ||||||
| Randomisation was based on the availability of beds, and there was no allocation concealment as participants were allocated a ward prior to enrolment. Participant characteristics appeared balanced. | ||||||||||||
| Participants and clinicians delivering care were aware of treatment assignments. There was no evidence of deviations from intended interventions and intention to treat analysis was used. | ||||||||||||
| No missing data at hospital discharge. | ||||||||||||
| The ADL Staircase is considered appropriate, and there were no differences in the measurement or ascertainment between groups. The assessors were not blinded, and it was therefore considered likely that knowledge of the intervention could influence the outcome, given the likely strong belief in the benefits of the intervention ward. | ||||||||||||
| A detailed pre‐specified statistical plan was not found, but it is not thought that the results were from multiple outcome measures or multiple analyses. | ||||||||||||
| The study is judged to be at high risk of bias due to bias in the measurement of the outcome and bias arising from the randomisation process. | ||||||||||||
| Landefeld 1995 | | | | | | | ||||||
| Allocation sequence was random (computer generated random numbers) and balanced participant characteristics, but no information was provided regarding allocation concealment. | ||||||||||||
| It is assumed participants and clinicians were aware of the treatment assignments. There was no evidence of deviations from the assigned interventions and evidence of an intention to treat approach being used for analysis. | ||||||||||||
| Accounting for mortality (24 died in each arm) all participants had outcome data at discharge. | ||||||||||||
| The Katz ADL score is considered appropriate, and there were no differences in the measurement or ascertainment between groups. The assessors were not blinded, and it was therefore considered likely that knowledge of the intervention could influence the outcome, given the likely strong belief in the benefits of the intervention ward. | ||||||||||||
| A pre‐specified statistical plan was not found, but it is not thought that the results were from multiple outcome measures or multiple analyses. | ||||||||||||
| The study is judged to be at high risk of bias in measurement of the outcome for this outcome. | ||||||||||||
| Subgroup 1.1.2 Structured exercise | ||||||||||||
| Blanc‐Bisson 2008 | | | | | | | ||||||
| No information provided on randomisation methods or sequence concealment other than to say participants were randomised. Differences in participant characteristics appear compatible with chance. | ||||||||||||
| It is assumed that participants and those delivering the interventions were aware of intervention assignments. However, all participants received their intended intervention and intention to treat was specified in the analysis. | ||||||||||||
| When accounting for mortality, data was available for only 72% and 81% of intervention and control group respectively at T1. Some missing data is likely to be dependent on its true value, as the main reason for missing data was adverse events, and we consider participants who experience adverse events to be more likely to have a lower ADL score. | ||||||||||||
| The Katz ADL score is considered appropriate, and there were no differences in the measurement or ascertainment between groups. The assessors were not blinded, and it was therefore considered likely that knowledge of the intervention could influence the outcome, given the likely strong belief in the benefits of the intervention ward. | ||||||||||||
| A pre‐specified statistical plan was not found, but it is not thought that the results were from multiple outcome measures or multiple analyses. | ||||||||||||
| The study is judged to be at high risk of bias due to missing outcome data and measurement of the outcome. | ||||||||||||
| Brown 2016 | | | | | | | ||||||
| No description of randomisation sequence generation, but the paper describes a block randomisation strategy and sequence concealed (sealed envelopes). The patient characteristics appear well‐balanced between groups. | ||||||||||||
| We assume both participants and those delivering the interventions were aware of intervention assignments. 6 participants did not receive allocated intervention, this is considered to be consistent with what could occur outside the trial context, and intention to treat analysis was used. | ||||||||||||
| No missing data. | ||||||||||||
| The Katz ADL score is considered appropriate, and there were no differences in the measurement or ascertainment between groups. The assessors were blinded. | ||||||||||||
| The study protocol details statistical analysis plan which is in accordance with results presented, and it is not thought that the results were from multiple outcome measures or multiple analyses. | ||||||||||||
| The study is judged to be at low risk of bias in all domains for this outcome. | ||||||||||||
| Gazineo 2021 | | | | | | | ||||||
| Allocation sequence was random (generated using an online system) and the allocation sequence was concealed until participants were enrolled (opaque concealed and sealed envelopes). Participant characteristics were well‐balanced. | ||||||||||||
| Participants and those delivering the interventions were aware of intervention allocations. There was no evidence of deviations from the intended interventions and intention to treat analysis used. | ||||||||||||
| No missing data after accounting for mortality. | ||||||||||||
| The Barthel Index is considered appropriate, and there were no differences in the measurement or ascertainment between groups. The assessors were not blinded, and it was therefore considered likely that knowledge of the intervention could influence the outcome, given the likely strong belief in the benefits of the intervention ward. | ||||||||||||
| A pre‐specified statistical plan was not found, but it is not thought that the results were from multiple outcome measures or multiple analyses. | ||||||||||||
| The study is judged to be at high risk of bias due to measurement of the outcome. | ||||||||||||
| Hu 2020 | | | | | | | ||||||
| Allocation sequence was random (computer generated random numbers) and sequence concealed (blinded project coordinator allocated participants). Participant characteristics were balanced. | ||||||||||||
| Participants and those delivering the interventions were aware of intervention allocations. There was no evidence of deviations from the intended interventions and as such it is presumed intention to treat analysis was used. | ||||||||||||
| At discharge data was available for 76% of reablement group, (78% of reminder group) and 80% of the control group. Only participants who had complete data (i.e. data collected at baseline, discharge and follow‐up) had outcomes reported. Although missing data is well‐balanced between all three groups, it is considered likely that reason for missing data is related to its true value. | ||||||||||||
| The Katz ADL score is considered appropriate, and there were no differences in the measurement or ascertainment between groups. The assessors were blinded. | ||||||||||||
| A pre‐specified statistical plan was not found, but it is not thought that the results were from multiple outcome measures or multiple analyses. | ||||||||||||
| The study is judged to be at high risk of bias due to missing outcome data. | ||||||||||||
| Killey 2006 | | | | | | | ||||||
| Allocation not random and sequence predictable as based on alternation. There is limited data on participant characteristics, but available data suggests balanced characteristics between groups. | ||||||||||||
| Participants and those delivering the interventions were aware of intervention allocations. There was no evidence of deviations from the intended interventions. Per‐protocol analysis appears to have been used. 2 participants in the intervention group were excluded from analysis as they completed less than 70% of their walks. The 2 participants that were excluded accounted for 7% of the remaining sample, it is therefore considered that there was potential for a significant impact on the results. | ||||||||||||
| Only 71% of intervention and 74% of control group had outcome data. A significant proportion of missing data was related to early discharge from hospital. These participants could be expected to have a higher functional level than those who remained in hospital. However, the missing data was well‐balanced between the two groups. | ||||||||||||
| The Barthel Index is considered appropriate, and there were no differences in the measurement or ascertainment between groups. The assessors were not blinded, and it was therefore considered likely that knowledge of the intervention could influence the outcome, given the likely strong belief in the benefits of the intervention ward. | ||||||||||||
| A pre‐specified statistical plan was not found, but it is not thought that the results were from multiple outcome measures or multiple analyses. | ||||||||||||
| The study is judged to be at high risk of bias in three domains for this outcome. | ||||||||||||
| Subgroup 1.1.3 Progressive resistance exercise | ||||||||||||
| de Morton 2007 | | | | | | | ||||||
| Allocation of wards was random (coin toss) and the allocating officer unaware of study. Baseline differences between groups were thought to be compatible with chance. | ||||||||||||
| Participants and clinicians delivering care were believed to be aware of treatment assignments. There was no evidence of deviations from intended interventions and intention to treat analysis was used. | ||||||||||||
| After accounting for mortality, discharge Barthel Index (BI) scores were available for 75% in intervention group and 70% in control group. Although it is feasible that following discharge patients with lower levels of functional ability are more likely to be missing, we do not think this applies in this situation as assessment prior to discharge. We do not see a situation where it would be more likely to miss an assessment due to high/low level of disability at discharge. | ||||||||||||
| The use of the BI to measure independence with ADLs is considered appropriate, and there were no differences in the measurement or ascertainment between groups. The assessors were not blinded, and it is considered likely that knowledge of the intervention could influence the outcome, given the likely strong belief in the benefits of the intervention. | ||||||||||||
| A pre‐specified statistical plan was not found, but it is not thought that the results were from multiple outcome measures or multiple analyses. | ||||||||||||
| The study is judged to be at high risk of bias in measurement of the outcome. | ||||||||||||
| Jeffs 2013 | | | | | | | ||||||
| Sequence concealment was achieved via a member of the research team not involved in recruitment and using sealed envelopes. There was no information regarding method of generating random sequence, other than to say that there was randomisation, given details of allocation concealment, assumption made that appropriate method used. Patient characteristics between groups appear well‐balanced. | ||||||||||||
| Participants and those delivering the interventions were likely to be aware of intervention allocations. One participant was not allocated to a group due to an administrative error and 35 participants did not receive the intervention as planned (17 in the intervention group). This is thought to be consistent with what could occur outside of the trial context. Intention to treat analysis was used. | ||||||||||||
| No missing data. | ||||||||||||
| The Barthel Index is considered appropriate, and there were no differences in the measurement or ascertainment between groups. The assessors were blinded. | ||||||||||||
| A pre‐specified statistical plan was not found, but it is not thought that the results were from multiple outcome measures or multiple analyses. | ||||||||||||
| The study is judged to raise some bias concerns in selection of the reported result. | ||||||||||||
| Jones 2006 | | | | | | | ||||||
| Allocation sequence was random (computer generated random numbers). Sequence allocation was not concealed, but performed by a member of staff independent of the enrolment procedures. ). Participant characteristics were balanced between groups and differences compatible with chance. | ||||||||||||
| It is assumed that both participants and clinicians delivering care were aware of assigned interventions. There is no evidence of deviations from intended interventions and intention to treat analysis used. | ||||||||||||
| Admission and discharge modified Barthel Index (mBI) scores were available for 78.8% of patients (126/160). Although we felt that patients with lower levels of functional ability were more likely to be missing at follow‐up, we do not think this applies in this situation as assessment was prior to discharge. We do not see a situation where it would be more likely to miss an assessment due to high/low level of disability at discharge | ||||||||||||
| The use of the mBI to measure independence with ADLs is considered appropriate, and there were no differences in the measurement or ascertainment between groups. The assessors were blinded. | ||||||||||||
| A pre‐specified statistical plan was not found, but it is not thought that the results were from multiple outcome measures or multiple analyses. | ||||||||||||
| The study is judged to raise some concerns due to missing outcome data and in selection of the reported results. | ||||||||||||
| Martinez‐Velilla 2019 | | | | | | | ||||||
| Allocation sequence was random (www.randomizer.org) and personal communication with author confirms allocation concealment. Baseline differences between groups are thought to be compatible with chance. | ||||||||||||
| Both participants and clinicians delivering care were aware of assigned interventions. There is no evidence of deviations from intended interventions and intention to treat analysis used. | ||||||||||||
| Assuming that those that discontinued the study did not provide Barthel Index (BI) outcome data, and accounting for mortality, 80% of intervention group and 78% of control group had outcome data. Although there were participants who discontinued the study due to medical deterioration, which could have and is considered likely to have biased the results (i.e. medical deterioration being associated with poor functional outcomes), the numbers were relatively low (only 6% of the sample) and were well‐balanced between groups. We therefore feel that this was unlikely to bias the results. | ||||||||||||
| The use of the BI to measure independence with ADLs is considered appropriate, and there were no differences in the measurement or ascertainment between groups. The assessors were blinded. | ||||||||||||
| The trial protocol reflects the analyses as that were conducted, and it is not thought that the results were from multiple outcome measures or multiple analyses. | ||||||||||||
| The study is judged to raise some concerns due to missing outcome data. | ||||||||||||
| Mudge 2008 | | | | | | | ||||||
| Pseudo‐randomisation, allocation was based on admitting unit and bed availability, and admitting unit was determined by a rotating roster. No evidence of baseline differences in patient characteristics other than those thought to be compatible with chance. | ||||||||||||
| Both participants and clinicians delivering care were aware of assigned interventions. There is no evidence of deviations from intended interventions and intention to treat analysis used. | ||||||||||||
| No missing data. | ||||||||||||
| The use of the modified Barthel Index to measure independence with ADLs is considered appropriate, and there were no differences in the measurement or ascertainment between groups. The assessors were blinded. | ||||||||||||
| A pre‐specified statistical plan was not found, but it is not thought that the results were from multiple outcome measures or multiple analyses. | ||||||||||||
| The study is judged to be at high risk of bias due to the randomisation process. | ||||||||||||
| Ortiz‐Alonso 2020 | | | | | | | ||||||
| The allocation sequence was based on recruitment blocks of 4‐8 weeks. Activity of daily living (ADL) scores at baseline and admission were significantly lower in the intervention group than the control group, this is thought to be an important prognostic factor and therefore a concern regarding the randomisation process. | ||||||||||||
| Methods were designed to blind participants from group assignments however due to the nature of the intervention and lack of sham intervention the success of this blinding is felt unlikely. Ward staff and research staff were not blinded to the participant's assigned intervention. There were no deviations from the intended interventions due to trial context described and although intention to treat analysis not specified given the lack of deviations it is assumed. | ||||||||||||
| After adjusting for mortality 97% in intervention group and 97% in control group had outcome data. | ||||||||||||
| The Katz ADL score is considered appropriate, and there were no differences in the measurement or ascertainment between groups. The assessors were not blinded, and it was therefore considered likely that knowledge of the intervention could influence the outcome, given the likely strong belief in the benefits of the intervention ward. | ||||||||||||
| Analysis reflects plan in trial registration and study protocol, and results are not thought to be from multiple outcome measures or multiple analyses. | ||||||||||||
| The study is judged to be at high risk of bias due to the randomisation process and measurement of the outcome. | ||||||||||||
| Pedersen 2019 | | | | | | | ||||||
| Allocation sequence was random (computer‐generated block randomisation), and allocation sequence concealed from the investigators. Participant characteristics were well‐balanced between groups. | ||||||||||||
| Participants and clinicians were aware of the treatment assignments. There was no evidence of deviations from the assigned interventions and an intention to treat approach was used for analysis. | ||||||||||||
| When accounting for mortality only 93% of participants in intervention group and 67% in control group completed measures at discharge. The difference in the proportion of missing data, and that the assessments were carried out home after discharge, it was judged likely that the reasons for missing data may have depended on its true value. | ||||||||||||
| The Barthel Index is considered appropriate, and there were no differences in the measurement or ascertainment between groups. The assessors were blinded. | ||||||||||||
| The analysis is in accordance with a pre‐specified analysis in a published protocol, and results are not thought to be from multiple outcome measures or multiple analyses. | ||||||||||||
| The study is judged to be at high risk of bias due to missing outcome data. | ||||||||||||
| Bias | ||||||||||||
|---|---|---|---|---|---|---|---|---|---|---|---|---|
| Study | Randomisation process | Deviations from intended interventions | Missing outcome data | Measurement of the outcome | Selection of the reported results | Overall | ||||||
| Subgroup 1.2.1 Rehabilitation‐related activities | ||||||||||||
| Counsell 2000 | | | | | | | ||||||
| Allocation sequence was random (computer generated random numbers) and sequence concealed (opaque sealed envelope). Participant characteristics were balanced. | ||||||||||||
| Participants and those delivering the interventions were aware of intervention assignments. Seventy‐nine participants were not admitted to the unit to which they were assigned. Deviations may have affected the effect estimate, however the were well‐balanced between groups. Intention to treat analysis was used. | ||||||||||||
| Functional data was obtained in 1476 of 1483 of surviving patients (99.5%) at discharge. | ||||||||||||
| The Physical Performance and Mobility Examination (PPME) is considered appropriate, and there were no differences in the measurement or ascertainment between groups. The assessors were not blinded, and it was therefore considered likely that knowledge of the intervention could influence the outcome, given the likely strong belief in the benefits of the intervention ward. | ||||||||||||
| A pre‐specified statistical plan was not found, but it is not thought that the results were from multiple outcome measures or multiple analyses. | ||||||||||||
| The study is judged to be at high risk of bias due to measurement of the outcome. | ||||||||||||
| Subgroup 1.2.2 Structured exercise | ||||||||||||
| Gazineo 2021 | | | | | | | ||||||
| Allocation sequence was random (generated using an online system) and the allocation sequence was concealed until participants were enrolled (opaque concealed and sealed envelopes). Participant characteristics were well‐balanced. | ||||||||||||
| Participants and those delivering the interventions were aware of intervention allocations. There was no evidence of deviations from the intended interventions and intention to treat analysis used. | ||||||||||||
| No missing data after accounting for mortality. | ||||||||||||
| The Barden Activity Subscale to measure functional mobility is considered appropriate, and there were no differences in the measurement or ascertainment between groups. The assessors were not blinded, and it was therefore considered likely that knowledge of the intervention could influence the outcome, given the likely strong belief in the benefits of the intervention ward. | ||||||||||||
| A pre‐specified statistical plan was not found, but it is not thought that the results were from multiple outcome measures or multiple analyses. | ||||||||||||
| The study is judged to be at high risk of bias due to measurement of the outcome. | ||||||||||||
| McGowan 2018a | | | | | | | ||||||
| Allocation sequence was random (www.randomization.com) and the allocation sequence was only known by the chief investigator who was not involved with screening patients. Baseline differences between groups are thought to be compatible with chance. | ||||||||||||
| Both participants and clinicians delivering care were aware of assigned interventions. There is no evidence of deviations from intended interventions and intention to treat analysis not explicitly stated, but all participants appear to have been analysed in the group to which they were randomised. | ||||||||||||
| 96% of participants had complete data sets. | ||||||||||||
| The use of the Elderly Mobility Scale (EMS) to measure functional mobility is considered appropriate, and there were no differences in the measurement or ascertainment between groups. The assessors were not blinded, and it is considered likely that knowledge of the intervention could influence the outcome, given the likely strong belief in the benefits of the intervention. | ||||||||||||
| The trial protocol and registration reflects the analyses as that were conducted, and it is not thought that the results were from multiple outcome measures or multiple analyses. | ||||||||||||
| The study is judged to raise some concerns due to the measurement of the outcome. | ||||||||||||
| Subgroup 1.2.3 Progressive resistance exercise | ||||||||||||
| de Morton 2007 | | | | | | | ||||||
| Allocation of wards was random (coin toss) and the allocating officer unaware of study. Baseline differences between groups were thought to be compatible with chance. | ||||||||||||
| Participants and clinicians delivering care were believed to be aware of treatment assignments. There was no evidence of deviations from intended interventions and intention to treat analysis was used. | ||||||||||||
| After accounting for mortality, discharge Functional Ambulation Classification (FAC) scores were available for 75% in intervention group and 70% in control group. Although it is feasible that following discharge patients with lower levels of functional ability are more likely to be missing, we do not think this applies in this situation as assessment prior to discharge. We do not see a situation where it would be more likely to miss an assessment due to high/low level of disability at discharge. | ||||||||||||
| The use of the FAC to measure functional mobility is considered appropriate, and there were no differences in the measurement or ascertainment between groups. The assessors were not blinded, and it is considered likely that knowledge of the intervention could influence the outcome, given the likely strong belief in the benefits of the intervention. | ||||||||||||
| A pre‐specified statistical plan was not found, but it is not thought that the results were from multiple outcome measures or multiple analyses. | ||||||||||||
| The study is judged to be at high risk of bias in measurement of the outcome. | ||||||||||||
| Martinez‐Velilla 2019 | | | | | | | ||||||
| Allocation sequence was random (www.randomizer.org) and personal communication with author confirms allocation concealment. Baseline differences between groups are thought to be compatible with chance. | ||||||||||||
| Both participants and clinicians delivering care were aware of assigned interventions. There is no evidence of deviations from intended interventions and intention to treat analysis used. | ||||||||||||
| Assuming that those that discontinued the study did not provide Short Physical Performance Battery (SPPB) outcome data, and accounting for mortality, 83% of intervention group and 86% of control group had outcome data. Although there were participants who discontinued the study due to medical deterioration, which could have and is considered likely to have biased the results (i.e. medical deterioration being associated with poor functional outcomes), the numbers were relatively low (only 6% of the sample) and were well‐balanced between groups. We therefore feel that this was unlikely to bias the results. | ||||||||||||
| The use of the SPPB to measure functional mobility is considered appropriate, and there were no differences in the measurement or ascertainment between groups. The assessors were blinded. | ||||||||||||
| The trial protocol reflects the analyses as that were conducted, and it is not thought that the results were from multiple outcome measures or multiple analyses. | ||||||||||||
| The study is judged to raise some concerns due to missing outcome data. | ||||||||||||
| McCullagh 2020 | | | | | | | ||||||
| Allocation sequence was random (computer‐generated) and allocation sequence was concealed. Baseline differences are thought to be compatible with chance. | ||||||||||||
| Both participants and clinicians delivering care were aware of assigned interventions. There is no evidence of deviations from intended interventions and intention to treat analysis used. | ||||||||||||
| 90% of intervention group and 94% of the control group had Short Physical Performance Battery (SPPB) data. Given the nature of this population (older adults during and after acute hospitalisation) we considered a threshold of 90% of participants with data as sufficient. | ||||||||||||
| The use of SPPB to measure functional mobility is considered appropriate, and there were no differences in the measurement or ascertainment between groups. The assessors were blinded. | ||||||||||||
| The trial protocol reflects the analyses as that were conducted, and it is not thought that the results were from multiple outcome measures or multiple analyses. | ||||||||||||
| The study is judged to be at low risk of bias for all domains for this outcome. | ||||||||||||
| Ortiz‐Alonso 2020 | | | | | | | ||||||
| The allocation sequence was based on recruitment blocks of 4‐8 weeks. Activity of daily living (ADL) scores at baseline and admission were significantly lower in the intervention group than the control group, this is thought to be an important prognostic factor and therefore a concern regarding the randomisation process. | ||||||||||||
| Methods were designed to blind participants from group assignments however due to the nature of the intervention and lack of sham intervention the success of this blinding is felt unlikely. Ward staff and research staff were not blinded to the participant's assigned intervention. There were no deviations from the intended interventions due to trial context described and although intention to treat analysis not specified given the lack of deviations it is assumed. | ||||||||||||
| After adjusting for mortality 97% in intervention group and 97% in control group had outcome data. | ||||||||||||
| The use of the Short Physical Performance Battery (SPPB) for measuring functional mobility is considered appropriate, and there were no differences in the measurement or ascertainment between groups. The assessors were not blinded, and it was therefore considered likely that knowledge of the intervention could influence the outcome, given the likely strong belief in the benefits of the intervention ward. | ||||||||||||
| Analysis reflects plan in trial registration and study protocol, and results are not thought to be from multiple outcome measures or multiple analyses. | ||||||||||||
| The study is judged to be at high risk of bias due to the randomisation process and measurement of the outcome. | ||||||||||||
| Pedersen 2019 | | | | | | | ||||||
| Allocation sequence was random (computer‐generated block randomisation), and allocation sequence concealed from the investigators. Participant characteristics were well‐balanced between groups. | ||||||||||||
| Participants and clinicians were aware of the treatment assignments. There was no evidence of deviations from the assigned interventions and an intention to treat approach was used for analysis. | ||||||||||||
| When accounting for mortality only 93% of participants in intervention group and 67% in control group completed measures at discharge. The difference in the proportion of missing data, and that the assessments were carried out home after discharge, it was judged likely that the reasons for missing data may have depended on its true value. | ||||||||||||
| The use of the de Morton Mobility Index (DEMMI) is considered appropriate, and there were no differences in the measurement or ascertainment between groups. The assessors were blinded. | ||||||||||||
| The analysis is in accordance with a pre‐specified analysis in a published protocol, and results are not thought to be from multiple outcome measures or multiple analyses. | ||||||||||||
| As per RoB2 algorithm, the study is judged to be at high risk of bias due to missing outcome data. | ||||||||||||
| Bias | ||||||||||||
|---|---|---|---|---|---|---|---|---|---|---|---|---|
| Study | Randomisation process | Deviations from intended interventions | Missing outcome data | Measurement of the outcome | Selection of the reported results | Overall | ||||||
| Subgroup 1.3.1 Rehabilitation‐related activities | ||||||||||||
| Abizanda 2011 | | | | | | | ||||||
| Allocation sequence was random (computer generated random numbers). Allocation occurred after enrolment by an investigator not involved in the participants' clinical management. Higher number of participants admitted with a stroke in the intervention group (39 vs. 16), in addition, the 'Others' subgroup the Barthel index is higher in the control group than the intervention group (29.1 vs. 23.1). This is thought to be compatible with chance. | ||||||||||||
| Its assumed participants and the Occupational Therapist (OT) delivering the intervention were aware of the assigned intervention allocation. All participants received their allocated intervention. Therefore, even though intention to treat analysis not specified, analysis deemed appropriate. | ||||||||||||
| Given the nature of this population (older adults during and after acute hospitalisation) we considered a threshold of 90% of participants with data as sufficient. We felt this would be consistent with measurements outside of a trial context. When accounting for mortality, 93% and 91% assessed at discharge in intervention and control arms respectively. | ||||||||||||
| The use of the Confusion Assessment Method (CAM) to assess for delirium is considered appropriate, and there were no differences in measurement or ascertainment of the outcomes between groups. The OT assessor was blinded. | ||||||||||||
| The data analyst was blinded, and followed a pre‐specified statistical plan. It is not thought that results were from multiple outcome measurements or multiple analyses. | ||||||||||||
| The study is judged to be at low risk of bias in all domains for this outcome. | ||||||||||||
| Asplund 2000 | | | | | | | ||||||
| The method of allocation sequence is not described, but the use of sealed envelopes suggests a random component was used. Participant characteristics were balanced. | ||||||||||||
| Participants and those delivering the interventions were aware of intervention assignments. Twenty‐five patients were excluded due to them not meeting the set eligibility criteria, however, these: protocol violations are not expected to influence the effect estimate of the outcome as per protocol analyses used. The per protocol analyses was not thought to have a substantial impact on the result given the main reason for exclusion was inappropriate recruitment. Excluding this 25, the other 6 exclusions represent approximately 1% of the total sample size. | ||||||||||||
| Data at discharge from hospital was available for 98% of participants. | ||||||||||||
| The confusion assessment method (CAM) instrument was considered appropriate, and there were no differences in the measurement or ascertainment between groups. The assessors were not blinded, and it was therefore considered likely that knowledge of the intervention could influence the outcome, given the likely strong belief in the benefits of the intervention ward. | ||||||||||||
| A pre‐specified statistical plan was not found, but it is not thought that the results were from multiple outcome measures or multiple analyses. | ||||||||||||
| The study is judged to be at high risk of bias due to measurement of the outcome. | ||||||||||||
| Subgroup 1.3.2 Structured exercise | ||||||||||||
| Brown 2016 | | | | | | | ||||||
| No description of randomisation sequence generation, but the paper describes a block randomisation strategy and sequence concealed (sealed envelopes). The patient characteristics appear well‐balanced between groups. | ||||||||||||
| We assume both participants and those delivering the interventions were aware of intervention assignments. 6 participants did not receive allocated intervention, this is considered to be consistent with what could occur outside the trial context, and intention to treat analysis was used. | ||||||||||||
| No missing data. | ||||||||||||
| The Confusion Assessment Method (CAM) score is considered appropriate, and there were no differences in the measurement or ascertainment between groups. The assessors were blinded at admission, discharge and follow up, but not the research assistants as they were delivering the intervention. “The research assistants also used the CAM at each patient visit throughout the hospital stay to ensure that patients in either group did not develop incident delirium.” Therefore, assessors not considered to be blinded, and it is likely given that there is judgement involved in scoring of the CAM, that knowledge of the intervention could influence the scoring of the CAM given the likely strong beliefs in the benefits of the intervention ward. | ||||||||||||
| The study protocol details statistical analysis plan which did not refer to assessment of delirium after baseline assessments, but it is not thought that the results were from multiple outcome measures or multiple analyses. | ||||||||||||
| The study is judged to be at high risk of bias in measurement of the outcome. | ||||||||||||
| Subgroup 1.3.3 Progressive resistance exercise | ||||||||||||
| Jeffs 2013 | | | | | | | ||||||
| Sequence concealment was achieved via a member of the research team not involved in recruitment and using sealed envelopes. There was no information regarding method of generating random sequence, other than to say that there was randomisation, given details of allocation concealment, assumption made that appropriate method used. Patient characteristics between groups appear well‐balanced. | ||||||||||||
| Participants and those delivering the interventions were likely to be aware of intervention allocations. One participant was not allocated to a group due to an administrative error and 35 participants did not receive the intervention as planned (17 in the intervention group). This is thought to be consistent with what could occur outside of the trial context. Intention to treat analysis was used. | ||||||||||||
| No missing data. | ||||||||||||
| The Confusion Assessment Method (CAM) is considered appropriate, and there were no differences in the measurement or ascertainment between groups. The assessors were blinded. | ||||||||||||
| A pre‐specified statistical plan was not found, but it is not thought that the results were from multiple outcome measures or multiple analyses. | ||||||||||||
| The study is judged to raise some concerns in the selection of the reported results. | ||||||||||||
| Martinez‐Velilla 2019 | | | | | | | ||||||
| Allocation sequence was random (www.randomizer.org) and personal communication with author confirms allocation concealment. Baseline differences between groups are thought to be compatible with chance. | ||||||||||||
| Both participants and clinicians delivering care were aware of assigned interventions. There is no evidence of deviations from intended interventions and intention to treat analysis used. | ||||||||||||
| Assuming that those that discontinued the study did not provide Barthel Index (BI) outcome data, and accounting for mortality, 84% of intervention group and 86% of control group had outcome data. Although there were participants who discontinued the study due to medical deterioration, which could have and is considered likely to have biased the results (i.e. medical deterioration being associated with poor functional outcomes), the numbers were relatively low (only 6% of the sample) and were well‐balanced between groups. We therefore feel that this was unlikely to bias the results. | ||||||||||||
| The use of the Confusion Assessment Method (CAM) to measure delirium is considered appropriate, and there were no differences in the measurement or ascertainment between groups. The assessors were blinded. | ||||||||||||
| The trial protocol reflects the analyses as that were conducted, and it is not thought that the results were from multiple outcome measures or multiple analyses. | ||||||||||||
| The study is judged to raise some concerns due to missing outcome data. | ||||||||||||
| McCullagh 2020 | | | | | | | ||||||
| Allocation sequence was random (computer‐generated) and allocation sequence was concealed. Baseline differences are thought to be compatible with chance. | ||||||||||||
| Both participants and clinicians delivering care were aware of assigned interventions. There is no evidence of deviations from intended interventions and intention to treat analysis used. | ||||||||||||
| 90% of intervention group and 94% of the control group had outcome data. Given the nature of this population (older adults during and after acute hospitalisation) we considered a threshold of 90% of participants with data as sufficient. | ||||||||||||
| The use of the Six‐item Cognitive Impairment Test (6CIT) to assess for delirium is considered appropriate, and there were no differences in the measurement or ascertainment between groups. The assessors were blinded. | ||||||||||||
| The trial protocol reflects the analyses as that were conducted, and it is not thought that the results were from multiple outcome measures or multiple analyses. | ||||||||||||
| The study is judged to be at low risk of bias in all domains for this outcome. | ||||||||||||
| Mudge 2008 | | | | | | | ||||||
| Pseudo‐randomisation, allocation was based on admitting unit and bed availability, and admitting unit was determined by a rotating roster. No evidence of baseline differences in patient characteristics other than those thought to be compatible with chance. | ||||||||||||
| Both participants and clinicians delivering care were aware of assigned interventions. There is no evidence of deviations from intended interventions and intention to treat analysis used. | ||||||||||||
| No missing data. | ||||||||||||
| Identifying delirium according to chart review using validated methodology is considered appropriate, and there were no differences in the measurement or ascertainment between groups. The assessors were blinded. | ||||||||||||
| A pre‐specified statistical plan was not found, but it is not thought that the results were from multiple outcome measures or multiple analyses. | ||||||||||||
| The study is judged to be at high risk of bias due to the randomisation process. | ||||||||||||
| Bias | ||||||||||||
|---|---|---|---|---|---|---|---|---|---|---|---|---|
| Study | Randomisation process | Deviations from intended interventions | Missing outcome data | Measurement of the outcome | Selection of the reported results | Overall | ||||||
| Subgroup 1.4.1 Rehabilitation‐related activities | ||||||||||||
| Ekerstad 2017 | | | | | | | ||||||
| Randomisation was based on the availability of beds, and there was no allocation concealment as participants were allocated a ward prior to enrolment. Participant characteristics appeared balanced. | ||||||||||||
| Participants and clinicians delivering care were aware of treatment assignments. There was no evidence of deviations from intended interventions and intention to treat analysis was used. | ||||||||||||
| No missing data. | ||||||||||||
| The EQ‐VAS is considered appropriate, and there were no differences in the measurement or ascertainment between groups. The assessors were not blinded, and it was therefore considered likely that knowledge of the intervention could influence the outcome, given the likely strong belief in the benefits of the intervention ward. | ||||||||||||
| A detailed pre‐specified statistical plan was not found, but it is not thought that the results were from multiple outcome measures or multiple analyses. | ||||||||||||
| The study is judged to be at high risk of bias due to bias in the measurement of the outcome and bias arising from the randomisation process. | ||||||||||||
| Subgroup 1.4.2 Structured exercise | ||||||||||||
| Hu 2020 | | | | | | | ||||||
| Allocation sequence was random (computer generated random numbers) and sequence concealed (blinded project coordinator allocated participants). Participant characteristics were balanced. | ||||||||||||
| Participants and those delivering the interventions were aware of intervention allocations. There was no evidence of deviations from the intended interventions and as such it is presumed intention to treat analysis was used. | ||||||||||||
| At discharge data was available for 76% of reablement group, (78% of reminder group) and 80% of the control group. Only participants who had complete data (i.e. data collected at baseline, discharge and follow‐up) had outcomes reported. Although missing data is well‐balanced between all three groups, it is considered likely that reason for missing data is related to its true value. | ||||||||||||
| The EQ5D is considered appropriate, and there were no differences in the measurement or ascertainment between groups. The assessors were blinded. | ||||||||||||
| A pre‐specified statistical plan was not found, but it is not thought that the results were from multiple outcome measures or multiple analyses. | ||||||||||||
| The study is judged to be at high risk of bias due to missing outcome data. | ||||||||||||
| Subgroup 1.4.3 Progressive resistance exercise | ||||||||||||
| Martinez‐Velilla 2019 | | | | | | | ||||||
| Allocation sequence was random (www.randomizer.org) and personal communication with author confirms allocation concealment. Baseline differences between groups are thought to be compatible with chance. | ||||||||||||
| Both participants and clinicians delivering care were aware of assigned interventions. There is no evidence of deviations from intended interventions and intention to treat analysis used. | ||||||||||||
| Assuming that those that discontinued the study did not provide e EQ‐5D outcome data, and accounting for mortality, 83% of intervention group and 86% of control group had outcome data. Although there were participants who discontinued the study due to medical deterioration, which could have and is considered likely to have biased the results (i.e. medical deterioration being associated with poor functional outcomes), the numbers were relatively low (only 6% of the sample) and were well‐balanced between groups. We therefore feel that this was unlikely to bias the results. | ||||||||||||
| The EQ‐5D is considered appropriate, and there were no differences in the measurement or ascertainment between groups. The assessors were blinded. | ||||||||||||
| The trial protocol reflects the analyses as that were conducted, and it is not thought that the results were from multiple outcome measures or multiple analyses. | ||||||||||||
| The study is judged to raise some concerns due to missing outcome data. | ||||||||||||
| McCullagh 2020 | | | | | | | ||||||
| Allocation sequence was random (computer‐generated) and allocation sequence was concealed. Baseline differences are thought to be compatible with chance. | ||||||||||||
| Both participants and clinicians delivering care were aware of assigned interventions. There is no evidence of deviations from intended interventions and intention to treat analysis used. | ||||||||||||
| 90% of intervention group and 94% of the control group had outcome data. Given the nature of this population (older adults during and after acute hospitalisation) we considered a threshold of 90% of participants with data as sufficient. | ||||||||||||
| The use of EQ‐5D5L to measure quality of life is considered appropriate, and there were no differences in the measurement or ascertainment between groups. The assessors were blinded. | ||||||||||||
| The trial protocol reflects the analyses as that were conducted, and it is not thought that the results were from multiple outcome measures or multiple analyses. | ||||||||||||
| The study is judged to be at low risk of bias for all domains for this outcome. | ||||||||||||
| Bias | ||||||||||||
|---|---|---|---|---|---|---|---|---|---|---|---|---|
| Study | Randomisation process | Deviations from intended interventions | Missing outcome data | Measurement of the outcome | Selection of the reported results | Overall | ||||||
| Subgroup 1.5.1 Rehabilitation‐related activities | ||||||||||||
| Sahota 2017 | | | | | | | ||||||
| No information on randomisation methods other than to say participants were randomised, however, patient characteristics appear well‐balanced between groups and differences compatible with chance. | ||||||||||||
| It is assumed that participants and those delivering the interventions were aware of intervention assignments. There were 15 protocol deviations in the CIRACT group and 8 in the THB‐Rehab group. The deviations were thought to be in keeping with what would be expected outside of a trial context. Intention to treat not explicitly stated though it appears that the 1 participant who did not receive the intended intervention was analysed within the group to which they were assigned. | ||||||||||||
| No missing data | ||||||||||||
| Methods of measuring the number of falls was considered appropriate and there were no differences in measurement or ascertainment of the outcomes between groups. The assessor was not blinded, but it is thought that due to the lack of judgement in the measurement, that the knowledge of the intervention did not influence the outcomes. | ||||||||||||
| A pre‐specified statistical plan was not found, but it is not thought that the results were from multiple outcome measures or multiple analyses. | ||||||||||||
| The study is judged to raise some concerns in the selection of the reported results and the randomisation process. | ||||||||||||
| Subgroup 1.5.2 Structured exercise | ||||||||||||
| Brown 2016 | | | | | | | ||||||
| No description of randomisation sequence generation, but the paper describes a block randomisation strategy and sequence concealed (sealed envelopes). The patient characteristics appear well‐balanced between groups. | ||||||||||||
| We assume both participants and those delivering the interventions were aware of intervention assignments. 6 participants did not receive allocated intervention, this is considered to be consistent with what could occur outside the trial context, and intention to treat analysis was used. | ||||||||||||
| No missing data. | ||||||||||||
| Methods of measuring the number of falls was considered appropriate and there were no differences in measurement or ascertainment of the outcomes between groups. The assessor was blinded. | ||||||||||||
| The study protocol details statistical analysis plan which is in accordance with results presented, and it is not thought that the results were from multiple outcome measures or multiple analyses. | ||||||||||||
| The study is judged to be at low risk of bias in all domains for this outcome. | ||||||||||||
| Gazineo 2021 | | | | | | | ||||||
| Allocation sequence was random (generated using an online system) and the allocation sequence was concealed until participants were enrolled (opaque concealed and sealed envelopes). Participant characteristics were well‐balanced. | ||||||||||||
| Participants and those delivering the interventions were aware of intervention allocations. There was no evidence of deviations from the intended interventions and intention to treat analysis used. | ||||||||||||
| No missing data after accounting for mortality. | ||||||||||||
| Methods of measuring the number of falls was considered appropriate and there were no differences in measurement or ascertainment of the outcomes between groups. The assessor was not blinded, but it is thought that due to the lack of judgement in the measurement, that the knowledge of the intervention did not influence the outcomes. | ||||||||||||
| A pre‐specified statistical plan was not found, but it is not thought that the results were from multiple outcome measures or multiple analyses. | ||||||||||||
| The study is judged to raise some concerns in the selection of the reported results . | ||||||||||||
| Killey 2006 | | | | | | | ||||||
| Allocation not random and sequence predictable as based on alternation. There is limited data on participant characteristics, but available data suggests balanced characteristics between groups. | ||||||||||||
| Participants and those delivering the interventions were aware of intervention allocations. There was no evidence of deviations from the intended interventions. Per‐protocol analysis appears to have been used. 2 participants in the intervention group were excluded from analysis as they completed less than 70% of their walks. The 2 participants that were excluded accounted for 7% of the remaining sample, it is therefore considered that there was potential for a significant impact on the results. | ||||||||||||
| Only 71% of intervention and 74% of control group had outcome data. A significant proportion of missing data was related to early discharge from hospital. These participants could be expected to have a higher functional level than those who remained in hospital. However, the missing data was well‐balanced between the two groups. | ||||||||||||
| Methods of measuring the number of falls was considered appropriate and there were no differences in measurement or ascertainment of the outcomes between groups. The assessor was not blinded, but it is thought that due to the lack of judgement in the measurement, that the knowledge of the intervention did not influence the outcomes. | ||||||||||||
| A pre‐specified statistical plan was not found, but it is not thought that the results were from multiple outcome measures or multiple analyses. | ||||||||||||
| The study is judged to be at high risk of bias arising from the randomisation process and due to deviations from the intended interventions. | ||||||||||||
| Subgroup 1.5.3 Progressive resistance exercise | ||||||||||||
| de Morton 2007 | | | | | | | ||||||
| Allocation of wards was random (coin toss) and the allocating officer unaware of study. Baseline differences between groups were thought to be compatible with chance. | ||||||||||||
| Participants and clinicians delivering care were believed to be aware of treatment assignments. There was no evidence of deviations from intended interventions and intention to treat analysis was used. | ||||||||||||
| No missing data. | ||||||||||||
| Methods of measuring the number of falls was considered appropriate and there were no differences in measurement or ascertainment of the outcomes between groups. The assessor was not blinded, but it is thought that due to the lack of judgement in the measurement, that the knowledge of the intervention did not influence the outcomes. | ||||||||||||
| A pre‐specified statistical plan was not found, but it is not thought that the results were from multiple outcome measures or multiple analyses. | ||||||||||||
| The study is judged to raise some concerns in the selection of the reported result. | ||||||||||||
| Jones 2006 | | | | | | | ||||||
| Allocation sequence was random (computer generated random numbers). Sequence allocation was not concealed, but performed by a member of staff independent of the enrolment procedures. ). Participant characteristics were balanced between groups and differences compatible with chance. | ||||||||||||
| It is assumed that both participants and clinicians delivering care were aware of assigned interventions. There is no evidence of deviations from intended interventions and intention to treat analysis used. | ||||||||||||
| After accounting for mortality, falls data available for 99% of control group and 93% of intervention group. Given the nature of this population (older adults during and after acute hospitalisation) we considered a threshold of 90% of participants with data as sufficient. | ||||||||||||
| Methods of measuring the number of falls was considered appropriate and there were no differences in measurement or ascertainment of the outcomes between groups. The assessor was blinded. | ||||||||||||
| A pre‐specified statistical plan was not found, but it is not thought that the results were from multiple outcome measures or multiple analyses. | ||||||||||||
| The study is judged to raise some concerns due to the selection of the reported results. | ||||||||||||
| Martinez‐Velilla 2019 | | | | | | | ||||||
| Allocation sequence was random (www.randomizer.org) and personal communication with author confirms allocation concealment. Baseline differences between groups are thought to be compatible with chance. | ||||||||||||
| Both participants and clinicians delivering care were aware of assigned interventions. There is no evidence of deviations from intended interventions and intention to treat analysis used. | ||||||||||||
| No missing data | ||||||||||||
| Methods of measuring the number of falls was considered appropriate and there were no differences in measurement or ascertainment of the outcomes between groups. The assessor was blinded. | ||||||||||||
| The trial protocol reflects the analyses as that were conducted, and it is not thought that the results were from multiple outcome measures or multiple analyses. | ||||||||||||
| The study is judged to be at low risk of bias in all domains for this outcome. | ||||||||||||
| McCullagh 2020 | | | | | | | ||||||
| Allocation sequence was random (computer‐generated) and allocation sequence was concealed. Baseline differences are thought to be compatible with chance. | ||||||||||||
| Both participants and clinicians delivering care were aware of assigned interventions. There is no evidence of deviations from intended interventions and intention to treat analysis used. | ||||||||||||
| No missing data. | ||||||||||||
| Methods of measuring the number of falls was considered appropriate and there were no differences in measurement or ascertainment of the outcomes between groups. The assessor was blinded. | ||||||||||||
| The trial protocol reflects the analyses as that were conducted, and it is not thought that the results were from multiple outcome measures or multiple analyses. | ||||||||||||
| As per RoB2 algorithm, the study is judged to be at low risk of bias for all domains for this outcome. | ||||||||||||
| Mudge 2008 | | | | | | | ||||||
| Pseudo‐randomisation, allocation was based on admitting unit and bed availability, and admitting unit was determined by a rotating roster. No evidence of baseline differences in patient characteristics other than those thought to be compatible with chance. | ||||||||||||
| Both participants and clinicians delivering care were aware of assigned interventions. There is no evidence of deviations from intended interventions and intention to treat analysis used. | ||||||||||||
| No missing data. | ||||||||||||
| Methods of measuring the number of falls was considered appropriate and there were no differences in measurement or ascertainment of the outcomes between groups. The assessor was blinded. | ||||||||||||
| A pre‐specified statistical plan was not found, but it is not thought that the results were from multiple outcome measures or multiple analyses. | ||||||||||||
| The study is judged to be at high risk of bias due to the randomisation process. | ||||||||||||
| Bias | ||||||||||||
|---|---|---|---|---|---|---|---|---|---|---|---|---|
| Study | Randomisation process | Deviations from intended interventions | Missing outcome data | Measurement of the outcome | Selection of the reported results | Overall | ||||||
| Subgroup 1.6.1 Rehabilitation‐related activities | ||||||||||||
| Abizanda 2011 | | | | | | | ||||||
| Allocation sequence was random (computer generated random numbers). Allocation occurred after enrolment by an investigator not involved in the participants' clinical management. Higher number of participants admitted with a stroke in the intervention group (39 vs. 16), in addition, the 'Others' subgroup the Barthel index is higher in the control group than the intervention group (29.1 vs. 23.1). This is thought to be compatible with chance. | ||||||||||||
| Its assumed participants and the Occupational Therapist (OT) delivering the intervention were aware of the assigned intervention allocation. All participants received their allocated intervention. Therefore, even though intention to treat analysis not specified, analysis deemed appropriate. | ||||||||||||
| Given the nature of this population (older adults during and after acute hospitalisation) we considered a threshold of 90% of participants with data as sufficient. We felt this would be consistent with measurements outside of a trial context. When accounting for mortality, 93% and 91% assessed at discharge for confusion in intervention and control arms respectively. | ||||||||||||
| The use of the Confusion Assessment Method (CAM) to assess for delirium is considered appropriate, and there were no differences in measurement or ascertainment of the outcomes between groups. The OT assessor was blinded. | ||||||||||||
| The data analyst was blinded, and followed a pre‐specified statistical plan. It is not thought that results were from multiple outcome measurements or multiple analyses. | ||||||||||||
| The study is judged to be at low risk of bias in all domains for this outcome. | ||||||||||||
| Asplund 2000 | | | | | | | ||||||
| The method of allocation sequence is not described, but the use of sealed envelopes suggests a random component was used. Participant characteristics were balanced. | ||||||||||||
| Participants and those delivering the interventions were aware of intervention assignments. Twenty‐five patients were excluded due to them not meeting the set eligibility criteria, however, these: protocol violations are not expected to influence the effect estimate of the outcome as per protocol analyses used. The per protocol analyses was not thought to have a substantial impact on the result given the main reason for exclusion was inappropriate recruitment. Excluding this 25, the other 6 exclusions represent approximately 1% of the total sample size. | ||||||||||||
| Data at discharge from hospital was available for 98% of participants. | ||||||||||||
| The confusion assessment method (CAM) instrument was considered appropriate, and there were no differences in the measurement or ascertainment between groups. The assessors were not blinded, and it was therefore considered likely that knowledge of the intervention could influence the outcome, given the likely strong belief in the benefits of the intervention ward. | ||||||||||||
| A pre‐specified statistical plan was not found, but it is not thought that the results were from multiple outcome measures or multiple analyses. | ||||||||||||
| The study is judged to be at high risk of bias due to measurement of the outcome. | ||||||||||||
| Subgroup 1.6.2 Structured exercise | ||||||||||||
| Brown 2016 | | | | | | | ||||||
| No description of randomisation sequence generation, but the paper describes a block randomisation strategy and sequence concealed (sealed envelopes). The patient characteristics appear well‐balanced between groups. | ||||||||||||
| We assume both participants and those delivering the interventions were aware of intervention assignments. Six participants did not receive allocated intervention, this is considered to be consistent with what could occur outside the trial context, and intention to treat analysis was used. | ||||||||||||
| No missing data. | ||||||||||||
| Measures used to measure medical deterioration are considered appropriate and there and there were no differences in the measurement or ascertainment between groups. The assessors were blinded. | ||||||||||||
| The study protocol details statistical analysis plan which is in line with the analyses conducted, and it is not thought that the results were from multiple outcome measures or multiple analyses. | ||||||||||||
| The study is judged to be at low risk of bias in all domains for this outcome. | ||||||||||||
| Hu 2020 | | | | | | | ||||||
| Allocation sequence was random (computer generated random numbers) and sequence concealed (blinded project coordinator allocated participants). Participant characteristics were balanced. | ||||||||||||
| Participants and those delivering the interventions were aware of intervention allocations. There was no evidence of deviations from the intended interventions and as such it is presumed intention to treat analysis was used. | ||||||||||||
| No missing data for medical deterioration during hospitalisation. | ||||||||||||
| The measures are considered appropriate, and there were no differences in the measurement or ascertainment between groups. The assessors were blinded. | ||||||||||||
| A pre‐specified statistical plan was not found, but it is not thought that the results were from multiple outcome measures or multiple analyses. | ||||||||||||
| The study is judged to have some concerns in the selection of the reported result. | ||||||||||||
| Subgroup 1.6.3 Progressive resistance exercise | ||||||||||||
| de Morton 2007 | | | | | | | ||||||
| Allocation of wards was random (coin toss) and the allocating officer unaware of study. Baseline differences between groups were thought to be compatible with chance. | ||||||||||||
| Participants and clinicians delivering care were believed to be aware of treatment assignments. There was no evidence of deviations from intended interventions and intention to treat analysis was used. | ||||||||||||
| No missing data. | ||||||||||||
| The measures are considered appropriate, and there were no differences in the measurement or ascertainment between groups. The assessors were not blinded, but it is thought that due to the lack of judgement in the outcome, that the knowledge of the intervention did not influence the outcomes. | ||||||||||||
| A pre‐specified statistical plan was not found, but it is not thought that the results were from multiple outcome measures or multiple analyses. | ||||||||||||
| The study is judged to raise some concerns in the selection of the reported result. | ||||||||||||
| Jeffs 2013 | | | | | | | ||||||
| Sequence concealment was achieved via a member of the research team not involved in recruitment and using sealed envelopes. There was no information regarding method of generating random sequence, other than to say that there was randomisation, given details of allocation concealment, assumption made that appropriate method used. Patient characteristics between groups appear well‐balanced. | ||||||||||||
| Participants and those delivering the interventions were likely to be aware of intervention allocations. One participant was not allocated to a group due to an administrative error and 35 participants did not receive the intervention as planned (17 in the intervention group). This is thought to be consistent with what could occur outside of the trial context. Intention to treat analysis was used. | ||||||||||||
| No missing data. | ||||||||||||
| The Confusion Assessment Method (CAM) is considered appropriate, and there were no differences in the measurement or ascertainment between groups. The assessors were blinded. | ||||||||||||
| A pre‐specified statistical plan was not found, but it is not thought that the results were from multiple outcome measures or multiple analyses. | ||||||||||||
| The study is judged to raise some concerns in the selection of the reported results. | ||||||||||||
| Jones 2006 | | | | | | | ||||||
| Allocation sequence was random (computer generated random numbers). Sequence allocation was not concealed, but performed by a member of staff independent of the enrolment procedures. ). Participant characteristics were balanced between groups and differences compatible with chance. | ||||||||||||
| It is assumed that both participants and clinicians delivering care were aware of assigned interventions. There is no evidence of deviations from intended interventions and intention to treat analysis used. | ||||||||||||
| No missing data. | ||||||||||||
| Measurement methods are considered appropriate, and there were no differences in the measurement or ascertainment between groups. The assessors were blinded. | ||||||||||||
| A pre‐specified statistical plan was not found, but it is not thought that the results were from multiple outcome measures or multiple analyses. | ||||||||||||
| The study is judged to raise some concerns in the selection of the reported results. | ||||||||||||
| Martinez‐Velilla 2019 | | | | | | | ||||||
| Allocation sequence was random (www.randomizer.org) and personal communication with author confirms allocation concealment. Baseline differences between groups are thought to be compatible with chance. | ||||||||||||
| Both participants and clinicians delivering care were aware of assigned interventions. There is no evidence of deviations from intended interventions and intention to treat analysis used. | ||||||||||||
| The methods of measurement are considered appropriate, and there were no differences in the measurement or ascertainment between groups. The assessors were blinded. | ||||||||||||
| The trial protocol reflects the analyses as that were conducted, and it is not thought that the results were from multiple outcome measures or multiple analyses. | ||||||||||||
| The study is judged to be at low risk of bias in all domains for this outcome. | ||||||||||||
| The study is judged to be at low risk of bias in all domains for this outcome. | ||||||||||||
| McCullagh 2020 | | | | | | | ||||||
| Allocation sequence was random (computer‐generated) and allocation sequence was concealed. Baseline differences are thought to be compatible with chance. | ||||||||||||
| Both participants and clinicians delivering care were aware of assigned interventions. There is no evidence of deviations from intended interventions and intention to treat analysis used. | ||||||||||||
| 90% of intervention group and 94% of the control group had outcome data. Given the nature of this population (older adults during and after acute hospitalisation) we considered a threshold of 90% of participants with data as sufficient. | ||||||||||||
| The use of the Six‐item Cognitive Impairment Test (6CIT) to assess for delirium is considered appropriate, and there were no differences in the measurement or ascertainment between groups. The assessors were blinded. | ||||||||||||
| The trial protocol reflects the analyses as that were conducted, and it is not thought that the results were from multiple outcome measures or multiple analyses. | ||||||||||||
| The study is judged to be at low risk of bias in all domains for this outcome. | ||||||||||||
| Mudge 2008 | | | | | | | ||||||
| Pseudo‐randomisation, allocation was based on admitting unit and bed availability, and admitting unit was determined by a rotating roster. No evidence of baseline differences in patient characteristics other than those thought to be compatible with chance. | ||||||||||||
| Both participants and clinicians delivering care were aware of assigned interventions. There is no evidence of deviations from intended interventions and intention to treat analysis used. | ||||||||||||
| No missing data. | ||||||||||||
| Identifying delirium according to chart review using validated methodology is considered appropriate, and there were no differences in the measurement or ascertainment between groups. The assessors were blinded. | ||||||||||||
| A pre‐specified statistical plan was not found, but it is not thought that the results were from multiple outcome measures or multiple analyses. | ||||||||||||
| The study is judged to be at high risk of bias due to the randomisation process. | ||||||||||||
| Pedersen 2019 | | | | | | | ||||||
| Allocation sequence was random (computer‐generated block randomisation), and allocation sequence concealed from the investigators. Participant characteristics were well‐balanced between groups. | ||||||||||||
| Participants and clinicians were aware of the treatment assignments. There was no evidence of deviations from the assigned interventions and an intention to treat approach was used for analysis. | ||||||||||||
| No missing data. | ||||||||||||
| The measure is considered appropriate, and there were no differences in the measurement or ascertainment between groups. The assessors were blinded. | ||||||||||||
| The analysis is in accordance with a pre‐specified analysis in a published protocol, and results are not thought to be from multiple outcome measures or multiple analyses. | ||||||||||||
| The study is judged to be at low risk of bias in all domains for this outcome. | ||||||||||||
| Bias | ||||||||||||
|---|---|---|---|---|---|---|---|---|---|---|---|---|
| Study | Randomisation process | Deviations from intended interventions | Missing outcome data | Measurement of the outcome | Selection of the reported results | Overall | ||||||
| Subgroup 2.2.1 Rehabilitation‐related activities | ||||||||||||
| Abizanda 2011 | | | | | | | ||||||
| Allocation sequence was random (computer generated random numbers). Allocation occurred after enrolment by an investigator not involved in the participants' clinical management. Higher number of participants admitted with a stroke in the intervention group (39 vs. 16), in addition, the 'Others' subgroup the Barthel index is higher in the control group than the intervention group (29.1 vs. 23.1). This is thought to be compatible with chance. | ||||||||||||
| Its assumed participants and the Occupational Therapist (OT) delivering the intervention were aware of the assigned intervention allocation. All participants received their allocated intervention. Therefore, even though intention to treat analysis not specified, analysis deemed appropriate. | ||||||||||||
| No missing data. | ||||||||||||
| The method is considered appropriates, and there were no differences in measurement or ascertainment of the outcomes between groups. The OT assessor was blinded. | ||||||||||||
| The data analyst was blinded, and followed a pre‐specified statistical plan. It is not thought that results were from multiple outcome measurements or multiple analyses. | ||||||||||||
| The study is judged to be at low risk of bias in all domains for this outcome. | ||||||||||||
| Asplund 2000 | | | | | | | ||||||
| The method of allocation sequence is not described, but the use of sealed envelopes suggests a random component was used. Participant characteristics were balanced. | ||||||||||||
| Participants and those delivering the interventions were aware of intervention assignments. Twenty‐five patients were excluded due to them not meeting the set eligibility criteria, however, these: protocol violations are not expected to influence the effect estimate of the outcome as per protocol analyses used. The per protocol analyses was not thought to have a substantial impact on the result given the main reason for exclusion was inappropriate recruitment. Excluding this 25, the other 6 exclusions represent approximately 1% of the total sample size. | ||||||||||||
| Data at discharge from hospital complete for 98% of participants. | ||||||||||||
| The measurement of length of stay is considered appropriate, and there were no differences in measurement or ascertainment between groups. Assessors were not blinded, but is thought that due to the lack of judgement in scoring a 'hard outcome' like length of stay, that it is unlikely that the knowledge of the intervention could influence the outcome. | ||||||||||||
| A pre‐specified statistical plan was not found, but it is not thought that the results were from multiple outcome measures or multiple analyses. | ||||||||||||
| The study is judged to raise some concerns due to deviations from intended interventions and the selection of the reported results. | ||||||||||||
| Counsell 2000 | | | | | | | ||||||
| Allocation sequence was random (computer generated random numbers) and sequence concealed (opaque sealed envelope). Participant characteristics were balanced. | ||||||||||||
| Participants and those delivering the interventions were aware of intervention assignments. Seventy‐nine participants were not admitted to the unit to which they were assigned. Deviations may have affected the effect estimate, however they were well‐balanced between groups. Intention to treat analysis was used. | ||||||||||||
| No missing data. | ||||||||||||
| The methods of measuring length of stay are considered appropriate, and there were no differences in measurement or ascertainment between groups. Assessors were not blinded, but is thought that due to the lack of judgement in scoring a 'hard outcome' like length of hospital stay, that it is unlikely that the knowledge of the intervention could influence the outcome. | ||||||||||||
| A pre‐specified statistical plan was not found, but it is not thought that the results were from multiple outcome measures or multiple analyses. | ||||||||||||
| The study is judged to raise some concerns in the selection of the reported results and deviations from the intended interventions. | ||||||||||||
| Ekerstad 2017 | | | | | | | ||||||
| Randomisation was based on the availability of beds, and there was no allocation concealment as participants were allocated a ward prior to enrolment. Participant characteristics appeared balanced. | ||||||||||||
| Participants and clinicians delivering care were aware of treatment assignments. There was no evidence of deviations from intended interventions and intention to treat analysis was used. | ||||||||||||
| No missing data. | ||||||||||||
| The methods of measuring length of hospital stay are considered appropriate, and there were no differences in measurement or ascertainment between groups. Assessors were not blinded, but is thought that due to the lack of judgement in scoring a 'hard outcome' like length of hospital stay, that it is unlikely that the knowledge of the intervention could influence the outcome. | ||||||||||||
| A detailed pre‐specified statistical plan was not found, but it is not thought that the results were from multiple outcome measures or multiple analyses. | ||||||||||||
| The study is judged to be at high risk of bias arising from the randomisation process. | ||||||||||||
| Fretwell 1990 | | | | | | | ||||||
| “Patients were randomised only when both a treatment and control bed were available”. Although not stated, we believe the necessity for available beds on both wards indicate that a random component was likely used. Sequence allocation concealment is not discussed, but no significant differences in patient characteristics other than those compatible with chance were observed. | ||||||||||||
| Participants and those delivering the interventions were aware of intervention assignments. There were 30 randomisation errors which has been interpreted to mean 'allocated to the ward that they were not randomised to' however there is no explanation of this term. These deviations were thought likely to have affected the outcome, though were relative well‐balanced. It appears a per protocol analyses was used, though given the low number (7%) and relative balance between groups, the omission of the participants randomised incorrectly probably did not have substantial impact on the results. | ||||||||||||
| All participants accounted for at discharge. | ||||||||||||
| The methods of measuring length of stay are considered appropriate, and there were no differences in measurement or ascertainment between groups. Assessors were not blinded, but is thought that due to the lack of judgement in scoring a 'hard outcome' like length of stay, that it is unlikely that the knowledge of the intervention could influence the outcome. | ||||||||||||
| A detailed pre‐specified statistical plan was not found, but it is not thought that the results were from multiple outcome measures or multiple analyses. | ||||||||||||
| The study is judged to raise some concerns in deviations from the intended interventions, methods of randomisation and selection of the reported result. | ||||||||||||
| Landefeld 1995 | | | | | | | ||||||
| Allocation sequence was random (computer generated random numbers) and balanced participant characteristics, but no information was provided regarding allocation concealment. | ||||||||||||
| It is assumed participants and clinicians were aware of the treatment assignments. There was no evidence of deviations from the assigned interventions and evidence of an intention to treat approach being used for analysis. | ||||||||||||
| Accounting for mortality (24 died in each arm) all participants had outcome data at discharge. | ||||||||||||
| The methods of measuring length of hospital stay are considered appropriate, and there were no differences in measurement or ascertainment between groups. Assessors were not blinded, but is thought that due to the lack of judgement in scoring a 'hard outcome' like length of hospital stay, that it is unlikely that the knowledge of the intervention could influence the outcome. | ||||||||||||
| A pre‐specified statistical plan was not found, but it is not thought that the results were from multiple outcome measures or multiple analyses. | ||||||||||||
| The study is judged to have some concerns due to the methods of randomisation and in the selection of the reported result. | ||||||||||||
| Sahota 2017 | | | | | | | ||||||
| No information on randomisation methods other than to say participants were randomised, however, patient characteristics appear well‐balanced between groups and differences compatible with chance. | ||||||||||||
| It is assumed that participants and those delivering the interventions were aware of intervention assignments. There were 15 protocol deviations in the CIRACT group and 8 in the THB‐Rehab group. The deviations were thought to be in keeping with what would be expected outside of a trial context. Intention to treat not explicitly stated though it appears that the 1 participant who did not receive the intended intervention was analysed within the group to which they were assigned. | ||||||||||||
| No missing data | ||||||||||||
| The methods of measuring length of hospital stay are considered appropriate, and there were no differences in measurement or ascertainment between groups. Assessors were not blinded, but is thought that due to the lack of judgement in scoring a 'hard outcome' like length of hospital stay, that it is unlikely that the knowledge of the intervention could influence the outcome. | ||||||||||||
| A pre‐specified statistical plan was not found, but it is not thought that the results were from multiple outcome measures or multiple analyses. | ||||||||||||
| The study is judged to raise some concerns in the selection of the reported results and the randomisation process. | ||||||||||||
| Slaets 1997 | | | | | | | ||||||
| Randomisation methods are described only as: “an alternating randomisation procedure”. However, there was a centrally administered method to allocate interventions, and baseline differences did not appear to show a significant problem with randomisation process other than those thought to be compatible with chance. | ||||||||||||
| Participants and clinicians delivering care were aware of allocated interventions. There was no evidence of deviations from intended intervention, and although intention to treat analysis was not specified, there was no information to suggest participants were not assessed in the group to which they were randomised. | ||||||||||||
| After accounting for mortality (6 patients died), data was available for 91% of participants. | ||||||||||||
| The methods of measuring length of hospital stay in hospital are considered appropriate, and there were no differences in measurement or ascertainment between groups. Assessors were not blinded, but is thought that due to the lack of judgement in scoring a 'hard outcome' like length of stay, that it is unlikely that the knowledge of the intervention could influence the outcome. | ||||||||||||
| A pre‐specified statistical plan was not found, but it is not thought that the results were from multiple outcome measures or multiple analyses. | ||||||||||||
| The study is judged to raise some concerns in the randomisation process and in the selection of the reported results. | ||||||||||||
| Zelada 2009 | | | | | | | ||||||
| The allocation sequence was based on bed availability, and therefore not random, and sequence is believed to be predictable. However, baseline differences did not appear to show a significant problem with randomisation process other than those thought to be compatible with chance. | ||||||||||||
| Participants and clinicians delivering care were aware of treatment allocations. There is no evidence of deviations from intended intervention, or that participants moved between the intervention and usual care units during the study period. Intention to treat analysis was not specified, however there was no information to suggest participants were not assessed in the group to which they were randomised. | ||||||||||||
| No missing data. | ||||||||||||
| The methods of measuring length of stay are considered appropriate, and there were no differences in measurement or ascertainment between groups. Assessors were not blinded, but is thought that due to the lack of judgement in scoring a 'hard outcome' like length of stay, that it is unlikely that the knowledge of the intervention could influence the outcome. | ||||||||||||
| A pre‐specified statistical plan was not found, but it is not thought that the results were from multiple outcome measures or multiple analyses. | ||||||||||||
| The study is judged to be at high risk of bias due to bias arising from the randomisation process. | ||||||||||||
| Subgroup 2.2.2 Structured exercise | ||||||||||||
| Brown 2016 | | | | | | | ||||||
| No description of randomisation sequence generation, but the paper describes a block randomisation strategy and sequence concealed (sealed envelopes). The patient characteristics appear well‐balanced between groups. | ||||||||||||
| We assume both participants and those delivering the interventions were aware of intervention assignments. 6 participants did not receive allocated intervention, this is considered to be consistent with what could occur outside the trial context, and intention to treat analysis was used. | ||||||||||||
| No missing data. | ||||||||||||
| The methods of measuring length of hospital stay are considered appropriate, and there were no differences in measurement or ascertainment between groups. The assessor was blinded. | ||||||||||||
| The study protocol details statistical analysis plan which is in accordance with results presented, and it is not thought that the results were from multiple outcome measures or multiple analyses. | ||||||||||||
| The study is judged to be at low risk of bias in all domains for this outcome. | ||||||||||||
| Gazineo 2021 | | | | | | | ||||||
| Allocation sequence was random (generated using an online system) and the allocation sequence was concealed until participants were enrolled (opaque concealed and sealed envelopes). Participant characteristics were well‐balanced. | ||||||||||||
| Participants and those delivering the interventions were aware of intervention allocations. There was no evidence of deviations from the intended interventions and intention to treat analysis used. | ||||||||||||
| No missing data after accounting for mortality. | ||||||||||||
| Methods of measuring length of hospital stay are considered appropriate and there were no differences in measurement or ascertainment of the outcomes between groups. The assessor was not blinded, but it is thought that due to the lack of judgement in the measurement, that the knowledge of the intervention did not influence the outcomes. | ||||||||||||
| A pre‐specified statistical plan was not found, but it is not thought that the results were from multiple outcome measures or multiple analyses. | ||||||||||||
| The study is judged to raise some concerns in the selection of the reported results . | ||||||||||||
| Hu 2020 | | | | | | | ||||||
| Allocation sequence was random (computer generated random numbers) and sequence concealed (blinded project coordinator allocated participants). Participant characteristics were balanced. | ||||||||||||
| Participants and those delivering the interventions were aware of intervention allocations. There was no evidence of deviations from the intended interventions and as such it is presumed intention to treat analysis was used. | ||||||||||||
| No missing data for length of hospital stay. | ||||||||||||
| The methods of measuring legnth of hospital stay are considered appropriate, and there were no differences in measurement or ascertainment between groups. The assessors were blinded. | ||||||||||||
| A pre‐specified statistical plan was not found, but it is not thought that the results were from multiple outcome measures or multiple analyses. | ||||||||||||
| The study is judged to have some concerns in the selection of the reported result. | ||||||||||||
| McGowan 2018a | | | | | | | ||||||
| Allocation sequence was random (www.randomization.com) and the allocation sequence was only known by the chief investigator who was not involved with screening patients. Baseline differences between groups are thought to be compatible with chance. | ||||||||||||
| Both participants and clinicians delivering care were aware of assigned interventions. There is no evidence of deviations from intended interventions and intention to treat analysis not explicitly stated, but all participants appear to have been analysed in the group to which they were randomised. | ||||||||||||
| 96% of participants had complete data sets. | ||||||||||||
| The measurement of length of hospital stay is considered appropriate, and there were no differences in the measurement or ascertainment between groups. The assessors were not blinded, but is thought that due to the lack of judgement in scoring a 'hard outcome' like length of hospital stay, that it is unlikely that the knowledge of the intervention could influence the outcome. | ||||||||||||
| The trial protocol and registration reflects the analyses as that were conducted, and it is not thought that the results were from multiple outcome measures or multiple analyses. | ||||||||||||
| The study is judged to raise some concerns due to the measurement of the outcome. | ||||||||||||
| Subgroup 2.2.3 Progressive resistance exercise | ||||||||||||
| Courtney 2009 | | | | | | | ||||||
| Allocation sequence was random (computer generated random numbers) and the allocation sequence concealed until participants were enrolled (via project coordinator blinded to baseline data). Participant characteristics appear well‐balanced. | ||||||||||||
| Participants and clinicians delivering care were believed to be aware of treatment assignments. 6/64 participants in the intervention group did not receive allocated treatment, the reasons are considered consistent with what could occur outside the trial context, and intention to treat analysis was used. | ||||||||||||
| No missing length of stay data. | ||||||||||||
| The measurement of hospital length of stay is considered appropriate, and there were no differences in measurement or ascertainment between groups. The assessors are believed to be blinded to treatment allocation. | ||||||||||||
| A pre‐specified statistical plan was not found, but it is not thought that the results were from multiple outcome measures or multiple analyses. | ||||||||||||
| The study is judged to raise some concerns in the selection of the reported result. | ||||||||||||
| de Morton 2007 | | | | | | | ||||||
| Allocation of wards was random (coin toss) and the allocating officer unaware of study. Baseline differences between groups were thought to be compatible with chance. | ||||||||||||
| Participants and clinicians delivering care were believed to be aware of treatment assignments. There was no evidence of deviations from intended interventions and intention to treat analysis was used. | ||||||||||||
| No missing data. | ||||||||||||
| The measure of hospital length of stay considered appropriate, and there were no differences in measurement or ascertainment between groups. Assessors were not blinded, but is thought that due to the lack of judgement in scoring a 'hard outcome' like length of stay, that it is unlikely that the knowledge of the intervention could influence the outcome. | ||||||||||||
| A pre‐specified statistical plan was not found, but it is not thought that the results were from multiple outcome measures or multiple analyses. | ||||||||||||
| The study is judged to raise some concerns in the selection of the reported result. | ||||||||||||
| Jeffs 2013 | | | | | | | ||||||
| Sequence concealment was achieved via a member of the research team not involved in recruitment and using sealed envelopes. There was no information regarding method of generating random sequence, other than to say that there was randomisation, given details of allocation concealment, assumption made that appropriate method used. Patient characteristics between groups appear well‐balanced. | ||||||||||||
| Participants and those delivering the interventions were likely to be aware of intervention allocations. One participant was not allocated to a group due to an administrative error and 35 participants did not receive the intervention as planned (17 in the intervention group). This is thought to be consistent with what could occur outside the trial context. Intention to treat analysis was used. | ||||||||||||
| No missing data. | ||||||||||||
| Measurement of length of hospital stay is considered appropriate, and there were no differences in the measurement or ascertainment between groups. The assessors were blinded. | ||||||||||||
| A pre‐specified statistical plan was not found, but it is not thought that the results were from multiple outcome measures or multiple analyses. | ||||||||||||
| The study is judged to raise some concerns in the selection of the reported results. | ||||||||||||
| Jones 2006 | | | | | | | ||||||
| Allocation sequence was random (computer generated random numbers). Sequence allocation was not concealed, but performed by a member of staff independent of the enrolment procedures. ). Participant characteristics were balanced between groups and differences compatible with chance. | ||||||||||||
| It is assumed that both participants and clinicians delivering care were aware of assigned interventions. There is no evidence of deviations from intended interventions and intention to treat analysis used. | ||||||||||||
| After accounting for mortality, length of stay data available for 99% of control group and 93% of intervention group. Given the nature of this population (older adults during and after acute hospitalisation) we considered a threshold of 90% of participants with data as sufficient. | ||||||||||||
| Measurement methods are considered appropriate, and there were no differences in the measurement or ascertainment between groups. The assessors were blinded. | ||||||||||||
| A pre‐specified statistical plan was not found, but it is not thought that the results were from multiple outcome measures or multiple analyses. | ||||||||||||
| The study is judged to raise some concerns in the selection of the reported results. | ||||||||||||
| Martinez‐Velilla 2019 | | | | | | | ||||||
| Allocation sequence was random (www.randomizer.org) and personal communication with author confirms allocation concealment. Baseline differences between groups are thought to be compatible with chance. | ||||||||||||
| Both participants and clinicians delivering care were aware of assigned interventions. There is no evidence of deviations from intended interventions and intention to treat analysis used. | ||||||||||||
| No missing data. | ||||||||||||
| The methods of measurement are considered appropriate, and there were no differences in the measurement or ascertainment between groups. The assessors were blinded. | ||||||||||||
| The trial protocol reflects the analyses as that were conducted, and it is not thought that the results were from multiple outcome measures or multiple analyses. | ||||||||||||
| The study is judged to be at low risk of bias in all domains for this outcome. | ||||||||||||
| McCullagh 2020 | | | | | | | ||||||
| Allocation sequence was random (computer‐generated) and allocation sequence was concealed. Baseline differences are thought to be compatible with chance. | ||||||||||||
| Both participants and clinicians delivering care were aware of assigned interventions. There is no evidence of deviations from intended interventions and intention to treat analysis used. | ||||||||||||
| No missing data. | ||||||||||||
| The measure is considered appropriate, and there were no differences in the measurement or ascertainment between groups. The assessors were blinded. | ||||||||||||
| The trial protocol reflects the analyses as that were conducted, and it is not thought that the results were from multiple outcome measures or multiple analyses. | ||||||||||||
| The study is judged to be at low risk of bias in all domains for this outcome. | ||||||||||||
| Mudge 2008 | | | | | | | ||||||
| Pseudo‐randomisation, allocation was based on admitting unit and bed availability, and admitting unit was determined by a rotating roster. No evidence of baseline differences in patient characteristics other than those thought to be compatible with chance. | ||||||||||||
| Both participants and clinicians delivering care were aware of assigned interventions. There is no evidence of deviations from intended interventions and intention to treat analysis used. | ||||||||||||
| No missing data. | ||||||||||||
| The method is considered appropriate, and there were no differences in the measurement or ascertainment between groups. The assessors were blinded. | ||||||||||||
| A pre‐specified statistical plan was not found, but it is not thought that the results were from multiple outcome measures or multiple analyses. | ||||||||||||
| The study is judged to be at high risk of bias due to the randomisation process. | ||||||||||||
| Ortiz‐Alonso 2020 | | | | | | | ||||||
| The allocation sequence was based on recruitment blocks of 4‐8 weeks. Activity of daily living (ADL) scores at baseline and admission were significantly lower in the intervention group than the control group, this is thought to be an important prognostic factor and therefore a concern regarding the randomisation process. | ||||||||||||
| Methods were designed to blind participants from group assignments however due to the nature of the intervention and lack of sham intervention the success of this blinding is felt unlikely. Ward staff and research staff were not blinded to the participant's assigned intervention. There were no deviations from the intended interventions due to trial context described and although intention to treat analysis not specified given the lack of deviations it is assumed. | ||||||||||||
| No missing outcome data. | ||||||||||||
| The measure is considered appropriate, and there were no differences in the measurement or ascertainment between groups. The assessors were not blinded, but it is thought that due to the lack of judgement in the outcome, that the knowledge of the intervention did not influence the outcome. | ||||||||||||
| Analysis reflects plan in trial registration and study protocol, and results are not thought to be from multiple outcome measures or multiple analyses. | ||||||||||||
| The study is judged to be at high risk of bias due to the randomisation process. | ||||||||||||
| Pedersen 2019 | | | | | | | ||||||
| Allocation sequence was random (computer‐generated block randomisation), and allocation sequence concealed from the investigators. Participant characteristics were well‐balanced between groups. | ||||||||||||
| Participants and clinicians were aware of the treatment assignments. There was no evidence of deviations from the assigned interventions and an intention to treat approach was used for analysis. | ||||||||||||
| No missing data | ||||||||||||
| The measure is considered appropriate, and there were no differences in the measurement or ascertainment between groups. The assessors were blinded. | ||||||||||||
| The analysis is in accordance with a pre‐specified analysis in a published protocol, and results are not thought to be from multiple outcome measures or multiple analyses. | ||||||||||||
| The study is judged to be at low risk of bias for all domains for this outcome. | ||||||||||||
| Bias | ||||||||||||
|---|---|---|---|---|---|---|---|---|---|---|---|---|
| Study | Randomisation process | Deviations from intended interventions | Missing outcome data | Measurement of the outcome | Selection of the reported results | Overall | ||||||
| Subgroup 2.3.1 Rehabilitation‐related activities | ||||||||||||
| Asplund 2000 | | | | | | | ||||||
| The method of allocation sequence is not described, but the use of sealed envelopes suggests a random component was used. Participant characteristics were balanced. | ||||||||||||
| Participants and those delivering the interventions were aware of intervention assignments. Twenty‐five patients were excluded due to them not meeting the set eligibility criteria, however, these: protocol violations are not expected to influence the effect estimate of the outcome as per protocol analyses used. The per protocol analyses was not thought to have a substantial impact on the result given the main reason for exclusion was inappropriate recruitment. Excluding this 25, the other 6 exclusions represent approximately 1% of the total sample size. | ||||||||||||
| Data at discharge from hospital complete for 98% of participants. | ||||||||||||
| The measurement of new institutionalisation is considered appropriate, and there were no differences in measurement or ascertainment between groups. Assessors were not blinded, but is thought that due to the lack of judgement in scoring a 'hard outcome' like new institutionalisation, that it is unlikely that the knowledge of the intervention could influence the outcome. | ||||||||||||
| A pre‐specified statistical plan was not found, but it is not thought that the results were from multiple outcome measures or multiple analyses. | ||||||||||||
| The study is judged to raise some concerns due to deviations from intended interventions and the selection of the reported results. | ||||||||||||
| Counsell 2000 | | | | | | | ||||||
| Allocation sequence was random (computer generated random numbers) and sequence concealed (opaque sealed envelope). Participant characteristics were balanced. | ||||||||||||
| Participants and those delivering the interventions were aware of intervention assignments. Seventy‐nine participants were not admitted to the unit to which they were assigned. Deviations may have affected the effect estimate, however they were well‐balanced between groups. Intention to treat analysis was used. | ||||||||||||
| No missing data. | ||||||||||||
| The methods of measuring length of stay are considered appropriate, and there were no differences in measurement or ascertainment between groups. Assessors were not blinded, but is thought that due to the lack of judgement in scoring a 'hard outcome' like length of hospital stay, that it is unlikely that the knowledge of the intervention could influence the outcome. | ||||||||||||
| A pre‐specified statistical plan was not found, but it is not thought that the results were from multiple outcome measures or multiple analyses. | ||||||||||||
| The study is judged to raise some concerns in the selection of the reported results and deviations from the intended interventions. | ||||||||||||
| Fretwell 1990 | | | | | | | ||||||
| “Patients were randomised only when both a treatment and control bed were available”. Although not stated, we believe the necessity for available beds on both wards indicate that a random component was likely used. Sequence allocation concealment is not discussed, but no significant differences in patient characteristics other than those compatible with chance were observed. | ||||||||||||
| Participants and those delivering the interventions were aware of intervention assignments. There were 30 randomisation errors which has been interpreted to mean 'allocated to the ward that they were not randomised to' however there is no explanation of this term. These deviations were thought likely to have affected the outcome, though were relative well‐balanced. It appears a per protocol analyses was used, though given the low number (7%) and relative balance between groups, the omission of the participants randomised incorrectly probably did not have substantial impact on the results. | ||||||||||||
| All participants accounted for at discharge. | ||||||||||||
| The methods of measuring new institutionalisation are considered appropriate, and there were no differences in measurement or ascertainment between groups. Assessors were not blinded, but is thought that due to the lack of judgement in scoring a 'hard outcome' like new institutionalisation, that it is unlikely that the knowledge of the intervention could influence the outcome. | ||||||||||||
| A detailed pre‐specified statistical plan was not found, but it is not thought that the results were from multiple outcome measures or multiple analyses. | ||||||||||||
| The study is judged to raise some concerns in deviations from the intended interventions, methods of randomisation and selection of the reported result. | ||||||||||||
| Subgroup 2.3.2 Progressive resistance exercise | ||||||||||||
| de Morton 2007 | | | | | | | ||||||
| Allocation of wards was random (coin toss) and the allocating officer unaware of study. Baseline differences between groups were thought to be compatible with chance. | ||||||||||||
| Participants and clinicians delivering care were believed to be aware of treatment assignments. There was no evidence of deviations from intended interventions and intention to treat analysis was used. | ||||||||||||
| No missing data. | ||||||||||||
| The measure of new institutionalisation considered appropriate, and there were no differences in measurement or ascertainment between groups. Assessors were not blinded, but is thought that due to the lack of judgement in scoring a 'hard outcome' like new institutionalisation, that it is unlikely that the knowledge of the intervention could influence the outcome. | ||||||||||||
| A pre‐specified statistical plan was not found, but it is not thought that the results were from multiple outcome measures or multiple analyses. | ||||||||||||
| The study is judged to raise some concerns in the selection of the reported result. | ||||||||||||
| Mudge 2008 | | | | | | | ||||||
| Pseudo‐randomisation, allocation was based on admitting unit and bed availability, and admitting unit was determined by a rotating roster. No evidence of baseline differences in patient characteristics other than those thought to be compatible with chance. | ||||||||||||
| Both participants and clinicians delivering care were aware of assigned interventions. There is no evidence of deviations from intended interventions and intention to treat analysis used. | ||||||||||||
| No missing data. | ||||||||||||
| The method is considered appropriate, and there were no differences in the measurement or ascertainment between groups. The assessors were blinded. | ||||||||||||
| A pre‐specified statistical plan was not found, but it is not thought that the results were from multiple outcome measures or multiple analyses. | ||||||||||||
| The study is judged to be at high risk of bias due to the randomisation process. | ||||||||||||
| Bias | ||||||||||||
|---|---|---|---|---|---|---|---|---|---|---|---|---|
| Study | Randomisation process | Deviations from intended interventions | Missing outcome data | Measurement of the outcome | Selection of the reported results | Overall | ||||||
| Subgroup 2.4.1 Rehabilitation‐related activities | ||||||||||||
| Asplund 2000 | | | | | | | ||||||
| The method of allocation sequence is not described, but the use of sealed envelopes suggests a random component was used. Participant characteristics were balanced. | ||||||||||||
| Participants and those delivering the interventions were aware of intervention assignments. Twenty‐five patients were excluded due to them not meeting the set eligibility criteria, however, these: protocol violations are not expected to influence the effect estimate of the outcome as per protocol analyses used. The per protocol analyses was not thought to have a substantial impact on the result given the main reason for exclusion was inappropriate recruitment. Excluding this 25, the other 6 exclusions represent approximately 1% of the total sample size. | ||||||||||||
| Data for readmissions complete for 98% of participants. | ||||||||||||
| The measurement of hospital readmissions is considered appropriate, and there were no differences in measurement or ascertainment between groups. Assessors were not blinded, but is thought that due to the lack of judgement in scoring a 'hard outcome' like hospital readmissions, that it is unlikely that the knowledge of the intervention could influence the outcome. | ||||||||||||
| A pre‐specified statistical plan was not found, but it is not thought that the results were from multiple outcome measures or multiple analyses. | ||||||||||||
| The study is judged to raise some concerns due to deviations from intended interventions and the selection of the reported results. | ||||||||||||
| Counsell 2000 | | | | | | | ||||||
| Allocation sequence was random (computer generated random numbers) and sequence concealed (opaque sealed envelope). Participant characteristics were balanced. | ||||||||||||
| Participants and those delivering the interventions were aware of intervention assignments. Seventy‐nine participants were not admitted to the unit to which they were assigned. Deviations may have affected the effect estimate, however they were well‐balanced between groups. Intention to treat analysis was used. | ||||||||||||
| Given the nature of this population (older adults during and after acute hospitalisation) we considered a threshold of 90% of participants with data as sufficient, data was available for approximately 93% at 6 month follow‐up participants at discharge. | ||||||||||||
| The methods of measuring length of stay are considered appropriate, and there were no differences in measurement or ascertainment between groups. Assessors were not blinded, but is thought that due to the lack of judgement in scoring a 'hard outcome' like length of hospital stay, that it is unlikely that the knowledge of the intervention could influence the outcome. | ||||||||||||
| A pre‐specified statistical plan was not found, but it is not thought that the results were from multiple outcome measures or multiple analyses. | ||||||||||||
| The study is judged to raise some concerns in the selection of the reported results and deviations from the intended interventions. | ||||||||||||
| Ekerstad 2017 | | | | | | | ||||||
| Randomisation was based on the availability of beds, and there was no allocation concealment as participants were allocated a ward prior to enrolment. Participant characteristics appeared balanced. | ||||||||||||
| Participants and clinicians delivering care were aware of treatment assignments. There was no evidence of deviations from intended interventions and intention to treat analysis was used. | ||||||||||||
| No missing data. | ||||||||||||
| The methods of measuring length of hospital stay are considered appropriate, and there were no differences in measurement or ascertainment between groups. Assessors were not blinded, but is thought that due to the lack of judgement in scoring a 'hard outcome' like length of hospital stay, that it is unlikely that the knowledge of the intervention could influence the outcome. | ||||||||||||
| A detailed pre‐specified statistical plan was not found, but it is not thought that the results were from multiple outcome measures or multiple analyses. | ||||||||||||
| The study is judged to be at high risk of bias arising from the randomisation process. | ||||||||||||
| Landefeld 1995 | | | | | | | ||||||
| Allocation sequence was random (computer generated random numbers) and balanced participant characteristics, but no information was provided regarding allocation concealment. | ||||||||||||
| It is assumed participants and clinicians were aware of the treatment assignments. There was no evidence of deviations from the assigned interventions and evidence of an intention to treat approach being used for analysis. | ||||||||||||
| Accounting for mortality (24 died in each arm) all participants had outcome data at discharge. At follow up (a further 42, and 40 in intervention and control group had died), data was missing for just 6 participants (1%).at follow up (a further 42, and 40 in intervention and control group had died), data was missing for just 6 participants (1%). | ||||||||||||
| The measure is considered appropriate, and there were no differences in measurement or ascertainment between groups. Assessors were not blinded, but is thought that due to the lack of judgement in scoring a 'hard outcome' like hospital readmissions, that it is unlikely that the knowledge of the intervention could influence the outcome. | ||||||||||||
| A pre‐specified statistical plan was not found, but it is not thought that the results were from multiple outcome measures or multiple analyses. | ||||||||||||
| The study is judged to have some concerns due to the methods of randomisation and in the selection of the reported result. | ||||||||||||
| Sahota 2017 | | | | | | | ||||||
| No information on randomisation methods other than to say participants were randomised, however, patient characteristics appear well‐balanced between groups and differences compatible with chance. | ||||||||||||
| It is assumed that participants and those delivering the interventions were aware of intervention assignments. There were 15 protocol deviations in the CIRACT group and 8 in the THB‐Rehab group. The deviations were thought to be in keeping with what would be expected outside of a trial context. Intention to treat not explicitly stated though it appears that the 1 participant who did not receive the intended intervention was analysed within the group to which they were assigned. | ||||||||||||
| No missing data. | ||||||||||||
| The measure is considered appropriate, and there were no differences in measurement or ascertainment between groups. Assessors were not blinded, but is thought that due to the lack of judgement in scoring a 'hard outcome' like hospital readmissions, that it is unlikely that the knowledge of the intervention could influence the outcome. | ||||||||||||
| A pre‐specified statistical plan was not found, but it is not thought that the results were from multiple outcome measures or multiple analyses. | ||||||||||||
| The study is judged to raise some concerns in the selection of the reported results and the randomisation process. | ||||||||||||
| Slaets 1997 | | | | | | | ||||||
| Randomisation methods are described only as: “an alternating randomisation procedure”. However, there was a centrally administered method to allocate interventions, and baseline differences did not appear to show a significant problem with randomisation process other than those thought to be compatible with chance. | ||||||||||||
| Participants and clinicians delivering care were aware of allocated interventions. There was no evidence of deviations from intended intervention, and although intention to treat analysis was not specified, there was no information to suggest participants were not assessed in the group to which they were randomised. | ||||||||||||
| After accounting for mortality (6 patients died), data was available for 91% of participants. | ||||||||||||
| The methods of measuring hospital readmissions are considered appropriate, and there were no differences in measurement or ascertainment between groups. Assessors were not blinded, but is thought that due to the lack of judgement in scoring a 'hard outcome' like hospital readmissions, that it is unlikely that the knowledge of the intervention could influence the outcome. | ||||||||||||
| A pre‐specified statistical plan was not found, but it is not thought that the results were from multiple outcome measures or multiple analyses. | ||||||||||||
| The study is judged to raise some concerns in the randomisation process and in the selection of the reported results. | ||||||||||||
| Subgroup 2.4.2 Structured exercise | ||||||||||||
| Gazineo 2021 | | | | | | | ||||||
| Allocation sequence was random (generated using an online system) and the allocation sequence was concealed until participants were enrolled (opaque concealed and sealed envelopes). Participant characteristics were well‐balanced. | ||||||||||||
| Participants and those delivering the interventions were aware of intervention allocations. There was no evidence of deviations from the intended interventions and intention to treat analysis used. | ||||||||||||
| No missing data after accounting for mortality. | ||||||||||||
| Methods of measuring hospital readmissions are considered appropriate and there were no differences in measurement or ascertainment of the outcomes between groups. The assessor was not blinded, but it is thought that due to the lack of judgement in the measurement, that the knowledge of the intervention did not influence the outcomes. | ||||||||||||
| A pre‐specified statistical plan was not found, but it is not thought that the results were from multiple outcome measures or multiple analyses. | ||||||||||||
| The study is judged to raise some concerns in the selection of the reported results. | ||||||||||||
| Subgroup 2.4.3 Progressive resistance exercise | ||||||||||||
| Courtney 2009 | | | | | | | ||||||
| Allocation sequence was random (computer generated random numbers) and the allocation sequence concealed until participants were enrolled (via project coordinator blinded to baseline data). Participant characteristics appear well‐balanced. | ||||||||||||
| Participants and clinicians delivering care were believed to be aware of treatment assignments. 6/64 participants in the intervention group did not receive allocated treatment, the reasons are considered consistent with what could occur outside the trial context, and intention to treat analysis was used. | ||||||||||||
| Data regarding readmissions available for 92% of intervention and 98% of control group participants. Given the nature of this population (older adults during and after acute hospitalisation) we considered a threshold of 90% of participants with data as sufficient. | ||||||||||||
| The measurement of hospital readmissions is considered appropriate, and there were no differences in measurement or ascertainment between groups. The assessors are believed to be blinded to treatment allocation. | ||||||||||||
| A pre‐specified statistical plan was not found, but it is not thought that the results were from multiple outcome measures or multiple analyses. | ||||||||||||
| The study is judged to raise some concerns in the selection of the reported result. | ||||||||||||
| de Morton 2007 | | | | | | | ||||||
| Allocation of wards was random (coin toss) and the allocating officer unaware of study. Baseline differences between groups were thought to be compatible with chance. | ||||||||||||
| Participants and clinicians delivering care were believed to be aware of treatment assignments. There was no evidence of deviations from intended interventions and intention to treat analysis was used. | ||||||||||||
| No missing data. | ||||||||||||
| The measure of hospital readmissions is considered appropriate, and there were no differences in measurement or ascertainment between groups. Assessors were not blinded, but is thought that due to the lack of judgement in scoring a 'hard outcome' like hospital readmissions, that it is unlikely that the knowledge of the intervention could influence the outcome. | ||||||||||||
| A pre‐specified statistical plan was not found, but it is not thought that the results were from multiple outcome measures or multiple analyses. | ||||||||||||
| The study is judged to raise some concerns in the selection of the reported result. | ||||||||||||
| Martinez‐Velilla 2019 | | | | | | | ||||||
| Allocation sequence was random (www.randomizer.org) and personal communication with author confirms allocation concealment. Baseline differences between groups are thought to be compatible with chance. | ||||||||||||
| Both participants and clinicians delivering care were aware of assigned interventions. There is no evidence of deviations from intended interventions and intention to treat analysis used. | ||||||||||||
| No missing data. | ||||||||||||
| The methods of measurement are considered appropriate, and there were no differences in the measurement or ascertainment between groups. The assessors were blinded. | ||||||||||||
| The trial protocol reflects the analyses as that were conducted, and it is not thought that the results were from multiple outcome measures or multiple analyses. | ||||||||||||
| The study is judged to be at low risk of bias in all domains for this outcome. | ||||||||||||
| McCullagh 2020 | | | | | | | ||||||
| Allocation sequence was random (computer‐generated) and allocation sequence was concealed. Baseline differences are thought to be compatible with chance. | ||||||||||||
| Both participants and clinicians delivering care were aware of assigned interventions. There is no evidence of deviations from intended interventions and intention to treat analysis used. | ||||||||||||
| No missing data. | ||||||||||||
| The measure is considered appropriate, and there were no differences in the measurement or ascertainment between groups. The assessors were blinded. | ||||||||||||
| The trial protocol reflects the analyses as that were conducted, and it is not thought that the results were from multiple outcome measures or multiple analyses. | ||||||||||||
| The study is judged to be at low risk of bias in all domains for this outcome. | ||||||||||||
| Mudge 2008 | | | | | | | ||||||
| Pseudo‐randomisation, allocation was based on admitting unit and bed availability, and admitting unit was determined by a rotating roster. No evidence of baseline differences in patient characteristics other than those thought to be compatible with chance. | ||||||||||||
| Both participants and clinicians delivering care were aware of assigned interventions. There is no evidence of deviations from intended interventions and intention to treat analysis used. | ||||||||||||
| No missing data. | ||||||||||||
| The method is considered appropriate, and there were no differences in the measurement or ascertainment between groups. The assessors were blinded. | ||||||||||||
| A pre‐specified statistical plan was not found, but it is not thought that the results were from multiple outcome measures or multiple analyses. | ||||||||||||
| The study is judged to be at high risk of bias due to the randomisation process. | ||||||||||||
| Ortiz‐Alonso 2020 | | | | | | | ||||||
| The allocation sequence was based on recruitment blocks of 4‐8 weeks. Activity of daily living (ADL) scores at baseline and admission were significantly lower in the intervention group than the control group, this is thought to be an important prognostic factor and therefore a concern regarding the randomisation process. | ||||||||||||
| Methods were designed to blind participants from group assignments however due to the nature of the intervention and lack of sham intervention the success of this blinding is felt unlikely. Ward staff and research staff were not blinded to the participant's assigned intervention. There were no deviations from the intended interventions due to trial context described and although intention to treat analysis not specified given the lack of deviations it is assumed. | ||||||||||||
| No missing outcome data. | ||||||||||||
| The measure is considered appropriate, and there were no differences in the measurement or ascertainment between groups. The assessors were not blinded, but it is thought that due to the lack of judgement in the outcome, that the knowledge of the intervention did not influence the outcome. | ||||||||||||
| Analysis reflects plan in trial registration and study protocol, and results are not thought to be from multiple outcome measures or multiple analyses. | ||||||||||||
| The study is judged to be at high risk of bias due to the randomisation process. | ||||||||||||
| Pedersen 2019 | | | | | | | ||||||
| Allocation sequence was random (computer‐generated block randomisation), and allocation sequence concealed from the investigators. Participant characteristics were well‐balanced between groups. | ||||||||||||
| Participants and clinicians were aware of the treatment assignments. There was no evidence of deviations from the assigned interventions and an intention to treat approach was used for analysis. | ||||||||||||
| No missing data | ||||||||||||
| The measure is considered appropriate, and there were no differences in the measurement or ascertainment between groups. The assessors were blinded. | ||||||||||||
| The analysis is in accordance with a pre‐specified analysis in a published protocol, and results are not thought to be from multiple outcome measures or multiple analyses. | ||||||||||||
| The study is judged to be at low risk of bias for all domains for this outcome. | ||||||||||||
| Bias | ||||||||||||
|---|---|---|---|---|---|---|---|---|---|---|---|---|
| Study | Randomisation process | Deviations from intended interventions | Missing outcome data | Measurement of the outcome | Selection of the reported results | Overall | ||||||
| Subgroup 2.5.1 Rehabilitation‐related activities | ||||||||||||
| Ekerstad 2017 | | | | | | | ||||||
| Randomisation was based on the availability of beds, and there was no allocation concealment as participants were allocated a ward prior to enrolment. Participant characteristics appeared balanced. | ||||||||||||
| Participants and clinicians delivering care were aware of treatment assignments. There was no evidence of deviations from intended interventions and intention to treat analysis was used. | ||||||||||||
| The timed up and go (TUG) (when accounting for mortality) was available for 74% and 49% of participants in intervention and control groups at hospital discharge respectively. The difference in missing data for the TUG acompared to the activity of daily living data may be due to participants being unable to complete the walking tasks. Therefore a large proportion of missing data is thought to be due to the 'true' value. | ||||||||||||
| The use of the TUG to measure walking performance is considered appropriate and there was no differences in measurement between groups. The assessors were not blinded, and it was therefore considered likely that knowledge of the intervention could influence the outcome, given the likely strong belief in the benefits of the intervention ward. | ||||||||||||
| A detailed pre‐specified statistical plan was not found, but it is not thought that the results were from multiple outcome measures or multiple analyses. | ||||||||||||
| The study is judged to be at high risk of bias due to bias in the measurement of the outcome and bias arising from the randomisation process. | ||||||||||||
| Subgroup 2.5.2 Structured exercise | ||||||||||||
| Hu 2020 | | | | | | | ||||||
| Allocation sequence was random (computer generated random numbers) and sequence concealed (blinded project coordinator allocated participants). Participant characteristics were balanced. | ||||||||||||
| Participants and those delivering the interventions were aware of intervention allocations. There was no evidence of deviations from the intended interventions and as such it is presumed intention to treat analysis was used. | ||||||||||||
| At discharge data was available for 76% of reablement group, (78% of reminder group) and 80% of the control group. Only participants who had complete data (i.e. data collected at baseline, discharge and follow‐up) had outcomes reported. Although missing data is well‐balanced between all three groups, it is considered likely that reason for missing data is related to its true value. | ||||||||||||
| The use of the timed up and go (TUG) is considered appropriate, and there were no differences in the measurement or ascertainment between groups. The assessors were blinded. | ||||||||||||
| A pre‐specified statistical plan was not found, but it is not thought that the results were from multiple outcome measures or multiple analyses. | ||||||||||||
| The study is judged to be at high risk of bias due to missing outcome data. | ||||||||||||
| Killey 2006 | | | | | | | ||||||
| Allocation not random and sequence predictable as based on alternation. There is limited data on participant characteristics, but available data suggests balanced characteristics between groups. | ||||||||||||
| Participants and those delivering the interventions were aware of intervention allocations. There was no evidence of deviations from the intended interventions. Per‐protocol analysis appears to have been used. 2 participants in the intervention group were excluded from analysis as they completed less than 70% of their walks. The 2 participants that were excluded accounted for 7% of the remaining sample, it is therefore considered that there was potential for a significant impact on the results. | ||||||||||||
| Only 71% of intervention and 74% of control group had outcome data. A significant proportion of missing data was related to early discharge from hospital. These participants could be expected to have a higher functional level than those who remained in hospital. However, the missing data was well‐balanced between the two groups. | ||||||||||||
| The total distance able to walk is considered appropriate, and there were no differences in the measurement or ascertainment between groups. The assessors were not blinded, and it was therefore considered likely that knowledge of the intervention could influence the outcome, given the likely strong belief in the benefits of the intervention ward. | ||||||||||||
| A pre‐specified statistical plan was not found, but it is not thought that the results were from multiple outcome measures or multiple analyses. | ||||||||||||
| The study is judged to be at high risk of bias in three domains for this outcome. | ||||||||||||
| Subgroup 2.5.3 Progressive resistance exercise | ||||||||||||
| de Morton 2007 | | | | | | | ||||||
| Allocation of wards was random (coin toss) and the allocating officer unaware of study. Baseline differences between groups were thought to be compatible with chance. | ||||||||||||
| Participants and clinicians delivering care were believed to be aware of treatment assignments. There was no evidence of deviations from intended interventions and intention to treat analysis was used. | ||||||||||||
| After accounting for mortality, at discharge, only 70% in intervention arm and 60% in control arm had timed up and go (TUG) assessed. There is a higher amount of missing data for the TUG than the Barthel Index which may indicate that some of the missing data is due to participants being unable to complete the TUG task. Therefore a proportion of missing data is believed to be due to the 'true' value. | ||||||||||||
| The use of the TUG to measure walking performance is considered appropriate, and there were no differences in the measurement or ascertainment between groups. The assessors were not blinded, and it is considered likely that knowledge of the intervention could influence the outcome, given the likely strong belief in the benefits of the intervention. | ||||||||||||
| A pre‐specified statistical plan was not found, but it is not thought that the results were from multiple outcome measures or multiple analyses. | ||||||||||||
| The study is judged to be at high risk of bias in measurement of the outcome and missing data. | ||||||||||||
| Jones 2006 | | | | | | | ||||||
| Allocation sequence was random (computer generated random numbers). Sequence allocation was not concealed, but performed by a member of staff independent of the enrolment procedures. ). Participant characteristics were balanced between groups and differences compatible with chance. | ||||||||||||
| It is assumed that both participants and clinicians delivering care were aware of assigned interventions. There is no evidence of deviations from intended interventions and intention to treat analysis used. | ||||||||||||
| After accounting for mortality, timed up and go (TUG) data was available for 31% of control group and 51% of intervention group. "39.4% (63/160) were unable to complete the TUG either on admission or on discharge and therefore a change score could not be calculated." Therefore, a large proportion of missing data is due to the 'true' value. | ||||||||||||
| The use of the TUG to measure walking performance is considered appropriate, and there were no differences in the measurement or ascertainment between groups. The assessors were blinded. | ||||||||||||
| A pre‐specified statistical plan was not found, but it is not thought that the results were from multiple outcome measures or multiple analyses. | ||||||||||||
| The study is judged to be at high risk of bias due to missing outcome data. | ||||||||||||
| Pedersen 2019 | | | | | | | ||||||
| Allocation sequence was random (computer‐generated block randomisation), and allocation sequence concealed from the investigators. Participant characteristics were well‐balanced between groups. | ||||||||||||
| Participants and clinicians were aware of the treatment assignments. There was no evidence of deviations from the assigned interventions and an intention to treat approach was used for analysis. | ||||||||||||
| When accounting for mortality only 93% of participants in intervention group and 67% in control group completed measures at discharge. The difference in the proportion of missing data, and that the assessments were carried out home after discharge, it was judged likely that the reasons for missing data may have depended on its true value. | ||||||||||||
| The use of the 4m timed walk for measuring gait speed/walking performance is considered appropriate, and there were no differences in the measurement or ascertainment between groups. The assessors were blinded. | ||||||||||||
| The analysis is in accordance with a pre‐specified analysis in a published protocol, and results are not thought to be from multiple outcome measures or multiple analyses. | ||||||||||||
| The study is judged to be at high risk of bias due to missing outcome data. | ||||||||||||