Erradicación del Helicobacter pylori para la prevención del cáncer gástrico
Información
- DOI:
- https://doi.org/10.1002/14651858.CD005583.pub2Copiar DOI

- Base de datos:
-
- Cochrane Database of Systematic Reviews
- Versión publicada:
-
- 22 julio 2015see what's new
- Tipo:
-
- Intervention
- Etapa:
-
- Review
- Grupo Editorial Cochrane:
-
Grupo Cochrane de Salud digestiva
- Copyright:
-
- Copyright © 2015 The Cochrane Collaboration. Published by John Wiley & Sons, Ltd.
Cifras del artículo
Altmetric:
Citado por:
Autores
Contributions of authors
Conceived and designed the study: all review authors
Analysed and interpreted the data: all review authors
Drafted the review: ACF and YY
Approved the final draft of the review: all review authors
Sources of support
Internal sources
-
McMaster University, Canada.
External sources
-
No sources of support supplied
Declarations of interest
ACF: none known.
DF: none known.
RH: none known.
YY: none known.
PM is the joint co‐ordinating editor of the Cochrane Upper Gastrointestinal and Pancreatic Diseases Group, however editorial decisions about this review were made by the other joint co‐ordinating editor and independent peer reviewers.
Acknowledgements
We thank Drs Jaw‐Town Lin, Mitchell H Gail, Sarah Rhodes and Ms. Marilyn Walsh for their constructive comments on our review.
Version history
| Published | Title | Stage | Authors | Version |
| 2020 Jul 06 | <i>Helicobacter pylori</i> eradication for the prevention of gastric neoplasia | Review | Alexander C Ford, Yuhong Yuan, David Forman, Richard Hunt, Paul Moayyedi | |
| 2015 Jul 22 | <i>Helicobacter pylori</i> eradication for the prevention of gastric neoplasia | Review | Alexander C Ford, David Forman, Richard Hunt, Yuhong Yuan, Paul Moayyedi | |
| 2006 Jan 25 | Helicobacter pylori eradication for the prevention of gastric neoplasia | Protocol | Paul Moayyedi, Richard Hunt, David Forman | |
Differences between protocol and review
The only substantive change from the protocol lies in a slight change in our primary endpoint. The protocol had intended that the systematic review and meta‐analysis focus on the effect of H. pylori eradication therapy in preventing gastric neoplasia in the general population. While the population we have reported on is the same, we did not report the effect of H. pylori eradication therapy on all types of gastric neoplasia, but rather on gastric adenocarcinoma only. This was because only one of the six trials that were eligible for the review reported any cases of gastric neoplasia that were not a gastric adenocarcinoma (Saito 2005). This was a gastric mucosa‐associated lymphoid tissue lymphoma, occurring in a single participant, and was not included in any of our analyses.
Methods > Types of interventions
Although it had been omitted in the protocol, we included the intervention 'RBC triple therapy (RBC plus any two of the following: amoxicillin, macrolide, 5‐nitroimidazole)' because it is a recognised eradication therapy regimen.
Methods > Data synthesis
The protocol did not prespecify the methods used to handle missing data and sensitivity analysis (for example modified intention‐to‐treat approach, complete case analysis, imputation). We amended methods for investigating heterogeneity (for example the cutoff for statistical significance of I2 statistic changed from P less than 0.2 to less than 0.1).
Methods > Subgroup analysis and investigation of heterogeneity
The protocol did not prespecify subgroup analysis 'according to whether trial participants were co‐administered antioxidants or vitamins within the trial'. We added this due to the nature of the design of some of the included RCTs, which were factorial trials.
Keywords
MeSH
Medical Subject Headings (MeSH) Keywords
- *Helicobacter pylori;
- Anti‐Bacterial Agents [*therapeutic use];
- Anti‐Ulcer Agents [therapeutic use];
- Asymptomatic Infections [*therapy];
- Drug Therapy, Combination [adverse effects, methods];
- Helicobacter Infections [*drug therapy];
- Precancerous Conditions [drug therapy];
- Randomized Controlled Trials as Topic;
- Stomach Neoplasms [microbiology, mortality, *prevention & control];
Medical Subject Headings Check Words
Humans;
PICO

Study flow diagram for RCTs

'Risk of bias' graph: review authors' judgements about each 'Risk of bias' item presented as percentages across all included studies.

'Risk of bias' summary: review authors' judgements about each 'Risk of bias' item for each included study.

Comparison 1 H. pylori eradication vs control ‐ main analyses, Outcome 1 Incidence of gastric cancer ‐ modified ITT analysis.
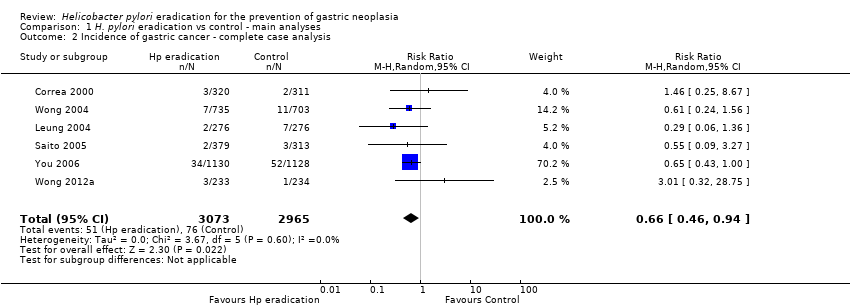
Comparison 1 H. pylori eradication vs control ‐ main analyses, Outcome 2 Incidence of gastric cancer ‐ complete case analysis.

Comparison 1 H. pylori eradication vs control ‐ main analyses, Outcome 3 Death from gastric cancer ‐ modified ITT analysis.

Comparison 1 H. pylori eradication vs control ‐ main analyses, Outcome 4 Death from all causes ‐ modified ITT analysis.

Comparison 1 H. pylori eradication vs control ‐ main analyses, Outcome 5 Incidence of oesophageal squamous cell carcinoma ‐ modified ITT analysis.

Comparison 2 H. pylori eradication vs control ‐ subgroup analysis according to presence or absence of pre‐neoplastic lesions at baseline, Outcome 1 Incidence of gastric cancer according to presence or absence of pre‐neoplastic lesions at baseline.

Comparison 3 H. pylori eradication vs control ‐ subgroup analysis according to use of vitamins or antioxidants, Outcome 1 Incidence of gastric cancer according to use of vitamins or anti‐oxidants.

Comparison 4 H. pylori eradication vs control ‐ sensitivity analyses, Outcome 1 Incidence of gastric cancer ‐ modified ITT analysis substituting the 10‐year follow‐up data from Zhou 2008 with the 5‐year follow‐up data from Leung 2004.
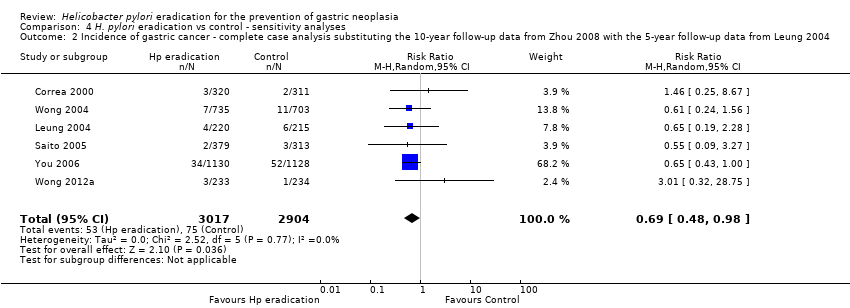
Comparison 4 H. pylori eradication vs control ‐ sensitivity analyses, Outcome 2 Incidence of gastric cancer ‐ complete case analysis substituting the 10‐year follow‐up data from Zhou 2008 with the 5‐year follow‐up data from Leung 2004.

Comparison 4 H. pylori eradication vs control ‐ sensitivity analyses, Outcome 3 Incidence of gastric cancer‐ modified ITT analysis including the two arms of celecoxib from Wong 2012.
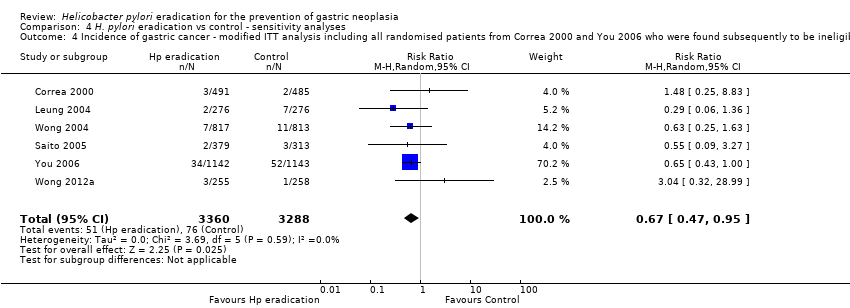
Comparison 4 H. pylori eradication vs control ‐ sensitivity analyses, Outcome 4 Incidence of gastric cancer ‐ modified ITT analysis including all randomised patients from Correa 2000 and You 2006 who were found subsequently to be ineligible or did not receive treatment.

Comparison 4 H. pylori eradication vs control ‐ sensitivity analyses, Outcome 5 Incidence of gastric cancer ‐ missing data imputation based on various assumptions.
| H. pylori eradication therapy compared to control for the prevention of gastric neoplasia in healthy asymptomatic infected individuals | ||||||
| Patient or population: healthy asymptomatic H. pylori‐infected individuals | ||||||
| Outcomes | Illustrative comparative risks* (95% CI) | Relative effect | No of Participants | Quality of the evidence | Comments | |
| Assumed risk | Corresponding risk | |||||
| Control | H. pylori eradication therapy to prevent subsequent gastric cancer | |||||
| Incidence of gastric cancer ‐ modified ITT analysis | 24 per 1000 | 16 per 1000 | RR 0.66 | 6497 | ⊕⊕⊕⊝ | Number needed to treat to benefit was 124 (95% CI 78 to 843) |
| Death from gastric cancer ‐ modified ITT analysis | 16 per 1000 | 11 per 1000 | RR 0.67 | 4475 | ⊕⊕⊕⊝ | |
| Death from all causes ‐ modified ITT analysis | 67 per 1000 | 73 per 1000 | RR 1.09 | 5253 | ⊕⊕⊕⊝ | |
| Incidence of oesophageal squamous cell carcinoma ‐ modified ITT analysis | 1 per 1000 | 2 per 1000 | RR 1.99 | 1630 | ⊕⊕⊕⊝ | |
| Adverse events | See comment | See comment | Not estimable | 0 | See comment | Adverse events were poorly reported across the studies and could not be summarised. |
| *The basis for the assumed risk (e.g. the median control group risk across studies) is provided in footnotes. The corresponding risk (and its 95% confidence interval) is based on the assumed risk in the comparison group and the relative effect of the intervention (and its 95% CI). | ||||||
| GRADE Working Group grades of evidence | ||||||
| 1 As all but one study was conducted in East Asia, it is not possible to assess the effect of searching for and eradicating H. pylori in Western populations. | ||||||
| Outcome or subgroup title | No. of studies | No. of participants | Statistical method | Effect size |
| 1 Incidence of gastric cancer ‐ modified ITT analysis Show forest plot | 6 | 6497 | Risk Ratio (M‐H, Random, 95% CI) | 0.66 [0.46, 0.95] |
| 2 Incidence of gastric cancer ‐ complete case analysis Show forest plot | 6 | 6038 | Risk Ratio (M‐H, Random, 95% CI) | 0.66 [0.46, 0.94] |
| 3 Death from gastric cancer ‐ modified ITT analysis Show forest plot | 3 | 4475 | Risk Ratio (M‐H, Random, 95% CI) | 0.67 [0.40, 1.11] |
| 4 Death from all causes ‐ modified ITT analysis Show forest plot | 4 | 5253 | Risk Ratio (M‐H, Random, 95% CI) | 1.09 [0.86, 1.38] |
| 5 Incidence of oesophageal squamous cell carcinoma ‐ modified ITT analysis Show forest plot | 1 | 1630 | Risk Ratio (M‐H, Random, 95% CI) | 1.99 [0.18, 21.91] |
| Outcome or subgroup title | No. of studies | No. of participants | Statistical method | Effect size |
| 1 Incidence of gastric cancer according to presence or absence of pre‐neoplastic lesions at baseline Show forest plot | 6 | 6481 | Risk Ratio (M‐H, Random, 95% CI) | 0.72 [0.45, 1.17] |
| 1.1 Patients with precancerous lesions | 4 | 3425 | Risk Ratio (M‐H, Random, 95% CI) | 0.86 [0.47, 1.59] |
| 1.2 Patients with out precancerous lesions | 2 | 1812 | Risk Ratio (M‐H, Random, 95% CI) | 0.42 [0.02, 7.69] |
| 1.3 Mixed patients with and without precancerous lesions or ulcer (can't separate) | 2 | 1244 | Risk Ratio (M‐H, Random, 95% CI) | 0.38 [0.12, 1.23] |
| Outcome or subgroup title | No. of studies | No. of participants | Statistical method | Effect size |
| 1 Incidence of gastric cancer according to use of vitamins or anti‐oxidants Show forest plot | 6 | 6497 | Risk Ratio (M‐H, Random, 95% CI) | 0.67 [0.45, 1.01] |
| 1.1 Without antioxidants | 6 | 4160 | Risk Ratio (M‐H, Random, 95% CI) | 0.82 [0.46, 1.45] |
| 1.2 With antioxidants | 2 | 2337 | Risk Ratio (M‐H, Random, 95% CI) | 0.52 [0.31, 0.87] |
| Outcome or subgroup title | No. of studies | No. of participants | Statistical method | Effect size |
| 1 Incidence of gastric cancer ‐ modified ITT analysis substituting the 10‐year follow‐up data from Zhou 2008 with the 5‐year follow‐up data from Leung 2004 Show forest plot | 6 | 6532 | Risk Ratio (M‐H, Random, 95% CI) | 0.69 [0.49, 0.98] |
| 2 Incidence of gastric cancer ‐ complete case analysis substituting the 10‐year follow‐up data from Zhou 2008 with the 5‐year follow‐up data from Leung 2004 Show forest plot | 6 | 5921 | Risk Ratio (M‐H, Random, 95% CI) | 0.69 [0.48, 0.98] |
| 3 Incidence of gastric cancer‐ modified ITT analysis including the two arms of celecoxib from Wong 2012 Show forest plot | 6 | 7008 | Risk Ratio (M‐H, Random, 95% CI) | 0.69 [0.48, 0.97] |
| 4 Incidence of gastric cancer ‐ modified ITT analysis including all randomised patients from Correa 2000 and You 2006 who were found subsequently to be ineligible or did not receive treatment Show forest plot | 6 | 6648 | Risk Ratio (M‐H, Random, 95% CI) | 0.67 [0.47, 0.95] |
| 5 Incidence of gastric cancer ‐ missing data imputation based on various assumptions Show forest plot | 6 | Risk Ratio (M‐H, Random, 95% CI) | Subtotals only | |
| 5.1 Assuming incidence of gastric cancer for missing participants in both arms same as observed in the trial control arm | 6 | 6497 | Risk Ratio (M‐H, Random, 95% CI) | 0.66 [0.47, 0.94] |
| 5.2 Assuming incidence of gastric cancer for missing participants in treatment arm same as observed in the trial control arm, but no new gastric cancer cases in the control arm among those with missing data | 6 | 6497 | Risk Ratio (M‐H, Random, 95% CI) | 0.69 [0.48, 0.98] |