Effect of partogram use on outcomes for women in spontaneous labour at term
Referencias
References to studies included in this review
References to studies excluded from this review
References to studies awaiting assessment
Additional references
Characteristics of studies
Characteristics of included studies [ordered by study ID]
| Methods | Prospective randomised clinical trial. Random allocation by sealed, opaque envelopes. | |
| Participants | 928 primigravid women from the North West of England, with uncomplicated pregnancies who presented in spontaneous labour at term. | |
| Interventions | Women were randomised to have their progress of labour recorded on a partogram with an action line 2, 3 or 4 hours to the right of the alert line. | |
| Outcomes | Caesarean section rate, maternal satisfaction, instrumental delivery rate, need for augmentation, randomisation to delivery interval, use of epidural, cord blood gas analysis, blood loss > 500 ml, number of vaginal examinations, Apgar score, admission to special care baby unit. | |
| Notes | Maternal satisfaction was only assessed in a sub‐set of women, i.e. all women recruited over a prespecified 12 month period (n = 615). . | |
| Risk of bias | ||
| Bias | Authors' judgement | Support for judgement |
| Adequate sequence generation? | Low risk | Table of random numbers. |
| Allocation concealment? | Low risk | Consecutively numbered, sealed, opaque envelopes. |
| Blinding? | High risk | Not feasible. |
| Blinding? | High risk | |
| Blinding? | High risk | |
| Incomplete outcome data addressed? | Low risk | Small loss to follow up after randomisation (less than 1% attrition) for outcomes measured in labour. There were higher attrition for the maternal satisfaction outcomes measured in the postnatal period. |
| Free of other bias? | Unclear risk | 10% (who were otherwise eligible) were not approached (overall, 57% of eligible women were randomised). |
| Methods | Prospective randomised clinical trial. Random allocation by sealed, opaque envelopes. | |
| Participants | 2975 primigravid women from the North West of England, with uncomplicated pregnancies, in spontaneous labour at term. | |
| Interventions | Women were randomised to have their progress of labour recorded on a partogram with an action line 2 or 4 hours to the right of the alert line. | |
| Outcomes | Outcomes were stratified according to intended place of birth (midwife led unit or obstetric unit). | |
| Notes | ||
| Risk of bias | ||
| Bias | Authors' judgement | Support for judgement |
| Adequate sequence generation? | Low risk | Table of random numbers. Randomisation stratified by intended place of birth (2 participating units). |
| Allocation concealment? | Low risk | Consecutively numbered, sealed, opaque envelopes. |
| Blinding? | High risk | Not feasible. |
| Blinding? | High risk | |
| Blinding? | High risk | |
| Incomplete outcome data addressed? | Low risk | Less than 1% attrition after randomisation. |
| Free of other bias? | Unclear risk | Large numbers of women who were otherwise eligible were not approached to participate. The numbers not approached varied depending on the recruiting unit, 26% not approached in the midwifery and 61% in the delivery unit. |
| Methods | Prospective randomised clinical trial. Random allocation by sealed, opaque envelopes. | |
| Participants | 694 healthy nulliparous women from South Africa, who were in active spontaneous labour, at term, with a healthy singleton pregnancy and cephalic presentation. | |
| Interventions | Women were randomised to either aggressive or expectant management protocols. Aggressive management entailed using a single line partogram, a vaginal examination every 2 hours and use of oxytocin if the line was crossed. Expectant management entailed using a 2‐line partogram, with the alert line and a parallel action line 4 hours to the right, with a vaginal examination every 4 hours. If the action line was reached, oxytocin was started. | |
| Outcomes | Caesarean section rate, operative deliveries, oxytocin use, received analgesia, Apgar score, perinatal death. | |
| Notes | ||
| Risk of bias | ||
| Bias | Authors' judgement | Support for judgement |
| Adequate sequence generation? | Low risk | Computer‐generated list of random numbers. |
| Allocation concealment? | Low risk | Sealed, opaque envelopes. |
| Blinding? | High risk | |
| Blinding? | High risk | |
| Blinding? | High risk | |
| Incomplete outcome data addressed? | Low risk | Low attrition after randomisation (less than 1%). Where women did not receive the allocated intervention, there was intention‐to‐treat analyses. |
| Free of other bias? | Low risk | Recruitment stopped early due to funding constraints. |
| Methods | Prospective study in which women 'at random' were distributed in 1 of 2 groups. | |
| Participants | 434 women in Mexico, with term pregnancies who presented in labour (cervix 2 cm or more dilated) with live, singleton, cephalic presentation. | |
| Interventions | One group had their labour managed according to the Friedman partogram and the other had labour managed using a non‐graphic, descriptive record. | |
| Outcomes | Caesarean section, forceps delivery, normal delivery, Apgar score. | |
| Notes | This study was translated into English. | |
| Risk of bias | ||
| Bias | Authors' judgement | Support for judgement |
| Adequate sequence generation? | Unclear risk | Quasi‐randomised study. No information on how randomisation was achieved. |
| Allocation concealment? | Unclear risk | No information on how women were allocated to groups, not clear that group allocation was truly random. |
| Blinding? | High risk | |
| Blinding? | High risk | |
| Blinding? | High risk | |
| Incomplete outcome data addressed? | Low risk | No apparent loss to follow up. |
| Free of other bias? | Unclear risk | Very little information on study methods was provided. |
| Methods | Prospective randomised clinical trial. Computerised allocation, by telephone. | |
| Participants | 1932 primiparous women, with uncomplicated pregnancies at term, with contractions every 3‐5 minutes and cervix at least 3 cm dilated, in Toronto, Canada. Outcomes were stratified according to whether labour was spontaneous or induced. Only data from women not induced were included (n = 1156). | |
| Interventions | Women were randomised to 1 of 2 groups: the standard group, who had the progress of labour charted in written notes, or the partogram group, whose progress in labour was recorded using a bedside graphical partogram as well as written notes. | |
| Outcomes | Rate of caesarean section, operative vaginal delivery, spontaneous vaginal delivery, duration of first stage of labour, duration of second stage of labour, number of vaginal examinations, epidural analgesia use, artificial rupture of membranes, oxytocin augmentation, evaluation for non‐reassuring fetal heart tracing, maternal and neonatal morbidity. | |
| Notes | Only data from those in spontaneous labour are included in the review. | |
| Risk of bias | ||
| Bias | Authors' judgement | Support for judgement |
| Adequate sequence generation? | Low risk | Stratified randomisation by off‐site computerised randomisation service. |
| Allocation concealment? | Low risk | By telephone to off‐site service. |
| Blinding? | High risk | Not feasible. Bedside charts. |
| Blinding? | High risk | |
| Blinding? | High risk | |
| Incomplete outcome data addressed? | Low risk | No missing data apparent. |
| Free of other bias? | Unclear risk | No information on the number of women approached or the numbers of eligible women declining participation. |
Characteristics of excluded studies [ordered by study ID]
| Study | Reason for exclusion |
| A report of a hypothetical study. No research conducted and no data presented. | |
| This was a cluster‐randomised trial in which midwives were randomised to receive training, alongside using the partogram. The intervention was therefore the training and not the partogram. There is no description of what midwives in the control group received. | |
| This study was presented in abstract form only and lacked detail. It was particularly unclear whether participants were in spontaneous labour and whether they were at term. Attempts were made to contact the trial author, without success. | |
| It was unclear from the presentation of data which outcome data were from women in spontaneous labour. We were unable to contact any of the authors. | |
| This was a crossover trial comparing two partographs, one which included a latent phase and one which did not. In this study all physicians posted to the labour ward used the first partograph (composite or simplified depending on the random allocation) for 10 days. After one weeks break, all physicians used the second partograph. Study participants were therefore physicians and not women. |
Characteristics of studies awaiting assessment [ordered by study ID]
| Methods | This was an RCT and a before and after trial, comparing routine recording of cervical dilatation over time versus an experimental group where individualized reference ranges were superimposed. |
| Participants | 4812 participants (nulliparous, with live singleton cephalic presenting babies of at least 35 weeks gestation) in 7 centres. |
| Interventions | Computerised labour curve with individualised reference range. |
| Outcomes | Caesarean section rate. |
| Notes | This study was identified when the review was nearing completion and will be assessed for inclusion when the review is updated. |
| Methods | This study was not designed as an RCT. However, part of the study, i.e. the 5 month period where centres where randomised either to the first 5 months of partogram use or the same 5 month period pre‐implementation, is essentially equivalent to a cluster RCT. Published data relating to this part of the trial were not available. Despite contacting two members of the original research team, we have not, so far, been able to obtain such data. |
| Participants | 35,484 women in South East Asia. All labours over 34 weeks gestation, including inductions, malpresentations, and multiple pregnancies were included. |
| Interventions | Partogram, intensive teaching of midwives and medical staff, presence of WHO consultant |
| Outcomes | Caesarean section, labour > 18 hours, duration of labour, labour augmented, postpartum sepsis. |
| Notes |
RCT: randomised controlled trial
Data and analyses
| Outcome or subgroup title | No. of studies | No. of participants | Statistical method | Effect size |
| 1 Casearean section (overall) Show forest plot | 2 | 1590 | Risk Ratio (M‐H, Random, 95% CI) | 0.64 [0.24, 1.70] |
| Analysis 1.1  Comparison 1 Partogram versus no partogram (studies carried out in high‐ and low‐resource settings), Outcome 1 Casearean section (overall). | ||||
| 1.1 Low‐resource setting | 1 | 434 | Risk Ratio (M‐H, Random, 95% CI) | 0.38 [0.24, 0.61] |
| 1.2 High‐resource setting | 1 | 1156 | Risk Ratio (M‐H, Random, 95% CI) | 1.03 [0.82, 1.28] |
| 2 Apgar score less than 7 at 5 minutes Show forest plot | 2 | 1596 | Risk Ratio (M‐H, Random, 95% CI) | 0.77 [0.29, 2.06] |
| Analysis 1.2  Comparison 1 Partogram versus no partogram (studies carried out in high‐ and low‐resource settings), Outcome 2 Apgar score less than 7 at 5 minutes. | ||||
| 2.1 Low‐resource setting | 1 | 440 | Risk Ratio (M‐H, Random, 95% CI) | 0.46 [0.04, 5.00] |
| 2.2 High‐resource setting | 1 | 1156 | Risk Ratio (M‐H, Random, 95% CI) | 0.85 [0.29, 2.52] |
| 3 Epidural analgesia Show forest plot | 1 | 1156 | Risk Ratio (M‐H, Fixed, 95% CI) | 1.01 [0.98, 1.05] |
| Analysis 1.3  Comparison 1 Partogram versus no partogram (studies carried out in high‐ and low‐resource settings), Outcome 3 Epidural analgesia. | ||||
| 3.1 High‐resource setting | 1 | 1156 | Risk Ratio (M‐H, Fixed, 95% CI) | 1.01 [0.98, 1.05] |
| 4 Instrumental vaginal delivery Show forest plot | 2 | 1590 | Risk Ratio (M‐H, Fixed, 95% CI) | 1.00 [0.85, 1.17] |
| Analysis 1.4  Comparison 1 Partogram versus no partogram (studies carried out in high‐ and low‐resource settings), Outcome 4 Instrumental vaginal delivery. | ||||
| 4.1 Low‐resource setting | 1 | 434 | Risk Ratio (M‐H, Fixed, 95% CI) | 1.17 [0.79, 1.74] |
| 4.2 High‐resource setting | 1 | 1156 | Risk Ratio (M‐H, Fixed, 95% CI) | 0.97 [0.81, 1.15] |
| 5 Duration of first stage of labour Show forest plot | 1 | 1156 | Mean Difference (IV, Fixed, 95% CI) | 0.0 [‐0.21, 0.21] |
| Analysis 1.5  Comparison 1 Partogram versus no partogram (studies carried out in high‐ and low‐resource settings), Outcome 5 Duration of first stage of labour. | ||||
| 5.1 High‐resource setting | 1 | 1156 | Mean Difference (IV, Fixed, 95% CI) | 0.0 [‐0.21, 0.21] |
| 6 Duration of second stage of labour Show forest plot | 1 | 1156 | Mean Difference (IV, Fixed, 95% CI) | 0.0 [‐0.21, 0.21] |
| Analysis 1.6  Comparison 1 Partogram versus no partogram (studies carried out in high‐ and low‐resource settings), Outcome 6 Duration of second stage of labour. | ||||
| 6.1 High‐resource setting | 1 | 1156 | Mean Difference (IV, Fixed, 95% CI) | 0.0 [‐0.21, 0.21] |
| 7 Number of vaginal examinations Show forest plot | 1 | 1156 | Mean Difference (IV, Fixed, 95% CI) | 0.0 [0.0, 0.0] |
| Analysis 1.7  Comparison 1 Partogram versus no partogram (studies carried out in high‐ and low‐resource settings), Outcome 7 Number of vaginal examinations. | ||||
| 7.1 High‐resource setting | 1 | 1156 | Mean Difference (IV, Fixed, 95% CI) | 0.0 [0.0, 0.0] |
| 8 Admission to special care nursery Show forest plot | 1 | 1156 | Risk Ratio (M‐H, Fixed, 95% CI) | 0.94 [0.51, 1.75] |
| Analysis 1.8  Comparison 1 Partogram versus no partogram (studies carried out in high‐ and low‐resource settings), Outcome 8 Admission to special care nursery. | ||||
| 8.1 High‐resource setting | 1 | 1156 | Risk Ratio (M‐H, Fixed, 95% CI) | 0.94 [0.51, 1.75] |
| 9 Oxytocin augmentation Show forest plot | 1 | 1156 | Risk Ratio (M‐H, Fixed, 95% CI) | 1.02 [0.95, 1.10] |
| Analysis 1.9  Comparison 1 Partogram versus no partogram (studies carried out in high‐ and low‐resource settings), Outcome 9 Oxytocin augmentation. | ||||
| 9.1 High‐resource setting | 1 | 1156 | Risk Ratio (M‐H, Fixed, 95% CI) | 1.02 [0.95, 1.10] |
| 10 Performance of artificial rupture of membranes during labour Show forest plot | 1 | 1156 | Risk Ratio (M‐H, Fixed, 95% CI) | 0.99 [0.88, 1.11] |
| Analysis 1.10  Comparison 1 Partogram versus no partogram (studies carried out in high‐ and low‐resource settings), Outcome 10 Performance of artificial rupture of membranes during labour. | ||||
| 10.1 High‐resource setting | 1 | 1156 | Risk Ratio (M‐H, Fixed, 95% CI) | 0.99 [0.88, 1.11] |
| 11 Antibiotic use Show forest plot | 1 | 1156 | Risk Ratio (M‐H, Fixed, 95% CI) | 1.23 [0.88, 1.73] |
| Analysis 1.11  Comparison 1 Partogram versus no partogram (studies carried out in high‐ and low‐resource settings), Outcome 11 Antibiotic use. | ||||
| 11.1 High‐resource setting | 1 | 1156 | Risk Ratio (M‐H, Fixed, 95% CI) | 1.23 [0.88, 1.73] |
| Outcome or subgroup title | No. of studies | No. of participants | Statistical method | Effect size |
| 1 Caesarean section (overall) Show forest plot | 2 | 3601 | Risk Ratio (M‐H, Random, 95% CI) | 1.06 [0.85, 1.32] |
| Analysis 2.1  Comparison 2 Partogram with 2‐hour action line versus partogram with 4‐hour action line (studies carried out in a high‐resource setting), Outcome 1 Caesarean section (overall). | ||||
| 2 Caesarean section (distress) Show forest plot | 2 | 3601 | Risk Ratio (M‐H, Fixed, 95% CI) | 1.30 [0.86, 1.96] |
| Analysis 2.2  Comparison 2 Partogram with 2‐hour action line versus partogram with 4‐hour action line (studies carried out in a high‐resource setting), Outcome 2 Caesarean section (distress). | ||||
| 3 Caesarean section (delay) Show forest plot | 2 | 3601 | Risk Ratio (M‐H, Fixed, 95% CI) | 0.98 [0.77, 1.25] |
| Analysis 2.3  Comparison 2 Partogram with 2‐hour action line versus partogram with 4‐hour action line (studies carried out in a high‐resource setting), Outcome 3 Caesarean section (delay). | ||||
| 4 Instrumental vaginal delivery Show forest plot | 2 | 3601 | Risk Ratio (M‐H, Fixed, 95% CI) | 0.91 [0.80, 1.03] |
| Analysis 2.4  Comparison 2 Partogram with 2‐hour action line versus partogram with 4‐hour action line (studies carried out in a high‐resource setting), Outcome 4 Instrumental vaginal delivery. | ||||
| 5 Serious maternal morbidity or death Show forest plot | 2 | 3601 | Odds Ratio (M‐H, Fixed, 95% CI) | 0.0 [0.0, 0.0] |
| Analysis 2.5  Comparison 2 Partogram with 2‐hour action line versus partogram with 4‐hour action line (studies carried out in a high‐resource setting), Outcome 5 Serious maternal morbidity or death. | ||||
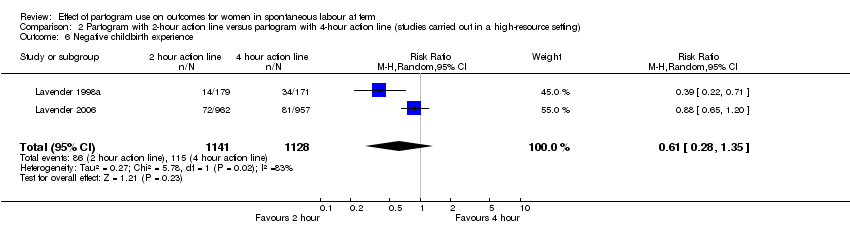
| 6 Negative childbirth experience Show forest plot | 2 | 2269 | Risk Ratio (M‐H, Random, 95% CI) | 0.61 [0.28, 1.35] |
| Analysis 2.6  Comparison 2 Partogram with 2‐hour action line versus partogram with 4‐hour action line (studies carried out in a high‐resource setting), Outcome 6 Negative childbirth experience. | ||||
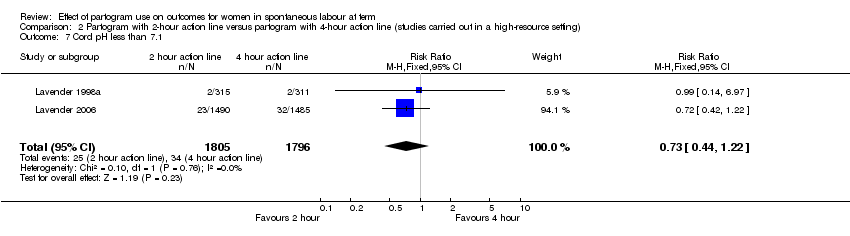
| 7 Cord pH less than 7.1 Show forest plot | 2 | 3601 | Risk Ratio (M‐H, Fixed, 95% CI) | 0.73 [0.44, 1.22] |
| Analysis 2.7  Comparison 2 Partogram with 2‐hour action line versus partogram with 4‐hour action line (studies carried out in a high‐resource setting), Outcome 7 Cord pH less than 7.1. | ||||
| 8 Apgar score less than 7 at 5 minutes Show forest plot | 2 | 3601 | Risk Ratio (M‐H, Fixed, 95% CI) | 0.82 [0.50, 1.35] |
| Analysis 2.8  Comparison 2 Partogram with 2‐hour action line versus partogram with 4‐hour action line (studies carried out in a high‐resource setting), Outcome 8 Apgar score less than 7 at 5 minutes. | ||||
| 9 Admission to special care nursery Show forest plot | 2 | 3601 | Risk Ratio (M‐H, Fixed, 95% CI) | 0.78 [0.46, 1.31] |
| Analysis 2.9  Comparison 2 Partogram with 2‐hour action line versus partogram with 4‐hour action line (studies carried out in a high‐resource setting), Outcome 9 Admission to special care nursery. | ||||
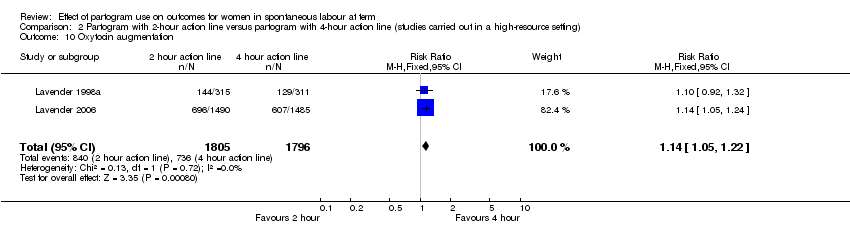
| 10 Oxytocin augmentation Show forest plot | 2 | 3601 | Risk Ratio (M‐H, Fixed, 95% CI) | 1.14 [1.05, 1.22] |
| Analysis 2.10  Comparison 2 Partogram with 2‐hour action line versus partogram with 4‐hour action line (studies carried out in a high‐resource setting), Outcome 10 Oxytocin augmentation. | ||||
| 11 Performance of artificial rupture of the membranes during labour Show forest plot | 2 | 3601 | Risk Ratio (M‐H, Fixed, 95% CI) | 1.07 [0.99, 1.15] |
| Analysis 2.11  Comparison 2 Partogram with 2‐hour action line versus partogram with 4‐hour action line (studies carried out in a high‐resource setting), Outcome 11 Performance of artificial rupture of the membranes during labour. | ||||
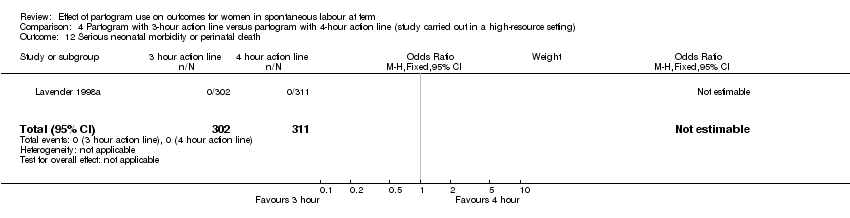
| 12 Serious neonatal morbidity or perinatal death Show forest plot | 2 | 3601 | Odds Ratio (M‐H, Fixed, 95% CI) | 0.0 [0.0, 0.0] |
| Analysis 2.12  Comparison 2 Partogram with 2‐hour action line versus partogram with 4‐hour action line (studies carried out in a high‐resource setting), Outcome 12 Serious neonatal morbidity or perinatal death. | ||||
| 13 Blood loss > 500 ml Show forest plot | 2 | 3601 | Risk Ratio (M‐H, Fixed, 95% CI) | 1.07 [0.90, 1.26] |
| Analysis 2.13  Comparison 2 Partogram with 2‐hour action line versus partogram with 4‐hour action line (studies carried out in a high‐resource setting), Outcome 13 Blood loss > 500 ml. | ||||
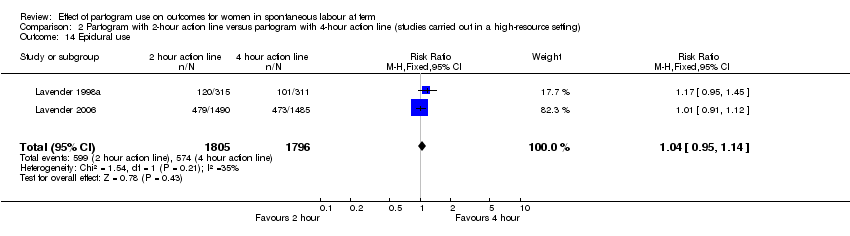
| 14 Epidural use Show forest plot | 2 | 3601 | Risk Ratio (M‐H, Fixed, 95% CI) | 1.04 [0.95, 1.14] |
| Analysis 2.14  Comparison 2 Partogram with 2‐hour action line versus partogram with 4‐hour action line (studies carried out in a high‐resource setting), Outcome 14 Epidural use. | ||||
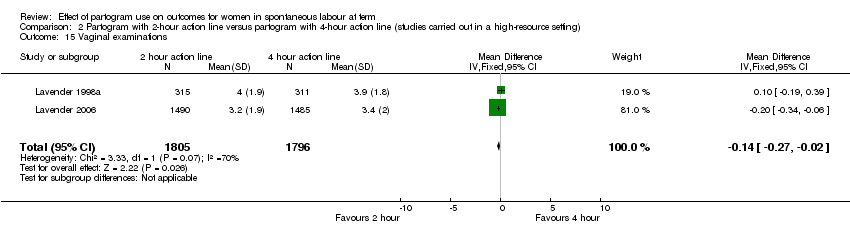
| 15 Vaginal examinations Show forest plot | 2 | 3601 | Mean Difference (IV, Fixed, 95% CI) | ‐0.14 [‐0.27, ‐0.02] |
| Analysis 2.15  Comparison 2 Partogram with 2‐hour action line versus partogram with 4‐hour action line (studies carried out in a high‐resource setting), Outcome 15 Vaginal examinations. | ||||
| Outcome or subgroup title | No. of studies | No. of participants | Statistical method | Effect size |
| 1 Caesarean section (overall) Show forest plot | 1 | 617 | Risk Ratio (M‐H, Fixed, 95% CI) | 0.78 [0.51, 1.18] |
| Analysis 3.1  Comparison 3 Partogram with 2‐hour action line versus partogram with 3‐hour action line (study carried out in a high‐resource setting), Outcome 1 Caesarean section (overall). | ||||
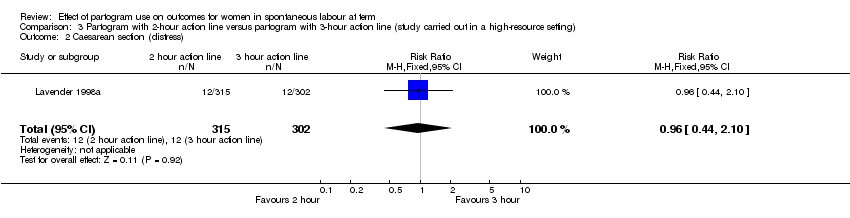
| 2 Caesarean section (distress) Show forest plot | 1 | 617 | Risk Ratio (M‐H, Fixed, 95% CI) | 0.96 [0.44, 2.10] |
| Analysis 3.2  Comparison 3 Partogram with 2‐hour action line versus partogram with 3‐hour action line (study carried out in a high‐resource setting), Outcome 2 Caesarean section (distress). | ||||
| 3 Caesarean section (delay) Show forest plot | 1 | 617 | Risk Ratio (M‐H, Fixed, 95% CI) | 0.71 [0.42, 1.19] |
| Analysis 3.3  Comparison 3 Partogram with 2‐hour action line versus partogram with 3‐hour action line (study carried out in a high‐resource setting), Outcome 3 Caesarean section (delay). | ||||
| 4 Instrumental vaginal delivery Show forest plot | 1 | 617 | Risk Ratio (M‐H, Fixed, 95% CI) | 0.93 [0.69, 1.26] |
| Analysis 3.4  Comparison 3 Partogram with 2‐hour action line versus partogram with 3‐hour action line (study carried out in a high‐resource setting), Outcome 4 Instrumental vaginal delivery. | ||||
| 5 Serious maternal morbidity or death Show forest plot | 1 | 617 | Odds Ratio (M‐H, Fixed, 95% CI) | 0.0 [0.0, 0.0] |
| Analysis 3.5  Comparison 3 Partogram with 2‐hour action line versus partogram with 3‐hour action line (study carried out in a high‐resource setting), Outcome 5 Serious maternal morbidity or death. | ||||
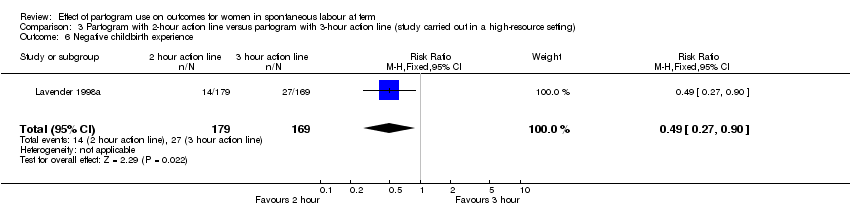
| 6 Negative childbirth experience Show forest plot | 1 | 348 | Risk Ratio (M‐H, Fixed, 95% CI) | 0.49 [0.27, 0.90] |
| Analysis 3.6  Comparison 3 Partogram with 2‐hour action line versus partogram with 3‐hour action line (study carried out in a high‐resource setting), Outcome 6 Negative childbirth experience. | ||||
| 7 Cord pH less than 7.1 Show forest plot | 1 | 617 | Risk Ratio (M‐H, Fixed, 95% CI) | 0.38 [0.07, 1.96] |
| Analysis 3.7  Comparison 3 Partogram with 2‐hour action line versus partogram with 3‐hour action line (study carried out in a high‐resource setting), Outcome 7 Cord pH less than 7.1. | ||||
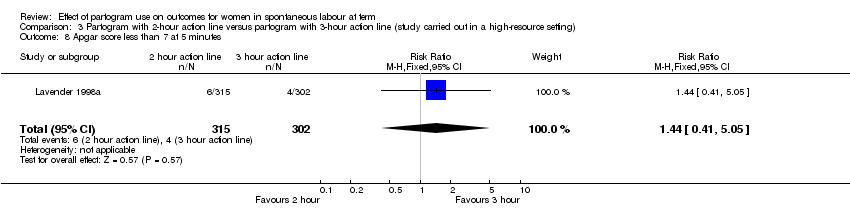
| 8 Apgar score less than 7 at 5 minutes Show forest plot | 1 | 617 | Risk Ratio (M‐H, Fixed, 95% CI) | 1.44 [0.41, 5.05] |
| Analysis 3.8  Comparison 3 Partogram with 2‐hour action line versus partogram with 3‐hour action line (study carried out in a high‐resource setting), Outcome 8 Apgar score less than 7 at 5 minutes. | ||||
| 9 Admission to special care nursery Show forest plot | 1 | 617 | Risk Ratio (M‐H, Fixed, 95% CI) | 3.83 [0.43, 34.12] |
| Analysis 3.9  Comparison 3 Partogram with 2‐hour action line versus partogram with 3‐hour action line (study carried out in a high‐resource setting), Outcome 9 Admission to special care nursery. | ||||
| 10 Oxytocin augmentation Show forest plot | 1 | 617 | Risk Ratio (M‐H, Fixed, 95% CI) | 1.02 [0.85, 1.21] |
| Analysis 3.10  Comparison 3 Partogram with 2‐hour action line versus partogram with 3‐hour action line (study carried out in a high‐resource setting), Outcome 10 Oxytocin augmentation. | ||||
| 11 Performance of artificial rupture of membranes during labour Show forest plot | 1 | 617 | Risk Ratio (M‐H, Fixed, 95% CI) | 0.94 [0.77, 1.15] |
| Analysis 3.11  Comparison 3 Partogram with 2‐hour action line versus partogram with 3‐hour action line (study carried out in a high‐resource setting), Outcome 11 Performance of artificial rupture of membranes during labour. | ||||
| 12 Serious neonatal morbidity or perinatal death Show forest plot | 1 | 617 | Odds Ratio (M‐H, Fixed, 95% CI) | 0.0 [0.0, 0.0] |
| Analysis 3.12  Comparison 3 Partogram with 2‐hour action line versus partogram with 3‐hour action line (study carried out in a high‐resource setting), Outcome 12 Serious neonatal morbidity or perinatal death. | ||||
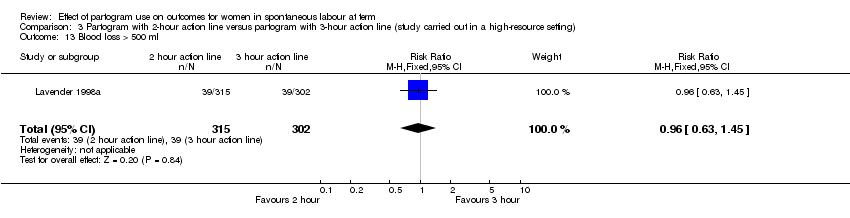
| 13 Blood loss > 500 ml Show forest plot | 1 | 617 | Risk Ratio (M‐H, Fixed, 95% CI) | 0.96 [0.63, 1.45] |
| Analysis 3.13  Comparison 3 Partogram with 2‐hour action line versus partogram with 3‐hour action line (study carried out in a high‐resource setting), Outcome 13 Blood loss > 500 ml. | ||||
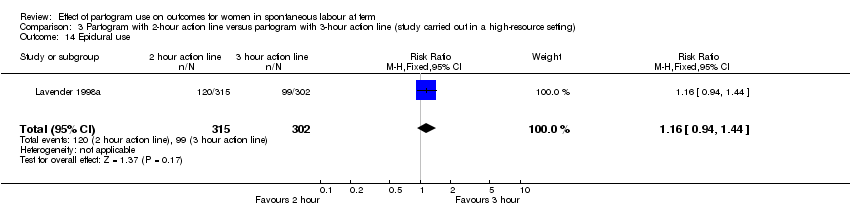
| 14 Epidural use Show forest plot | 1 | 617 | Risk Ratio (M‐H, Fixed, 95% CI) | 1.16 [0.94, 1.44] |
| Analysis 3.14  Comparison 3 Partogram with 2‐hour action line versus partogram with 3‐hour action line (study carried out in a high‐resource setting), Outcome 14 Epidural use. | ||||
| 15 Vaginal examinations Show forest plot | 1 | 617 | Mean Difference (IV, Fixed, 95% CI) | 0.0 [‐0.29, 0.29] |
| Analysis 3.15  Comparison 3 Partogram with 2‐hour action line versus partogram with 3‐hour action line (study carried out in a high‐resource setting), Outcome 15 Vaginal examinations. | ||||
| Outcome or subgroup title | No. of studies | No. of participants | Statistical method | Effect size |
| 1 Caesarean section (overall) Show forest plot | 1 | 613 | Risk Ratio (M‐H, Fixed, 95% CI) | 1.70 [1.07, 2.70] |
| Analysis 4.1  Comparison 4 Partogram with 3‐hour action line versus partogram with 4‐hour action line (study carried out in a high‐resource setting), Outcome 1 Caesarean section (overall). | ||||
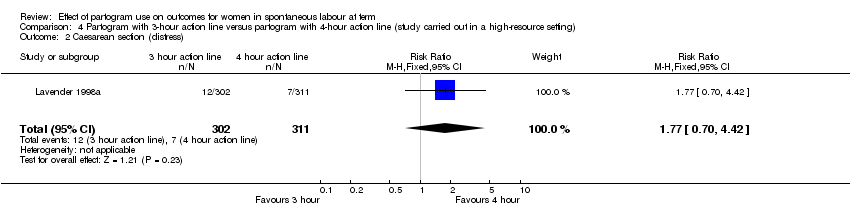
| 2 Caesarean section (distress) Show forest plot | 1 | 613 | Risk Ratio (M‐H, Fixed, 95% CI) | 1.77 [0.70, 4.42] |
| Analysis 4.2  Comparison 4 Partogram with 3‐hour action line versus partogram with 4‐hour action line (study carried out in a high‐resource setting), Outcome 2 Caesarean section (distress). | ||||
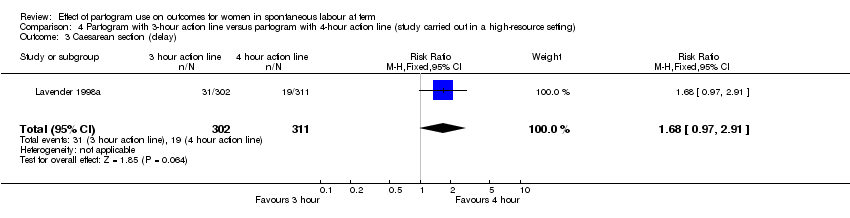
| 3 Caesarean section (delay) Show forest plot | 1 | 613 | Risk Ratio (M‐H, Fixed, 95% CI) | 1.68 [0.97, 2.91] |
| Analysis 4.3  Comparison 4 Partogram with 3‐hour action line versus partogram with 4‐hour action line (study carried out in a high‐resource setting), Outcome 3 Caesarean section (delay). | ||||
| 4 Instrumental vaginal delivery Show forest plot | 1 | 613 | Risk Ratio (M‐H, Fixed, 95% CI) | 0.96 [0.72, 1.28] |
| Analysis 4.4  Comparison 4 Partogram with 3‐hour action line versus partogram with 4‐hour action line (study carried out in a high‐resource setting), Outcome 4 Instrumental vaginal delivery. | ||||
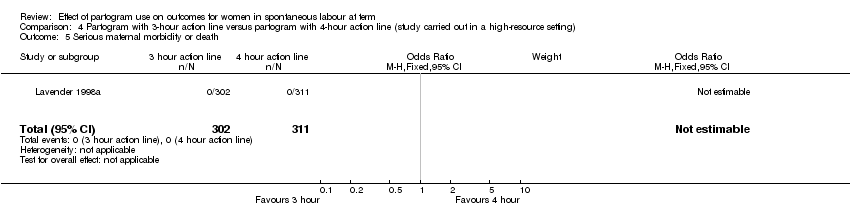
| 5 Serious maternal morbidity or death Show forest plot | 1 | 613 | Odds Ratio (M‐H, Fixed, 95% CI) | 0.0 [0.0, 0.0] |
| Analysis 4.5  Comparison 4 Partogram with 3‐hour action line versus partogram with 4‐hour action line (study carried out in a high‐resource setting), Outcome 5 Serious maternal morbidity or death. | ||||
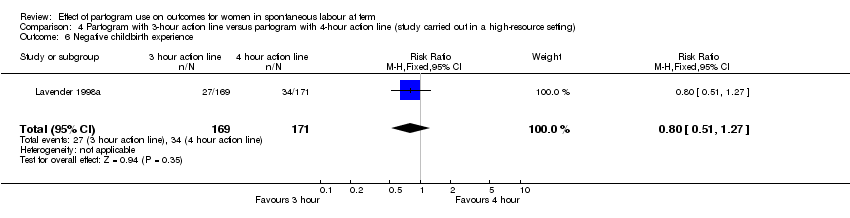
| 6 Negative childbirth experience Show forest plot | 1 | 340 | Risk Ratio (M‐H, Fixed, 95% CI) | 0.80 [0.51, 1.27] |
| Analysis 4.6  Comparison 4 Partogram with 3‐hour action line versus partogram with 4‐hour action line (study carried out in a high‐resource setting), Outcome 6 Negative childbirth experience. | ||||
| 7 Cord pH less than 7.1 Show forest plot | 1 | 613 | Risk Ratio (M‐H, Fixed, 95% CI) | 2.57 [0.50, 13.17] |
| Analysis 4.7  Comparison 4 Partogram with 3‐hour action line versus partogram with 4‐hour action line (study carried out in a high‐resource setting), Outcome 7 Cord pH less than 7.1. | ||||
| 8 Apgar score less than 7 at 5 minutes Show forest plot | 1 | 613 | Risk Ratio (M‐H, Fixed, 95% CI) | 0.82 [0.22, 3.04] |
| Analysis 4.8  Comparison 4 Partogram with 3‐hour action line versus partogram with 4‐hour action line (study carried out in a high‐resource setting), Outcome 8 Apgar score less than 7 at 5 minutes. | ||||
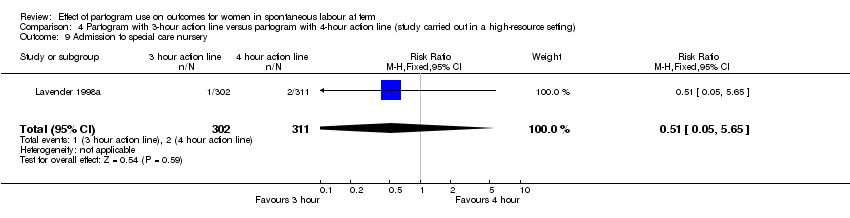
| 9 Admission to special care nursery Show forest plot | 1 | 613 | Risk Ratio (M‐H, Fixed, 95% CI) | 0.51 [0.05, 5.65] |
| Analysis 4.9  Comparison 4 Partogram with 3‐hour action line versus partogram with 4‐hour action line (study carried out in a high‐resource setting), Outcome 9 Admission to special care nursery. | ||||
| 10 Oxytocin augmentation Show forest plot | 1 | 613 | Risk Ratio (M‐H, Fixed, 95% CI) | 1.09 [0.91, 1.30] |
| Analysis 4.10  Comparison 4 Partogram with 3‐hour action line versus partogram with 4‐hour action line (study carried out in a high‐resource setting), Outcome 10 Oxytocin augmentation. | ||||
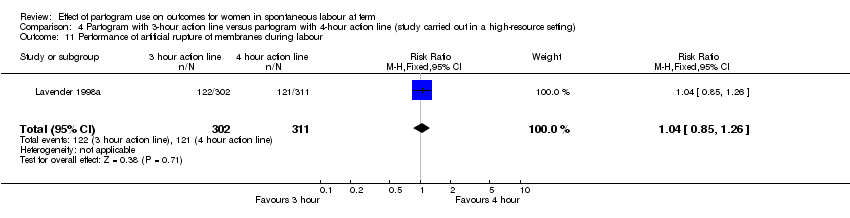
| 11 Performance of artificial rupture of membranes during labour Show forest plot | 1 | 613 | Risk Ratio (M‐H, Fixed, 95% CI) | 1.04 [0.85, 1.26] |
| Analysis 4.11  Comparison 4 Partogram with 3‐hour action line versus partogram with 4‐hour action line (study carried out in a high‐resource setting), Outcome 11 Performance of artificial rupture of membranes during labour. | ||||
| 12 Serious neonatal morbidity or perinatal death Show forest plot | 1 | 613 | Odds Ratio (M‐H, Fixed, 95% CI) | 0.0 [0.0, 0.0] |
| Analysis 4.12  Comparison 4 Partogram with 3‐hour action line versus partogram with 4‐hour action line (study carried out in a high‐resource setting), Outcome 12 Serious neonatal morbidity or perinatal death. | ||||
| 13 Blood loss > 500 ml Show forest plot | 1 | 613 | Risk Ratio (M‐H, Fixed, 95% CI) | 1.03 [0.68, 1.56] |
| Analysis 4.13  Comparison 4 Partogram with 3‐hour action line versus partogram with 4‐hour action line (study carried out in a high‐resource setting), Outcome 13 Blood loss > 500 ml. | ||||
| 14 Epidural use Show forest plot | 1 | 613 | Risk Ratio (M‐H, Fixed, 95% CI) | 1.01 [0.80, 1.27] |
| Analysis 4.14  Comparison 4 Partogram with 3‐hour action line versus partogram with 4‐hour action line (study carried out in a high‐resource setting), Outcome 14 Epidural use. | ||||
| 15 Number of vaginal examinations in labour Show forest plot | 1 | 613 | Mean Difference (IV, Fixed, 95% CI) | 0.10 [‐0.19, 0.39] |
| Analysis 4.15  Comparison 4 Partogram with 3‐hour action line versus partogram with 4‐hour action line (study carried out in a high‐resource setting), Outcome 15 Number of vaginal examinations in labour. | ||||
| Outcome or subgroup title | No. of studies | No. of participants | Statistical method | Effect size |
| 1 Caesarean section (overall) Show forest plot | 1 | 694 | Risk Ratio (M‐H, Fixed, 95% CI) | 0.68 [0.50, 0.93] |
| Analysis 5.1  Comparison 5 Partogram with alert line only versus partogram with alert and action line (study carried out in a low‐resource setting), Outcome 1 Caesarean section (overall). | ||||
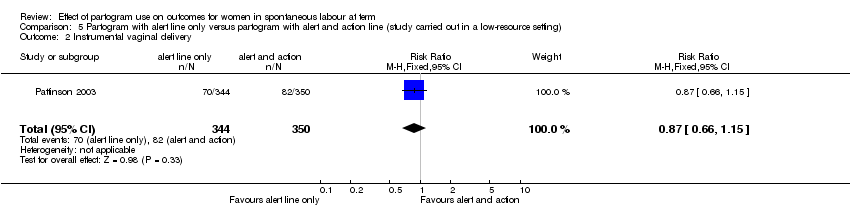
| 2 Instrumental vaginal delivery Show forest plot | 1 | 694 | Risk Ratio (M‐H, Fixed, 95% CI) | 0.87 [0.66, 1.15] |
| Analysis 5.2  Comparison 5 Partogram with alert line only versus partogram with alert and action line (study carried out in a low‐resource setting), Outcome 2 Instrumental vaginal delivery. | ||||
| 3 Oxytocin augmentation Show forest plot | 1 | 694 | Risk Ratio (M‐H, Fixed, 95% CI) | 0.81 [0.62, 1.05] |
| Analysis 5.3  Comparison 5 Partogram with alert line only versus partogram with alert and action line (study carried out in a low‐resource setting), Outcome 3 Oxytocin augmentation. | ||||
| 4 Low Apgar Score (less than 7 at 5 minutes) Show forest plot | 1 | 2 | Risk Ratio (M‐H, Fixed, 95% CI) | 0.0 [0.0, 0.0] |
| Analysis 5.4  Comparison 5 Partogram with alert line only versus partogram with alert and action line (study carried out in a low‐resource setting), Outcome 4 Low Apgar Score (less than 7 at 5 minutes). | ||||
| 5 Perinatal death Show forest plot | 1 | 694 | Risk Ratio (M‐H, Fixed, 95% CI) | 7.12 [0.37, 137.36] |
| Analysis 5.5  Comparison 5 Partogram with alert line only versus partogram with alert and action line (study carried out in a low‐resource setting), Outcome 5 Perinatal death. | ||||
| Outcome or subgroup title | No. of studies | No. of participants | Statistical method | Effect size |
| 1 Caesarean section (overall) (New Outcome) Show forest plot | 3 | 4295 | Risk Ratio (M‐H, Random, 95% CI) | 0.94 [0.67, 1.31] |
| Analysis 6.1  Comparison 6 Earlier versus later intervention: combined analysis for trials in high‐ and low‐resource settings, Outcome 1 Caesarean section (overall) (New Outcome). | ||||
| 1.1 Low‐resource setting | 1 | 694 | Risk Ratio (M‐H, Random, 95% CI) | 0.68 [0.50, 0.93] |
| 1.2 High‐resource setting | 2 | 3601 | Risk Ratio (M‐H, Random, 95% CI) | 1.06 [0.85, 1.32] |
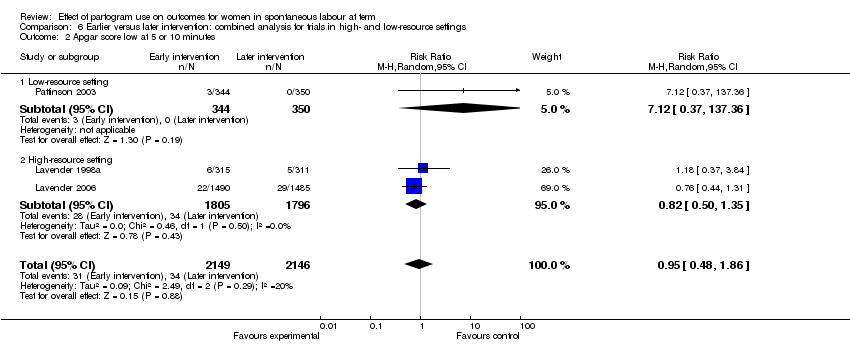
| 2 Apgar score low at 5 or 10 minutes Show forest plot | 3 | 4295 | Risk Ratio (M‐H, Random, 95% CI) | 0.95 [0.48, 1.86] |
| Analysis 6.2  Comparison 6 Earlier versus later intervention: combined analysis for trials in high‐ and low‐resource settings, Outcome 2 Apgar score low at 5 or 10 minutes. | ||||
| 2.1 Low‐resource setting | 1 | 694 | Risk Ratio (M‐H, Random, 95% CI) | 7.12 [0.37, 137.36] |
| 2.2 High‐resource setting | 2 | 3601 | Risk Ratio (M‐H, Random, 95% CI) | 0.82 [0.50, 1.35] |
| 3 Instrumental delivery Show forest plot | 3 | 4295 | Risk Ratio (M‐H, Random, 95% CI) | 0.90 [0.80, 1.02] |
| Analysis 6.3  Comparison 6 Earlier versus later intervention: combined analysis for trials in high‐ and low‐resource settings, Outcome 3 Instrumental delivery. | ||||
| 3.1 Low‐resource setting | 1 | 694 | Risk Ratio (M‐H, Random, 95% CI) | 0.87 [0.66, 1.15] |
| 3.2 High‐resource setting | 2 | 3601 | Risk Ratio (M‐H, Random, 95% CI) | 0.91 [0.80, 1.03] |

Section of partogram where labour progress is recorded

Comparison 1 Partogram versus no partogram (studies carried out in high‐ and low‐resource settings), Outcome 1 Casearean section (overall).

Comparison 1 Partogram versus no partogram (studies carried out in high‐ and low‐resource settings), Outcome 2 Apgar score less than 7 at 5 minutes.

Comparison 1 Partogram versus no partogram (studies carried out in high‐ and low‐resource settings), Outcome 3 Epidural analgesia.

Comparison 1 Partogram versus no partogram (studies carried out in high‐ and low‐resource settings), Outcome 4 Instrumental vaginal delivery.

Comparison 1 Partogram versus no partogram (studies carried out in high‐ and low‐resource settings), Outcome 5 Duration of first stage of labour.

Comparison 1 Partogram versus no partogram (studies carried out in high‐ and low‐resource settings), Outcome 6 Duration of second stage of labour.
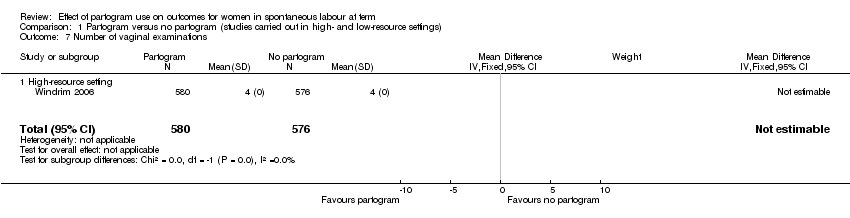
Comparison 1 Partogram versus no partogram (studies carried out in high‐ and low‐resource settings), Outcome 7 Number of vaginal examinations.

Comparison 1 Partogram versus no partogram (studies carried out in high‐ and low‐resource settings), Outcome 8 Admission to special care nursery.

Comparison 1 Partogram versus no partogram (studies carried out in high‐ and low‐resource settings), Outcome 9 Oxytocin augmentation.
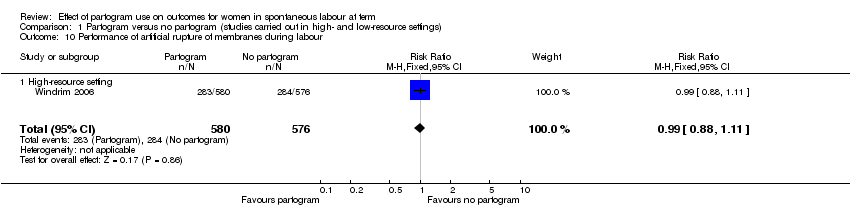
Comparison 1 Partogram versus no partogram (studies carried out in high‐ and low‐resource settings), Outcome 10 Performance of artificial rupture of membranes during labour.

Comparison 1 Partogram versus no partogram (studies carried out in high‐ and low‐resource settings), Outcome 11 Antibiotic use.

Comparison 2 Partogram with 2‐hour action line versus partogram with 4‐hour action line (studies carried out in a high‐resource setting), Outcome 1 Caesarean section (overall).

Comparison 2 Partogram with 2‐hour action line versus partogram with 4‐hour action line (studies carried out in a high‐resource setting), Outcome 2 Caesarean section (distress).
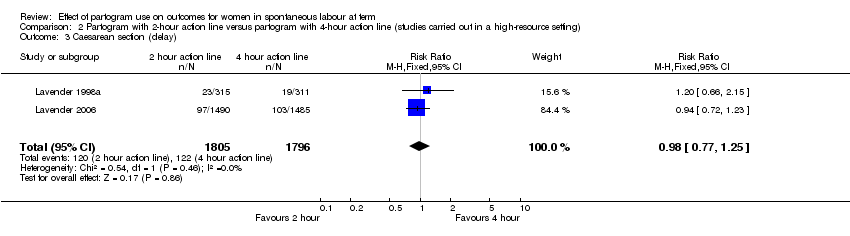
Comparison 2 Partogram with 2‐hour action line versus partogram with 4‐hour action line (studies carried out in a high‐resource setting), Outcome 3 Caesarean section (delay).
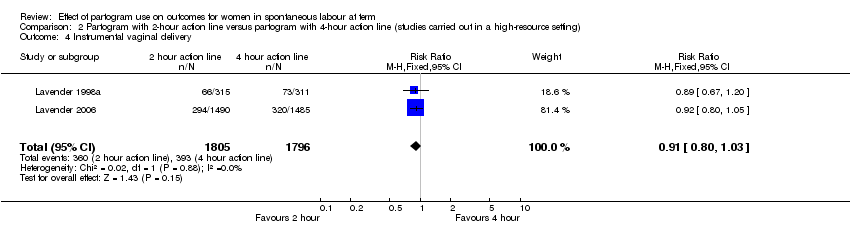
Comparison 2 Partogram with 2‐hour action line versus partogram with 4‐hour action line (studies carried out in a high‐resource setting), Outcome 4 Instrumental vaginal delivery.

Comparison 2 Partogram with 2‐hour action line versus partogram with 4‐hour action line (studies carried out in a high‐resource setting), Outcome 5 Serious maternal morbidity or death.
Comparison 2 Partogram with 2‐hour action line versus partogram with 4‐hour action line (studies carried out in a high‐resource setting), Outcome 6 Negative childbirth experience.
Comparison 2 Partogram with 2‐hour action line versus partogram with 4‐hour action line (studies carried out in a high‐resource setting), Outcome 7 Cord pH less than 7.1.

Comparison 2 Partogram with 2‐hour action line versus partogram with 4‐hour action line (studies carried out in a high‐resource setting), Outcome 8 Apgar score less than 7 at 5 minutes.

Comparison 2 Partogram with 2‐hour action line versus partogram with 4‐hour action line (studies carried out in a high‐resource setting), Outcome 9 Admission to special care nursery.
Comparison 2 Partogram with 2‐hour action line versus partogram with 4‐hour action line (studies carried out in a high‐resource setting), Outcome 10 Oxytocin augmentation.

Comparison 2 Partogram with 2‐hour action line versus partogram with 4‐hour action line (studies carried out in a high‐resource setting), Outcome 11 Performance of artificial rupture of the membranes during labour.

Comparison 2 Partogram with 2‐hour action line versus partogram with 4‐hour action line (studies carried out in a high‐resource setting), Outcome 12 Serious neonatal morbidity or perinatal death.

Comparison 2 Partogram with 2‐hour action line versus partogram with 4‐hour action line (studies carried out in a high‐resource setting), Outcome 13 Blood loss > 500 ml.
Comparison 2 Partogram with 2‐hour action line versus partogram with 4‐hour action line (studies carried out in a high‐resource setting), Outcome 14 Epidural use.
Comparison 2 Partogram with 2‐hour action line versus partogram with 4‐hour action line (studies carried out in a high‐resource setting), Outcome 15 Vaginal examinations.

Comparison 3 Partogram with 2‐hour action line versus partogram with 3‐hour action line (study carried out in a high‐resource setting), Outcome 1 Caesarean section (overall).
Comparison 3 Partogram with 2‐hour action line versus partogram with 3‐hour action line (study carried out in a high‐resource setting), Outcome 2 Caesarean section (distress).

Comparison 3 Partogram with 2‐hour action line versus partogram with 3‐hour action line (study carried out in a high‐resource setting), Outcome 3 Caesarean section (delay).

Comparison 3 Partogram with 2‐hour action line versus partogram with 3‐hour action line (study carried out in a high‐resource setting), Outcome 4 Instrumental vaginal delivery.

Comparison 3 Partogram with 2‐hour action line versus partogram with 3‐hour action line (study carried out in a high‐resource setting), Outcome 5 Serious maternal morbidity or death.
Comparison 3 Partogram with 2‐hour action line versus partogram with 3‐hour action line (study carried out in a high‐resource setting), Outcome 6 Negative childbirth experience.

Comparison 3 Partogram with 2‐hour action line versus partogram with 3‐hour action line (study carried out in a high‐resource setting), Outcome 7 Cord pH less than 7.1.
Comparison 3 Partogram with 2‐hour action line versus partogram with 3‐hour action line (study carried out in a high‐resource setting), Outcome 8 Apgar score less than 7 at 5 minutes.

Comparison 3 Partogram with 2‐hour action line versus partogram with 3‐hour action line (study carried out in a high‐resource setting), Outcome 9 Admission to special care nursery.

Comparison 3 Partogram with 2‐hour action line versus partogram with 3‐hour action line (study carried out in a high‐resource setting), Outcome 10 Oxytocin augmentation.

Comparison 3 Partogram with 2‐hour action line versus partogram with 3‐hour action line (study carried out in a high‐resource setting), Outcome 11 Performance of artificial rupture of membranes during labour.

Comparison 3 Partogram with 2‐hour action line versus partogram with 3‐hour action line (study carried out in a high‐resource setting), Outcome 12 Serious neonatal morbidity or perinatal death.
Comparison 3 Partogram with 2‐hour action line versus partogram with 3‐hour action line (study carried out in a high‐resource setting), Outcome 13 Blood loss > 500 ml.
Comparison 3 Partogram with 2‐hour action line versus partogram with 3‐hour action line (study carried out in a high‐resource setting), Outcome 14 Epidural use.

Comparison 3 Partogram with 2‐hour action line versus partogram with 3‐hour action line (study carried out in a high‐resource setting), Outcome 15 Vaginal examinations.

Comparison 4 Partogram with 3‐hour action line versus partogram with 4‐hour action line (study carried out in a high‐resource setting), Outcome 1 Caesarean section (overall).
Comparison 4 Partogram with 3‐hour action line versus partogram with 4‐hour action line (study carried out in a high‐resource setting), Outcome 2 Caesarean section (distress).
Comparison 4 Partogram with 3‐hour action line versus partogram with 4‐hour action line (study carried out in a high‐resource setting), Outcome 3 Caesarean section (delay).

Comparison 4 Partogram with 3‐hour action line versus partogram with 4‐hour action line (study carried out in a high‐resource setting), Outcome 4 Instrumental vaginal delivery.
Comparison 4 Partogram with 3‐hour action line versus partogram with 4‐hour action line (study carried out in a high‐resource setting), Outcome 5 Serious maternal morbidity or death.
Comparison 4 Partogram with 3‐hour action line versus partogram with 4‐hour action line (study carried out in a high‐resource setting), Outcome 6 Negative childbirth experience.

Comparison 4 Partogram with 3‐hour action line versus partogram with 4‐hour action line (study carried out in a high‐resource setting), Outcome 7 Cord pH less than 7.1.

Comparison 4 Partogram with 3‐hour action line versus partogram with 4‐hour action line (study carried out in a high‐resource setting), Outcome 8 Apgar score less than 7 at 5 minutes.
Comparison 4 Partogram with 3‐hour action line versus partogram with 4‐hour action line (study carried out in a high‐resource setting), Outcome 9 Admission to special care nursery.

Comparison 4 Partogram with 3‐hour action line versus partogram with 4‐hour action line (study carried out in a high‐resource setting), Outcome 10 Oxytocin augmentation.
Comparison 4 Partogram with 3‐hour action line versus partogram with 4‐hour action line (study carried out in a high‐resource setting), Outcome 11 Performance of artificial rupture of membranes during labour.
Comparison 4 Partogram with 3‐hour action line versus partogram with 4‐hour action line (study carried out in a high‐resource setting), Outcome 12 Serious neonatal morbidity or perinatal death.

Comparison 4 Partogram with 3‐hour action line versus partogram with 4‐hour action line (study carried out in a high‐resource setting), Outcome 13 Blood loss > 500 ml.

Comparison 4 Partogram with 3‐hour action line versus partogram with 4‐hour action line (study carried out in a high‐resource setting), Outcome 14 Epidural use.

Comparison 4 Partogram with 3‐hour action line versus partogram with 4‐hour action line (study carried out in a high‐resource setting), Outcome 15 Number of vaginal examinations in labour.

Comparison 5 Partogram with alert line only versus partogram with alert and action line (study carried out in a low‐resource setting), Outcome 1 Caesarean section (overall).
Comparison 5 Partogram with alert line only versus partogram with alert and action line (study carried out in a low‐resource setting), Outcome 2 Instrumental vaginal delivery.

Comparison 5 Partogram with alert line only versus partogram with alert and action line (study carried out in a low‐resource setting), Outcome 3 Oxytocin augmentation.

Comparison 5 Partogram with alert line only versus partogram with alert and action line (study carried out in a low‐resource setting), Outcome 4 Low Apgar Score (less than 7 at 5 minutes).

Comparison 5 Partogram with alert line only versus partogram with alert and action line (study carried out in a low‐resource setting), Outcome 5 Perinatal death.

Comparison 6 Earlier versus later intervention: combined analysis for trials in high‐ and low‐resource settings, Outcome 1 Caesarean section (overall) (New Outcome).
Comparison 6 Earlier versus later intervention: combined analysis for trials in high‐ and low‐resource settings, Outcome 2 Apgar score low at 5 or 10 minutes.

Comparison 6 Earlier versus later intervention: combined analysis for trials in high‐ and low‐resource settings, Outcome 3 Instrumental delivery.
| Outcome or subgroup title | No. of studies | No. of participants | Statistical method | Effect size |
| 1 Casearean section (overall) Show forest plot | 2 | 1590 | Risk Ratio (M‐H, Random, 95% CI) | 0.64 [0.24, 1.70] |
| 1.1 Low‐resource setting | 1 | 434 | Risk Ratio (M‐H, Random, 95% CI) | 0.38 [0.24, 0.61] |
| 1.2 High‐resource setting | 1 | 1156 | Risk Ratio (M‐H, Random, 95% CI) | 1.03 [0.82, 1.28] |
| 2 Apgar score less than 7 at 5 minutes Show forest plot | 2 | 1596 | Risk Ratio (M‐H, Random, 95% CI) | 0.77 [0.29, 2.06] |
| 2.1 Low‐resource setting | 1 | 440 | Risk Ratio (M‐H, Random, 95% CI) | 0.46 [0.04, 5.00] |
| 2.2 High‐resource setting | 1 | 1156 | Risk Ratio (M‐H, Random, 95% CI) | 0.85 [0.29, 2.52] |
| 3 Epidural analgesia Show forest plot | 1 | 1156 | Risk Ratio (M‐H, Fixed, 95% CI) | 1.01 [0.98, 1.05] |
| 3.1 High‐resource setting | 1 | 1156 | Risk Ratio (M‐H, Fixed, 95% CI) | 1.01 [0.98, 1.05] |
| 4 Instrumental vaginal delivery Show forest plot | 2 | 1590 | Risk Ratio (M‐H, Fixed, 95% CI) | 1.00 [0.85, 1.17] |
| 4.1 Low‐resource setting | 1 | 434 | Risk Ratio (M‐H, Fixed, 95% CI) | 1.17 [0.79, 1.74] |
| 4.2 High‐resource setting | 1 | 1156 | Risk Ratio (M‐H, Fixed, 95% CI) | 0.97 [0.81, 1.15] |
| 5 Duration of first stage of labour Show forest plot | 1 | 1156 | Mean Difference (IV, Fixed, 95% CI) | 0.0 [‐0.21, 0.21] |
| 5.1 High‐resource setting | 1 | 1156 | Mean Difference (IV, Fixed, 95% CI) | 0.0 [‐0.21, 0.21] |
| 6 Duration of second stage of labour Show forest plot | 1 | 1156 | Mean Difference (IV, Fixed, 95% CI) | 0.0 [‐0.21, 0.21] |
| 6.1 High‐resource setting | 1 | 1156 | Mean Difference (IV, Fixed, 95% CI) | 0.0 [‐0.21, 0.21] |
| 7 Number of vaginal examinations Show forest plot | 1 | 1156 | Mean Difference (IV, Fixed, 95% CI) | 0.0 [0.0, 0.0] |
| 7.1 High‐resource setting | 1 | 1156 | Mean Difference (IV, Fixed, 95% CI) | 0.0 [0.0, 0.0] |
| 8 Admission to special care nursery Show forest plot | 1 | 1156 | Risk Ratio (M‐H, Fixed, 95% CI) | 0.94 [0.51, 1.75] |
| 8.1 High‐resource setting | 1 | 1156 | Risk Ratio (M‐H, Fixed, 95% CI) | 0.94 [0.51, 1.75] |
| 9 Oxytocin augmentation Show forest plot | 1 | 1156 | Risk Ratio (M‐H, Fixed, 95% CI) | 1.02 [0.95, 1.10] |
| 9.1 High‐resource setting | 1 | 1156 | Risk Ratio (M‐H, Fixed, 95% CI) | 1.02 [0.95, 1.10] |
| 10 Performance of artificial rupture of membranes during labour Show forest plot | 1 | 1156 | Risk Ratio (M‐H, Fixed, 95% CI) | 0.99 [0.88, 1.11] |
| 10.1 High‐resource setting | 1 | 1156 | Risk Ratio (M‐H, Fixed, 95% CI) | 0.99 [0.88, 1.11] |
| 11 Antibiotic use Show forest plot | 1 | 1156 | Risk Ratio (M‐H, Fixed, 95% CI) | 1.23 [0.88, 1.73] |
| 11.1 High‐resource setting | 1 | 1156 | Risk Ratio (M‐H, Fixed, 95% CI) | 1.23 [0.88, 1.73] |
| Outcome or subgroup title | No. of studies | No. of participants | Statistical method | Effect size |
| 1 Caesarean section (overall) Show forest plot | 2 | 3601 | Risk Ratio (M‐H, Random, 95% CI) | 1.06 [0.85, 1.32] |
| 2 Caesarean section (distress) Show forest plot | 2 | 3601 | Risk Ratio (M‐H, Fixed, 95% CI) | 1.30 [0.86, 1.96] |
| 3 Caesarean section (delay) Show forest plot | 2 | 3601 | Risk Ratio (M‐H, Fixed, 95% CI) | 0.98 [0.77, 1.25] |
| 4 Instrumental vaginal delivery Show forest plot | 2 | 3601 | Risk Ratio (M‐H, Fixed, 95% CI) | 0.91 [0.80, 1.03] |
| 5 Serious maternal morbidity or death Show forest plot | 2 | 3601 | Odds Ratio (M‐H, Fixed, 95% CI) | 0.0 [0.0, 0.0] |
| 6 Negative childbirth experience Show forest plot | 2 | 2269 | Risk Ratio (M‐H, Random, 95% CI) | 0.61 [0.28, 1.35] |
| 7 Cord pH less than 7.1 Show forest plot | 2 | 3601 | Risk Ratio (M‐H, Fixed, 95% CI) | 0.73 [0.44, 1.22] |
| 8 Apgar score less than 7 at 5 minutes Show forest plot | 2 | 3601 | Risk Ratio (M‐H, Fixed, 95% CI) | 0.82 [0.50, 1.35] |
| 9 Admission to special care nursery Show forest plot | 2 | 3601 | Risk Ratio (M‐H, Fixed, 95% CI) | 0.78 [0.46, 1.31] |
| 10 Oxytocin augmentation Show forest plot | 2 | 3601 | Risk Ratio (M‐H, Fixed, 95% CI) | 1.14 [1.05, 1.22] |
| 11 Performance of artificial rupture of the membranes during labour Show forest plot | 2 | 3601 | Risk Ratio (M‐H, Fixed, 95% CI) | 1.07 [0.99, 1.15] |
| 12 Serious neonatal morbidity or perinatal death Show forest plot | 2 | 3601 | Odds Ratio (M‐H, Fixed, 95% CI) | 0.0 [0.0, 0.0] |
| 13 Blood loss > 500 ml Show forest plot | 2 | 3601 | Risk Ratio (M‐H, Fixed, 95% CI) | 1.07 [0.90, 1.26] |
| 14 Epidural use Show forest plot | 2 | 3601 | Risk Ratio (M‐H, Fixed, 95% CI) | 1.04 [0.95, 1.14] |
| 15 Vaginal examinations Show forest plot | 2 | 3601 | Mean Difference (IV, Fixed, 95% CI) | ‐0.14 [‐0.27, ‐0.02] |
| Outcome or subgroup title | No. of studies | No. of participants | Statistical method | Effect size |
| 1 Caesarean section (overall) Show forest plot | 1 | 617 | Risk Ratio (M‐H, Fixed, 95% CI) | 0.78 [0.51, 1.18] |
| 2 Caesarean section (distress) Show forest plot | 1 | 617 | Risk Ratio (M‐H, Fixed, 95% CI) | 0.96 [0.44, 2.10] |
| 3 Caesarean section (delay) Show forest plot | 1 | 617 | Risk Ratio (M‐H, Fixed, 95% CI) | 0.71 [0.42, 1.19] |
| 4 Instrumental vaginal delivery Show forest plot | 1 | 617 | Risk Ratio (M‐H, Fixed, 95% CI) | 0.93 [0.69, 1.26] |
| 5 Serious maternal morbidity or death Show forest plot | 1 | 617 | Odds Ratio (M‐H, Fixed, 95% CI) | 0.0 [0.0, 0.0] |
| 6 Negative childbirth experience Show forest plot | 1 | 348 | Risk Ratio (M‐H, Fixed, 95% CI) | 0.49 [0.27, 0.90] |
| 7 Cord pH less than 7.1 Show forest plot | 1 | 617 | Risk Ratio (M‐H, Fixed, 95% CI) | 0.38 [0.07, 1.96] |
| 8 Apgar score less than 7 at 5 minutes Show forest plot | 1 | 617 | Risk Ratio (M‐H, Fixed, 95% CI) | 1.44 [0.41, 5.05] |
| 9 Admission to special care nursery Show forest plot | 1 | 617 | Risk Ratio (M‐H, Fixed, 95% CI) | 3.83 [0.43, 34.12] |
| 10 Oxytocin augmentation Show forest plot | 1 | 617 | Risk Ratio (M‐H, Fixed, 95% CI) | 1.02 [0.85, 1.21] |
| 11 Performance of artificial rupture of membranes during labour Show forest plot | 1 | 617 | Risk Ratio (M‐H, Fixed, 95% CI) | 0.94 [0.77, 1.15] |
| 12 Serious neonatal morbidity or perinatal death Show forest plot | 1 | 617 | Odds Ratio (M‐H, Fixed, 95% CI) | 0.0 [0.0, 0.0] |
| 13 Blood loss > 500 ml Show forest plot | 1 | 617 | Risk Ratio (M‐H, Fixed, 95% CI) | 0.96 [0.63, 1.45] |
| 14 Epidural use Show forest plot | 1 | 617 | Risk Ratio (M‐H, Fixed, 95% CI) | 1.16 [0.94, 1.44] |
| 15 Vaginal examinations Show forest plot | 1 | 617 | Mean Difference (IV, Fixed, 95% CI) | 0.0 [‐0.29, 0.29] |
| Outcome or subgroup title | No. of studies | No. of participants | Statistical method | Effect size |
| 1 Caesarean section (overall) Show forest plot | 1 | 613 | Risk Ratio (M‐H, Fixed, 95% CI) | 1.70 [1.07, 2.70] |
| 2 Caesarean section (distress) Show forest plot | 1 | 613 | Risk Ratio (M‐H, Fixed, 95% CI) | 1.77 [0.70, 4.42] |
| 3 Caesarean section (delay) Show forest plot | 1 | 613 | Risk Ratio (M‐H, Fixed, 95% CI) | 1.68 [0.97, 2.91] |
| 4 Instrumental vaginal delivery Show forest plot | 1 | 613 | Risk Ratio (M‐H, Fixed, 95% CI) | 0.96 [0.72, 1.28] |
| 5 Serious maternal morbidity or death Show forest plot | 1 | 613 | Odds Ratio (M‐H, Fixed, 95% CI) | 0.0 [0.0, 0.0] |
| 6 Negative childbirth experience Show forest plot | 1 | 340 | Risk Ratio (M‐H, Fixed, 95% CI) | 0.80 [0.51, 1.27] |
| 7 Cord pH less than 7.1 Show forest plot | 1 | 613 | Risk Ratio (M‐H, Fixed, 95% CI) | 2.57 [0.50, 13.17] |
| 8 Apgar score less than 7 at 5 minutes Show forest plot | 1 | 613 | Risk Ratio (M‐H, Fixed, 95% CI) | 0.82 [0.22, 3.04] |
| 9 Admission to special care nursery Show forest plot | 1 | 613 | Risk Ratio (M‐H, Fixed, 95% CI) | 0.51 [0.05, 5.65] |
| 10 Oxytocin augmentation Show forest plot | 1 | 613 | Risk Ratio (M‐H, Fixed, 95% CI) | 1.09 [0.91, 1.30] |
| 11 Performance of artificial rupture of membranes during labour Show forest plot | 1 | 613 | Risk Ratio (M‐H, Fixed, 95% CI) | 1.04 [0.85, 1.26] |
| 12 Serious neonatal morbidity or perinatal death Show forest plot | 1 | 613 | Odds Ratio (M‐H, Fixed, 95% CI) | 0.0 [0.0, 0.0] |
| 13 Blood loss > 500 ml Show forest plot | 1 | 613 | Risk Ratio (M‐H, Fixed, 95% CI) | 1.03 [0.68, 1.56] |
| 14 Epidural use Show forest plot | 1 | 613 | Risk Ratio (M‐H, Fixed, 95% CI) | 1.01 [0.80, 1.27] |
| 15 Number of vaginal examinations in labour Show forest plot | 1 | 613 | Mean Difference (IV, Fixed, 95% CI) | 0.10 [‐0.19, 0.39] |
| Outcome or subgroup title | No. of studies | No. of participants | Statistical method | Effect size |
| 1 Caesarean section (overall) Show forest plot | 1 | 694 | Risk Ratio (M‐H, Fixed, 95% CI) | 0.68 [0.50, 0.93] |
| 2 Instrumental vaginal delivery Show forest plot | 1 | 694 | Risk Ratio (M‐H, Fixed, 95% CI) | 0.87 [0.66, 1.15] |
| 3 Oxytocin augmentation Show forest plot | 1 | 694 | Risk Ratio (M‐H, Fixed, 95% CI) | 0.81 [0.62, 1.05] |
| 4 Low Apgar Score (less than 7 at 5 minutes) Show forest plot | 1 | 2 | Risk Ratio (M‐H, Fixed, 95% CI) | 0.0 [0.0, 0.0] |
| 5 Perinatal death Show forest plot | 1 | 694 | Risk Ratio (M‐H, Fixed, 95% CI) | 7.12 [0.37, 137.36] |
| Outcome or subgroup title | No. of studies | No. of participants | Statistical method | Effect size |
| 1 Caesarean section (overall) (New Outcome) Show forest plot | 3 | 4295 | Risk Ratio (M‐H, Random, 95% CI) | 0.94 [0.67, 1.31] |
| 1.1 Low‐resource setting | 1 | 694 | Risk Ratio (M‐H, Random, 95% CI) | 0.68 [0.50, 0.93] |
| 1.2 High‐resource setting | 2 | 3601 | Risk Ratio (M‐H, Random, 95% CI) | 1.06 [0.85, 1.32] |
| 2 Apgar score low at 5 or 10 minutes Show forest plot | 3 | 4295 | Risk Ratio (M‐H, Random, 95% CI) | 0.95 [0.48, 1.86] |
| 2.1 Low‐resource setting | 1 | 694 | Risk Ratio (M‐H, Random, 95% CI) | 7.12 [0.37, 137.36] |
| 2.2 High‐resource setting | 2 | 3601 | Risk Ratio (M‐H, Random, 95% CI) | 0.82 [0.50, 1.35] |
| 3 Instrumental delivery Show forest plot | 3 | 4295 | Risk Ratio (M‐H, Random, 95% CI) | 0.90 [0.80, 1.02] |
| 3.1 Low‐resource setting | 1 | 694 | Risk Ratio (M‐H, Random, 95% CI) | 0.87 [0.66, 1.15] |
| 3.2 High‐resource setting | 2 | 3601 | Risk Ratio (M‐H, Random, 95% CI) | 0.91 [0.80, 1.03] |