Efecto del uso del partograma en los resultados para pacientes con trabajo de parto espontáneo a término y sus recién nacidos
Resumen
Antecedentes
El partograma (a veces conocido como partografía) generalmente es un formulario de papel impreso, en el que se registran observaciones sobre el trabajo de parto. El objetivo del partograma es brindar un resumen pictórico del trabajo de parto, para alertar a las parteras y a los obstetras sobre las desviaciones en el bienestar de la madre y el feto y el progreso del trabajo de parto. Tradicionalmente, los gráficos contienen líneas preimpresas de alerta y de acción. Una línea de alerta, que se basa en el 10% de los trabajos de parto más lentos de las pacientes primigrávidas, significa un progreso lento. La línea de acción se coloca varias horas después de la línea de alerta (generalmente dos o cuatro horas) para estimular el tratamiento efectivo del progreso lento del trabajo de parto.
Esta revisión es una actualización de una revisión publicada por última vez en 2013.
Objetivos
El objetivo primario fue determinar la efectividad y la seguridad del uso del partograma sobre la morbilidad y la mortalidad perinatal y materna. El objetivo secundario fue determinar qué diseño del partograma es más efectivo para los resultados de morbilidad y mortalidad perinatal y materna.
Métodos de búsqueda
Se hicieron búsquedas en el registro de ensayos del Grupo Cochrane de Embarazo y Parto (Cochrane Pregnancy and Childbirth’s Trials Register),(31 agosto 2017), ClinicalTrials.gov, en la World Health Organization (WHO) International Clinical Trials Registry Platform (ICTRP) (31 agosto 2017) y en listas de referencias de estudios recuperados.
Criterios de selección
Ensayos controlados aleatorios, aleatorios grupales y cuasialeatorios que incluyeron una comparación del uso del partograma con ningún partograma, o una comparación entre diferentes diseños del partograma.
Obtención y análisis de los datos
Tres revisores evaluaron de forma independiente la elegibilidad y la calidad y extrajeron los datos. Cuando un autor de la revisión era también el autor del ensayo, los dos autores de la revisión restantes evaluaron los estudios de forma independiente. Se evaluó la evidencia mediante el enfoque GRADE.
Resultados principales
En esta revisión se han incluido 11 ensayos con 9475 mujeres; tres estudios evaluaron el uso del partograma versus ningún partograma, siete evaluaron diferentes diseños del partograma y uno evaluó el uso del partograma versus una escala de trabajo de parto. El riesgo de sesgo varió en todos los estudios. No fue posible cegar al personal o a las pacientes a la intervención. Dos estudios no ocultaron adecuadamente la asignación. Las pérdidas durante el seguimiento fueron bajas en todos los estudios. La evidencia sobre el uso del partograma versus ningún partograma se evaluó mediante el enfoque GRADE; las decisiones de disminuir la calidad se debieron al diseño de los estudios, la inconsistencia, la falta de direccionalidad y la imprecisión en las estimaciones del efecto.
La mayoría de los ensayos informaron las tasas de cesáreas y los índices de Apgar menores de 7 a los cinco minutos; todos los otros resultados no se informaron de manera consistente (p.ej. duración del período de dilatación y experiencia materna del parto).
Partograma versus ningún partograma (tres ensayos, 1813 mujeres)
No está claro si hay alguna diferencia clara entre el uso del partograma y ningún partograma en cuanto a las tasas de cesáreas (cociente de riesgos [CR] promedio 0,77; intervalo de confianza [IC] del 95%: 0,40 a 1,46; n = 1813; tres ensayos; I² = 87%; evidencia de muy baja calidad); la estimulación con oxitocina (CR 1,02; IC del 95%: 0,95 a 1,10; n = 1156; un ensayo; evidencia de calidad moderada); la duración del período de dilatación (diferencia de medias [DM] 0,80 horas, IC del 95%: ‐0,06 a 1,66; n = 1156; un ensayo; evidencia de baja calidad); o la puntuación de Apgar menor de 7 a los cinco minutos (CR 0,76; IC del 95%: 0,29 a 2,03; n = 1596; dos ensayos; I² = 87%; evidencia de muy baja calidad).
Partograma con diferente colocación de las líneas de acción (cuatro ensayos, 5051 mujeres)
En comparación con una línea de acción de cuatro horas, las pacientes del grupo de una línea de acción de dos horas tuvieron mayores probabilidades de necesitar estimulación con oxitocina (CR promedio 2,44; IC del 95%: 1,36 a 4,35; n = 4749; cuatro ensayos; I² = 96%). No hubo diferencias claras en las tasas de cesáreas (CR 1,06; IC del 95%: 0,88 a 1,28; n = 4749; cuatro ensayos); la duración del período dilatante (CR 0,81 horas, IC del 95%: 0,32 a 2,04; n = 948; un ensayo); la experiencia materna del parto (CR promedio 0,61; IC del 95%: 0,28 a 1,35; n = 2269; dos ensayos; I² = 83%); o la puntuación de Apgar menor de 7 a los cinco minutos (CR 0,93; IC del 95%: 0,61 a 1,42; n = 4749; cuatro ensayos) entre la línea de acción de dos y de cuatro horas.
Las siguientes comparaciones solo incluyen datos de estudios únicos. Menos pacientes informaron experiencias negativas del parto en el grupo de la línea de acción de dos horas en comparación con el grupo de la línea de acción de tres horas (CR 0,49; IC del 95%: 0,27 a 0,90; n = 348; un ensayo). Cuando se compararon los grupos de la línea de acción de tres y cuatro horas, la tasa de cesáreas fue mayor en el grupo de la línea de acción de tres horas (CR 1,70; IC del 95%: 1,07 a 2,70; n = 613; un ensayo). No se observaron diferencias claras en los otros resultados en estas comparaciones.
Partograma con línea de alerta sola versus partograma con línea de alerta y de acción (un ensayo, 694 mujeres)
La tasa de cesáreas fue inferior en el grupo de línea de alerta solamente (CR 0,68; IC del 95%: 0,50 a 0,93). No hubo diferencias claras entre los grupos para la estimulación con oxitocina, la puntuación de Apgar bajo, el parto vaginal instrumental y la muerte perinatal.
Partograma con fase latente (compuesto) versus partograma sin fase latente (modificado) (un ensayo, 743 mujeres)
Las tasas de cesáreas y estimulación con oxitocina fueron mayores en el partograma con una fase latente (CR 2,45; IC del 95%: 1,72 a 3,50; y CR 2,18; IC del 95%: 1,67 a 2,83, respectivamente). No hubo diferencias claras entre los grupos para la estimulación con oxitocina ni para la puntuación de Apgar menor de 7 a los cinco minutos.
Partograma con línea de acción de dos horas versus partograma con línea de distocia escalonada (un ensayo, 99 mujeres)
Menos pacientes recibieron estimulación con oxitocina en el grupo de la línea de distocia (CR 0,62; IC del 95%: 0,39 a 0,98). No se observaron diferencias claras en los otros resultados primarios en esta comparación.
Partograma versus escala de trabajo de parto (un ensayo, 122 mujeres)
El uso del partograma comparado con la escala de trabajo de parto dio lugar a que menos pacientes recibieran estimulación con oxitocina (CR 0,32; IC del 95%: 0,18 a 0,54), pero no produjo diferencias claras para los otros resultados primarios.
Conclusiones de los autores
Según los resultados de esta revisión, no fue posible tener certeza acerca de los efectos del uso sistemático del partograma como parte del tratamiento y la atención estándar del trabajo de parto, ni sobre qué diseño fue más efectivo, si es que hubo alguno. Se necesita evidencia de ensayos adicionales para establecer la eficacia del uso del partograma per se y su diseño óptimo.
PICO
Resumen en términos sencillos
Efecto del uso del partograma en los resultados para pacientes con trabajo de parto espontáneo a término
¿Cuál es el problema?
¿El uso del partograma durante el trabajo espontáneo a término mejora los resultados de salud para las pacientes y los recién nacidos?
¿Los diferentes diseños del partograma logran algún cambio en los resultados de salud para las pacientes y los recién nacidos?
¿Por qué es importante?
Por lo general, un partograma es un formulario preimpreso, cuyo objetivo es proporcionar un resumen pictórico del trabajo de parto y alertar a los profesionales de la salud sobre cualquier problema con la madre o el feto. No está claro si se debe usar un partograma y, en ese caso, qué diseño de partograma es mejor para las madres y los recién nacidos.
¿Qué evidencia se encontró?
Se buscó la evidencia en agosto de 2017 y ahora se han incluido 11 estudios con 9475 mujeres. Tres estudios consideraron el uso de un partograma versus ningún partograma, siete estudios consideraron diferentes diseños del partograma y un estudio consideró el uso de un partograma versus una nueva escala de trabajo de parto.
Partograma versus ningún partograma (tres estudios, 1703 mujeres)
No está claro si el uso de un partograma tiene efecto sobre el número de pacientes a las que se les realiza una cesárea o de los recién nacidos con puntuaciones de Apgar bajo (una puntuación que mide la condición física del recién nacido, en la que una puntuación baja indica una condición deficiente) porque la calidad de la evidencia es muy baja. El uso de un partograma puede lograr poco o ningún cambio en la duración del trabajo de parto (evidencia de baja calidad), o en el número de pacientes que reciben oxitocina para acelerar el trabajo de parto (evidencia de calidad moderada).
Partograma con diferente colocación de las líneas de acción (cuatro ensayos, 5051 mujeres)
En comparación con una línea de acción de cuatro horas, las pacientes en el grupo de una línea de acción de dos horas tuvieron mayores probabilidades de que su trabajo de parto se acelerara con oxitocina. No hubo diferencias claras entre las pacientes en los grupos de una línea de acción de dos y de cuatro horas en cuanto a que se les realizara una cesárea, a la duración del período de dilatación, las experiencias maternas del parto o las puntuaciones de Apgar bajo.
Cuando se comparó una línea de acción de dos horas con una línea de acción de tres horas, menos pacientes informaron experiencias negativas del parto en el grupo de línea de acción de dos horas. Cuando se compararon los grupos de una línea de acción de tres y de cuatro horas, la tasa de cesáreas fue mayor en el grupo de una línea de acción de tres horas. No hubo diferencias claras entre los grupos de las líneas de acción de dos, tres o cuatro horas para los otros resultados medidos.
Partograma con línea de alerta sola versus partograma con línea de alerta y de acción (un ensayo, 694 mujeres)
La tasa de cesáreas fue inferior en el grupo con una línea de alerta sola. No hubo diferencias claras entre los grupos para la estimulación con oxitocina, la puntuación de Apgar bajo, el parto vaginal instrumental y la muerte perinatal.
Partograma con fase latente versus partograma sin fase latente (un ensayo, 743 mujeres)
Cuando se comparó un partograma con fase latente (que incluye los estadios iniciales del trabajo de parto) y uno sin fase latente, las tasas de cesáreas y de estimulación con oxitocina fueron mayores con el partograma con fase latente. No hubo diferencias claras entre los grupos en cuanto a la estimulación con oxitocina ni en la puntuación de Apgar menor de 7 a los cinco minutos.
Partograma con línea de acción de dos horas versus partograma con línea de distocia escalonada (un ensayo, 99 mujeres)
Cuando se comparó un partograma con una línea de acción de dos horas y una línea de distocia escalonada, menos pacientes recibieron estimulación con oxitocina en el grupo de línea de distocia. No se observaron diferencias claras en los otros resultados primarios en esta comparación.
Partograma versus escala de trabajo de parto (un ensayo, 122 mujeres)
La escala de trabajo de parto comparada con el partograma dio lugar a que menos pacientes recibieran estimulación con oxitocina, pero no produjo diferencias claras para los otros resultados primarios.
¿Qué significa esto?
Según los resultados de esta revisión, no es posible tener certeza acerca de los efectos del uso sistemático del partograma como parte de la atención estándar del trabajo de parto, ni sobre los diferentes diseños del partograma. Se necesita evidencia de ensayos adicionales para establecer la eficacia del uso del partograma per se y su diseño óptimo.
Conclusiones de los autores
Summary of findings
| Partograph compared to no partograph (studies carried out in high‐ and low‐resource settings) for women in spontaneous labour at term | ||||||
| Patient or population: women in spontaneous labour at term | ||||||
| Outcomes | Anticipated absolute effects* (95% CI) | Relative effect | № of participants | Quality of the evidence | Comments | |
| Risk with no partograph (studies carried out in high‐ and low‐resource settings) | Risk with partograph | |||||
| Caesarean section (overall) | Study population | Average RR 0.77 | 1813 | ⊕⊝⊝⊝ | ||
| 214 per 1000 | 164 per 1000 | |||||
| Oxytocin augmentation | Study population | RR 1.02 | 1156 | ⊕⊕⊕⊝ | ||
| 715 per 1000 | 730 per 1000 | |||||
| Duration of first stage of labour | The mean duration of first stage of labour was 16 hours (SD 7.6) | The mean duration of first stage of labour was 16.8 hours (SD 7.3) | In the partograph group, mean duration of first stage was 0.80 hours longer (0.06 hours shorter to 1.66 hours longer) | 1156 | ⊕⊕⊝⊝ | |
| Maternal experience of childbirth (as defined by trial authors) | Study population | ‐ | (0 study) | ‐ | No trials reported this outcome. | |
| See comment | See comment | |||||
| Apgar score less than 7 at 5 minutes | Study population | RR 0.76 | 1596 | ⊕⊝⊝⊝ | ||
| 11 per 1000 | 9 per 1000 | |||||
| Serious maternal morbidity or death (e.g. ruptured uterus, admission to intensive care unit, septicaemia, organ failure) | Study population | ‐ | (0 study) | ‐ | No trials reported this outcome. | |
| See comment | See comment | |||||
| Stillbirth or neonatal death or neonatal morbidity, excluding fatal malformations (e.g. seizures, birth asphyxia, neonatal encephalopathy) | Study population | ‐ | (0 study) | ‐ | No trials reported this outcome. | |
| See comment | See comment | |||||
| *The risk in the intervention group (and its 95% confidence interval) is based on the assumed risk in the comparison group and the relative effect of the intervention (and its 95% CI). | ||||||
| GRADE Working Group grades of evidence | ||||||
| aTwo out of three studies have design limitations, serious design limitations less than 40% of pooled effect (‐1). | ||||||
Antecedentes
Descripción de la afección
La duración óptima del trabajo de parto ha sido una fuente de debate que se remonta a los primeros días de Friedman (Friedman 1954), y que aún se revalúa en la actualidad (Oladapo 2017). La falta de una definición de trabajo de parto normal ha dado lugar a retos al definir y detectar el trabajo de parto prolongado. No obstante, se conoce que el trabajo de parto prolongado es una complicación que afecta a alrededor del 8% de todas las pacientes en trabajo de parto y afecta negativamente el resultado obstétrico y las experiencias de las pacientes (Nystedt 2014). La detección del trabajo de parto prolongado es importante, ya que los trabajos de parto más prolongados se asocian con morbilidad a corto y a largo plazo. A corto plazo, la hemorragia postparto y la infección son más frecuentes en las pacientes con trabajos de parto prolongados y, a largo plazo, las fístulas son más prevalentes (Neilson 2003). Estos riesgos son mayores en los países de ingresos bajos; con servicios sanitarios de bajos recursos (Neilson 2003). Aunque para algunas pacientes es posible acelerar el trabajo de parto con amniotomía y oxitocina, es más probable que el aumento de los dolores asociados dé lugar a una epidural, a un parto instrumental vaginal o a una cesárea(Nystedt 2014). Por lo tanto, es fundamental el diagnóstico certero del trabajo de parto prolongado para estimular una acción apropiada.
Descripción de la intervención
El partograma (o partografía) es una herramienta sencilla y de bajo coste para brindar un resumen pictórico continuo del trabajo de parto. El partograma es un formulario impreso, generalmente en papel, en el que las parteras y los obstetras registran observaciones sobre el trabajo de parto. La mayoría de los partogramas tienen tres secciones diferenciadas donde se apuntan las observaciones sobre el estado materno, el estado fetal y el progreso del trabajo de parto; esta última sección ayuda en la detección del trabajo de parto prolongado (Figura 1).
El primer obstetra que describió el progreso del trabajo de parto de manera gráfica fue Friedman (Friedman 1954), después de su estudio de la dilatación cervical de 100 primigrávidas africanas a término. A las pacientes, se les realizaron exámenes rectales frecuentes y su progreso se registró en centímetros de dilatación por hora, lo que produjo una pendiente que se asemejaba a una curva sigmoidea (en forma de “S”). Se conoce como el cervicograma. En un intento de utilizar de manera eficiente a las parteras en un hospital y un servicio clínico de Zimbabwe (más tarde Rhodesia), donde los médicos eran escasos, Philpott 1972a desarrolló un partograma de este cervicograma original. Lo anterior proporcionó una herramienta práctica para registrar todo los detalles intraparto, no sólo la dilatación cervical. Se agregó una “línea de alerta” siguiendo los resultados de un estudio prospectivo de 624 mujeres (Philpott 1972b). La línea de alerta era derecha, no curva, y era una modificación de la tasa media de dilatación cervical de los 10% más lentos de las pacientes primigrávidas que estaban en la fase activa del trabajo de parto. Esta línea representaba una tasa de progreso de de 1 cm por hora. Si el progreso de la dilatación cervical de una paciente fuera más lento, cruzaría esta línea de alerta y se harían arreglos para transferirla de una unidad periférica a una unidad central donde se podría tratar el trabajo de parto prolongado. El próximo paso en el desarrollo del partograma fue la introducción de una "línea de acción", cuatro horas a la derecha de la línea de alerta (Philpott 1972c). Se desarrolló esta línea para identificar la actividad uterina primaria ineficiente para impulsar el tratamiento apropiado. La corrección de la actividad uterina primaria ineficiente generalmente se hace mediante una intervención como la amniotomía o infusión de oxitocina, o ambas.
Hay varios retos asociados con el llenado del partograma, incluida la escasez de recursos humanos, la baja categoría dentro de los habitaciones de trabajo de parto y el entrenamiento inadecuado (Bedwell 2017; Fatusi 2007; Lavender 2011) Estos retos han dado lugar a varias adaptaciones del partograma original, una de las cuales es el partograma simplificado, que no incluye la vigilancia de la fase latente del trabajo de parto (WHO 2003). En un ensayo cruzado pequeño, se mostró que este partograma simplificado es más "fácil de usar" (Mathews 2007). Más recientemente, un ensayo controlado aleatorio realizado en la India (Kenchaveeriah 2011), que comparó el partograma simplificado (que no incluye la fase latente) con el tradicional (que incluye la fase latente), confirmó la preferencia entre el personal médico para utilizar la versión simplificada.
De qué manera podría funcionar la intervención
El partograma se ha anunciado como uno de los adelantos más importantes en la atención obstétrica moderna(Agarwal 2013); sin embargo, esto fue antes de realizar cualquier evaluación rigurosa. Además, la mayoría de los primeros estudios fueron realizados en ámbitos hospitalarios donde la mayoría de las muertes maternas ocurren en pacientes admitidas con complicaciones graves y a menudo trabajo de parto sin la atención adecuada (Lennox 1995). Más de 20 años después de su introducción, y con el uso de un partograma adaptado a partir del formulado por Philpott y Castle(Philpott 1972b; Philpott 1972c), la Organización Mundial de la Salud (OMS) realizó un estudio prospectivo no aleatorio en 35 484 pacientes en Asia Sudoriental (WHO 1994), del que concluyó que el partograma fue una herramienta necesaria en el tratamiento del trabajo de parto y recomendó su aplicación universal. En este estudio, participaron cuatro pares de hospitales (dos pares en Indonesia, uno en Tailandia y otro en Malasia). Se adoptó un enfoque por tiempos, mediante el cual durante los cinco primeros meses del estudio los ocho centros recopilaron los datos iniciales; después de cinco meses, se introdujo el partograma al azar en uno de cada par; en los cinco meses restantes, se introdujo el partograma en todos los sitios hospitalarios. La introducción del partograma y un protocolo consensuado de tratamiento redujo el trabajo de parto prolongado (de 6,4% a 3,4%), la proporción de trabajos de parto que necesitaron estimulación (20,7% a 9,1%), las cesáreas de urgencia (de 9,9% a 8,3%) y la muerte fetal (de 0,5% a 0,3%).
Una creencia de que el uso del partograma no está afectado por las diferencias raciales, culturales y socioeconómicas llevó a que el enfoque fuera bien recibido en los países de ingresos altos y en los países de ingresos bajos y medios. Sin embargo, en la práctica, es concebible que tales variaciones entre los países con respecto a la atención, e incluso entre las unidades de atención, puedan alterar el uso del partograma y la efectividad posterior, en cuanto a los resultados maternos y neonatales. En consecuencia, algunos profesionales han cuestionado su efectividad, en particular cuando se usa en países de ingresos altos (Groeschel 2001; Walsh 1994).
Hay alguna evidencia que indica que el partograma tiene efectos beneficiosos prácticos en cuanto a la ayuda para la derivación y la transferencia, la facilidad de uso, el aprovechamiento del tiempo, la continuidad de la atención, la ayuda para la docencia y la responsabilidad profesional (Lavender 1999; Orhue 2012; Rakotonirina 2013; Rotich 2011; Yisma 2013). Estos aspectos positivos pueden contribuir a mejorar los resultados maternos y fetales. Por otro lado, también se informó que la condición del partograma dentro de algunas unidades obstétricas puede restringir la práctica clínica, originar una interferencia innecesaria, reducir la autonomía de las parteras y limitar la flexibilidad para tratar a cada paciente de modo individual(Lavender 1999; Lavender 2011; Walraven 1994; Walsh 1994), factores que también podrían repercutir en los resultados clínicos y psicológicos.
Las barreras y los facilitadores para el uso del partograma se exploraron en una revisión realista reciente (Bedwell 2017), que incluyó 92 artículos que describieron estudios de contextos de ingresos bajos y altos. Una revisión realista intenta explorar qué pasa con una intervención particular que funciona o no funciona, para quién funciona y en qué contexto (Pawson 2004). Es importante señalar que esta revisión realista destacó el hecho de que el apoyo al proveedor de servicios sanitarios para el uso del partograma a menudo no se tradujo en la práctica. La revisión destacó los componentes centrales esenciales necesarios dentro del ambiente de la asistencia sanitaria que se necesitan para apoyar el uso del partograma. Estos componentes se pueden categorizar ampliamente en aceptabilidad de los trabajadores sanitarios, apoyo del sistema de salud, sistemas de referencia efectivos, recursos humanos y competencia de los trabajadores sanitarios.
Por qué es importante realizar esta revisión
El partograma se ha convertido en una parte integrante de la atención del trabajo de parto habitual en la mayor parte del mundo; por lo tanto, la evaluación de su eficacia es imperativa.
Existen diferentes diseños del partograma, y Cartmill 1992 formuló la hipótesis de que la manera en la que se presenta un partograma puede afectar la percepción de un obstetra del progreso del trabajo de parto y, por lo tanto, influir en la toma de decisiones. Esta hipótesis ha recibido el apoyo de otros investigadores (Lavender 1998b; Tay 1996), que han indicado que la pendiente y la posición de la línea de acción repercuten sobre la cesárea, las tasas de la intervención y la satisfacción materna.
El objetivo de esta revisión es evaluar los efectos beneficiosos y perjudiciales del uso del partograma en el trabajo de parto para permitirles a los médicos y a las pacientes tomar decisiones basadas en la evidencia. Esta revisión es la última actualización de una revisión que se publicó por primera vez en 2008.
Objetivos
El objetivo primario fue determinar la efectividad y la seguridad del uso del partograma sobre la morbilidad y la mortalidad perinatal y materna. El objetivo secundario fue determinar qué diseño del partograma es más efectivo para los resultados de morbilidad y mortalidad perinatal y materna.
Métodos
Criterios de inclusión de estudios para esta revisión
Tipos de estudios
Se incluyeron en esta revisión todos los ensayos controlados grupales, cuasialeatorios y aleatorios publicados, no publicados y en curso que comparan los resultados, como se enumera a continuación, del uso y la no utilización del partograma. Para el análisis secundario se incluyeron los ensayos controlados aleatorios de diferentes diseños del partograma. Se incluyeron ensayos que usaron asignaciones cuasialeatorias (por ejemplo, alternancia). Se excluyeron los estudios que se informaron en forma de resumen, sin información suficiente sobre los métodos del estudio o en los que los resultados no estaban claros, solo después de un intento infructuoso de establecer contacto con el autor del estudio para ampliar la información. Se excluyeron los ensayos cruzados.
Tipos de participantes
Todas las pacientes con embarazos de feto único y presentaciones cefálicas, en trabajo de parto espontáneo a término.
Tipos de intervenciones
Se comparó el tratamiento del trabajo de parto mediante un partograma con el tratamiento del trabajo de parto en el que no se utilizó el partograma. Los dos grupos tenían que diferir sólo en el uso del partograma y no en otras intervenciones de las habitaciones de trabajo de parto, como el apoyo psicológico, el uso de la analgesia o la amniotomía precoz.
Para alcanzar el segundo objetivo se incluyeron los estudios que informaron comparaciones entre diferentes diseños del partograma.
Estas intervenciones son complejas. El partograma se usa de una manera impuesta por las guías acompañantes, lo que puede influir en los resultados. Por lo tanto, siempre que fue posible, se contextualizaron los resultados de los ensayos mediante la descripción de las guías clínicas asociadas.
Tipos de medida de resultado
Resultados primarios
Resultados maternos
Resultados maternos a corto plazo
-
Cesárea
-
Estimulación con oxitocina
-
Duración del período dilatante (duración del trabajo de parto mayor a 18 horas, duración del trabajo de parto mayor a 12 horas)
-
Experiencia del parto negativa (según la definición de los autores del ensayo)
Resultados del lactante
Resultados neonatales a corto plazo
-
Puntuación de Apgar bajo (menor de 7 a los cinco minutos)
Resultados secundarios
Resultados maternos
Resultados maternos a corto plazo
-
Morbilidad materna grave o muerte (p.ej. ruptura del útero, ingreso en la unidad de cuidados intensivos, septicemia, insuficiencia de órganos)
-
Cesárea por sufrimiento fetal
-
Cesárea por retraso en el trabajo de parto
-
Parto vaginal instrumentado
-
Parto vaginal no logrado al cabo de 24 horas, desde el comienzo del trabajo de parto (según la definición de los autores del ensayo)
-
Hemorragia postparto (según la definieron los autores del ensayo)
-
Transfusión de sangre
-
Analgesia regional
-
Uso de opiáceos
-
Duración de la rotura de membranas en el momento del parto
-
Realización de la rotura artificial de las membranas durante el trabajo de parto
-
Trombosis venosa profunda
-
Embolia pulmonar
-
Uso de antibióticos
-
Duración del período expulsivo
-
Número de exámenes vaginales en el trabajo de parto
-
Episiotomía
-
Desgarros de tercer y cuarto grado
-
Distocia de hombros
Resultados maternos a largo plazo
-
Depresión postparto (según la definición de los autores del ensayo)
-
Fracaso en la lactancia (según la definición de los autores del ensayo)
-
Fístulas
-
Dolor perineal
-
Dispareunia
-
Dolor abdominal
-
Dolor lumbar informado seis semanas después del parto
-
Prolapso o incontinencia urinaria
-
Incontinencia fecal
-
Vínculo con el recién nacido (según la definición de los autores del ensayo)
-
Complicaciones de embarazos posteriores
-
Rehospitalización postparto
Resultados para el recién nacido
-
Mortinato o muerte neonatal o morbilidad neonatal, con la exclusión de las malformaciones mortales (p.ej. crisis convulsivas, asfixia al nacer, encefalopatía neonatal)
-
Ingreso en la unidad de cuidados especiales neonatales
-
Necesidad de intubación al nacer
-
Septicemia neonatal
-
Muerte fetal durante el parto
-
Ictericia (según la definición de los autores del ensayo)
-
pH en sangre arterial del cordón menor de 7,1
-
Traumatismo durante el parto (por ejemplo, parálisis de Erb, cráneo fracturado, cefalohematoma, clavícula fracturada)
-
Discapacidad infantil (según la definición de los autores del ensayo)
Personal
-
Facilidad de uso
-
Capacidad de auditoría
Métodos de búsqueda para la identificación de los estudios
The following methods section of this review is based on a standard template used by Cochrane Pregnancy and Childbirth.
Búsquedas electrónicas
We searched Cochrane Pregnancy and Childbirth's Trials Register by contacting their Information Specialist (31 August 2017).
The Register is a database containing over 24,000 reports of controlled trials in the field of pregnancy and childbirth. For full search methods used to populate Pregnancy and Childbirth's Trials Register, including the detailed search strategies for CENTRAL, MEDLINE, Embase and CINAHL; the list of handsearched journals and conference proceedings, and the list of journals reviewed via the current awareness service, please follow this link to the editorial information about Cochrane Pregnancy and Childbirth in the Cochrane Library and select the 'Specialized Register ' section from the options on the left side of the screen.
Briefly, Cochrane Pregnancy and Childbirth's Trials Register is maintained by their Information Specialist and contains trials identified from:
-
monthly searches of the Cochrane Central Register of Controlled Trials (CENTRAL);
-
weekly searches of MEDLINE (Ovid);
-
weekly searches of Embase (Ovid);
-
monthly searches of CINAHL (EBSCO);
-
handsearches of 30 journals and the proceedings of major conferences;
-
weekly current awareness alerts for a further 44 journals plus monthly BioMed Central email alerts.
Two people screen the search results and review the full text of all relevant trial reports identified through the searching activities described above. Based on the intervention described, each trial report is assigned a number that corresponds to a specific Pregnancy and Childbirth review topic (or topics), and is then added to the Register. The Information Specialist searches the Register for each review using this topic number rather than keywords. This results in a more specific search set that has been fully accounted for in the relevant review sections (Included studies; Excluded studies; Studies awaiting classification; Ongoing studies).
In addition, we searched ClinicalTrials.gov and the World Health Organization (WHO) International Clinical Trials Registry Platform (ICTRP) (31 August 2017), for unpublished, planned and ongoing trial reports using the search string: partogram OR partograph.
Búsqueda de otros recursos
We searched the reference lists of retrieved studies. We did not apply any language or date restrictions.
Obtención y análisis de los datos
For methods used in the previous version of this review, see Lavender 2013.
For this update, we used the following methods for assessing the 13 relevant reports that we identified as a result of the updated search.
The following methods section of this review is based on a standard template used by Cochrane Pregnancy and Childbirth.
Selección de los estudios
Two review authors independently assessed for inclusion all the potential studies identified as a result of the search strategy. We resolved any disagreement through discussion or, if required, we consulted the third review author. When one review author was also the trial author (Lavender 1998a; Lavender 2006), the two remaining authors assessed the studies independently.
Extracción y manejo de los datos
We designed a form to extract data. For eligible studies, two review authors extracted the data using the agreed form. We resolved discrepancies through discussion or, if required, we consulted the third review author. We entered data into Review Manager 5 software (Review Manager 2014), and checked for accuracy.
When information regarding any of the above was unclear, we planned to contact authors of the original reports to provide further details.
Evaluación del riesgo de sesgo de los estudios incluidos
Two review authors (AC, RS) independently assessed risk of bias for each study using the criteria outlined in the Cochrane Handbook for Systematic Reviews of Interventions (Higgins 2011). Any disagreement was resolved by discussion or by involving the third review author (TL).
(1) Random sequence generation (checking for possible selection bias)
We described the method used to generate the allocation sequence in sufficient detail to allow an assessment of whether it should produce comparable groups.
For each included study we assessed the method as being at:
-
low risk of bias (any truly random process, e.g. random number table; computer random number generator);
-
high risk of bias (any non‐random process, e.g. odd or even date of birth; hospital or clinic record number);
-
unclear risk of bias.
(2) Allocation concealment (checking for possible selection bias)
For each included study we described the method used to conceal allocation to interventions prior to assignment and assessed whether intervention allocation could have been foreseen in advance of, or during recruitment, or changed after assignment.
We assessed the methods as being at:
-
low risk of bias (e.g. telephone or central randomisation; consecutively numbered sealed opaque envelopes);
-
high risk of bias (open random allocation; unsealed or non‐opaque envelopes, alternation; date of birth);
-
unclear risk of bias.
(3.1) Blinding of participants and personnel (checking for possible performance bias)
For each included study we described the methods used, if any, to blind study participants and personnel from knowledge of which intervention a participant received. We considered that studies were at low risk of bias if they were blinded, or if we judged that the lack of blinding was unlikely to affect results. We assessed blinding separately for different outcomes or classes of outcomes.
We assessed the methods as being at:
-
low, high or unclear risk of bias for participants;
-
low, high or unclear risk of bias for personnel.
(3.2) Blinding of outcome assessment (checking for possible detection bias)
For each included study we described the methods used, if any, to blind outcome assessors from knowledge of which intervention a participant received. We assessed blinding separately for different outcomes or classes of outcomes.
We assessed methods used to blind outcome assessment as being at:
-
low, high or unclear risk of bias.
(4) Incomplete outcome data (checking for possible attrition bias due to the amount, nature and handling of incomplete outcome data)
For each included study, and for each outcome or class of outcomes, we described the completeness of data, including attrition and exclusions from the analysis. We stated whether attrition and exclusions were reported and the numbers included in the analysis at each stage (compared with the total randomised participants), reasons for attrition or exclusion where reported, and whether missing data were balanced across groups or were related to outcomes. Where sufficient information was reported, or could be supplied by the trial authors, we planned to re‐include missing data in the analyses that we undertook.
We assessed methods as being at:
-
low risk of bias (e.g. no missing outcome data; missing outcome data balanced across groups);
-
high risk of bias (e.g. numbers or reasons for missing data imbalanced across groups; ‘as treated’ analysis done with substantial departure of intervention received from that assigned at randomisation);
-
unclear risk of bias.
(5) Selective reporting (checking for reporting bias)
For each included study we described how we investigated the possibility of selective outcome reporting bias and what we found.
We assessed the methods as being at:
-
low risk of bias (where it was clear that all of the study's prespecified outcomes and all expected outcomes of interest to the review have been reported);
-
high risk of bias (where not all the study's prespecified outcomes were reported; one or more reported primary outcomes were not prespecified; outcomes of interest were reported incompletely and so could not be used; study failed to include results of a key outcome that would have been expected to have been reported);
-
unclear risk of bias.
(6) Other bias (checking for bias due to problems not covered by (1) to (5) above)
For each included study we described any important concerns we had about other possible sources of bias.
(7) Overall risk of bias
We made explicit judgements about whether studies were at high risk of bias, according to the criteria given in the Cochrane Handbook for Systematic Reviews of Interventions (Higgins 2011). With reference to (1) to (6) above, we planned to assess the likely magnitude and direction of the bias and whether we considered it was likely to have an impact on the findings. In future updates, we will explore the impact of the level of bias through undertaking sensitivity analyses (Sensitivity analysis).
Medidas del efecto del tratamiento
Dichotomous data
For dichotomous data, we presented results as summary risk ratio (RR) with 95% confidence intervals (CIs).
Continuous data
We used the mean difference (MD) if outcomes were measured in the same way between trials. If necessary, in future updates we will use the standardised mean difference (SMD) to combine trials that measured the same outcome, but used different methods.
Cuestiones relativas a la unidad de análisis
Cluster‐randomised trials
We did not identify any cluster‐randomised trials. In future updates, if we identify any cluster‐randomised trials, we will include them in the analyses along with individually‐randomised trials. We will adjust their sample sizes using the methods described in the Cochrane Handbook for Systematic Reviews of Interventions (Higgins 2011), Section 16.3.4, using an estimate of the intracluster correlation coefficient (ICC) derived from the trial (if possible), from a similar trial or from a study of a similar population. If we use ICCs from other sources, we will report this and conduct sensitivity analyses to investigate the effect of variation in the ICC. If we identify both cluster‐randomised trials and individually‐randomised trials, we plan to synthesise the relevant information. We will consider it reasonable to combine the results from both if there is little heterogeneity between the study designs and the interaction between the effect of intervention and the choice of randomisation unit is considered to be unlikely.
We will also acknowledge heterogeneity in the randomisation unit and perform a sensitivity analysis to investigate the effects of the randomisation unit.
Cross‐over trials
Cross‐over trials are not a valid design for this review and we excluded them.
Other unit of analysis issues
Multiple pregnancies
Women with a multiple pregnancy were not eligible for inclusion in this review.
Trials with multiple treatment arms
Lavender 1998a was a three‐arm trial. For each analysis, we used the data of one intervention pair and excluded the others, following methods outlined in section 16.5.4 of the Cochrane Handbook for Systematic Reviews of Interventions (Higgins 2011).
Manejo de los datos faltantes
For included studies, we noted levels of attrition. In future updates, if we include more eligible studies, we will explore the impact of including studies with high levels of missing data in the overall assessment of treatment effect by using sensitivity analysis.
For all outcomes, we carried out analyses, as far as possible, on an intention‐to‐treat basis, i.e. we attempted to include all participants randomised to each group in the analyses. The denominator for each outcome in each trial was the number randomised minus any participants whose outcomes were known to be missing.
Evaluación de la heterogeneidad
We assessed statistical heterogeneity in each meta‐analysis using the Tau², I² and Chi² statistics. We regarded heterogeneity as substantial if I² was greater than 30% and either Tau² was greater than zero, or there was a low P value (less than 0.10) in the Chi² test for heterogeneity. If we identified substantial heterogeneity (above 30%), we planned to explore it by prespecified subgroup analysis.
Evaluación de los sesgos de notificación
In future updates, if there are 10 or more studies in the meta‐analysis we will investigate reporting biases (such as publication bias) using funnel plots. We will assess funnel plot asymmetry visually. If asymmetry is suggested by a visual assessment, we will perform exploratory analyses to investigate it.
Síntesis de los datos
We carried out statistical analysis using the Review Manager 5 software (Review Manager 2014). We used fixed‐effect meta‐analysis for combining data where it was reasonable to assume that studies were estimating the same underlying treatment effect, i.e. where trials were examining the same intervention, we judged the trials' populations and methods sufficiently similar.
If there was clinical heterogeneity sufficient to expect that the underlying treatment effects differed between trials, or if substantial statistical heterogeneity was detected, we used random‐effects meta‐analysis to produce an overall summary if we considered an average treatment effect across trials clinically meaningful. We treated the random‐effects summary as the average range of possible treatment effects and we planned to discuss the clinical implications of treatment effects differing between trials. If the average treatment effect was not clinically meaningful, we planned not to combine trials. If we used random‐effects analyses, we presented the results as the average treatment effect with 95% CIs, and the estimates of Tau² and I².
Análisis de subgrupos e investigación de la heterogeneidad
If we identified substantial heterogeneity, we planned to investigate it using subgroup analyses and sensitivity analyses and to consider whether an overall summary was meaningful, and if it was, we used random‐effects analysis.
We planned to carry out the following subgroup analyses.
-
Resource setting: low‐resource setting versus high‐resource setting.
We planned to use the following outcomes in subgroup analyses: caesarean section, oxytocin augmentation, duration of first stage of labour, maternal experience of childbirth, Apgar score and admission to special care nursery.
We planned to assess subgroup differences by interaction tests available within Review Manager (Review Manager 2014), and to report the results of subgroup analyses, quoting the Chi² statistic and P value, and the interaction test I² value.
Given the small number of studies in each analysis, we did not perform our planned subgroup analysis as it would not produce a meaningful analysis. We did, however, present the data under high‐ and low‐resource setting subheadings. If more studies are identified in future updates, we will perform a subgroup analysis.
Análisis de sensibilidad
We planned to carry out sensitivity analyses to explore the effect of allocation concealment and attrition bias on overall analyses, so that studies at high risk of bias for these domains were excluded from the analyses to see if this made any difference to the overall results. Two studies did not conceal allocation adequately (Sinha 2017; Walss Rodriguez 1987), and we removed them as part of this sensitivity analysis.
Assessment of the quality of the evidence using the GRADE approach
For this update, we assessed the quality of the evidence using the GRADE approach, as outlined in the GRADE handbook in order to assess the quality of the body of evidence relating to the following outcomes for the main comparison: partograph compared to no partograph (studies carried out in high‐ and low‐resource settings).
-
Caesarean section (overall)
-
Oxytocin augmentation
-
Duration of first stage of labour (length of labour greater than 18 hours, length of labour greater than 12 hours)
-
Maternal experience of childbirth (as defined by trial authors)
-
Low Apgar score (less than 7 at 5 minutes)
-
Serious maternal morbidity or death (e.g. ruptured uterus, admission to intensive care unit, septicaemia, organ failure)
-
Stillbirth or neonatal death or neonatal morbidity, excluding fatal malformations (e.g. seizures, birth asphyxia, neonatal encephalopathy)
We used GRADEpro Guideline Development Tool to import data from Review Manager 5 (Review Manager 2014), in order to create 'Summary of findings' tables. We produced a summary of the intervention effect and a measure of quality for each of the above outcomes using the GRADE approach. The GRADE approach uses five considerations (study limitations, consistency of effect, imprecision, indirectness and publication bias) to assess the quality of the body of evidence for each outcome. The evidence can be downgraded from 'high quality' by one level for serious (or by two levels for very serious) limitations, depending on assessments for risk of bias, indirectness of evidence, serious inconsistency, imprecision of effect estimates or potential publication bias.
Results
Description of studies
Results of the search
See: Figure 2.

Study flow diagram.
We retrieved 13 relevant reports of 10 trials from an updated search in August 2017. Five of the trials met our inclusion criteria and have contributed data to this update (Lee 2015; Orhue 2013; Rani 2015; Shazly 2017; Sinha 2017).
This review now includes 11 studies involving 9475 women (Kenchaveeriah 2011; Lavender 1998a; Lavender 2006; Lee 2015; Orhue 2013; Pattinson 2003; Rani 2015; Shazly 2017; Sinha 2017; Walss Rodriguez 1987; Windrim 2006). Three studies are ongoing (NCT02714270; NCT02741141; NTR5543), and we excluded eight (Ajoodani 2011; Cartmill 1992; Fahdhy 2005; Hamilton 2001; Hamilton 2004; Kogovsek 2000; Mathews 2007; WHO 1994), two in this update (Ajoodani 2011; WHO 1994). Following the updated search, one study is awaiting assessment as we are awaiting further information from authors (NCT02911272).
Included studies
Methods
All trials were randomised controlled trials with individual randomisation. The Walss Rodriguez 1987 trial was quasi‐randomised. The studies by Kenchaveeriah 2011 and Walss Rodriguez 1987 generally lacked detail, making assessment of quality and contextualisation of the results difficult.
Participants and settings
Included studies took place in hospital settings in Australia (Lee 2015), Canada (Windrim 2006), Egypt (Shazly 2017), India (Kenchaveeriah 2011; Rani 2015; Sinha 2017), Mexico (Walss Rodriguez 1987), Nigeria (Orhue 2013), South Africa (Pattinson 2003), and the UK (Lavender 1998a; Lavender 2006).
Three studies took place between 1995 and 2005 (Lavender 1998a; Lavender 2006; Windrim 2006), two between 2005 and 2015 (Kenchaveeriah 2011; Rani 2015), two between 2015 and 2016 (Lee 2015; Shazly 2017), and one took place in 1985 (Walss Rodriguez 1987). The Orhue 2013, Pattinson 2003, and Sinha 2017 trials did not report the dates of their studies.
Most studies only included primiparous women with uncomplicated, low‐risk pregnancies in spontaneous labour (Lavender 1998a; Lavender 2006; Lee 2015; Orhue 2013; Pattinson 2003; Shazly 2017; Sinha 2017; Windrim 2006). The Kenchaveeriah 2011 and Walss Rodriguez 1987 studies did not specify parity, but only included women with uncomplicated pregnancies. The Rani 2015 study only included high‐risk primiparous women.
Interventions and comparisons
Three studies compared partograph use with no partograph (Rani 2015; Walss Rodriguez 1987; Windrim 2006). The Rani 2015 study took place in India, the Windrim 2006 study in Canada, and the Walss Rodriguez 1987 study in Mexico; therefore, they were from very different settings. The Windrim 2006 and Walss Rodriguez 1987 studies both compared their usual descriptive, sequential, recording of intrapartum details, with an experimental arm, i.e. the partograph. The Rani 2015 study compared noting progress in the women's case notes with utilising the World Health Organization (WHO) modified partograph. In the Windrim 2006 study, the partograph used incorporated a two‐hour alert line, but no action line. The Walss Rodriguez 1987 study used a 'Friedman' partograph (Friedman 1954). The partograph was not currently in use in either unit in the Walss Rodriguez 1987 or Windrim 2006 studies; it is unclear if the partograph was used routinely in the Rani 2015 study.
Four studies compared partographs with different placement of action lines (Lavender 1998a; Lavender 2006; Orhue 2013; Sinha 2017). The Lavender 2006 study was a two‐arm trial and the Lavender 1998a study was a three‐arm trial. Other than the placement of the action line, labour management remained consistent. If progress crossed the action line, a diagnosis of prolonged labour was made and managed according to standard protocol; this involved clinical assessment and augmentation, as appropriate.
One study in South Africa compared a partograph with an alert and action line with one which contained an alert line only (Pattinson 2003). In this study, the group that received a partograph with only an alert line received more aggressive intrapartum management; a vaginal examination was carried out every two hours and oxytocin infusion advocated when progress crossed the line. Those with an alert and action line had more expectant management, vaginal examinations every four hours, and commencement of oxytocin if progress crossed the four‐hour action line. The Pattinson 2003 study was financially supported by the South African Medical Research Council but did not report whether the authors disclosed any conflicts of interest. The Kenchaveeriah 2011 study, conducted in India, compared two partographs ‐ a composite partograph including the latent phase with a modified one without the latent phase. This trial was carried out in India were the use of the partograph has not been incorporated and practiced widely, even at the tertiary level. The plotting of the composite partograph was started as soon as the woman was in labour. In the modified partograph, the plotting of the partograph was started with at least 4 cm of cervical dilatation. Prolonged labour was defined when the woman was in labour for more than 12 hours in the active phase.
One study (Shazly 2017), conducted in a hospital in Egypt, compared a labour scale with a traditional WHO partograph. The labour scale was developed from the WHO partograph, and was designed to help clinicians recognise determinants and manage potential labour dystocia (Shazly 2014). The labour scale has particular trigger points throughout first and second stage where management is reviewed instead of having a fixed action line. Vaginal examinations took place two‐hourly in this trial. The labour scale monitors labour by filling in boxes, corresponding with cervical dilatation with dots, lines, or shading, depending on if there is long progress (> 2 cm in two hours), short progress (1 cm in two hours), or no progress, respectively. Progress can be 'reset' if long progress is identified regardless of previous progress. No progress after two hours was followed either by artificial rupture of membranes, or oxytocin augmentation. For women undergoing artificial rupture of membranes, oxytocin augmentation was not started unless there was no change in dilatation at the next examination. Dashed lines at points throughout the scale recommend clinical re‐evaluation: "after 8 hours of the latent phase, at the membrane line, at the augmentation line and after 1 hour of the second stage" (Shazly 2014). We took most of the data for this trial from an unpublished trial report provided by the authors.
One pilot study took place in Australia and compared a traditional partograph with a two‐hour action line (Lee 2015), with a dystocia line. The dystocia line partograph starts when the woman's cervix is a minimum of 4 cm dilated. The stepped line steepens at 6 cm to account for the "progressive acceleration" of labour. If the action line or vertical step line were crossed, a vaginal examination was performed in two hours to assess whether the line had been crossed, and oxytocin augmentation was then discussed.
Outcomes
Only two outcomes were reported by all trials; caesarean section rates and Apgar score. Other outcomes were not consistently reported; no trials reported vaginal birth not achieved within 24 hours, from onset of labour (as defined by trial authors), blood transfusion, duration of rupture of the membranes at the time of birth, deep venous thrombosis, pulmonary embolism, episiotomy, third‐ and fourth‐degree tears, shoulder dystocia, neonatal septicaemia, jaundice, ability to audit, or any of the review's long‐term maternal or baby outcomes.
Funding and conflicts of interest
The Windrim 2006 study was supported by a grant from the Physicians' Services Incorporated Foundation, Canada, The Lavender 1998a and Lavender 2006 studies were funded by the Liverpool Women's Hospital, and the Pattinson 2003 study had financial support from the South African Medical Research Council. None of the other studies reported their funding sources.
None of the studies reported if any authors had conflicts of interest.
Excluded studies
We excluded eight studies from this review: two trials lacked sufficient detail to assess them adequately (Hamilton 2001; Kogovsek 2000), and we were unable to contact the authors; two studies did not have partographs as an intervention (Fahdhy 2005; Hamilton 2004); one used partographs in both trial arms (Ajoodani 2011); one was a cross‐over trial (Mathews 2007); and two were not randomised controlled trials (Cartmill 1992; WHO 1994).
Risk of bias in included studies
We assessed included studies for methodological quality on the basis of sequence generation, allocation concealment, blinding, attrition and other concerns about bias (see Methods section above, and Figure 3).

Risk of bias summary: review authors' judgements about each risk of bias item for each included study.
Allocation
We graded sequence generation as adequate (and therefore at low risk of bias) in seven studies, with studies reporting the use of either a random number table or a computer random number generator (Kenchaveeriah 2011; Lavender 1998a; Lavender 2006; Pattinson 2003; Rani 2015; Shazly 2017; Windrim 2006), high risk in two due to quasi‐randomisation and lack of information provided (Sinha 2017; Walss Rodriguez 1987), and unclear in two (Lee 2015; Orhue 2013). The Lee 2015 study used block randomisation, and the Orhue 2013 study gave no information.
Allocation concealment was unclear in four trials (Kenchaveeriah 2011; Orhue 2013; Pattinson 2003; Rani 2015); low risk in five trials (Lavender 1998a; Lavender 2006; Lee 2015; Shazly 2017; Windrim 2006); and high risk in the Sinha 2017 and Walss Rodriguez 1987 trials. The Walss Rodriguez 1987 study was quasi‐randomised but the method of randomisation was not reported. The method of randomisation was not clear in the Sinha 2017 study, however they reported the participants were “equally divided into two groups” which suggests quasi‐randomisation. There was also no information in either study on how women were allocated to groups.
Blinding
Due to the nature of the intervention, it was not feasible to blind the women or clinical staff in any of the studies. Blinding of outcome assessors was not attempted in three studies (Orhue 2013; Rani 2015; Sinha 2017), and was not mentioned in five studies (Kenchaveeriah 2011; Pattinson 2003; Shazly 2017; Walss Rodriguez 1987; Windrim 2006). Three studies were at low risk of detection bias due to the blinding of the statistician or researcher involved in outcome assessment (Lavender 1998a; Lavender 2006; Lee 2015).
Incomplete outcome data
We judged attrition to be low in seven studies (Kenchaveeriah 2011; Lavender 1998a; Lavender 2006; Lee 2015; Pattinson 2003; Walss Rodriguez 1987; Windrim 2006), with less than 1% of participants excluded or lost to follow‐up. In one trial (Lavender 1998a), there were higher levels of missing data (13.5%) for the maternal experience outcome. In this study, maternal experience was only assessed in a subset of women (n = 615); this comprised all women recruited over a prespecified 12‐month period, of whom 519 responded. Four studies were at unclear risk of attrition bias either due to lack of information in the trials reports (Orhue 2013; Rani 2015; Sinha 2017), or a small number of women withdrawing prior to the intervention and analysis (Shazly 2017).
Selective reporting
Seven studies appeared to report all planned outcomes and we judged them to be at low risk of bias (Kenchaveeriah 2011; Lavender 1998a; Lavender 2006; Lee 2015; Pattinson 2003; Rani 2015; Windrim 2006). Reporting bias was unclear in the Walss Rodriguez 1987 trial due to lack of prespecified outcomes reported. There was too little information in the Orhue 2013 and Sinha 2017 trials to assess this domain adequately. We judged the Shazly 2017 study at high risk of reporting bias as some of the trial's primary outcomes were not reported.
Other potential sources of bias
We judged the Lee 2015, Kenchaveeriah 2011, Rani 2015, and Shazly 2017 studies as being at low risk of other sources of bias. Six trials were at unclear risk: the Lavender 1998a and Lavender 2006 trials did not randomise all eligible women; the Orhue 2013, Sinha 2017, and Walss Rodriguez 1987 trials did not provide sufficient information to adequately asses this domain; and the Windrim 2006 trial gave no information on the number of women approached or the numbers of eligible women declining participation. We considered the Pattinson 2003 study to be at high risk of bias as recruitment was stopped before the required sample size was reached due to funding constraints.
Effects of interventions
No trials reported: vaginal birth not achieved within 24 hours, from onset of labour (as defined by trial authors); blood transfusion; duration of rupture of the membranes at the time of birth; deep venous thrombosis; pulmonary embolism; episiotomy, third‐ and fourth‐degree tears; shoulder dystocia; neonatal septicaemia; jaundice; ability to audit; or any of the review's long‐term maternal or baby outcomes.
1. Partograph versus no partograph
We included three randomised trials in this comparison, with 1813 women participating (Rani 2015; Walss Rodriguez 1987; Windrim 2006). The Walss Rodriguez 1987 study reported only three outcomes, and the Rani 2015 study only two outcomes relevant to this review, therefore we only pooled results for these outcomes. We assessed evidence using the GRADE approach for this comparison (see summary of findings Table for the main comparison).
Primary outcomes
Caesarean section
There was no clear difference between groups in caesarean section rates (average risk ratio (RR) 0.77, 95% confidence interval (CI) 0.40 to 1.46; n = 1813; 3 trials; I² = 87%; very low‐quality evidence; Analysis 1.1). There were high levels of heterogeneity for this result (heterogeneity: Tau² = 0.28; Chi² = 15.07 (P = 0.0005); I² = 87%) so this result should be interpreted with caution.
Oxytocin augmentation
The Windrim 2006 study reported no clear difference between groups in oxytocin augmentation (RR 1.02, 95% CI 0.95 to 1.10; n = 1156; 1 trial; moderate‐quality evidence; Analysis 1.2).
Duration of first stage of labour
The Windrim 2006 study reported no clear difference between groups in duration of first stage of labour (mean difference (MD) 0.80 hours, 95% CI ‐0.06 to 1.66; n = 1156; 1 trial; low‐quality evidence; Analysis 1.3).
Maternal experience of childbirth
Not reported in this comparison.
Low Apgar score (less than 7 at 5 minutes)
There was no clear difference between groups in Apgar score less than 7 at five minutes (RR 0.76, 95% CI 0.29 to 2.03; n = 1596; 2 trials; very low‐quality evidence; Analysis 1.4).
Secondary outcomes
In addition to the general list of outcomes not reported in any of the trials (see under heading ‘Effects of Interventions’), no trials reported the following secondary outcomes for this comparison: serious maternal morbidity or death; caesarean section for fetal distress; caesarean section for delay in labour; instrumental vaginal birth; postpartum haemorrhage; opioid use; antibiotic use; stillbirth or neonatal death or neonatal morbidity, excluding fatal malformations; need for intubation at birth; intrapartum fetal death; cord blood arterial pH less than 7.1; birth trauma; childhood disability; usability.
Instrumental vaginal birth
There was no clear difference between groups in instrumental vaginal birth in high‐ or low‐resource settings (RR 0.99, 95% CI 0.84 to 1.15; n = 1813; 3 trials; Analysis 1.5).
There was insufficient evidence of benefit or harm in any of the other secondary maternal or neonatal outcomes, reported by the Windrim 2006 study.
-
Regional analgesia ‐ epidural (RR 1.01, 95% CI 0.98 to 1.05; n = 1156; 1 trial; Analysis 1.6).
-
Performance of artificial rupture of membranes (RR 0.99, 95% CI 0.88 to 1.11; n = 1156; 1 trial; Analysis 1.7).
-
Antibiotic use (RR 1.23, 95% CI 0.88 to 1.73; n = 1156; 1 trial; Analysis 1.8).
-
Duration of second stage of labour (MD 0.00 hours, 95% CI ‐0.21 to 0.21; n = 1156; 1 trial; Analysis 1.9).
-
Number of vaginal examinations in labour (mean of 4 examinations in labour for both groups; Analysis 1.10).
-
Admission to special care nursery (RR 0.94, 95% CI 0.51 to 1.75; n = 1156; 1 trial; Analysis 1.11).
Sensitivity analysis
The Walss Rodriguez 1987 study had poor allocation concealment and provided very little information on study methods. In view of the high risk of bias associated with this study, we carried out a sensitivity analysis excluding it from Analysis 1.1, Analysis 1.4, and Analysis 1.5. There were no clear differences between groups when we removed this study.
2. Partograph with two‐hour action line versus partograph with four‐hour action line
Four randomised trials were included in this comparison with 4749 women participating (Lavender 1998a; Lavender 2006; Orhue 2013; Sinha 2017). Two studies were carried out in the same high‐resource setting (Lavender 1998a; Lavender 2006); two studies were carried out in a low‐resource setting (Orhue 2013; Sinha 2017).
Primary outcomes
Caesarean section
There was no clear difference in caesarean section rates between the groups (average RR 1.06, 95% CI 0.88 to 1.28; n = 4749; 4 trials; Analysis 2.1).
Oxytocin augmentation
Women in the two‐hour action line group were more likely to receive oxytocin augmentation (average RR 2.44, 95% CI 1.36 to 4.35; n = 4749; 4 trials; I² = 96%; Analysis 2.2). There is high heterogeneity in this outcome and the results should be interpreted with caution (Tau² = 0.29; I² = 96%). The effect was much greater for the women in the two‐hour action line group in the low‐resource setting (average RR 7.22, 95% CI 2.49 to 20.91; n = 1148; 2 trials; I² = 78%), than in the high‐resource setting (average RR 1.14, 95% CI 1.05 to 1.22; n = 3601; 2 trials). However there was high heterogeneity within the low‐resource setting subgroup (Tau² = 0.46; I² = 78%) and this should be interpreted with caution.
Duration of first stage of labour
One trial reported "prolonged labour" (Orhue 2013). No clear difference was observed between groups (RR 0.81, 95% CI 0.32 to 2.04; n = 948; 1 trial; Analysis 2.3).
Maternal experience of childbirth (reported as negative childbirth experience)
There was no clear difference in number of women reporting negative childbirth experience between groups (average RR 0.61, 95% CI 0.28 to 1.35; n = 2269; 2 trials; I² = 83%; Analysis 2.4). Heterogeneity was high for the outcome (Tau² = 0.27; I² = 83%) and the results should be interpreted with caution.
Low Apgar score (less than 7 at 5 minutes)
There was no clear difference between groups in babies with low Apgar scores (RR 0.93, 95% CI 0.61 to 1.42; n = 4749; 4 trials; Analysis 2.5).
Secondary outcomes
In addition to the general list of outcomes not reported in any of the trials (see under heading ‘Effects of Interventions’), no trials reported the following secondary outcomes for this comparison: opioid use; antibiotic use; duration of second stage of labour; need for intubation at birth; intrapartum fetal death; birth trauma; childhood disability; usability.
There were no clear differences in any of the secondary maternal or neonatal outcomes reported in these trials.
-
Serious maternal morbidity or death (no events in either group; Analysis 2.6).
-
Caesarean section for fetal distress (RR 1.30, 95% CI 0.86 to 1.96; n = 3601; 2 trials; Analysis 2.7).
-
Caesarean section for delay in labour (RR 0.98, 95% CI 0.77 to 1.25; n = 3601; 2 trials; Analysis 2.8).
-
Instrumental vaginal birth (RR 0.92, 95% CI 0.81 to 1.04; n = 3801; 3 trials; Analysis 2.9).
-
Postpartum haemorrhage ‐ blood loss > 500 mL (RR 1.06, 95% CI 0.90 to 1.25; n = 4549; 3 trials; Analysis 2.10).
-
Regional analgesia ‐ epidural (average RR 1.06, 95% CI 0.92 to 1.21; n = 3601; 2 trials; I² = 35%; Analysis 2.11). Heterogeneity is over 30% for this outcome (Tau² = 0.00; I² = 35%) and the results should be interpreted cautiously.
-
Performance of artificial rupture of membranes (average RR 1.00, 95% CI 0.84 to 1.18; n = 3801; 3 trials; I² = 55%; Analysis 2.12). Heterogeneity is over 30% for this outcome (Tau² = 0.01; I² = 55%) and the results should be interpreted cautiously.
-
Number of vaginal examinations in labour (MD ‐0.08, 95% CI ‐0.37 to 0.21; random‐effects; n = 3601; 2 trials; I² = 70%; Tau² = 0.03; Analysis 2.13). High heterogeneity has been noted for this outcome and the results should be interpreted cautiously.
-
Serious neonatal morbidity or perinatal death (no events in either group; Analysis 2.14).
-
Admission to special care nursery (RR 0.83, 95% CI 0.51 to 1.34; n = 3801; 3 trials; Analysis 2.15).
-
Cord blood arterial pH less than 7.1 (RR 0.73, 95% CI 0.44 to 1.22; n = 3601; 2 trials; Analysis 2.16).
Sensitivity analysis
The Sinha 2017 trial did not give clear information on allocation concealment but states that women were "equally divided into two groups" which suggests quasi‐randomisation was used. In view of the high risk of bias associated with this study, we carried out a sensitivity analysis, excluding it from Analysis 2.1, Analysis 2.2, Analysis 2.5, Analysis 2.9, Analysis 2.12, and Analysis 2.15. There were no clear differences between groups when we removed this study. Performance of artificial rupture of membranes (Analysis 2.12), appeared to favour the four‐hour partograph when the Sinha 2017 trial was removed, however, the lower CI still touched the line of no effect.
3. Partograph with two‐hour action line versus partograph with three‐hour action line
Only one randomised trial (carried out in a high‐resource setting) compared a two‐hour versus a three‐hour action line, with 617 women participating (Lavender 1998a).
Primary outcomes
Caesarean section
There was no clear difference in overall caesarean section rate (RR 0.78, 95% CI 0.51 to 1.18; n = 617; 1 trial; Analysis 3.1).
Oxytocin augmentation
There was no clear difference between groups for oxytocin augmentation (RR 1.02, 95% CI 0.85 to 1.21; n = 617; 1 trial; Analysis 3.2).
Duration of first stage of labour
Not reported in this comparison.
Maternal experience of childbirth (reported as negative childbirth experience)
Women in the two‐hour action line group were less likely to report a negative childbirth experience than those in the three‐hour action line group (RR 0.49, 95% CI 0.27 to 0.90; n = 348; 1 trial; Analysis 3.3).
Low Apgar score (less than 7 at 5 minutes)
There was no clear difference between the groups in the number of babies with Apgar scores of less than 7 at five minutes (RR 1.44, 95% CI 0.41 to 5.05; n = 617; 1 trial; Analysis 3.4).
Secondary outcomes
In addition to the general list of outcomes not reported in any of the trials (see under heading ‘Effects of Interventions’), this trial did not report the following secondary outcomes for this comparison: opioid use; antibiotic use; duration of second stage of labour; need for intubation at birth; intrapartum fetal death; birth trauma; childhood disability; usability.
There were no clear differences in any of the secondary maternal or neonatal outcomes reported in this trial.
-
Serious maternal morbidity or death (no events in either group; Analysis 3.5).
-
Caesarean section for fetal distress (RR 0.96, 95% CI 0.44 to 2.10; n = 617; 1 trial; Analysis 3.6).
-
Caesarean section for delay in labour (RR 0.71, 95% CI 0.42 to 1.19; n = 617; 1 trial; Analysis 3.7).
-
Instrumental vaginal birth (RR 0.93, 95% CI 0.69 to 1.26; n = 617; 1 trial; Analysis 3.8).
-
Postpartum haemorrhage ‐ blood loss > 500 mL (RR 0.96, 95% CI 0.63 to 1.45; n = 617; 1 trial; Analysis 3.9).
-
Regional analgesia ‐ epidural (RR 1.16, 95% CI 0.94 to 1.44; n = 617; 1 trial; Analysis 3.10).
-
Performance of artificial rupture of membranes during labour (RR 0.94, 95% CI 0.77 to 1.15; n = 617; 1 trial; Analysis 3.11).
-
Number of vaginal examinations in labour (MD 0.00, 95% CI ‐0.29 to 0.29; n = 617; 1 trial; Analysis 3.12).
-
Serious neonatal morbidity or perinatal death (no events in either group; Analysis 3.13).
-
Admission to special care nursery (RR 3.83, 95% CI 0.43 to 34.12; n = 617; 1 trial; Analysis 3.14).
-
Cord blood arterial pH less than 7.1 (RR 0.38, 95% CI 0.07 to 1.96; n = 617; 1 trial; Analysis 3.15).
4. Partograph with three‐hour action line versus partograph with four‐hour action line
Only one randomised trial, again carried out in a high‐resource setting, compared a three‐hour versus a four‐hour action line, with 613 women participating (Lavender 1998a).
Primary outcomes
Caesarean section
Caesarean section rate was higher in the three‐hour action line group (RR 1.70, 95% CI 1.07 to 2.70; n = 613; 1 trial; Analysis 4.1).
Oxytocin augmentation
There was no clear difference in oxytocin augmentation between the groups (RR 1.09, 95% CI 0.91 to 1.30; n = 613; 1 trial; Analysis 4.2).
Duration of first stage of labour
Not reported in this comparison.
Maternal experience of childbirth (reported as negative childbirth experience)
There was no clear difference in negative childbirth experiences between the groups (RR 0.80, 95% CI 0.51 to 1.27; n = 340; 1 trial; Analysis 4.3). Loss to follow‐up was noticeably high for this outcome.
Low Apgar score (less than 7 at 5 minutes)
There was no clear difference between the groups in the number of babies with Apgar scores of less than 7 at five minutes (RR 0.82, 95% CI 0.22 to 3.04; n = 613; 1 trial; Analysis 4.4).
Secondary outcomes
In addition to the general list of outcomes not reported in any of the trials (see under heading ‘Effects of Interventions’), this trial did not report the following secondary outcomes for this comparison: opioid use; antibiotic use; duration of second stage of labour; need for intubation at birth; intrapartum fetal death; birth trauma; childhood disability; usability.
There were no clear differences between the groups for any of the reported secondary outcomes.
-
Serious maternal morbidity or death (no events in either group; Analysis 4.5).
-
Caesarean section for fetal distress (RR 1.77, 95% CI 0.70 to 4.42; n = 613; 1 trial; Analysis 4.6).
-
Caesarean section for delay in labour (RR 1.68, 95% CI 0.97 to 2.91; n = 613; 1 trial; Analysis 4.7).
-
Instrumental vaginal birth (RR 0.96, 95% CI 0.72 to 1.28; n = 613; one trial; Analysis 4.8).
-
Postpartum haemorrhage ‐ blood loss > 500 mL (RR 1.03, 95% CI 0.68 to 1.56; n = 613; 1 trial; Analysis 4.9).
-
Regional analgesia ‐ epidural (RR 1.01, 95% CI 0.80 to 1.27; n = 613; 1 trial; Analysis 4.10).
-
Performance of artificial rupture of membranes during labour (RR 1.04, 95% CI 0.85 to 1.26; n = 613; 1 trial; Analysis 4.11).
-
Number of vaginal examinations in labour (MD 0.10, 95% CI ‐0.19 to 0.39; n = 613; 1 trial; Analysis 4.12).
-
Serious neonatal morbidity or perinatal death (no events in either group; Analysis 4.13).
-
Admission to special care nursery (RR 0.51, 95% CI 0.05 to 5.65; n = 613; 1 trial; Analysis 4.14).
-
Cord blood arterial pH less than 7.1 (RR 2.57, 95% CI 0.50 to 13.17; n = 613; 1 trial; Analysis 4.15).
5. Partograph with alert line only versus partograph with alert and action line
Only one randomised trial compared a partograph with an alert line only versus a partograph with an alert and action line, with 694 women participating (Pattinson 2003). This trial was carried out in a low‐resource setting.
Primary outcomes
Caesarean section
The caesarean section rate was lower in the alert line only group (RR 0.68, 95% CI 0.50 to 0.93; n = 694; 1 trial; Analysis 5.1).
Oxytocin augmentation
There was no clear difference when oxytocin augmentation was managed aggressively, with the use of a single alert and action line, or conservatively with separate alert and action lines (RR 0.81, 95% CI 0.62 to 1.05; n = 694; 1 trial; Analysis 5.2).
Duration of first stage of labour
Not reported in this comparison.
Maternal experience of childbirth
Not reported in this comparison.
Low Apgar score (less than 7 at five minutes)
There was no clear difference in number of low Apgar scores at five minutes between the groups (RR 7.12, 95% CI 0.37 to 137.36; n = 694; 1 trial; Analysis 5.3).
Secondary outcomes
In addition to the general list of outcomes not reported in any of the trials (see under heading ‘Effects of Interventions’), no trials reported the following secondary outcomes for this comparison: serious maternal morbidity or death; caesarean section for fetal distress; caesarean section for delay in labour; postpartum haemorrhage; regional analgesia; opioid use; performance of artificial rupture of the membranes during labour; antibiotic use; duration of second stage of labour; number of vaginal examinations in labour; stillbirth or neonatal death or neonatal morbidity, excluding fatal malformations; admission to special care nursery; need for intubation at birth; intrapartum fetal death; cord blood arterial pH less than 7.1; birth trauma; childhood disability; usability
There were no clear differences in any of the secondary maternal or neonatal outcomes reported in this trial.
-
Instrumental vaginal birth (RR 0.87, 95% CI 0.66 to 1.15; n = 694; 1 trial; Analysis 5.4).
-
Perinatal death (RR 7.12, 95% CI 0.37 to 137.36; n = 694; 1 trial; Analysis 5.5).
6. Partograph with latent phase versus partograph without latent phase
Only one study examined the comparison between partograph with latent phase (composite) versus partograph without latent phase (modified) (Kenchaveeriah 2011), and 743 women participated.
Primary outcomes
Caesarean section
The caesarean section rate was higher in the partograph with latent phase (composite) group (95% RR 2.45, 95% CI 1.72 to 3.50; n = 743; 1 trial; Analysis 6.1).
Oxytocin augmentation
The partograph with latent phase condition produced more incidences of augmentation of labour (RR 2.18, 95% CI 1.67 to 2.83; n = 743; 1 trial; Analysis 6.2).
Duration of first stage of labour
Not reported in this comparison.
Maternal experience of childbirth
Not reported in this comparison.
Low Apgar score (less than 7 at 5 minutes)
There was no clear advantage for one condition with respect to Apgar score less than 7 at five minutes (RR 0.75, 95% CI 0.21 to 2.63; n = 743; 1 trial; Analysis 6.3).
Secondary outcomes
In addition to the general list of outcomes not reported in any of the trials (see under heading ‘Effects of Interventions’), no trials reported the following secondary outcomes for this comparison: serious maternal morbidity or death; postpartum haemorrhage; regional analgesia; opioid use; performance of artificial rupture of the membranes during labour; antibiotic use; duration of second stage of labour; number of vaginal examinations in labour; stillbirth or neonatal death or neonatal morbidity, excluding fatal malformations; need for intubation at birth; intrapartum fetal death; cord blood arterial pH less than 7.1; birth trauma; childhood disability.
Caesarean section for fetal distress
The level of caesarean section fetal distress was higher in the partograph with latent phase (composite) (RR 4.87, 95% CI 2.83 to 8.37; n = 743; 1 trial; Analysis 6.4).
Caesarean section for delay in labour
There was no clear difference between the groups in the caesarean section rate for delay in labour (RR 1.35, 95% CI 0.59 to 3.08; n = 743; 1 trial; Analysis 6.5).
Instrumental vaginal birth
There was no clear advantage for one condition with respect to instrumental vaginal birth (RR 1.04, 95% CI 0.61 to 1.77; n = 743; 1 trial; Analysis 6.6).
Admission to special care nursery
There were fewer admissions to special care nursery in the partograph without latent phase condition (RR 1.84, 95% CI 1.29 to 2.63; n = 743; 1 trial; Analysis 6.7).
Usability: user‐friendliness score
In the modified partograph group there was a higher user‐friendliness score (mean difference (MD) ‐7.89, 95% CI ‐8.14 to ‐7.64; n = 743; 1 trial; Analysis 6.8); 93% of staff felt the partograph with latent phase (composite) was more difficult to use. The partographs were scored on ease of teaching, usefulness, interpretation and overall rating.
7. Partograph with two‐hour action line versus partograph with stepped dystocia line
One pilot study involving 99 women took place in Australia (Lee 2015), and compared a traditional partograph with a two‐hour action line, with a dystocia line. The dystocia line partograph starts when the woman's cervix is a minimum of 4 cm dilated. The stepped line steepens at 6 cm to account for the "progressive acceleration" of labour. If the action line or vertical step line were crossed, a vaginal examination was performed in two hours to assess whether the line had been crossed, and oxytocin augmentation was then discussed.
Primary outcomes
Caesarean section
There was no clear difference between the groups in rates of caesarean section (RR 1.10, 95% CI 0.46 to 2.62; n = 99; 1 trial; Analysis 7.1).
Oxytocin augmentation
Fewer women in the dystocia line group received oxytocin augmentation than those in the two‐hour action line group (RR 0.62, 95% CI 0.39 to 0.98; n = 99; 1 trial; Analysis 7.2).
Duration of first stage of labour (labour longer than 12 hours)
There was no clear difference between the groups in duration of the first stage of labour (labour longer than 12 hours) (RR 0.76, 95% CI 0.31 to 1.89; n = 99; 1 trial; Analysis 7.3).
Maternal experience of childbirth (Birth Satisfaction Score (BSS‐R))
Women in both groups gave similar birth satisfaction scores in a survey completed in the immediate postpartum period (MD 0.00, 95% CI ‐3.58 to 3.58; n = 90; 1 trial; Analysis 7.4).
Low Apgar score (less than 4 at 4 minutes) (non‐prespecified outcome)
One baby in each group had an Apgar score less than 4 at four minutes (RR 0.98, 95% CI 0.06 to 15.23; n = 99; 1 trial; Analysis 7.5). An Apgar score below 7 at five minutes was not reported.
Secondary outcomes
In addition to the general list of outcomes not reported in any of the trials (see under heading ‘Effects of Interventions’), no trials reported the following secondary outcomes for this comparison: serious maternal morbidity or death; caesarean section for fetal distress; caesarean section for delay in labour; performance of artificial rupture of the membranes during labour; antibiotic use; duration of second stage of labour; number of vaginal examinations in labour; stillbirth or neonatal death or neonatal morbidity, excluding fatal malformations; admission to special care nursery; intrapartum fetal death; cord blood arterial pH less than 7.1; birth trauma; childhood disability; usability.
There were no clear differences between groups for any of the secondary outcomes reported.
-
Instrumental vaginal birth (RR 0.75, 95% CI 0.37 to 1.56; n = 99; 1 trial; Analysis 7.6).
-
Postpartum haemorrhage ‐ blood loss > 500 mL (RR 1.57, 95% CI 0.55 to 4.46; n = 99; 1 trial; Analysis 7.7).
-
Regional analgesia (RR 0.86, 95% CI 0.56 to 1.32; n = 99; 1 trial; Analysis 7.8).
-
Opioid use (RR 0.98, 95% CI 0.45 to 2.14; n = 99; 1 trial; Analysis 7.9).
-
Need for intubation at birth. Described as "active resuscitation" (RR 0.44, 95% CI 0.14 to 1.32; n = 99; 1 trial; Analysis 7.10).
8. Partograph versus labour scale
Only one small study compared a labour scale versus a traditional WHO partograph (Shazly 2017). One‐hundred and twenty‐two women were randomised, though six women in each group withdrew prior to analysis. We have used the number randomised for all outcomes except for Apgar score less than 7 at five minutes, neonatal death, and duration of first stage of labour.
Primary outcomes
Caesarean section
There were no clear differences between the groups for overall caesarean section (RR 0.42, 95% CI 0.16 to 1.11; n = 122; 1 trial; Analysis 8.1).
Oxytocin augmentation
Fewer women in the labour scale group received oxytocin augmentation (RR 0.32, 95% CI 0.18 to 0.54; n = 122; 1 trial; Analysis 8.2).
Duration of first stage of labour
The Shazly 2017 trial reported duration of active stage of labour. There was no clear difference between the labour scale and partograph groups (MD 0.44 hours, 95% CI ‐0.40 to 1.28; n = 110; 1 trial; Analysis 8.3).
Maternal experience of childbirth
Not reported in this comparison.
Low Apgar score (less than 7 at 5 minutes)
No babies in either group had Apgar scores of less than 7 at five minutes (110 babies; Analysis 8.4).
Secondary outcomes
In addition to the general list of outcomes not reported in any of the trials (see under heading ‘Effects of Interventions’), no trials reported the following secondary outcomes for this comparison: serious maternal morbidity or death; caesarean section for fetal distress; instrumental vaginal birth; postpartum haemorrhage; regional analgesia; opioid use; performance of artificial rupture of the membranes during labour; antibiotic use; duration of second stage of labour; number of vaginal examinations in labour; admission to special care nursery; need for intubation at birth; intrapartum fetal death; cord blood arterial pH less than 7.1; birth trauma; childhood disability; usability.
Caesarean section for delay in labour
Fewer women in the labour scale group had a caesarean section for delay in labour (RR 0.20, 95% CI 0.05 to 0.88; n = 122; 1 trial; Analysis 8.5).
Stillbirth or neonatal death or neonatal morbidity
The trial reported that there were no neonatal complications (110 babies; Analysis 8.6).
Birth injuries and postpartum haemorrhage (PPH) (non‐prespecified outcome)
There was no clear difference between the groups for birth injuries and PPH (RR 3.00, 95% CI 0.32 to 28.04; n = 122; 1 trial; Analysis 8.7).
Discusión
Resumen de los resultados principales
Se reclutaron en total 9475 pacientes de 11 ensayos que compararon el uso del partograma; tres ensayos compararon el uso del partograma con ningún partograma, siete ensayos compararon diferentes diseños del partograma y un ensayo comparó una escala de trabajo de parto versus el partograma.
Partograma versus ningún partograma (Comparación 1: tres ensayos, 1703 mujeres)
no hubo evidencia de diferencias claras entre el uso del partograma y ningún partograma en las tasas de cesáreas (evidencia de muy baja calidad); estimulación con oxitocina (evidencia de calidad moderada); duración del período de dilatación (evidencia de baja calidad); o puntuación de Apgar menor de 7 a los cinco minutos (evidencia de muy baja calidad).
La morbilidad materna grave o la muerte (p.ej. rotura uterina, ingreso a unidad de cuidados intensivos, septicemia, insuficiencia de órganos) y la muerte fetal o la muerte neonatal o la morbilidad neonatal, con la exclusión de las malformaciones mortales (p.ej. crisis convulsivas, asfixia al nacer, encefalopatía neonatal) no se informaron en esta comparación.
Partograma con diferente colocación de las líneas de acción (Comparaciones 2 ‐ 4: cuatro ensayos, 5051 mujeres)
En comparación con una línea de acción de cuatro horas, las pacientes en el grupo de la línea de acción de dos horas tuvieron mayores probabilidades de recibir estimulación con oxitocina. No hubo diferencias claras en las tasas de cesáreas, la duración del período de dilatación, la experiencia materna del parto, o la puntuación de Apgar menor de 7 a los cinco minutos entre la línea de acción de dos y de cuatro horas.
Las siguientes comparaciones solo incluyen datos de estudios únicos. Menos pacientes informaron experiencias negativas del parto en el grupo de la línea de acción de dos horas que en el grupo de la línea de acción de tres horas, pero no hubo diferencias claras entre los grupos en cuanto a la cesárea, la estimulación con oxitocina o la puntuación de Apgar bajo. No se informó la duración del período de dilatación.
Cuando se compararon los grupos de una línea de acción de tres y de cuatro horas, la tasa de cesáreas fue mayor en el grupo de una línea de acción de tres horas. No se observaron diferencias claras en la estimulación con oxitocina, la experiencia materna del parto o la puntuación de Apgar bajo. No se informó la duración del período de dilatación.
Partograma con línea de alerta sola versus partograma con línea de alerta y de acción (Comparación 5: un ensayo, 694 mujeres)
La tasa de cesáreas fue inferior en el grupo con una línea de alerta sola. No hubo diferencias claras entre los grupos para la estimulación con oxitocina, la puntuación de Apgar bajo, el parto vaginal instrumental o la muerte perinatal.
La duración del período de dilatación y la experiencia materna del parto no se informaron en este ensayo.
Partograma con fase latente versus partograma sin fase latente (Comparación 6: un ensayo, 743 mujeres)
Cuando se comparó un partograma con una fase latente (compuesto) y uno sin dicha fase (modificado), las tasas de cesáreas y estimulación con oxitocina fueron mayores en el partograma con una fase latente. No hubo diferencias claras entre los grupos para la estimulación con oxitocina ni para la puntuación de Apgar menor de 7 a los cinco minutos.
La duración del período de dilatación y la experiencia materna del parto no se informaron.
Partograma con línea de acción de dos horas versus partograma con línea de distocia escalonada (Comparación 7: un ensayo, 99 mujeres)
Cuando se comparó una línea de acción de dos horas y una línea de distocia escalonada, menos pacientes recibieron estimulación con oxitocina en el grupo de la línea de distocia. No observaron diferencias claras en las tasas de cesáreas, la duración del período de dilatación, la experiencia materna del parto o los índices de Apgar bajo.
Uso de partograma versus escala de trabajo de parto (Comparación 8: un ensayo, 122 mujeres)
La escala de trabajo de parto comparada con el partograma dio lugar a menos cesáreas por retraso en el trabajo de parto y a que menos pacientes recibieran estimulación con oxitocina, pero no produjo diferencias claras en la tasa general de cesáreas, la duración del período de dilatación o la puntuación de Apgar bajo.
Compleción y aplicabilidad general de las pruebas
Según la evidencia limitada de los 11 ensayos incluidos en esta revisión, se mantiene la incertidumbre con respecto a la efectividad del uso del partograma.
Solo tres ensayos compararon el uso del partograma con ningún uso del partograma. Estos ensayos se realizaron en diferentes ámbitos; uno en un contexto de ingresos altos (Windrim 2006), y los otros dos en un contexto de ingresos bajos (Rani 2015: Walss Rodriguez 1987). En dos estudios(Walss Rodriguez 1987; Windrim 2006), el partograma fue el brazo experimental. No está claro en el estudio Rani 2015 si este fue el brazo experimental o no. Estos resultados no se pueden extrapolar a las unidades donde el partograma se encuentra en uso actualmente; la eliminación del partograma en contraposición con su introducción puede producir resultados diferentes.
Siete ensayos compararon el uso de diferentes diseños del partograma para las pacientes en trabajo de parto espontáneo. La evidencia combinada de cuatro ensayos que compararon la colocación diferente de las líneas de acción mostraron poca diferencia en las tasas de cesáreas y pocas diferencias de otros resultados maternos (Lavender 1998a; Lavender 2006; Orhue 2013; Sinha 2017). Cuando se comparó la línea de acción de dos horas con la línea de acción de cuatro horas, la única diferencia encontrada fue un aumento de la estimulación con oxitocina en el brazo de dos horas. Estos datos no son sorprendentes dado que las guías asociadas recomiendan el uso temprano de la oxitocina. Cuando se compararon la línea de acción de dos horas y la línea de acción de tres horas, se encontraron diferencias en la experiencia materna autoinformada, con menos pacientes que informaron una experiencia negativa en el brazo de dos horas. No está clara la relevancia de estos resultados, especialmente porque la comparación entre los brazos de dos horas versus los brazos de cuatro horas y brazos de tres horas versus de cuatro horas no mostró diferencias. Es posible que las pacientes del brazo de dos horas hayan tenido la percepción de que su trabajo de parto era más corto, ya que la política local era una línea de acción de tres horas. Alternativamente, también es posible que dado que las pacientes cuyos trabajos de parto fueron tratados con la línea de acción de dos horas recibieron más intervención, también recibieron más apoyo en el trabajo de parto. No hubo diferencias en los resultados neonatales. Aunque los resultados de estos estudios eran bastante coherentes, ambos estudios fueron realizados en el mismo ámbito, y por consiguiente, es necesario considerar su generalizabilidad.
No se combinó el ensayo sudafricano con los ensayos anteriores (Pattinson 2003), ya que fue un ensayo que comparó un partograma con una línea de alerta y tratamiento dinámico versus uno con una línea de alerta y una línea de acción, con un tratamiento más conservador. Este ensayo describió un paquete de atención para el manejo del trabajo de parto junto con el uso del partograma que recomendó exámenes vaginales más frecuentes (cada dos horas) para las pacientes del grupo de tratamiento dinámico, por lo que indicó una intervención más compleja. Este estudio comparó diferentes diseños del partograma que demostraron claramente una diferencia en las tasas de cesáreas; el brazo más dinámico tuvo una tasa inferior. Dado que el partograma es una intervención compleja que se utiliza conjuntamente con las guías del trabajo de parto, el enfoque usado en este estudio puede ser más apropiado. La utilización de un enfoque reduccionista, a la que es esencialmente una intervención compleja, puede producir resultados menos significativos.
Kenchaveeriah 2011 comparó dos partogramas, un partograma compuesto que incluyó la fase latente con uno modificado sin la fase latente. El ensayo confirmó que un partograma sin una fase latente se asoció con una tasa inferior de cesáreas, lo que indica que el trabajo de parto se puede tratar sin graficar la fase latente en el partograma.
Solo dos de los ensayos incluyeron pacientes multíparas(Kenchaveeriah 2011; Walss Rodriguez 1987), un ensayo solo incluyó pacientes con embarazos de alto riesgo (Rani 2015), y todos los otros ensayos incluyeron pacientes con embarazos sin complicaciones en trabajo de parto espontáneo. Sin embargo, en realidad el partograma se utiliza en un espectro amplio de pacientes durante el período intraparto. Es necesario considerar la aplicabilidad de los hallazgos de esta revisión para las pacientes embarazadas que no entran en los criterios de inclusión de los ensayos incluidos. Sería preferible realizar estudios de investigación adicionales sobre diferentes poblaciones.
Los resultados clínicos importantes no se informaron en los ensayos incluidos, en particular en ámbitos de ingresos bajos, p.ej. la duración de los períodos de dilatación y expulsivo. Ninguno de los ensayos examinó la repercusión del partograma sobre la utilización de los recursos, un factor particularmente importante en ámbitos de ingresos bajos. Solo los estudios de Lavender informaron medidas de experiencia materna del parto(Lavender 1998a; Lavender 2006). Ninguno de los estudios informó la calidad de la atención como un resultado.
Calidad de la evidencia
La evidencia de esta revisión no es concluyente. La evidencia de los ensayos que compararon el uso del partograma con ningún partograma se limitaron a solo tres ensayos con 1813 pacientes, con riesgo de sesgo variable (Rani 2015; Walss Rodriguez 1987; Windrim 2006). Para esta comparación, los resultados predeterminados se evaluaron mediante el enfoque GRADE; la evidencia para la cesárea y para la puntuación de Apgar bajo (menor de 7 a los cinco minutos) se calificó como de muy baja calidad, la evidencia para la estimulación con oxitocina fue de calidad moderada, y la duración del período de dilatación fue de baja calidad. La experiencia materna del parto, la morbilidad grave materna y neonatal o la muerte no se informaron bajo esta comparación. La calidad de la evidencia se disminuyó debido a las limitaciones en el diseño de los estudios, la heterogeneidad alta, la falta de direccionalidad y la imprecisión en las estimaciones del efecto.
En general, el riesgo de sesgo varió en los ensayos incluidos y en ningún ensayo se realizó cegamiento de las pacientes o el personal. Dos estudios no ocultaron adecuadamente la asignación. Las pérdidas durante el seguimiento fueron bajas en todos los estudios. El estudio más fuerte en cuanto a calidad fue el realizado por Windrim 2006, que no mostró diferencias en los resultados clínicos medidos (tasa de cesáreas, duración del trabajo de parto, estimulación con oxitocina, amniotomía, uso de epidural, uso de antibióticos en el trabajo de parto, puntuaciones de Apgar o ingresos a la unidad de cuidados intensivos neonatales) después de la introducción del partograma. Sin embargo, según lo reconocieron los autores del estudio, los resultados pueden haber sido influidos por el porcentaje relativamente alto de incumplimiento al llenar el partograma (20%) o por la contaminación cruzada de la atención por el personal, o ambos.
Sesgos potenciales en el proceso de revisión
Se acepta la posibilidad de que se haya introducido sesgo en el proceso de revisión, aunque se adoptaron medidas para disminuir dicha posibilidad. Dos autores de la revisión evaluaron de forma independiente la inclusión de todos los estudios con posibilidad de ser incluidos, identificados como resultado de la estrategia de búsqueda. Los desacuerdos se resolvieron mediante discusión o, si fue necesario, mediante la consulta al tercer revisor. Dos autores de la revisión, de forma independiente, también evaluaron el riesgo de sesgo para cada estudio. Cualquier desacuerdo se resolvió mediante discusión o implicación de un tercer evaluador.
Tina Lavender era la investigadora en dos ensayos incluidos en esta revisión (Lavender 1998a; Lavender 2006); por lo tanto, otros dos autores de la revisión (Smyth y Cuthbert) evaluaron estos estudios.
Acuerdos y desacuerdos con otros estudios o revisiones
No se encontraron revisiones que abordaran directamente los resultados clínicos relacionados con el uso del partograma. Sin embargo, dos revisiones recientes que exploraron las barreras y los facilitadores para el uso del partograma pueden ayudar a los trabajos en curso(Bedwell 2017; Ollerhead 2014). Ambas revisiones reconocen los retos para el uso de los partogramas actuales, pero también destacan los factores multifacéticos que pueden contribuir a su éxito o su fracaso como herramienta de monitorización del trabajo de parto.
Una revisión de los exámenes vaginales tiene cierta relevancia para la revisión actual (Downe 2013), en particular con respecto a la parte del cervicograma del partograma; sin embargo, la evidencia actualmente presentada se limita a dos estudios pequeños.
Hay una gran cantidad de guías, políticas y manuales de entrenamiento locales, nacionales e internacionales, que preconizan el uso del partograma; la mayoría recomendaría el partograma modificado de la Organización Mundial de la Salud (OMS). Hasta que se publique evidencia adicional, estos documentos aún son relevantes. Es probable que la evidencia emergente que pone en entredicho las creencias acerca de los modelos normales del progreso del trabajo de parto dé lugar a cambios en el diseño de los partogramas y a recomendaciones posteriores(Oladapo 2017).
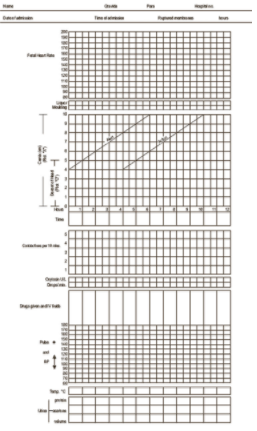
Modified partograph
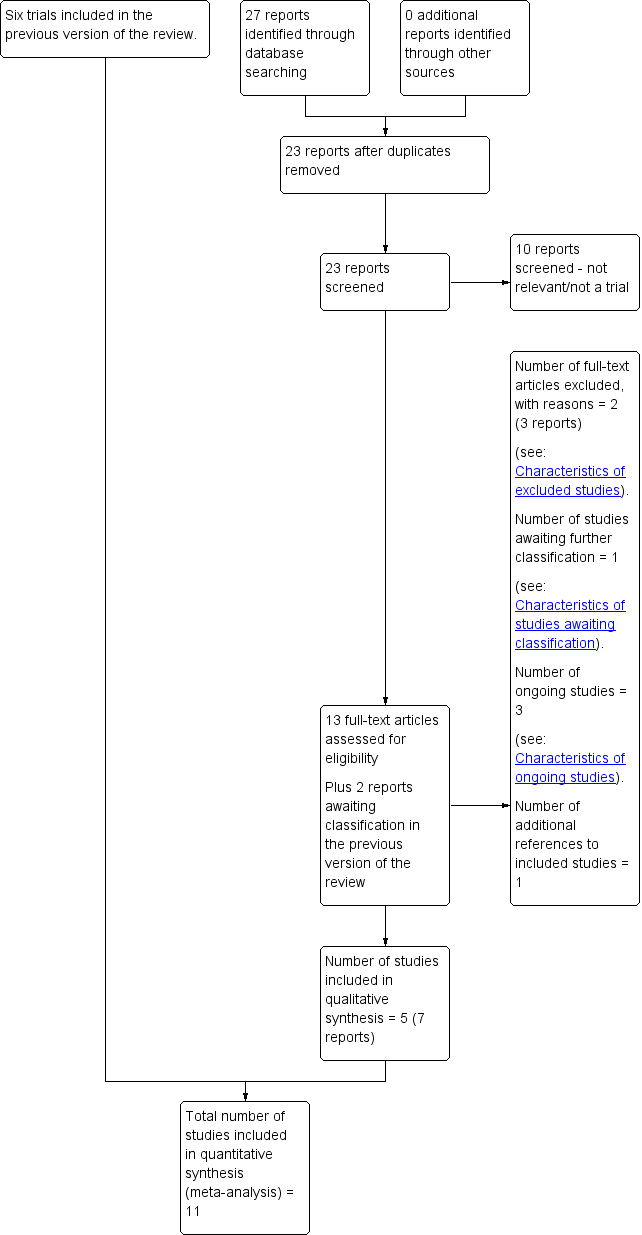
Study flow diagram.

Risk of bias summary: review authors' judgements about each risk of bias item for each included study.

Comparison 1 Partograph versus no partograph (studies carried out in high‐ and low‐resource settings), Outcome 1 Caesarean section (overall).
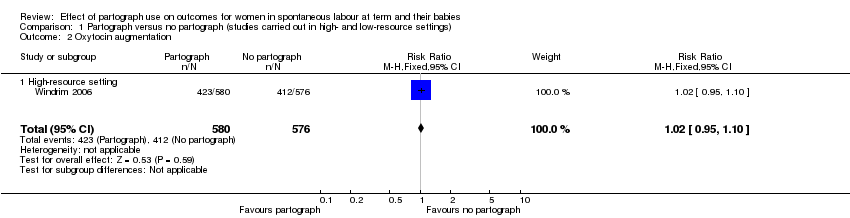
Comparison 1 Partograph versus no partograph (studies carried out in high‐ and low‐resource settings), Outcome 2 Oxytocin augmentation.

Comparison 1 Partograph versus no partograph (studies carried out in high‐ and low‐resource settings), Outcome 3 Duration of first stage of labour.

Comparison 1 Partograph versus no partograph (studies carried out in high‐ and low‐resource settings), Outcome 4 Low Apgar score (less than 7 at 5 minutes).

Comparison 1 Partograph versus no partograph (studies carried out in high‐ and low‐resource settings), Outcome 5 Instrumental vaginal birth.

Comparison 1 Partograph versus no partograph (studies carried out in high‐ and low‐resource settings), Outcome 6 Regional analgesia ‐ epidural.

Comparison 1 Partograph versus no partograph (studies carried out in high‐ and low‐resource settings), Outcome 7 Performance of artificial rupture of membranes during labour.
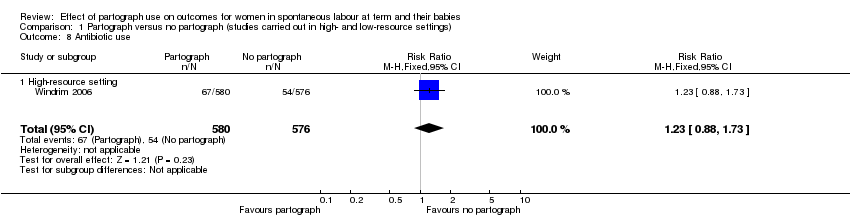
Comparison 1 Partograph versus no partograph (studies carried out in high‐ and low‐resource settings), Outcome 8 Antibiotic use.
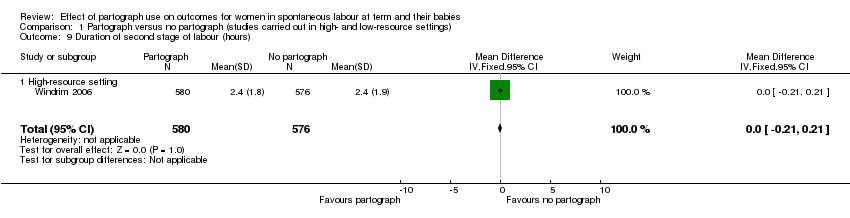
Comparison 1 Partograph versus no partograph (studies carried out in high‐ and low‐resource settings), Outcome 9 Duration of second stage of labour (hours).

Comparison 1 Partograph versus no partograph (studies carried out in high‐ and low‐resource settings), Outcome 10 Number of vaginal examinations.

Comparison 1 Partograph versus no partograph (studies carried out in high‐ and low‐resource settings), Outcome 11 Admission to special care nursery.

Comparison 2 Partograph with 2‐hour action line versus partograph with 4‐hour action line (studies carried out in a high‐ and low‐resource settings), Outcome 1 Caesarean section (overall).
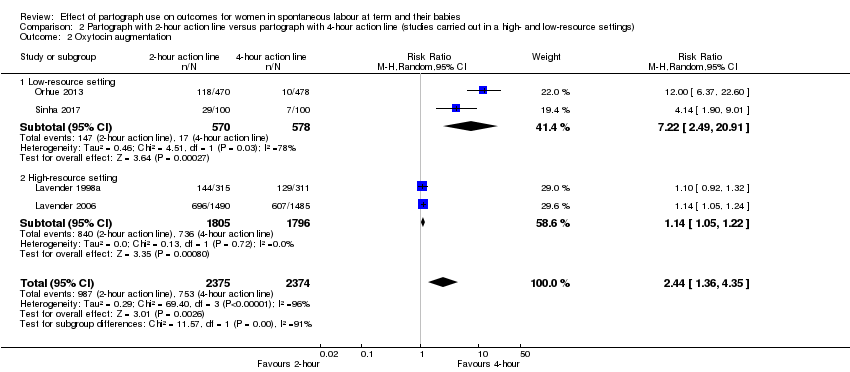
Comparison 2 Partograph with 2‐hour action line versus partograph with 4‐hour action line (studies carried out in a high‐ and low‐resource settings), Outcome 2 Oxytocin augmentation.

Comparison 2 Partograph with 2‐hour action line versus partograph with 4‐hour action line (studies carried out in a high‐ and low‐resource settings), Outcome 3 Duration of first stage of labour (length of labour greater than 18 hours, length of labour greater than 12 hours).
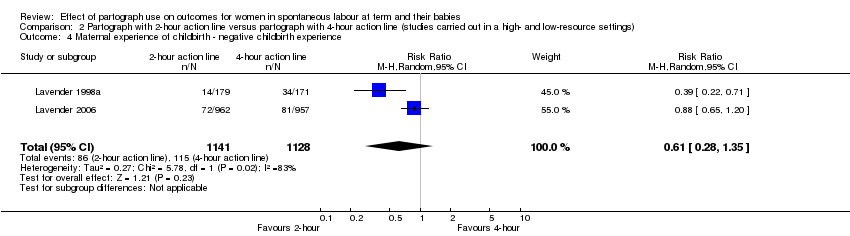
Comparison 2 Partograph with 2‐hour action line versus partograph with 4‐hour action line (studies carried out in a high‐ and low‐resource settings), Outcome 4 Maternal experience of childbirth ‐ negative childbirth experience.

Comparison 2 Partograph with 2‐hour action line versus partograph with 4‐hour action line (studies carried out in a high‐ and low‐resource settings), Outcome 5 Low Apgar score (less than 7 at 5 minutes).
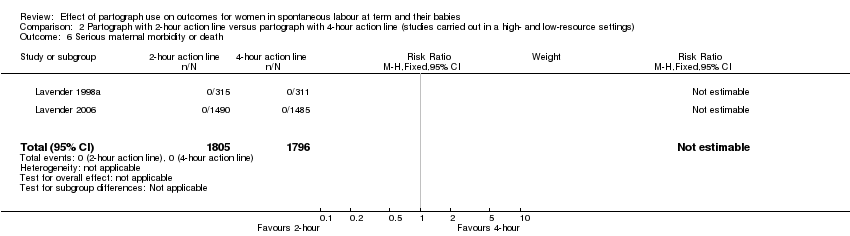
Comparison 2 Partograph with 2‐hour action line versus partograph with 4‐hour action line (studies carried out in a high‐ and low‐resource settings), Outcome 6 Serious maternal morbidity or death.
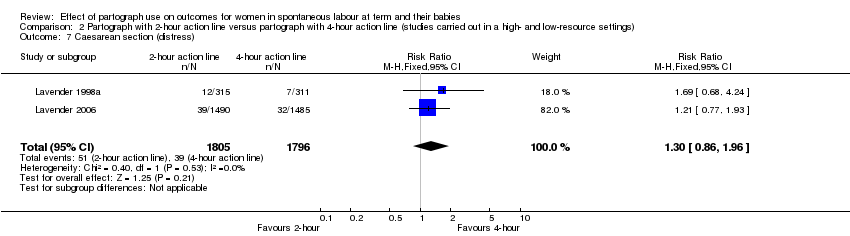
Comparison 2 Partograph with 2‐hour action line versus partograph with 4‐hour action line (studies carried out in a high‐ and low‐resource settings), Outcome 7 Caesarean section (distress).
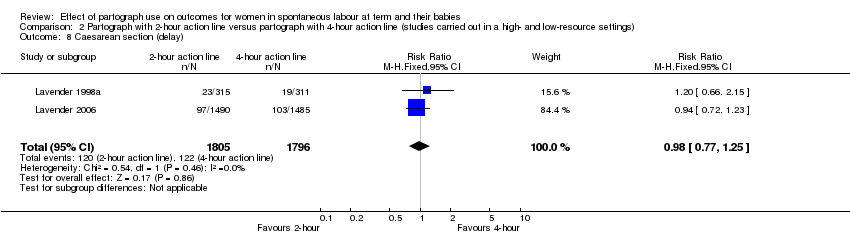
Comparison 2 Partograph with 2‐hour action line versus partograph with 4‐hour action line (studies carried out in a high‐ and low‐resource settings), Outcome 8 Caesarean section (delay).

Comparison 2 Partograph with 2‐hour action line versus partograph with 4‐hour action line (studies carried out in a high‐ and low‐resource settings), Outcome 9 Instrumental vaginal delivery.

Comparison 2 Partograph with 2‐hour action line versus partograph with 4‐hour action line (studies carried out in a high‐ and low‐resource settings), Outcome 10 Postpartum haemorrhage ‐ blood loss > 500 mL.

Comparison 2 Partograph with 2‐hour action line versus partograph with 4‐hour action line (studies carried out in a high‐ and low‐resource settings), Outcome 11 Regional analgesia ‐ epidural.
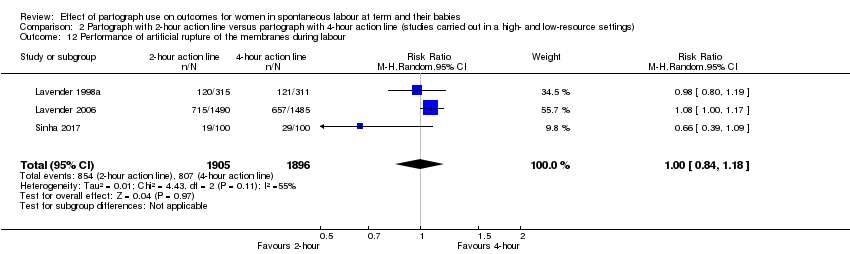
Comparison 2 Partograph with 2‐hour action line versus partograph with 4‐hour action line (studies carried out in a high‐ and low‐resource settings), Outcome 12 Performance of artificial rupture of the membranes during labour.

Comparison 2 Partograph with 2‐hour action line versus partograph with 4‐hour action line (studies carried out in a high‐ and low‐resource settings), Outcome 13 Number of vaginal examinations in labour.

Comparison 2 Partograph with 2‐hour action line versus partograph with 4‐hour action line (studies carried out in a high‐ and low‐resource settings), Outcome 14 Serious neonatal morbidity or perinatal death.

Comparison 2 Partograph with 2‐hour action line versus partograph with 4‐hour action line (studies carried out in a high‐ and low‐resource settings), Outcome 15 Admission to special care nursery.

Comparison 2 Partograph with 2‐hour action line versus partograph with 4‐hour action line (studies carried out in a high‐ and low‐resource settings), Outcome 16 Cord blood arterial pH less than 7.1.
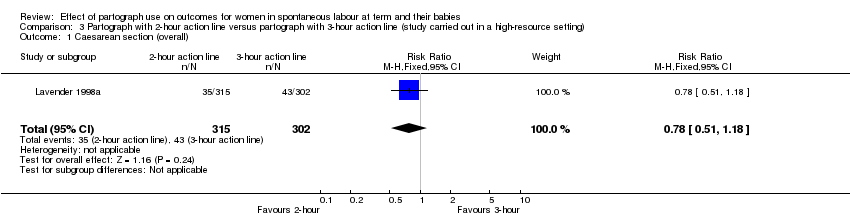
Comparison 3 Partograph with 2‐hour action line versus partograph with 3‐hour action line (study carried out in a high‐resource setting), Outcome 1 Caesarean section (overall).
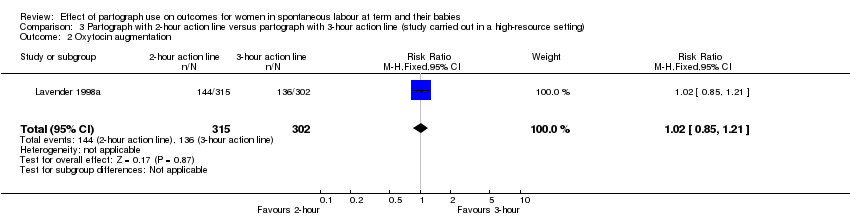
Comparison 3 Partograph with 2‐hour action line versus partograph with 3‐hour action line (study carried out in a high‐resource setting), Outcome 2 Oxytocin augmentation.
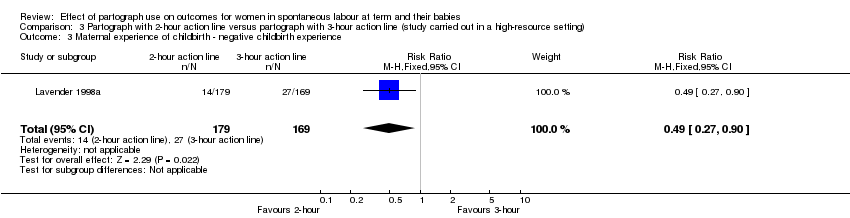
Comparison 3 Partograph with 2‐hour action line versus partograph with 3‐hour action line (study carried out in a high‐resource setting), Outcome 3 Maternal experience of childbirth ‐ negative childbirth experience.

Comparison 3 Partograph with 2‐hour action line versus partograph with 3‐hour action line (study carried out in a high‐resource setting), Outcome 4 Low Apgar score (less than 7 at 5 minutes).

Comparison 3 Partograph with 2‐hour action line versus partograph with 3‐hour action line (study carried out in a high‐resource setting), Outcome 5 Serious maternal morbidity or death.

Comparison 3 Partograph with 2‐hour action line versus partograph with 3‐hour action line (study carried out in a high‐resource setting), Outcome 6 Caesarean section (distress).

Comparison 3 Partograph with 2‐hour action line versus partograph with 3‐hour action line (study carried out in a high‐resource setting), Outcome 7 Caesarean section (delay).

Comparison 3 Partograph with 2‐hour action line versus partograph with 3‐hour action line (study carried out in a high‐resource setting), Outcome 8 Instrumental vaginal delivery.

Comparison 3 Partograph with 2‐hour action line versus partograph with 3‐hour action line (study carried out in a high‐resource setting), Outcome 9 Postpartum haemorrhage ‐ blood loss > 500 mL.

Comparison 3 Partograph with 2‐hour action line versus partograph with 3‐hour action line (study carried out in a high‐resource setting), Outcome 10 Regional analgesia ‐ epidural.

Comparison 3 Partograph with 2‐hour action line versus partograph with 3‐hour action line (study carried out in a high‐resource setting), Outcome 11 Performance of artificial rupture of membranes during labour.

Comparison 3 Partograph with 2‐hour action line versus partograph with 3‐hour action line (study carried out in a high‐resource setting), Outcome 12 Vaginal examinations.
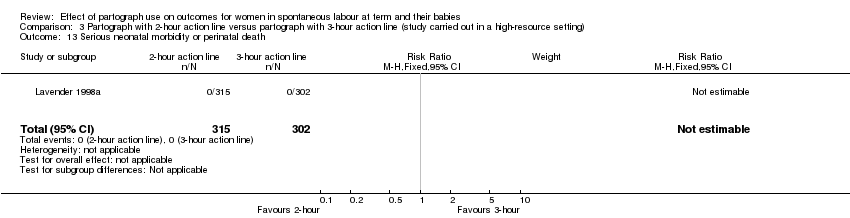
Comparison 3 Partograph with 2‐hour action line versus partograph with 3‐hour action line (study carried out in a high‐resource setting), Outcome 13 Serious neonatal morbidity or perinatal death.

Comparison 3 Partograph with 2‐hour action line versus partograph with 3‐hour action line (study carried out in a high‐resource setting), Outcome 14 Admission to special care nursery.
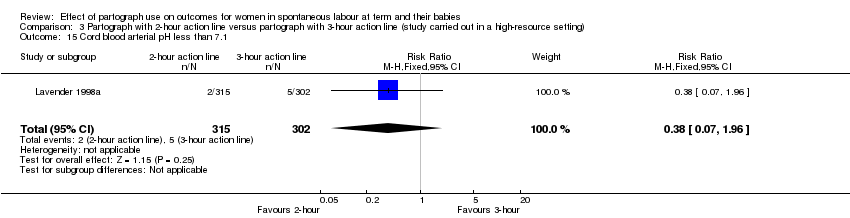
Comparison 3 Partograph with 2‐hour action line versus partograph with 3‐hour action line (study carried out in a high‐resource setting), Outcome 15 Cord blood arterial pH less than 7.1.
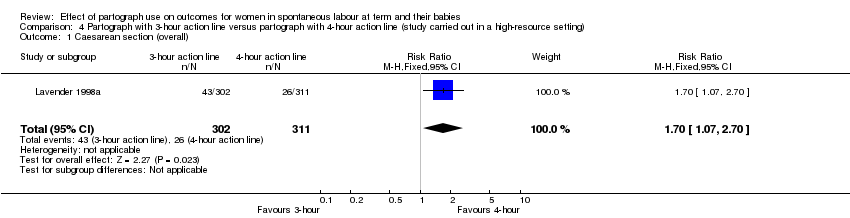
Comparison 4 Partograph with 3‐hour action line versus partograph with 4‐hour action line (study carried out in a high‐resource setting), Outcome 1 Caesarean section (overall).

Comparison 4 Partograph with 3‐hour action line versus partograph with 4‐hour action line (study carried out in a high‐resource setting), Outcome 2 Oxytocin augmentation.

Comparison 4 Partograph with 3‐hour action line versus partograph with 4‐hour action line (study carried out in a high‐resource setting), Outcome 3 Maternal experience of childbirth ‐ negative childbirth experience.
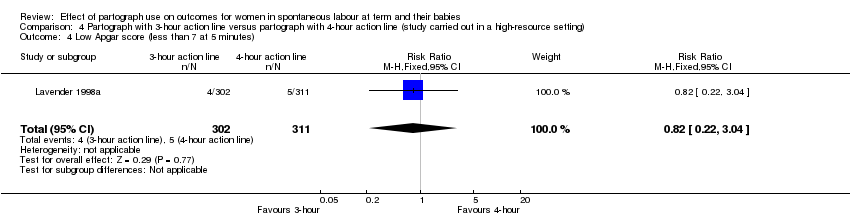
Comparison 4 Partograph with 3‐hour action line versus partograph with 4‐hour action line (study carried out in a high‐resource setting), Outcome 4 Low Apgar score (less than 7 at 5 minutes).

Comparison 4 Partograph with 3‐hour action line versus partograph with 4‐hour action line (study carried out in a high‐resource setting), Outcome 5 Serious maternal morbidity or death.

Comparison 4 Partograph with 3‐hour action line versus partograph with 4‐hour action line (study carried out in a high‐resource setting), Outcome 6 Caesarean section (distress).
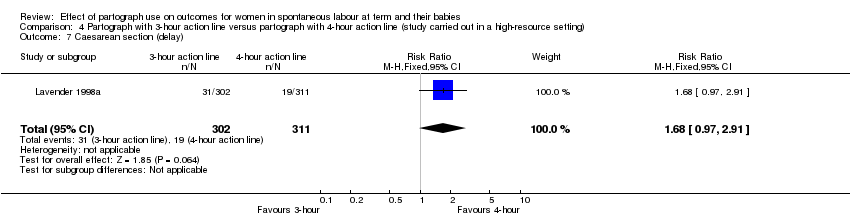
Comparison 4 Partograph with 3‐hour action line versus partograph with 4‐hour action line (study carried out in a high‐resource setting), Outcome 7 Caesarean section (delay).
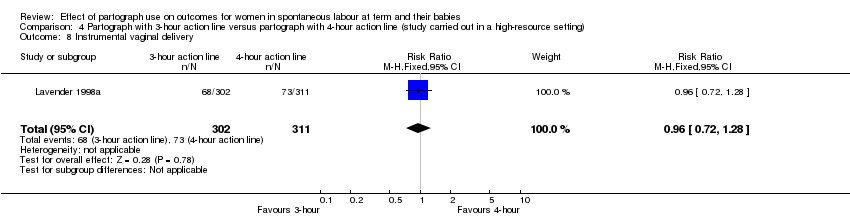
Comparison 4 Partograph with 3‐hour action line versus partograph with 4‐hour action line (study carried out in a high‐resource setting), Outcome 8 Instrumental vaginal delivery.

Comparison 4 Partograph with 3‐hour action line versus partograph with 4‐hour action line (study carried out in a high‐resource setting), Outcome 9 Postpartum haemorrhage ‐ blood loss > 500 mL.

Comparison 4 Partograph with 3‐hour action line versus partograph with 4‐hour action line (study carried out in a high‐resource setting), Outcome 10 Regional analgesia ‐ epidural.

Comparison 4 Partograph with 3‐hour action line versus partograph with 4‐hour action line (study carried out in a high‐resource setting), Outcome 11 Performance of artificial rupture of membranes during labour.
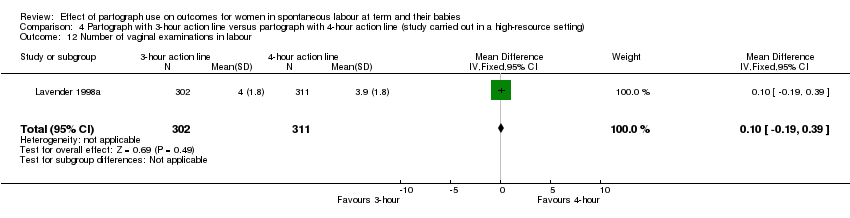
Comparison 4 Partograph with 3‐hour action line versus partograph with 4‐hour action line (study carried out in a high‐resource setting), Outcome 12 Number of vaginal examinations in labour.

Comparison 4 Partograph with 3‐hour action line versus partograph with 4‐hour action line (study carried out in a high‐resource setting), Outcome 13 Serious neonatal morbidity or perinatal death.

Comparison 4 Partograph with 3‐hour action line versus partograph with 4‐hour action line (study carried out in a high‐resource setting), Outcome 14 Admission to special care nursery.
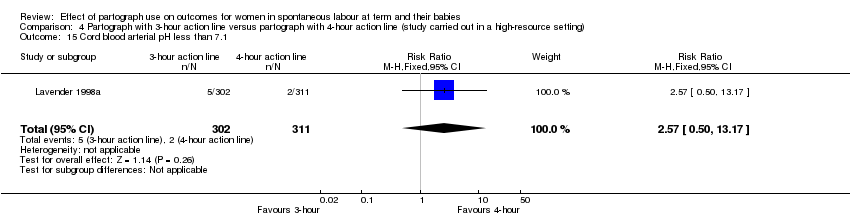
Comparison 4 Partograph with 3‐hour action line versus partograph with 4‐hour action line (study carried out in a high‐resource setting), Outcome 15 Cord blood arterial pH less than 7.1.
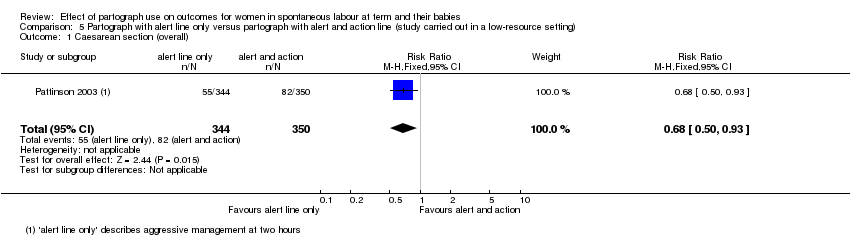
Comparison 5 Partograph with alert line only versus partograph with alert and action line (study carried out in a low‐resource setting), Outcome 1 Caesarean section (overall).
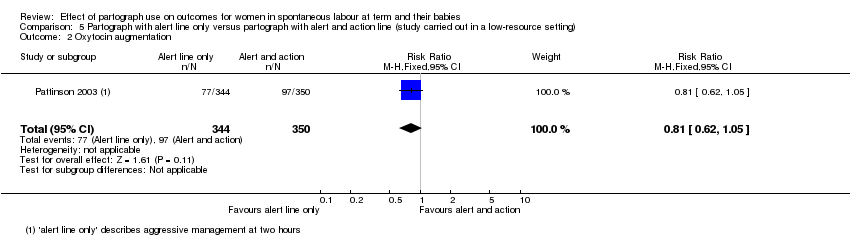
Comparison 5 Partograph with alert line only versus partograph with alert and action line (study carried out in a low‐resource setting), Outcome 2 Oxytocin augmentation.
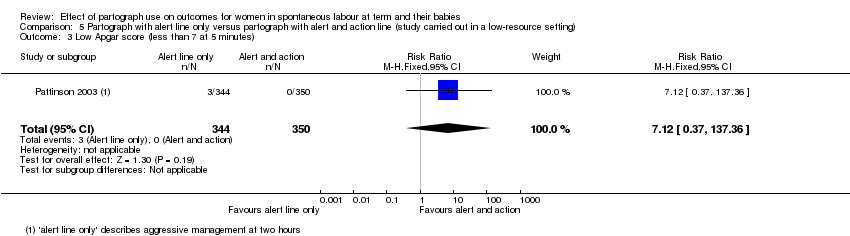
Comparison 5 Partograph with alert line only versus partograph with alert and action line (study carried out in a low‐resource setting), Outcome 3 Low Apgar score (less than 7 at 5 minutes).

Comparison 5 Partograph with alert line only versus partograph with alert and action line (study carried out in a low‐resource setting), Outcome 4 Instrumental vaginal delivery.

Comparison 5 Partograph with alert line only versus partograph with alert and action line (study carried out in a low‐resource setting), Outcome 5 Serious neonatal morbidity or perinatal death.

Comparison 6 Partograph with latent phase versus partograph without latent phase (study carried out in a low‐resource setting), Outcome 1 Caesarean section (overall).
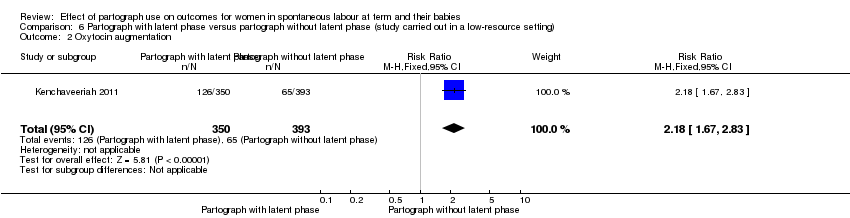
Comparison 6 Partograph with latent phase versus partograph without latent phase (study carried out in a low‐resource setting), Outcome 2 Oxytocin augmentation.
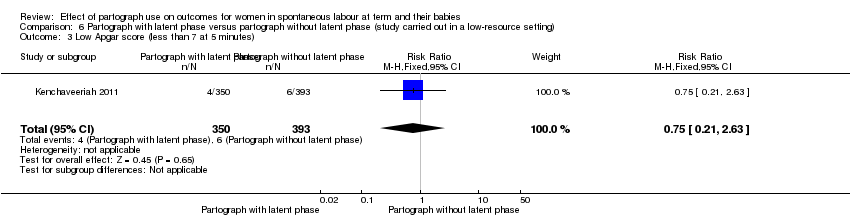
Comparison 6 Partograph with latent phase versus partograph without latent phase (study carried out in a low‐resource setting), Outcome 3 Low Apgar score (less than 7 at 5 minutes).
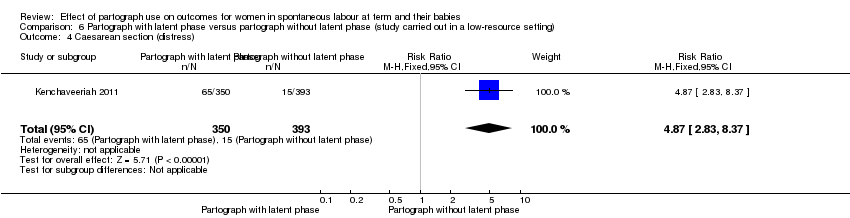
Comparison 6 Partograph with latent phase versus partograph without latent phase (study carried out in a low‐resource setting), Outcome 4 Caesarean section (distress).

Comparison 6 Partograph with latent phase versus partograph without latent phase (study carried out in a low‐resource setting), Outcome 5 Caesarean section (delay).
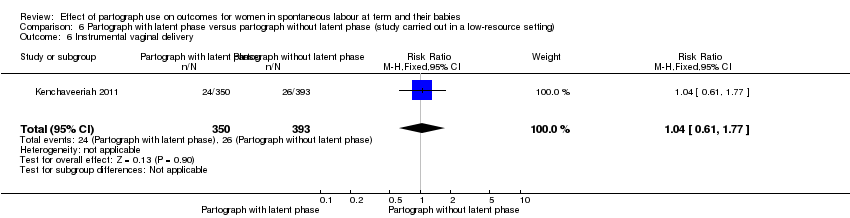
Comparison 6 Partograph with latent phase versus partograph without latent phase (study carried out in a low‐resource setting), Outcome 6 Instrumental vaginal delivery.
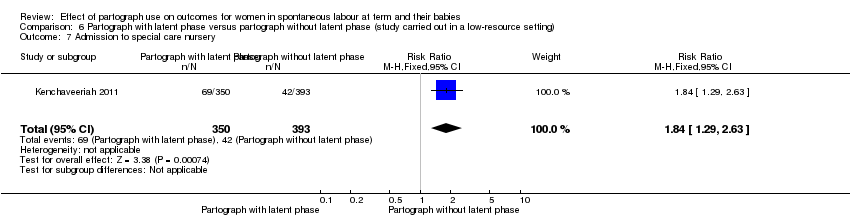
Comparison 6 Partograph with latent phase versus partograph without latent phase (study carried out in a low‐resource setting), Outcome 7 Admission to special care nursery.
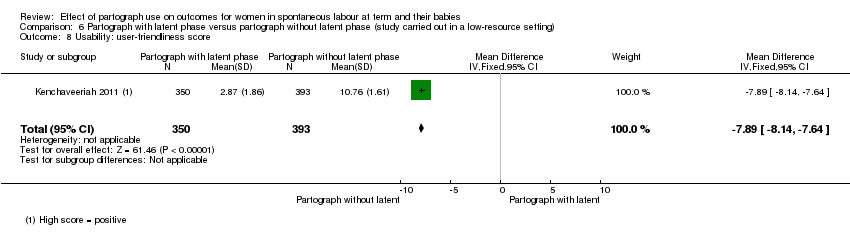
Comparison 6 Partograph with latent phase versus partograph without latent phase (study carried out in a low‐resource setting), Outcome 8 Usability: user‐friendliness score.

Comparison 7 Partograph with 2‐hour action line versus partograph with stepped dystocia line, Outcome 1 Caesarean section.
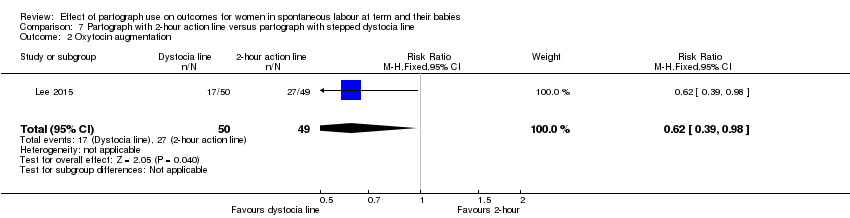
Comparison 7 Partograph with 2‐hour action line versus partograph with stepped dystocia line, Outcome 2 Oxytocin augmentation.

Comparison 7 Partograph with 2‐hour action line versus partograph with stepped dystocia line, Outcome 3 Duration of first stage of labour (labour longer than 12 hours).

Comparison 7 Partograph with 2‐hour action line versus partograph with stepped dystocia line, Outcome 4 Maternal experience of childbirth (BSS‐R score).

Comparison 7 Partograph with 2‐hour action line versus partograph with stepped dystocia line, Outcome 5 Low Apgar score (less than 4 at 4 min).

Comparison 7 Partograph with 2‐hour action line versus partograph with stepped dystocia line, Outcome 6 Instrumental vaginal birth.

Comparison 7 Partograph with 2‐hour action line versus partograph with stepped dystocia line, Outcome 7 Postpartum haemorrhage (> 500 mL).

Comparison 7 Partograph with 2‐hour action line versus partograph with stepped dystocia line, Outcome 8 Regional analgesia.
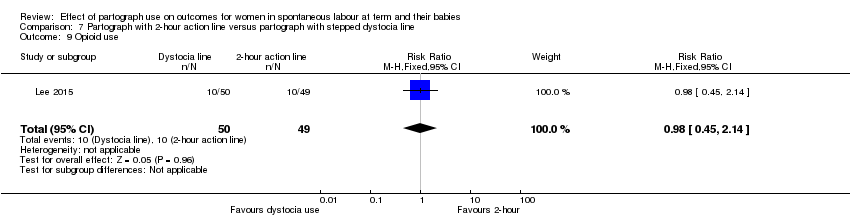
Comparison 7 Partograph with 2‐hour action line versus partograph with stepped dystocia line, Outcome 9 Opioid use.

Comparison 7 Partograph with 2‐hour action line versus partograph with stepped dystocia line, Outcome 10 Need for intubation at birth.
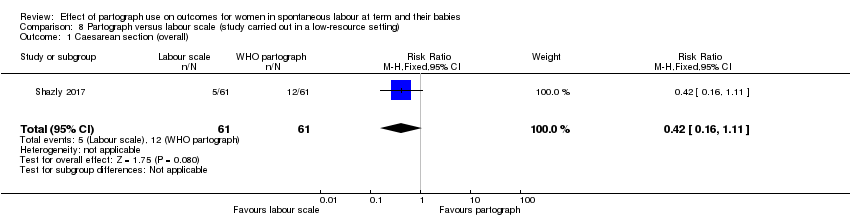
Comparison 8 Partograph versus labour scale (study carried out in a low‐resource setting), Outcome 1 Caesarean section (overall).
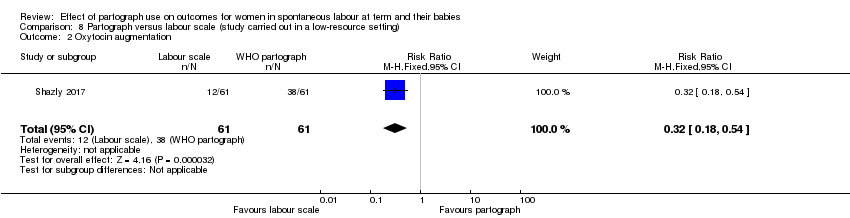
Comparison 8 Partograph versus labour scale (study carried out in a low‐resource setting), Outcome 2 Oxytocin augmentation.
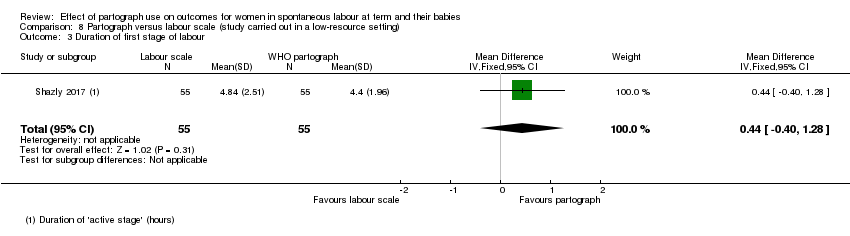
Comparison 8 Partograph versus labour scale (study carried out in a low‐resource setting), Outcome 3 Duration of first stage of labour.

Comparison 8 Partograph versus labour scale (study carried out in a low‐resource setting), Outcome 4 Low Apgar score (less than 7 at 5 minutes).
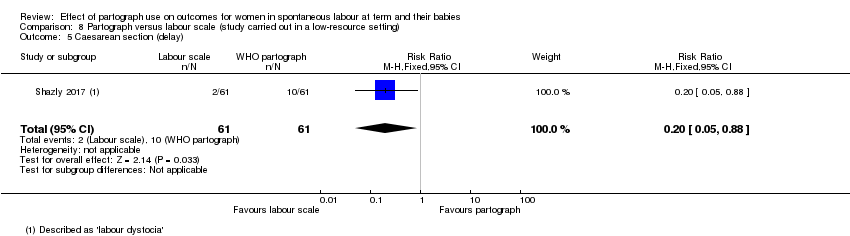
Comparison 8 Partograph versus labour scale (study carried out in a low‐resource setting), Outcome 5 Caesarean section (delay).
Comparison 8 Partograph versus labour scale (study carried out in a low‐resource setting), Outcome 6 Stillbirth, neonatal death or neonatal morbidity.
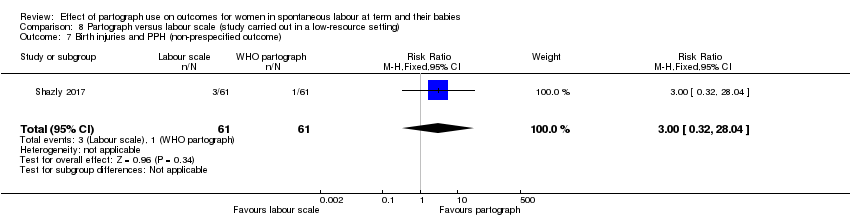
Comparison 8 Partograph versus labour scale (study carried out in a low‐resource setting), Outcome 7 Birth injuries and PPH (non‐prespecified outcome).
| Partograph compared to no partograph (studies carried out in high‐ and low‐resource settings) for women in spontaneous labour at term | ||||||
| Patient or population: women in spontaneous labour at term | ||||||
| Outcomes | Anticipated absolute effects* (95% CI) | Relative effect | № of participants | Quality of the evidence | Comments | |
| Risk with no partograph (studies carried out in high‐ and low‐resource settings) | Risk with partograph | |||||
| Caesarean section (overall) | Study population | Average RR 0.77 | 1813 | ⊕⊝⊝⊝ | ||
| 214 per 1000 | 164 per 1000 | |||||
| Oxytocin augmentation | Study population | RR 1.02 | 1156 | ⊕⊕⊕⊝ | ||
| 715 per 1000 | 730 per 1000 | |||||
| Duration of first stage of labour | The mean duration of first stage of labour was 16 hours (SD 7.6) | The mean duration of first stage of labour was 16.8 hours (SD 7.3) | In the partograph group, mean duration of first stage was 0.80 hours longer (0.06 hours shorter to 1.66 hours longer) | 1156 | ⊕⊕⊝⊝ | |
| Maternal experience of childbirth (as defined by trial authors) | Study population | ‐ | (0 study) | ‐ | No trials reported this outcome. | |
| See comment | See comment | |||||
| Apgar score less than 7 at 5 minutes | Study population | RR 0.76 | 1596 | ⊕⊝⊝⊝ | ||
| 11 per 1000 | 9 per 1000 | |||||
| Serious maternal morbidity or death (e.g. ruptured uterus, admission to intensive care unit, septicaemia, organ failure) | Study population | ‐ | (0 study) | ‐ | No trials reported this outcome. | |
| See comment | See comment | |||||
| Stillbirth or neonatal death or neonatal morbidity, excluding fatal malformations (e.g. seizures, birth asphyxia, neonatal encephalopathy) | Study population | ‐ | (0 study) | ‐ | No trials reported this outcome. | |
| See comment | See comment | |||||
| *The risk in the intervention group (and its 95% confidence interval) is based on the assumed risk in the comparison group and the relative effect of the intervention (and its 95% CI). | ||||||
| GRADE Working Group grades of evidence | ||||||
| aTwo out of three studies have design limitations, serious design limitations less than 40% of pooled effect (‐1). | ||||||
| Outcome or subgroup title | No. of studies | No. of participants | Statistical method | Effect size |
| 1 Caesarean section (overall) Show forest plot | 3 | 1813 | Risk Ratio (M‐H, Random, 95% CI) | 0.77 [0.40, 1.46] |
| 1.1 Low‐resource setting | 2 | 657 | Risk Ratio (M‐H, Random, 95% CI) | 0.65 [0.22, 1.91] |
| 1.2 High‐resource setting | 1 | 1156 | Risk Ratio (M‐H, Random, 95% CI) | 1.03 [0.82, 1.28] |
| 2 Oxytocin augmentation Show forest plot | 1 | 1156 | Risk Ratio (M‐H, Fixed, 95% CI) | 1.02 [0.95, 1.10] |
| 2.1 High‐resource setting | 1 | 1156 | Risk Ratio (M‐H, Fixed, 95% CI) | 1.02 [0.95, 1.10] |
| 3 Duration of first stage of labour Show forest plot | 1 | 1156 | Mean Difference (IV, Fixed, 95% CI) | 0.80 [‐0.06, 1.66] |
| 3.1 High‐resource setting | 1 | 1156 | Mean Difference (IV, Fixed, 95% CI) | 0.80 [‐0.06, 1.66] |
| 4 Low Apgar score (less than 7 at 5 minutes) Show forest plot | 2 | 1596 | Risk Ratio (M‐H, Fixed, 95% CI) | 0.76 [0.29, 2.03] |
| 4.1 Low‐resource setting | 1 | 440 | Risk Ratio (M‐H, Fixed, 95% CI) | 0.46 [0.04, 5.00] |
| 4.2 High‐resource setting | 1 | 1156 | Risk Ratio (M‐H, Fixed, 95% CI) | 0.85 [0.29, 2.52] |
| 5 Instrumental vaginal birth Show forest plot | 3 | 1813 | Risk Ratio (M‐H, Fixed, 95% CI) | 0.99 [0.84, 1.15] |
| 5.1 Low‐resource setting | 2 | 657 | Risk Ratio (M‐H, Fixed, 95% CI) | 1.05 [0.75, 1.48] |
| 5.2 High‐resource setting | 1 | 1156 | Risk Ratio (M‐H, Fixed, 95% CI) | 0.97 [0.81, 1.15] |
| 6 Regional analgesia ‐ epidural Show forest plot | 1 | 1156 | Risk Ratio (M‐H, Fixed, 95% CI) | 1.01 [0.98, 1.05] |
| 6.1 High‐resource setting | 1 | 1156 | Risk Ratio (M‐H, Fixed, 95% CI) | 1.01 [0.98, 1.05] |
| 7 Performance of artificial rupture of membranes during labour Show forest plot | 1 | 1156 | Risk Ratio (M‐H, Fixed, 95% CI) | 0.99 [0.88, 1.11] |
| 7.1 High‐resource setting | 1 | 1156 | Risk Ratio (M‐H, Fixed, 95% CI) | 0.99 [0.88, 1.11] |
| 8 Antibiotic use Show forest plot | 1 | 1156 | Risk Ratio (M‐H, Fixed, 95% CI) | 1.23 [0.88, 1.73] |
| 8.1 High‐resource setting | 1 | 1156 | Risk Ratio (M‐H, Fixed, 95% CI) | 1.23 [0.88, 1.73] |
| 9 Duration of second stage of labour (hours) Show forest plot | 1 | 1156 | Mean Difference (IV, Fixed, 95% CI) | 0.0 [‐0.21, 0.21] |
| 9.1 High‐resource setting | 1 | 1156 | Mean Difference (IV, Fixed, 95% CI) | 0.0 [‐0.21, 0.21] |
| 10 Number of vaginal examinations Show forest plot | 1 | 1156 | Mean Difference (IV, Fixed, 95% CI) | 0.0 [0.0, 0.0] |
| 10.1 High‐resource setting | 1 | 1156 | Mean Difference (IV, Fixed, 95% CI) | 0.0 [0.0, 0.0] |
| 11 Admission to special care nursery Show forest plot | 1 | 1156 | Risk Ratio (M‐H, Fixed, 95% CI) | 0.94 [0.51, 1.75] |
| 11.1 High‐resource setting | 1 | 1156 | Risk Ratio (M‐H, Fixed, 95% CI) | 0.94 [0.51, 1.75] |
| Outcome or subgroup title | No. of studies | No. of participants | Statistical method | Effect size |
| 1 Caesarean section (overall) Show forest plot | 4 | 4749 | Risk Ratio (M‐H, Fixed, 95% CI) | 1.06 [0.88, 1.28] |
| 1.1 Low‐resource setting | 2 | 1148 | Risk Ratio (M‐H, Fixed, 95% CI) | 1.09 [0.71, 1.68] |
| 1.2 High‐resource setting | 2 | 3601 | Risk Ratio (M‐H, Fixed, 95% CI) | 1.06 [0.86, 1.30] |
| 2 Oxytocin augmentation Show forest plot | 4 | 4749 | Risk Ratio (M‐H, Random, 95% CI) | 2.44 [1.36, 4.35] |
| 2.1 Low‐resource setting | 2 | 1148 | Risk Ratio (M‐H, Random, 95% CI) | 7.22 [2.49, 20.91] |
| 2.2 High‐resource setting | 2 | 3601 | Risk Ratio (M‐H, Random, 95% CI) | 1.14 [1.05, 1.22] |
| 3 Duration of first stage of labour (length of labour greater than 18 hours, length of labour greater than 12 hours) Show forest plot | 1 | 948 | Risk Ratio (M‐H, Fixed, 95% CI) | 0.81 [0.32, 2.04] |
| 4 Maternal experience of childbirth ‐ negative childbirth experience Show forest plot | 2 | 2269 | Risk Ratio (M‐H, Random, 95% CI) | 0.61 [0.28, 1.35] |
| 5 Low Apgar score (less than 7 at 5 minutes) Show forest plot | 4 | 4749 | Risk Ratio (M‐H, Fixed, 95% CI) | 0.93 [0.61, 1.42] |
| 5.1 Low‐resource setting | 2 | 1148 | Risk Ratio (M‐H, Fixed, 95% CI) | 1.31 [0.58, 2.96] |
| 5.2 High‐resource setting | 2 | 3601 | Risk Ratio (M‐H, Fixed, 95% CI) | 0.82 [0.50, 1.35] |
| 6 Serious maternal morbidity or death Show forest plot | 2 | 3601 | Risk Ratio (M‐H, Fixed, 95% CI) | 0.0 [0.0, 0.0] |
| 7 Caesarean section (distress) Show forest plot | 2 | 3601 | Risk Ratio (M‐H, Fixed, 95% CI) | 1.30 [0.86, 1.96] |
| 8 Caesarean section (delay) Show forest plot | 2 | 3601 | Risk Ratio (M‐H, Fixed, 95% CI) | 0.98 [0.77, 1.25] |
| 9 Instrumental vaginal delivery Show forest plot | 3 | 3801 | Risk Ratio (M‐H, Fixed, 95% CI) | 0.92 [0.81, 1.04] |
| 10 Postpartum haemorrhage ‐ blood loss > 500 mL Show forest plot | 3 | 4549 | Risk Ratio (M‐H, Fixed, 95% CI) | 1.06 [0.90, 1.25] |
| 10.1 Low‐resource setting | 1 | 948 | Risk Ratio (M‐H, Fixed, 95% CI) | 0.85 [0.26, 2.76] |
| 10.2 High‐resource setting | 2 | 3601 | Risk Ratio (M‐H, Fixed, 95% CI) | 1.07 [0.90, 1.26] |
| 11 Regional analgesia ‐ epidural Show forest plot | 2 | 3601 | Risk Ratio (M‐H, Random, 95% CI) | 1.06 [0.92, 1.21] |
| 12 Performance of artificial rupture of the membranes during labour Show forest plot | 3 | 3801 | Risk Ratio (M‐H, Random, 95% CI) | 1.00 [0.84, 1.18] |
| 13 Number of vaginal examinations in labour Show forest plot | 2 | 3601 | Mean Difference (IV, Random, 95% CI) | ‐0.08 [‐0.37, 0.21] |
| 14 Serious neonatal morbidity or perinatal death Show forest plot | 2 | 3601 | Risk Ratio (M‐H, Fixed, 95% CI) | 0.0 [0.0, 0.0] |
| 15 Admission to special care nursery Show forest plot | 3 | 3801 | Risk Ratio (M‐H, Fixed, 95% CI) | 0.83 [0.51, 1.34] |
| 15.1 Low‐resource setting | 1 | 200 | Risk Ratio (M‐H, Fixed, 95% CI) | 1.33 [0.31, 5.81] |
| 15.2 High‐resource setting | 2 | 3601 | Risk Ratio (M‐H, Fixed, 95% CI) | 0.78 [0.46, 1.31] |
| 16 Cord blood arterial pH less than 7.1 Show forest plot | 2 | 3601 | Risk Ratio (M‐H, Fixed, 95% CI) | 0.73 [0.44, 1.22] |
| Outcome or subgroup title | No. of studies | No. of participants | Statistical method | Effect size |
| 1 Caesarean section (overall) Show forest plot | 1 | 617 | Risk Ratio (M‐H, Fixed, 95% CI) | 0.78 [0.51, 1.18] |
| 2 Oxytocin augmentation Show forest plot | 1 | 617 | Risk Ratio (M‐H, Fixed, 95% CI) | 1.02 [0.85, 1.21] |
| 3 Maternal experience of childbirth ‐ negative childbirth experience Show forest plot | 1 | 348 | Risk Ratio (M‐H, Fixed, 95% CI) | 0.49 [0.27, 0.90] |
| 4 Low Apgar score (less than 7 at 5 minutes) Show forest plot | 1 | 617 | Risk Ratio (M‐H, Fixed, 95% CI) | 1.44 [0.41, 5.05] |
| 5 Serious maternal morbidity or death Show forest plot | 1 | 617 | Risk Ratio (M‐H, Fixed, 95% CI) | 0.0 [0.0, 0.0] |
| 6 Caesarean section (distress) Show forest plot | 1 | 617 | Risk Ratio (M‐H, Fixed, 95% CI) | 0.96 [0.44, 2.10] |
| 7 Caesarean section (delay) Show forest plot | 1 | 617 | Risk Ratio (M‐H, Fixed, 95% CI) | 0.71 [0.42, 1.19] |
| 8 Instrumental vaginal delivery Show forest plot | 1 | 617 | Risk Ratio (M‐H, Fixed, 95% CI) | 0.93 [0.69, 1.26] |
| 9 Postpartum haemorrhage ‐ blood loss > 500 mL Show forest plot | 1 | 617 | Risk Ratio (M‐H, Fixed, 95% CI) | 0.96 [0.63, 1.45] |
| 10 Regional analgesia ‐ epidural Show forest plot | 1 | 617 | Risk Ratio (M‐H, Fixed, 95% CI) | 1.16 [0.94, 1.44] |
| 11 Performance of artificial rupture of membranes during labour Show forest plot | 1 | 617 | Risk Ratio (M‐H, Fixed, 95% CI) | 0.94 [0.77, 1.15] |
| 12 Vaginal examinations Show forest plot | 1 | 617 | Mean Difference (IV, Fixed, 95% CI) | 0.0 [‐0.29, 0.29] |
| 13 Serious neonatal morbidity or perinatal death Show forest plot | 1 | 617 | Risk Ratio (M‐H, Fixed, 95% CI) | 0.0 [0.0, 0.0] |
| 14 Admission to special care nursery Show forest plot | 1 | 617 | Risk Ratio (M‐H, Fixed, 95% CI) | 3.83 [0.43, 34.12] |
| 15 Cord blood arterial pH less than 7.1 Show forest plot | 1 | 617 | Risk Ratio (M‐H, Fixed, 95% CI) | 0.38 [0.07, 1.96] |
| Outcome or subgroup title | No. of studies | No. of participants | Statistical method | Effect size |
| 1 Caesarean section (overall) Show forest plot | 1 | 613 | Risk Ratio (M‐H, Fixed, 95% CI) | 1.70 [1.07, 2.70] |
| 2 Oxytocin augmentation Show forest plot | 1 | 613 | Risk Ratio (M‐H, Fixed, 95% CI) | 1.09 [0.91, 1.30] |
| 3 Maternal experience of childbirth ‐ negative childbirth experience Show forest plot | 1 | 340 | Risk Ratio (M‐H, Fixed, 95% CI) | 0.80 [0.51, 1.27] |
| 4 Low Apgar score (less than 7 at 5 minutes) Show forest plot | 1 | 613 | Risk Ratio (M‐H, Fixed, 95% CI) | 0.82 [0.22, 3.04] |
| 5 Serious maternal morbidity or death Show forest plot | 1 | 613 | Risk Ratio (M‐H, Fixed, 95% CI) | 0.0 [0.0, 0.0] |
| 6 Caesarean section (distress) Show forest plot | 1 | 613 | Risk Ratio (M‐H, Fixed, 95% CI) | 1.77 [0.70, 4.42] |
| 7 Caesarean section (delay) Show forest plot | 1 | 613 | Risk Ratio (M‐H, Fixed, 95% CI) | 1.68 [0.97, 2.91] |
| 8 Instrumental vaginal delivery Show forest plot | 1 | 613 | Risk Ratio (M‐H, Fixed, 95% CI) | 0.96 [0.72, 1.28] |
| 9 Postpartum haemorrhage ‐ blood loss > 500 mL Show forest plot | 1 | 613 | Risk Ratio (M‐H, Fixed, 95% CI) | 1.03 [0.68, 1.56] |
| 10 Regional analgesia ‐ epidural Show forest plot | 1 | 613 | Risk Ratio (M‐H, Fixed, 95% CI) | 1.01 [0.80, 1.27] |
| 11 Performance of artificial rupture of membranes during labour Show forest plot | 1 | 613 | Risk Ratio (M‐H, Fixed, 95% CI) | 1.04 [0.85, 1.26] |
| 12 Number of vaginal examinations in labour Show forest plot | 1 | 613 | Mean Difference (IV, Fixed, 95% CI) | 0.10 [‐0.19, 0.39] |
| 13 Serious neonatal morbidity or perinatal death Show forest plot | 1 | 613 | Risk Ratio (M‐H, Fixed, 95% CI) | 0.0 [0.0, 0.0] |
| 14 Admission to special care nursery Show forest plot | 1 | 613 | Risk Ratio (M‐H, Fixed, 95% CI) | 0.51 [0.05, 5.65] |
| 15 Cord blood arterial pH less than 7.1 Show forest plot | 1 | 613 | Risk Ratio (M‐H, Fixed, 95% CI) | 2.57 [0.50, 13.17] |
| Outcome or subgroup title | No. of studies | No. of participants | Statistical method | Effect size |
| 1 Caesarean section (overall) Show forest plot | 1 | 694 | Risk Ratio (M‐H, Fixed, 95% CI) | 0.68 [0.50, 0.93] |
| 2 Oxytocin augmentation Show forest plot | 1 | 694 | Risk Ratio (M‐H, Fixed, 95% CI) | 0.81 [0.62, 1.05] |
| 3 Low Apgar score (less than 7 at 5 minutes) Show forest plot | 1 | 694 | Risk Ratio (M‐H, Fixed, 95% CI) | 7.12 [0.37, 137.36] |
| 4 Instrumental vaginal delivery Show forest plot | 1 | 694 | Risk Ratio (M‐H, Fixed, 95% CI) | 0.87 [0.66, 1.15] |
| 5 Serious neonatal morbidity or perinatal death Show forest plot | 1 | 694 | Risk Ratio (M‐H, Fixed, 95% CI) | 7.12 [0.37, 137.36] |
| Outcome or subgroup title | No. of studies | No. of participants | Statistical method | Effect size |
| 1 Caesarean section (overall) Show forest plot | 1 | 743 | Risk Ratio (M‐H, Fixed, 95% CI) | 2.45 [1.72, 3.50] |
| 2 Oxytocin augmentation Show forest plot | 1 | 743 | Risk Ratio (M‐H, Fixed, 95% CI) | 2.18 [1.67, 2.83] |
| 3 Low Apgar score (less than 7 at 5 minutes) Show forest plot | 1 | 743 | Risk Ratio (M‐H, Fixed, 95% CI) | 0.75 [0.21, 2.63] |
| 4 Caesarean section (distress) Show forest plot | 1 | 743 | Risk Ratio (M‐H, Fixed, 95% CI) | 4.87 [2.83, 8.37] |
| 5 Caesarean section (delay) Show forest plot | 1 | 743 | Risk Ratio (M‐H, Fixed, 95% CI) | 1.35 [0.59, 3.08] |
| 6 Instrumental vaginal delivery Show forest plot | 1 | 743 | Risk Ratio (M‐H, Fixed, 95% CI) | 1.04 [0.61, 1.77] |
| 7 Admission to special care nursery Show forest plot | 1 | 743 | Risk Ratio (M‐H, Fixed, 95% CI) | 1.84 [1.29, 2.63] |
| 8 Usability: user‐friendliness score Show forest plot | 1 | 743 | Mean Difference (IV, Fixed, 95% CI) | ‐7.89 [‐8.14, ‐7.64] |
| Outcome or subgroup title | No. of studies | No. of participants | Statistical method | Effect size |
| 1 Caesarean section Show forest plot | 1 | 99 | Risk Ratio (M‐H, Fixed, 95% CI) | 1.10 [0.46, 2.62] |
| 2 Oxytocin augmentation Show forest plot | 1 | 99 | Risk Ratio (M‐H, Fixed, 95% CI) | 0.62 [0.39, 0.98] |
| 3 Duration of first stage of labour (labour longer than 12 hours) Show forest plot | 1 | 99 | Risk Ratio (M‐H, Fixed, 95% CI) | 0.76 [0.31, 1.89] |
| 4 Maternal experience of childbirth (BSS‐R score) Show forest plot | 1 | 90 | Mean Difference (IV, Fixed, 95% CI) | 0.0 [‐3.58, 3.58] |
| 5 Low Apgar score (less than 4 at 4 min) Show forest plot | 1 | 99 | Risk Ratio (M‐H, Fixed, 95% CI) | 0.98 [0.06, 15.23] |
| 6 Instrumental vaginal birth Show forest plot | 1 | 99 | Risk Ratio (M‐H, Fixed, 95% CI) | 0.75 [0.37, 1.56] |
| 7 Postpartum haemorrhage (> 500 mL) Show forest plot | 1 | 99 | Risk Ratio (M‐H, Fixed, 95% CI) | 1.57 [0.55, 4.46] |
| 8 Regional analgesia Show forest plot | 1 | 99 | Risk Ratio (M‐H, Fixed, 95% CI) | 0.86 [0.56, 1.32] |
| 9 Opioid use Show forest plot | 1 | 99 | Risk Ratio (M‐H, Fixed, 95% CI) | 0.98 [0.45, 2.14] |
| 10 Need for intubation at birth Show forest plot | 1 | 99 | Risk Ratio (M‐H, Fixed, 95% CI) | 0.44 [0.14, 1.32] |
| Outcome or subgroup title | No. of studies | No. of participants | Statistical method | Effect size |
| 1 Caesarean section (overall) Show forest plot | 1 | 122 | Risk Ratio (M‐H, Fixed, 95% CI) | 0.42 [0.16, 1.11] |
| 2 Oxytocin augmentation Show forest plot | 1 | 122 | Risk Ratio (M‐H, Fixed, 95% CI) | 0.32 [0.18, 0.54] |
| 3 Duration of first stage of labour Show forest plot | 1 | 110 | Mean Difference (IV, Fixed, 95% CI) | 0.44 [‐0.40, 1.28] |
| 4 Low Apgar score (less than 7 at 5 minutes) Show forest plot | 1 | 110 | Risk Ratio (M‐H, Fixed, 95% CI) | 0.0 [0.0, 0.0] |
| 5 Caesarean section (delay) Show forest plot | 1 | 122 | Risk Ratio (M‐H, Fixed, 95% CI) | 0.2 [0.05, 0.88] |
| 6 Stillbirth, neonatal death or neonatal morbidity Show forest plot | 1 | 110 | Risk Ratio (M‐H, Fixed, 95% CI) | 0.0 [0.0, 0.0] |
| 7 Birth injuries and PPH (non‐prespecified outcome) Show forest plot | 1 | 122 | Risk Ratio (M‐H, Fixed, 95% CI) | 3.0 [0.32, 28.04] |