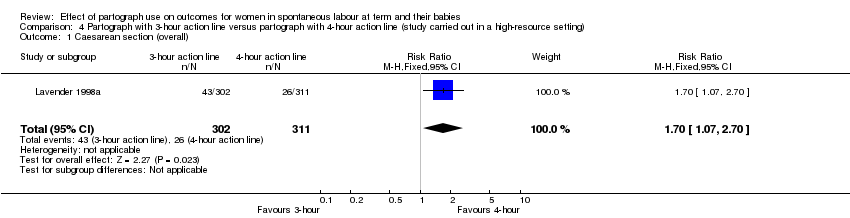
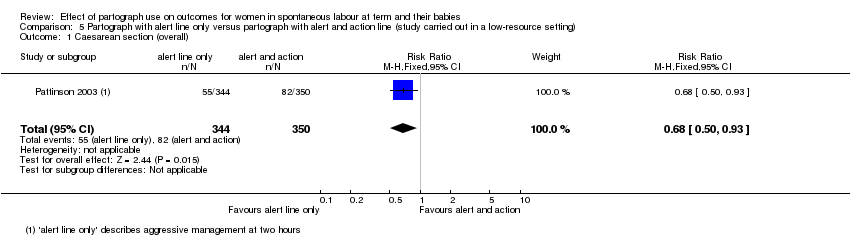
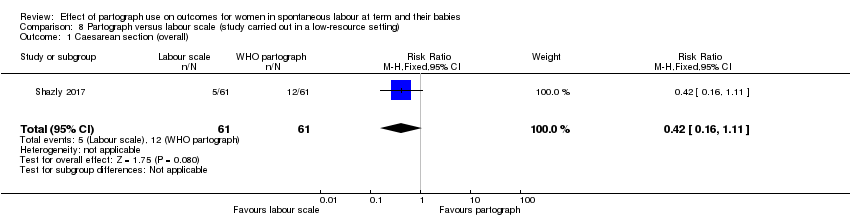
| 1 Caesarean section (overall) Show forest plot | 4 | 4749 | Risk Ratio (M‐H, Fixed, 95% CI) | 1.06 [0.88, 1.28] |
|
| 1.1 Low‐resource setting | 2 | 1148 | Risk Ratio (M‐H, Fixed, 95% CI) | 1.09 [0.71, 1.68] |
| 1.2 High‐resource setting | 2 | 3601 | Risk Ratio (M‐H, Fixed, 95% CI) | 1.06 [0.86, 1.30] |
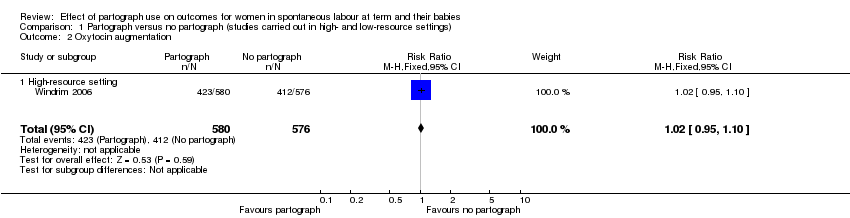
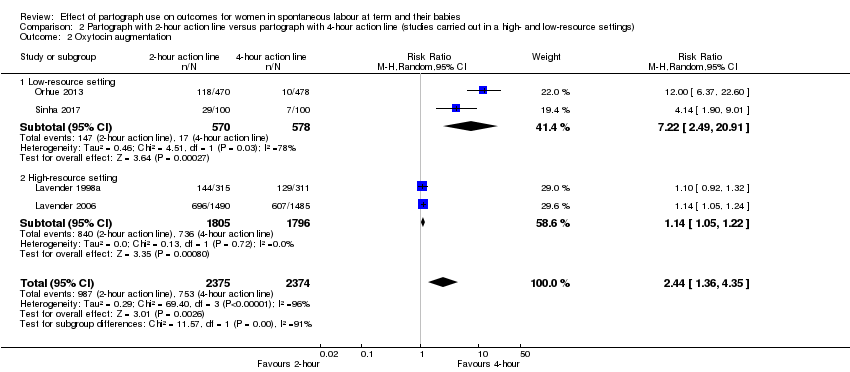
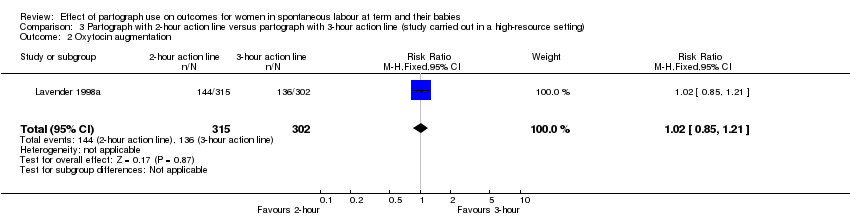
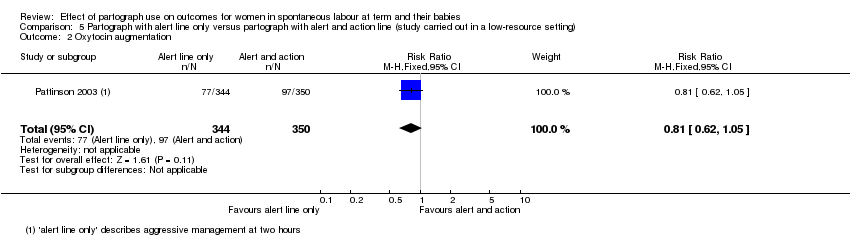
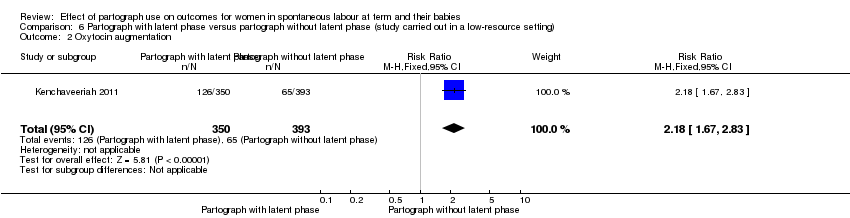
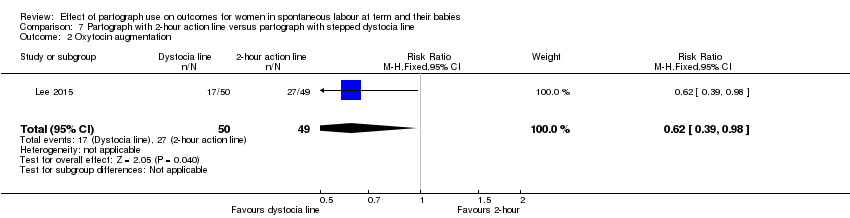
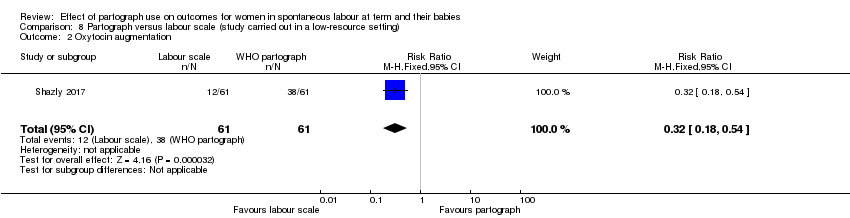
| 2 Oxytocin augmentation Show forest plot | 4 | 4749 | Risk Ratio (M‐H, Random, 95% CI) | 2.44 [1.36, 4.35] |
|
| 2.1 Low‐resource setting | 2 | 1148 | Risk Ratio (M‐H, Random, 95% CI) | 7.22 [2.49, 20.91] |
| 2.2 High‐resource setting | 2 | 3601 | Risk Ratio (M‐H, Random, 95% CI) | 1.14 [1.05, 1.22] |
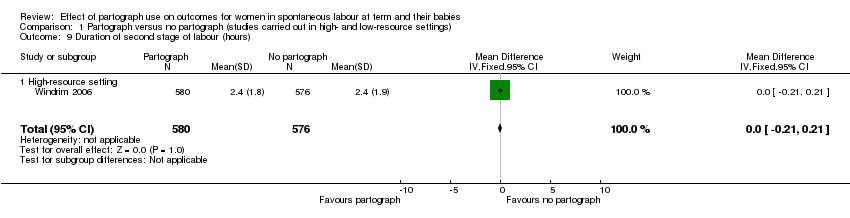
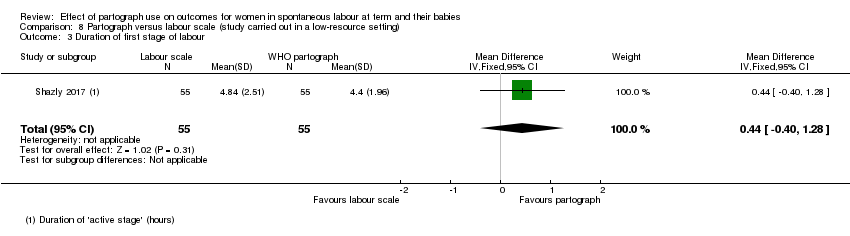
| 3 Duration of first stage of labour (length of labour greater than 18 hours, length of labour greater than 12 hours) Show forest plot | 1 | 948 | Risk Ratio (M‐H, Fixed, 95% CI) | 0.81 [0.32, 2.04] |
|
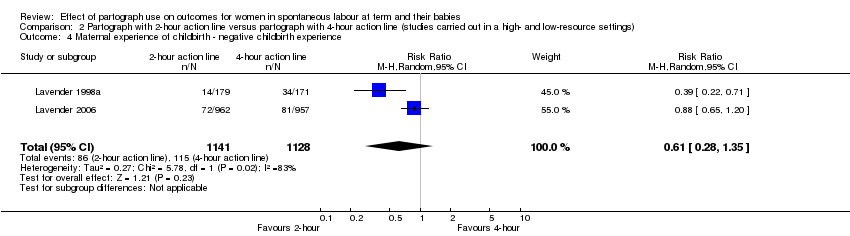
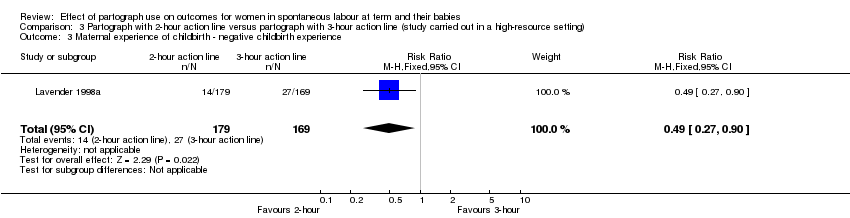
| 4 Maternal experience of childbirth ‐ negative childbirth experience Show forest plot | 2 | 2269 | Risk Ratio (M‐H, Random, 95% CI) | 0.61 [0.28, 1.35] |
|
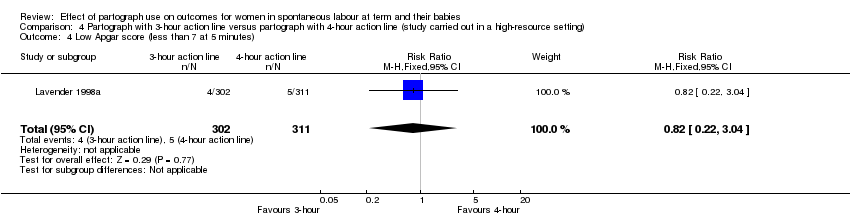
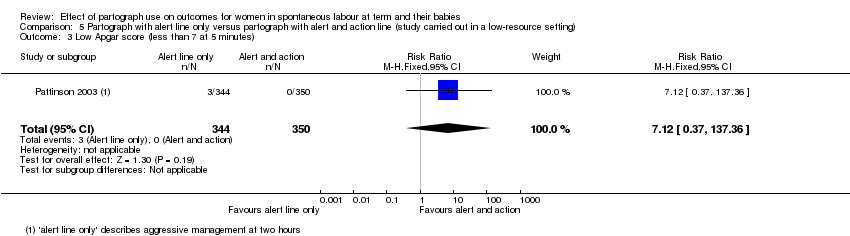
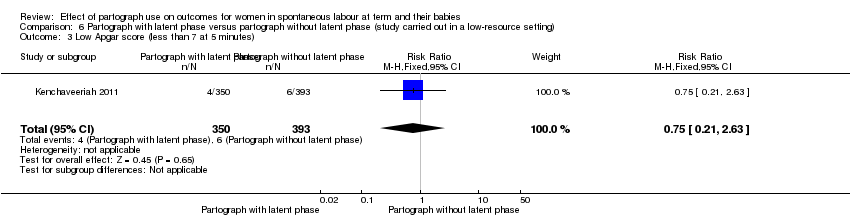
| 5 Low Apgar score (less than 7 at 5 minutes) Show forest plot | 4 | 4749 | Risk Ratio (M‐H, Fixed, 95% CI) | 0.93 [0.61, 1.42] |
|
| 5.1 Low‐resource setting | 2 | 1148 | Risk Ratio (M‐H, Fixed, 95% CI) | 1.31 [0.58, 2.96] |
| 5.2 High‐resource setting | 2 | 3601 | Risk Ratio (M‐H, Fixed, 95% CI) | 0.82 [0.50, 1.35] |
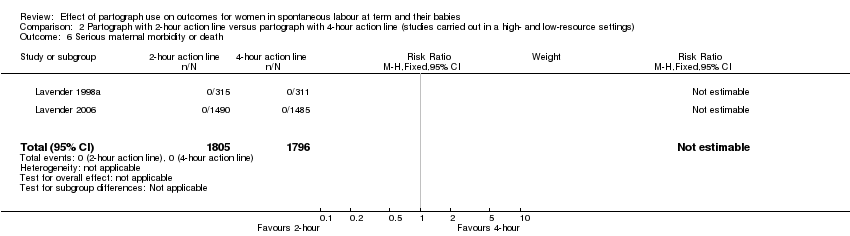
| 6 Serious maternal morbidity or death Show forest plot | 2 | 3601 | Risk Ratio (M‐H, Fixed, 95% CI) | 0.0 [0.0, 0.0] |
|
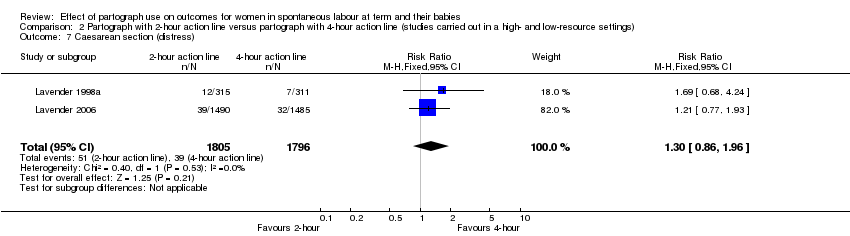
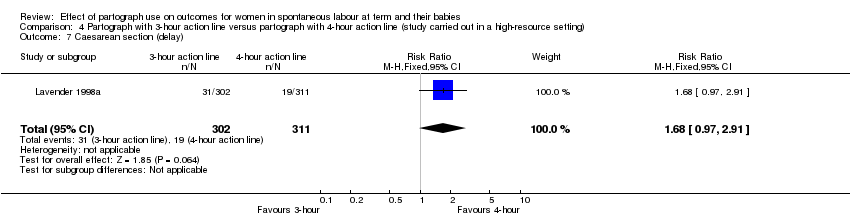
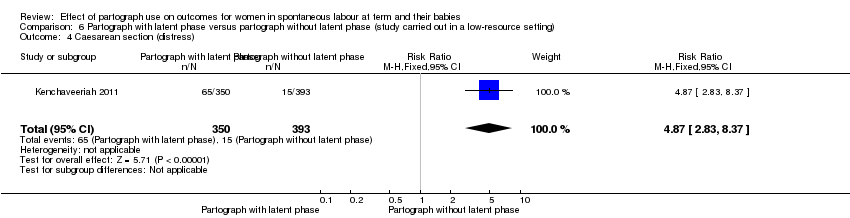
| 7 Caesarean section (distress) Show forest plot | 2 | 3601 | Risk Ratio (M‐H, Fixed, 95% CI) | 1.30 [0.86, 1.96] |
|
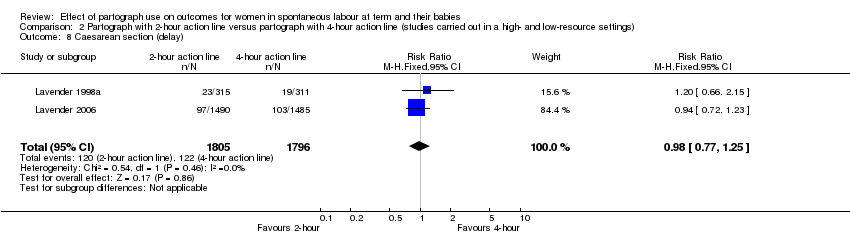
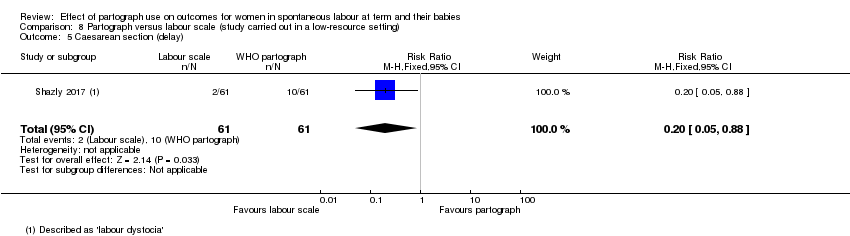
| 8 Caesarean section (delay) Show forest plot | 2 | 3601 | Risk Ratio (M‐H, Fixed, 95% CI) | 0.98 [0.77, 1.25] |
|
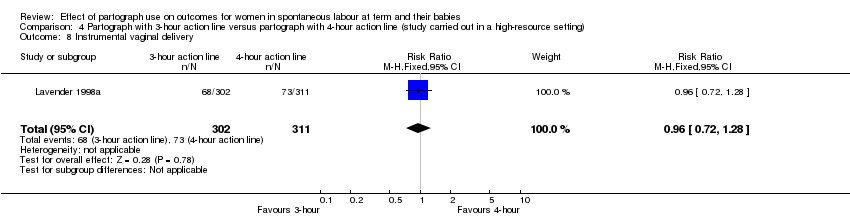
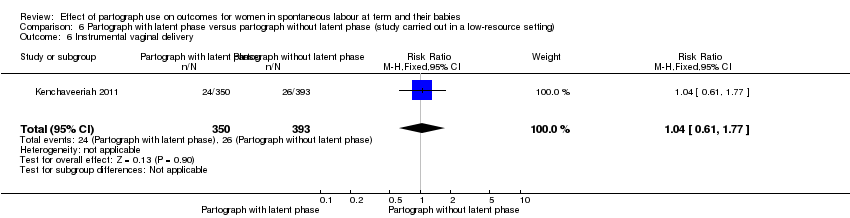
| 9 Instrumental vaginal delivery Show forest plot | 3 | 3801 | Risk Ratio (M‐H, Fixed, 95% CI) | 0.92 [0.81, 1.04] |
|
| 10 Postpartum haemorrhage ‐ blood loss > 500 mL Show forest plot | 3 | 4549 | Risk Ratio (M‐H, Fixed, 95% CI) | 1.06 [0.90, 1.25] |
|
| 10.1 Low‐resource setting | 1 | 948 | Risk Ratio (M‐H, Fixed, 95% CI) | 0.85 [0.26, 2.76] |
| 10.2 High‐resource setting | 2 | 3601 | Risk Ratio (M‐H, Fixed, 95% CI) | 1.07 [0.90, 1.26] |
| 11 Regional analgesia ‐ epidural Show forest plot | 2 | 3601 | Risk Ratio (M‐H, Random, 95% CI) | 1.06 [0.92, 1.21] |
|
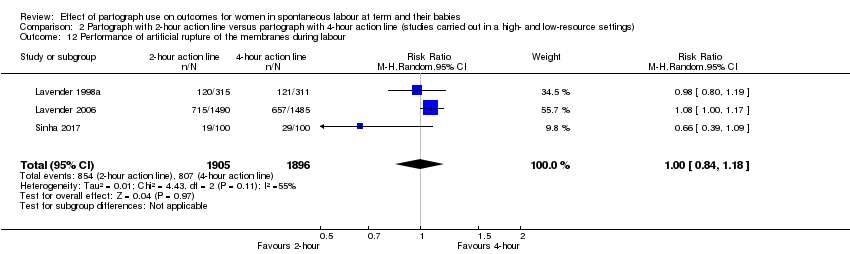
| 12 Performance of artificial rupture of the membranes during labour Show forest plot | 3 | 3801 | Risk Ratio (M‐H, Random, 95% CI) | 1.00 [0.84, 1.18] |
|
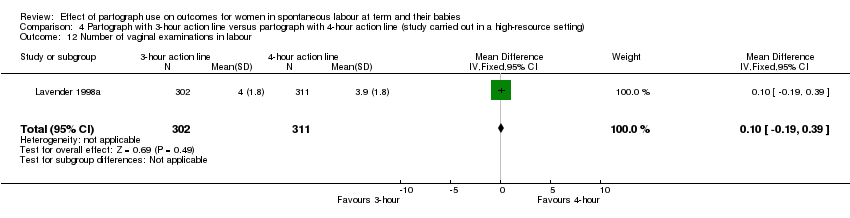
| 13 Number of vaginal examinations in labour Show forest plot | 2 | 3601 | Mean Difference (IV, Random, 95% CI) | ‐0.08 [‐0.37, 0.21] |
|
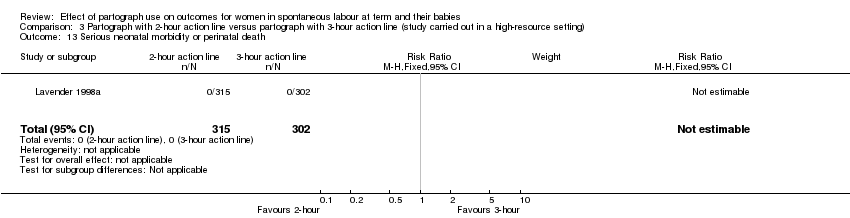
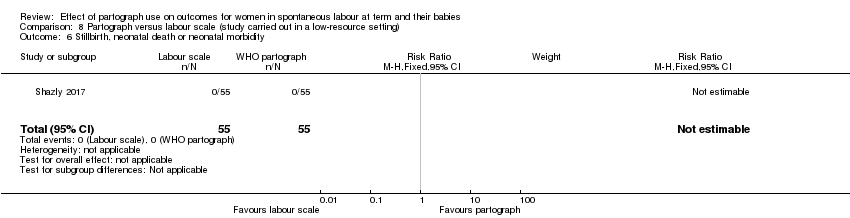
| 14 Serious neonatal morbidity or perinatal death Show forest plot | 2 | 3601 | Risk Ratio (M‐H, Fixed, 95% CI) | 0.0 [0.0, 0.0] |
|
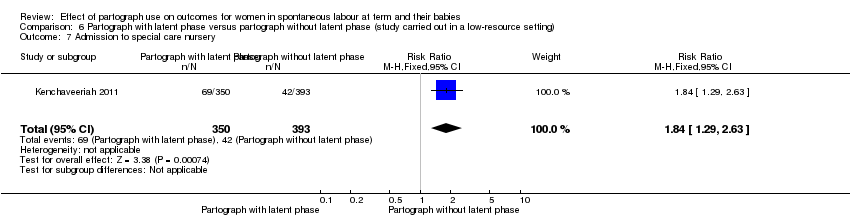
| 15 Admission to special care nursery Show forest plot | 3 | 3801 | Risk Ratio (M‐H, Fixed, 95% CI) | 0.83 [0.51, 1.34] |
|
| 15.1 Low‐resource setting | 1 | 200 | Risk Ratio (M‐H, Fixed, 95% CI) | 1.33 [0.31, 5.81] |
| 15.2 High‐resource setting | 2 | 3601 | Risk Ratio (M‐H, Fixed, 95% CI) | 0.78 [0.46, 1.31] |
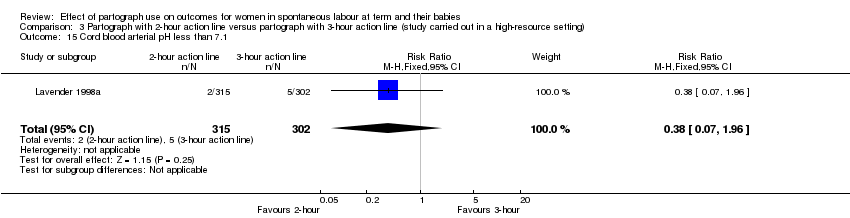
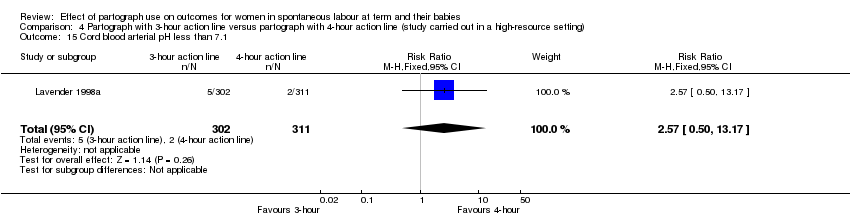
| 16 Cord blood arterial pH less than 7.1 Show forest plot | 2 | 3601 | Risk Ratio (M‐H, Fixed, 95% CI) | 0.73 [0.44, 1.22] |
|