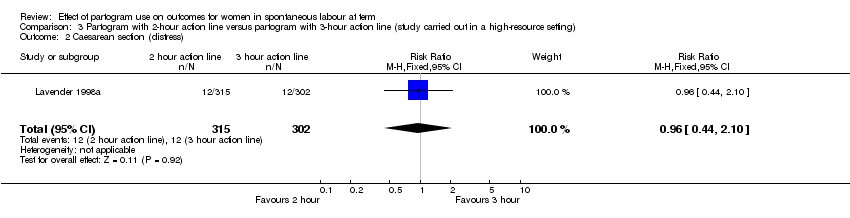
| 1 Casearean section (overall) Show forest plot | 2 | 1590 | Risk Ratio (M‐H, Random, 95% CI) | 0.64 [0.24, 1.70] |
|
| 1.1 Low‐resource setting | 1 | 434 | Risk Ratio (M‐H, Random, 95% CI) | 0.38 [0.24, 0.61] |
| 1.2 High‐resource setting | 1 | 1156 | Risk Ratio (M‐H, Random, 95% CI) | 1.03 [0.82, 1.28] |
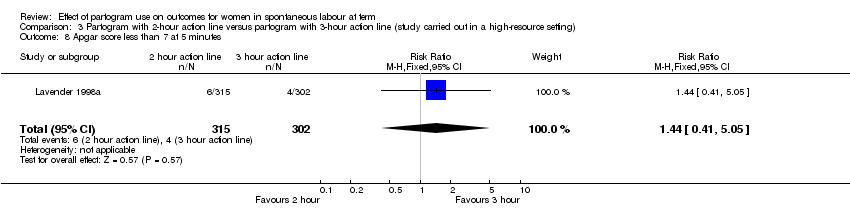
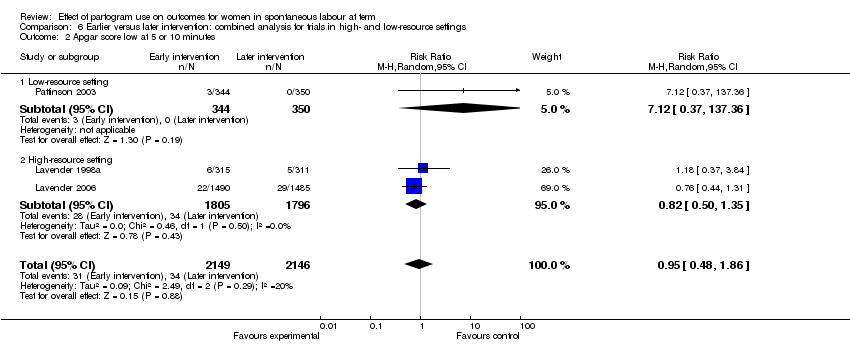
| 2 Apgar score less than 7 at 5 minutes Show forest plot | 2 | 1596 | Risk Ratio (M‐H, Random, 95% CI) | 0.77 [0.29, 2.06] |
|
| 2.1 Low‐resource setting | 1 | 440 | Risk Ratio (M‐H, Random, 95% CI) | 0.46 [0.04, 5.00] |
| 2.2 High‐resource setting | 1 | 1156 | Risk Ratio (M‐H, Random, 95% CI) | 0.85 [0.29, 2.52] |
| 3 Epidural analgesia Show forest plot | 1 | 1156 | Risk Ratio (M‐H, Fixed, 95% CI) | 1.01 [0.98, 1.05] |
|
| 3.1 High‐resource setting | 1 | 1156 | Risk Ratio (M‐H, Fixed, 95% CI) | 1.01 [0.98, 1.05] |
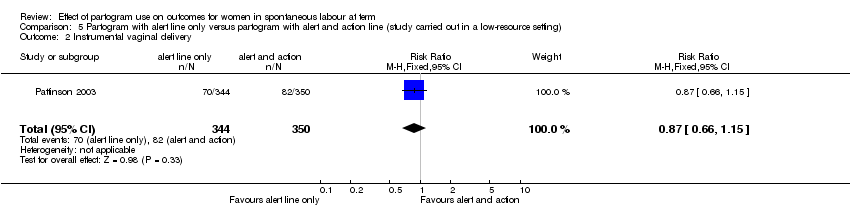
| 4 Instrumental vaginal delivery Show forest plot | 2 | 1590 | Risk Ratio (M‐H, Fixed, 95% CI) | 1.00 [0.85, 1.17] |
|
| 4.1 Low‐resource setting | 1 | 434 | Risk Ratio (M‐H, Fixed, 95% CI) | 1.17 [0.79, 1.74] |
| 4.2 High‐resource setting | 1 | 1156 | Risk Ratio (M‐H, Fixed, 95% CI) | 0.97 [0.81, 1.15] |
| 5 Duration of first stage of labour Show forest plot | 1 | 1156 | Mean Difference (IV, Fixed, 95% CI) | 0.0 [‐0.21, 0.21] |
|
| 5.1 High‐resource setting | 1 | 1156 | Mean Difference (IV, Fixed, 95% CI) | 0.0 [‐0.21, 0.21] |
| 6 Duration of second stage of labour Show forest plot | 1 | 1156 | Mean Difference (IV, Fixed, 95% CI) | 0.0 [‐0.21, 0.21] |
|
| 6.1 High‐resource setting | 1 | 1156 | Mean Difference (IV, Fixed, 95% CI) | 0.0 [‐0.21, 0.21] |
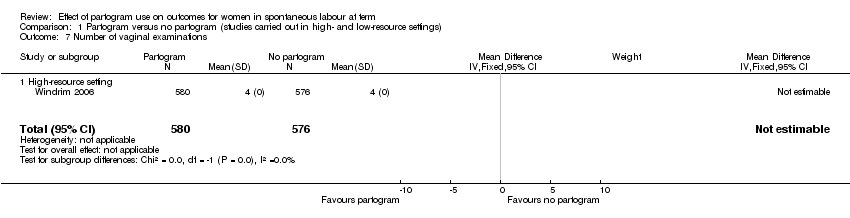
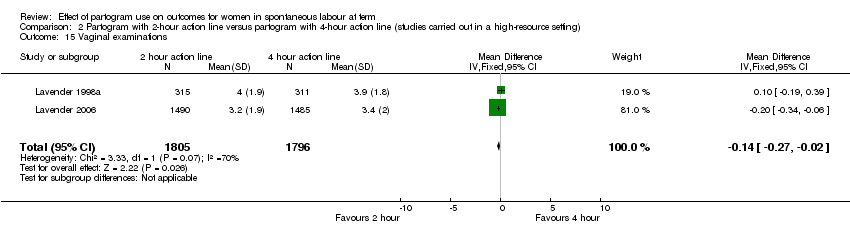
| 7 Number of vaginal examinations Show forest plot | 1 | 1156 | Mean Difference (IV, Fixed, 95% CI) | 0.0 [0.0, 0.0] |
|
| 7.1 High‐resource setting | 1 | 1156 | Mean Difference (IV, Fixed, 95% CI) | 0.0 [0.0, 0.0] |
| 8 Admission to special care nursery Show forest plot | 1 | 1156 | Risk Ratio (M‐H, Fixed, 95% CI) | 0.94 [0.51, 1.75] |
|
| 8.1 High‐resource setting | 1 | 1156 | Risk Ratio (M‐H, Fixed, 95% CI) | 0.94 [0.51, 1.75] |
| 9 Oxytocin augmentation Show forest plot | 1 | 1156 | Risk Ratio (M‐H, Fixed, 95% CI) | 1.02 [0.95, 1.10] |
|
| 9.1 High‐resource setting | 1 | 1156 | Risk Ratio (M‐H, Fixed, 95% CI) | 1.02 [0.95, 1.10] |
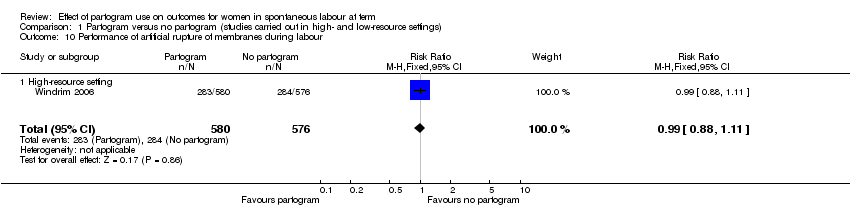
| 10 Performance of artificial rupture of membranes during labour Show forest plot | 1 | 1156 | Risk Ratio (M‐H, Fixed, 95% CI) | 0.99 [0.88, 1.11] |
|
| 10.1 High‐resource setting | 1 | 1156 | Risk Ratio (M‐H, Fixed, 95% CI) | 0.99 [0.88, 1.11] |
| 11 Antibiotic use Show forest plot | 1 | 1156 | Risk Ratio (M‐H, Fixed, 95% CI) | 1.23 [0.88, 1.73] |
|
| 11.1 High‐resource setting | 1 | 1156 | Risk Ratio (M‐H, Fixed, 95% CI) | 1.23 [0.88, 1.73] |