Educación individual del paciente con diabetes mellitus tipo 2
Referencias
Referencias de los estudios incluidos en esta revisión
Referencias de los estudios excluidos de esta revisión
Referencias adicionales
Characteristics of studies
Characteristics of included studies [ordered by study ID]
Ir a:
| Methods | Locale: New South Wales, Australia. | |
| Participants | Socio‐economic background: Not given. Could be judged by referral to the DES. 74% had education up to lower high school. | |
| Interventions | The study reported four interventions involving diet, exercise, use of oral hypoglycaemic agents, urine testing, foot care and recommendations to consult opthalmologist and podiatrist. | |
| Outcomes | HbA1, BMI kg/m2; fasting total cholesterol, mmol/l; HDL , mmol/l; cholesterol risk ratio ( total cholesterol /HDL); systolic BP, mmHg; diastolic BP, mmHg; knowledge test (DKN), 15‐point scale; satisfaction ,18 item scale developed by authors. | |
| Notes | Group education had components in individual sessions. Group patients received more overall contact than all other groups. Participants in Minimal program were not measured at 12 months. Therefore for analysis only individual and group were used | |
| Risk of bias | ||
| Bias | Authors' judgement | Support for judgement |
| Allocation concealment? | Unclear risk | B ‐ Unclear |
| Methods | Locale: Spain | |
| Participants | Socio‐economic background: Unsure. | |
| Interventions | Control: Group education. | |
| Outcomes | HbA1c%; HDL cholesterol, mmol/l; LDL cholesterol, mmol/l; BMI, kg/m2; systolic BP, mmHg; diastolic BP, mmHg; diabetes knowledge. | |
| Notes | There were almost twice as many women in Intervention group compared to that in Control group. Published in Spanish. Data extracted from summary, text and tables. | |
| Risk of bias | ||
| Bias | Authors' judgement | Support for judgement |
| Allocation concealment? | Unclear risk | B ‐ Unclear |
| Methods | Locale: The Netherlands | |
| Participants | Socio‐economic background: Participants from all levels of community. | |
| Interventions | Intervention: Collaborative, mixed educational intervention by two diabetes nurses. Focus on diabetes, compliance with medication, importance of physical exercise, losing weight and nutritional advice. 6 sessions during the 6 month period, total contact time of approximately 2.5 hours Control: Usual care by GP. GP instructed not to alter medication unless a patient developed severe hyperglycaemic symptoms | |
| Outcomes | HbA1c, %. body weight | |
| Notes | ||
| Risk of bias | ||
| Bias | Authors' judgement | Support for judgement |
| Allocation concealment? | Low risk | A ‐ Adequate |
| Methods | Locale: UK. | |
| Participants | Socio‐economic background: Pakistani migrant and many with little knowledge of English and many illiterate. | |
| Interventions | Intervention: Face‐to‐face by diabetes nurse using flash cards on various topics (diabetic diet, glucose monitoring and diabetic complications). The educational services were offered in Punjabi or Urudu. 20 minutes with each patient Control: usual care. | |
| Outcomes | HbA1c, %; knowledge on complications; food knowledge score. | |
| Notes | ||
| Risk of bias | ||
| Bias | Authors' judgement | Support for judgement |
| Allocation concealment? | Low risk | A ‐ Adequate |
| Methods | Locale: USA. | |
| Participants | Socio‐economic background: Those who responded to the advertisement for the service or incentive or both. | |
| Interventions | Control: usual care. | |
| Outcomes | HbA1c, %; total cholesterol, mmol/L; diastolic BP, mmHg; systolic BP, mmHg. | |
| Notes | intervention timing not clear; | |
| Risk of bias | ||
| Bias | Authors' judgement | Support for judgement |
| Allocation concealment? | Low risk | A ‐ Adequate |
| Methods | Locale: Hong Kong | |
| Participants | Socio‐economic background: | |
| Interventions | Both groups followed up every 10 ‐ 14 weeks | |
| Outcomes | fasting glucose, HbA1c, body mass index, waist circumference, blood pressure and lipid profiles | |
| Notes | ||
| Risk of bias | ||
| Bias | Authors' judgement | Support for judgement |
| Allocation concealment? | Unclear risk | D ‐ Not used |
| Methods | Locale: USA. | |
| Participants | Source of patients: referred by primary care providers. Newly diagnosed diabetes or no history of prior systematic diabetes education | |
| Interventions | General: Four sessions were given to both groups. 5‐7 hours. Contents covered topics on education including diet, glucose monitoring and foot care. Participants in control groups received in groups of 4 to 8. Individuals in intervention group had shorter sessions to cover the same material. Interventions in both settings emphasized empowering the patient, by increasing knowledge, facilitating self‐management behaviour change | |
| Outcomes | HbA1c, %; weight, kg; BMI, kg/m2; knowledge test (14pts); exercise (times/week); exercise duration (min/week); ATT‐19 ‐ Psychosocial adjustment and attitudes towards diabetes using 19‐point score; SF‐36 mental scale that measured mental health related quality of life; SF‐36 physical scale that measured physical health related quality of life. | |
| Notes | Allocation in blocks of 6 or 10 may be biased. Groups attending clinic may be relatives, friends of similar socio‐economic background. | |
| Risk of bias | ||
| Bias | Authors' judgement | Support for judgement |
| Allocation concealment? | Unclear risk | B ‐ Unclear |
| Methods | Locale: Japan | |
| Participants | Socio‐economic background: not stated | |
| Interventions | Intervention: received normal medical consultation and one‐to‐one counselling with a certified expert nurse at monthly hospital visits for 1 year. Features are patient participation in goal setting, personalized strategies and goal setting. | |
| Outcomes | HbA1c, HRQOL with SF‐36Japanese Version, PAID , cognitive modification (3 items), behavioural modification (1 item) and overall satisfaction with counselling (1 item) | |
| Notes | ||
| Risk of bias | ||
| Bias | Authors' judgement | Support for judgement |
| Allocation concealment? | Unclear risk | B ‐ Unclear |
| Methods | Locale: USA. | |
| Participants | Socio‐economic background: wide cover, low to middle income, mean of 12.6 yrs of education. | |
| Interventions | Control: standard diabetes care at 3 ‐ 4 month intervals. Providers nurse practitioners, internists, endocrinologists and family practice specialists | |
| Outcomes | HbA1c, %; BMI, kg/m2; self management on diet, 5‐point scale; self management on exercise, min/mo; distress‐ PAID score; integration ‐ TDQ score., treatment satisfaction DTSQc HbA1c DCA 2000 analyzer | |
| Notes | ||
| Risk of bias | ||
| Bias | Authors' judgement | Support for judgement |
| Allocation concealment? | High risk | C ‐ Inadequate |
Characteristics of excluded studies [ordered by study ID]
Ir a:
| Study | Reason for exclusion |
| Mixed individual and group education sessions | |
| Primarily group education | |
| Not a randomised controlled trial/ controlled trial | |
| Primarily group education | |
| Not a randomised controlled trial/ controlled trial | |
| Mixed type 1/ type 2 | |
| Primarily group education | |
| Primarily group education | |
| Primarily group education | |
| Not a randomised controlled trial/ controlled trial | |
| Primarily group education | |
| Primarily foot care intervention | |
| Not a randomised controlled trial/ controlled trial | |
| Managed care ‐ pharmacy | |
| Primarily group education | |
| Mixed individual and group education sessions | |
| Primarily group education | |
| Control group non standardized individual education | |
| Primarily physical activity intervention | |
| Education of professionals | |
| Primarily group education | |
| Education of professionals | |
| Mixed individual and group education sessions | |
| Not a randomised controlled trial/ controlled trial | |
| Managed care ‐ pharmacy | |
| Primarily group education | |
| Mixed individual and group education sessions | |
| Managed care | |
| Mixed individual and group education sessions | |
| Mixed individual and group education sessions | |
| Managed care | |
| Primarily group education | |
| Not randomised controlled trial/ controlled trial | |
| Not a randomised controlled trial/ controlled trial | |
| Primarily group education | |
| Managed care ‐ pharmacy | |
| Not a randomised controlled trial/ controlled trial | |
| Mixed individual and group education sessions | |
| Primarily group education | |
| Not a randomised controlled trial/ controlled trial | |
| Education not face to face | |
| Not a randomised controlled trial/ controlled trial | |
| Primarily physical activity intervention | |
| Primarily group education | |
| Primarily dietary intervention | |
| Not a randomised controlled trial/ controlled trial | |
| Mixed individual and group education sessions | |
| Primarily dietary intervention | |
| Mixed individual and group education sessions | |
| Not a randomised controlled trial/ controlled trial | |
| Not individual education | |
| Not specific for diabetes | |
| Primarily group education | |
| Primarily group education | |
| Managed care | |
| Primarily physical activity intervention | |
| Mixed individual and group education sessions | |
| Mixed individual and group education sessions | |
| Mixed individual and group education sessions | |
| References 'Corbett 2003' which evaluated foot care | |
| Managed care ‐ pharmacy | |
| Mixed individual and group education sessions | |
| Primarily group education | |
| Mixed individual and group education sessions | |
| Not a randomised controlled trial/ controlled trial, group education | |
| Primarily group education | |
| Primarily group education | |
| Primarily group education | |
| Not specific to diabetes |
Data and analyses
| Outcome or subgroup title | No. of studies | No. of participants | Statistical method | Effect size |
| 1 HbA1c: 6 ‐ 9 months (r = 0.75) Show forest plot | 3 | 295 | Mean Difference (IV, Fixed, 95% CI) | ‐0.23 [‐0.49, 0.03] |
| Analysis 1.1  Comparison 1 Individual diabetes education programme versus usual care, Outcome 1 HbA1c: 6 ‐ 9 months (r = 0.75). | ||||
| 1.1 Both Sexes | 2 | 246 | Mean Difference (IV, Fixed, 95% CI) | ‐0.33 [‐0.67, 0.02] |
| 1.2 Women | 1 | 49 | Mean Difference (IV, Fixed, 95% CI) | ‐0.1 [‐0.50, 0.30] |
| 2 HbA1c: 12 ‐ 18 months (r = 0.75) Show forest plot | 4 | 632 | Mean Difference (IV, Fixed, 95% CI) | ‐0.08 [‐0.25, 0.08] |
| Analysis 1.2  Comparison 1 Individual diabetes education programme versus usual care, Outcome 2 HbA1c: 12 ‐ 18 months (r = 0.75). | ||||
| 3 HbA1c: 6 ‐ 9 months (r = 0.25) Show forest plot | 3 | 295 | Mean Difference (IV, Fixed, 95% CI) | ‐0.26 [‐0.69, 0.16] |
| Analysis 1.3  Comparison 1 Individual diabetes education programme versus usual care, Outcome 3 HbA1c: 6 ‐ 9 months (r = 0.25). | ||||
| 3.1 Both Sexes | 2 | 246 | Mean Difference (IV, Fixed, 95% CI) | ‐0.37 [‐0.92, 0.18] |
| 3.2 Women | 1 | 49 | Mean Difference (IV, Fixed, 95% CI) | ‐0.1 [‐0.78, 0.58] |
| 4 HbA1c: 12 ‐ 18 months (r = 0.25) Show forest plot | 4 | 632 | Mean Difference (IV, Fixed, 95% CI) | ‐0.05 [‐0.25, 0.14] |
| Analysis 1.4  Comparison 1 Individual diabetes education programme versus usual care, Outcome 4 HbA1c: 12 ‐ 18 months (r = 0.25). | ||||
| 5 BMI: 6 ‐ 9 months (r = 0.75) Show forest plot | 1 | Mean Difference (IV, Fixed, 95% CI) | Totals not selected | |
| Analysis 1.5  Comparison 1 Individual diabetes education programme versus usual care, Outcome 5 BMI: 6 ‐ 9 months (r = 0.75). | ||||
| 5.1 Women | 1 | Mean Difference (IV, Fixed, 95% CI) | 0.0 [0.0, 0.0] | |
| 6 BMI: 12 ‐ 18 months (r = 0.75) Show forest plot | 2 | Mean Difference (IV, Fixed, 95% CI) | Subtotals only | |
| Analysis 1.6  Comparison 1 Individual diabetes education programme versus usual care, Outcome 6 BMI: 12 ‐ 18 months (r = 0.75). | ||||
| 7 Systolic blood pressure: 12 ‐ 18 months (r = 0.75) Show forest plot | 3 | 625 | Mean Difference (IV, Fixed, 95% CI) | ‐1.86 [‐4.68, 0.95] |
| Analysis 1.7  Comparison 1 Individual diabetes education programme versus usual care, Outcome 7 Systolic blood pressure: 12 ‐ 18 months (r = 0.75). | ||||
| 8 Diastolic blood pressure: 12 ‐ 18 months (r = 0.75) Show forest plot | 3 | 624 | Mean Difference (IV, Fixed, 95% CI) | ‐1.61 [‐3.22, 0.00] |
| Analysis 1.8  Comparison 1 Individual diabetes education programme versus usual care, Outcome 8 Diastolic blood pressure: 12 ‐ 18 months (r = 0.75). | ||||
| 9 Total cholesterol: 12 ‐ 18 months Show forest plot | 3 | 627 | Mean Difference (IV, Fixed, 95% CI) | ‐0.03 [‐0.16, 0.10] |
| Analysis 1.9  Comparison 1 Individual diabetes education programme versus usual care, Outcome 9 Total cholesterol: 12 ‐ 18 months. | ||||
| 10 Mean baseline HbA1c> 8% Show forest plot | 3 | 424 | Mean Difference (IV, Fixed, 95% CI) | ‐0.31 [‐0.54, ‐0.09] |
| Analysis 1.10  Comparison 1 Individual diabetes education programme versus usual care, Outcome 10 Mean baseline HbA1c> 8%. | ||||
| Outcome or subgroup title | No. of studies | No. of participants | Statistical method | Effect size |
| 1 HbA1c: 6 ‐ 9 months (r = 0.75) Show forest plot | 2 | 148 | Mean Difference (IV, Fixed, 95% CI) | 0.81 [0.34, 1.29] |
| Analysis 2.1  Comparison 2 Individual diabetes education programme versus group education programme, Outcome 1 HbA1c: 6 ‐ 9 months (r = 0.75). | ||||
| 2 HbA1c: 12 ‐ 18 months Show forest plot | 2 | 112 | Mean Difference (IV, Fixed, 95% CI) | 0.03 [‐0.02, 0.08] |
| Analysis 2.2  Comparison 2 Individual diabetes education programme versus group education programme, Outcome 2 HbA1c: 12 ‐ 18 months. | ||||
| 3 HbA1c: 6 ‐ 9 months (r = 0.25) Show forest plot | 2 | 148 | Mean Difference (IV, Fixed, 95% CI) | 0.83 [0.19, 1.47] |
| Analysis 2.3  Comparison 2 Individual diabetes education programme versus group education programme, Outcome 3 HbA1c: 6 ‐ 9 months (r = 0.25). | ||||
| 4 BMI: 6 ‐ 9 months (r = 0.75) Show forest plot | 2 | 169 | Mean Difference (IV, Fixed, 95% CI) | ‐0.11 [‐0.87, 0.65] |
| Analysis 2.4  Comparison 2 Individual diabetes education programme versus group education programme, Outcome 4 BMI: 6 ‐ 9 months (r = 0.75). | ||||
| 5 BMI: 12 ‐ 18 months (r = 0.75) Show forest plot | 2 | 123 | Mean Difference (IV, Fixed, 95% CI) | ‐0.01 [‐0.75, 0.73] |
| Analysis 2.5  Comparison 2 Individual diabetes education programme versus group education programme, Outcome 5 BMI: 12 ‐ 18 months (r = 0.75). | ||||
| 6 Systolic blood pressure: 12 ‐ 18 months Show forest plot | 2 | 95 | Mean Difference (IV, Fixed, 95% CI) | 4.12 [‐4.09, 12.32] |
| Analysis 2.6  Comparison 2 Individual diabetes education programme versus group education programme, Outcome 6 Systolic blood pressure: 12 ‐ 18 months. | ||||
| 7 Diastolic blood pressure: 12 ‐ 18 months (r = 0.75) Show forest plot | 2 | 95 | Mean Difference (IV, Fixed, 95% CI) | 1.52 [‐4.07, 7.11] |
| Analysis 2.7  Comparison 2 Individual diabetes education programme versus group education programme, Outcome 7 Diastolic blood pressure: 12 ‐ 18 months (r = 0.75). | ||||
| 8 Total cholesterol: 12 ‐ 18 months Show forest plot | 1 | Mean Difference (IV, Fixed, 95% CI) | Totals not selected | |
| Analysis 2.8  Comparison 2 Individual diabetes education programme versus group education programme, Outcome 8 Total cholesterol: 12 ‐ 18 months. | ||||
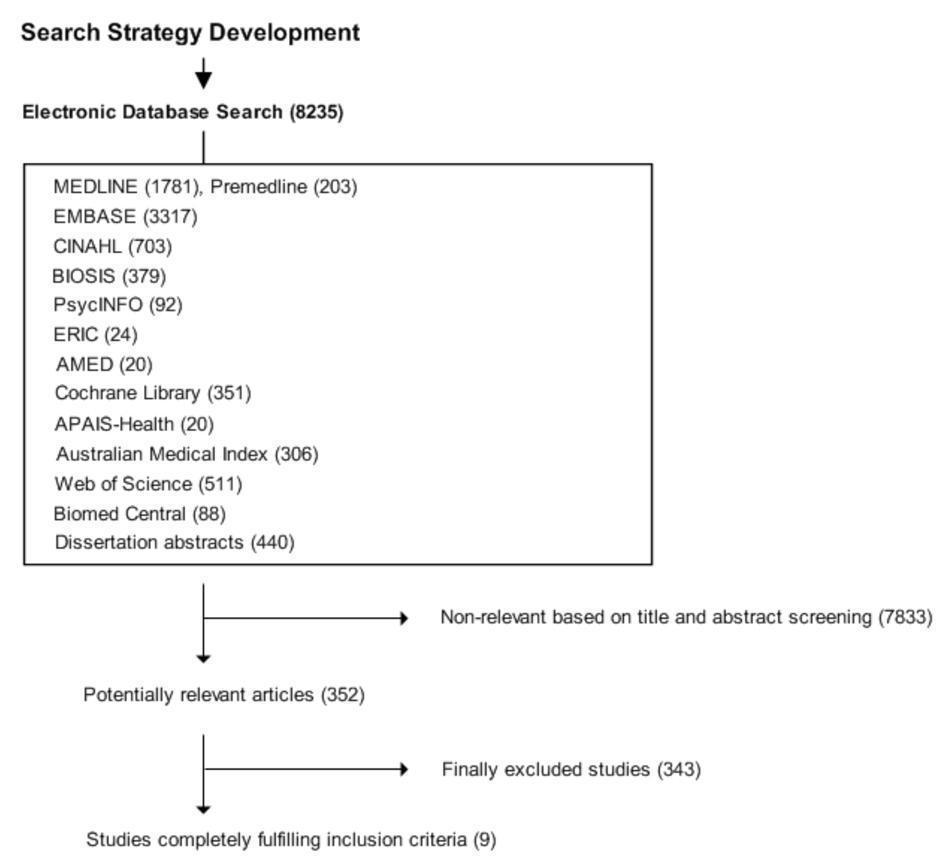
Amended QUOROM (quality of reporting of meta‐analyses) flow‐chart of study selection
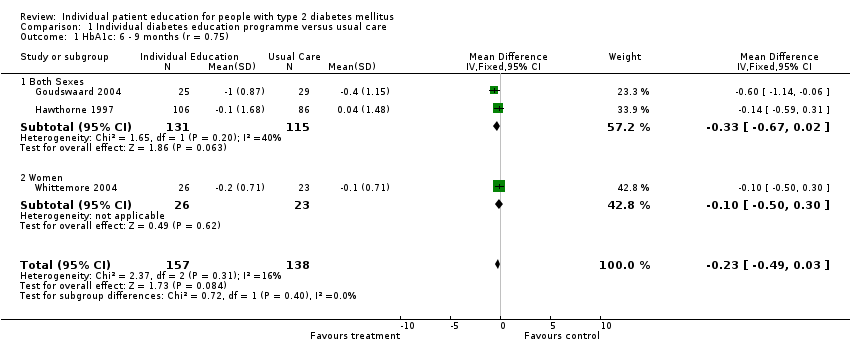
Comparison 1 Individual diabetes education programme versus usual care, Outcome 1 HbA1c: 6 ‐ 9 months (r = 0.75).

Comparison 1 Individual diabetes education programme versus usual care, Outcome 2 HbA1c: 12 ‐ 18 months (r = 0.75).
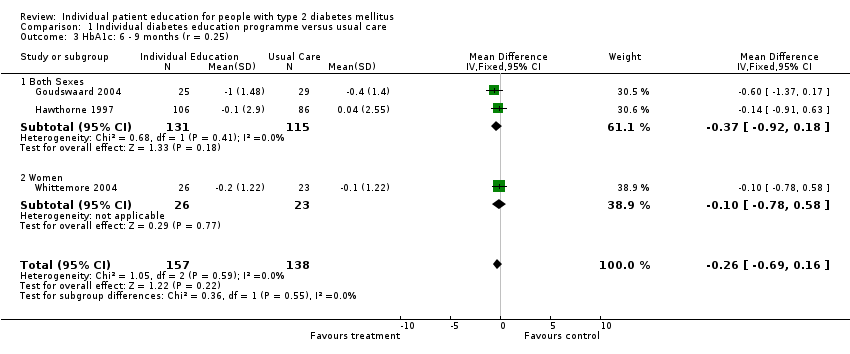
Comparison 1 Individual diabetes education programme versus usual care, Outcome 3 HbA1c: 6 ‐ 9 months (r = 0.25).
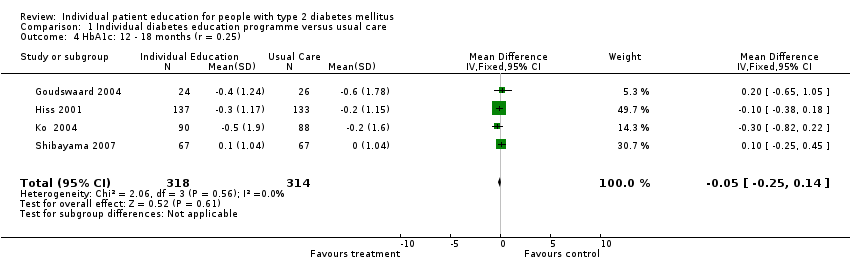
Comparison 1 Individual diabetes education programme versus usual care, Outcome 4 HbA1c: 12 ‐ 18 months (r = 0.25).

Comparison 1 Individual diabetes education programme versus usual care, Outcome 5 BMI: 6 ‐ 9 months (r = 0.75).

Comparison 1 Individual diabetes education programme versus usual care, Outcome 6 BMI: 12 ‐ 18 months (r = 0.75).

Comparison 1 Individual diabetes education programme versus usual care, Outcome 7 Systolic blood pressure: 12 ‐ 18 months (r = 0.75).
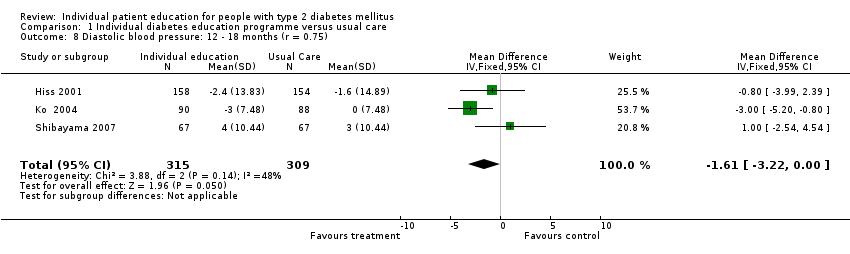
Comparison 1 Individual diabetes education programme versus usual care, Outcome 8 Diastolic blood pressure: 12 ‐ 18 months (r = 0.75).

Comparison 1 Individual diabetes education programme versus usual care, Outcome 9 Total cholesterol: 12 ‐ 18 months.
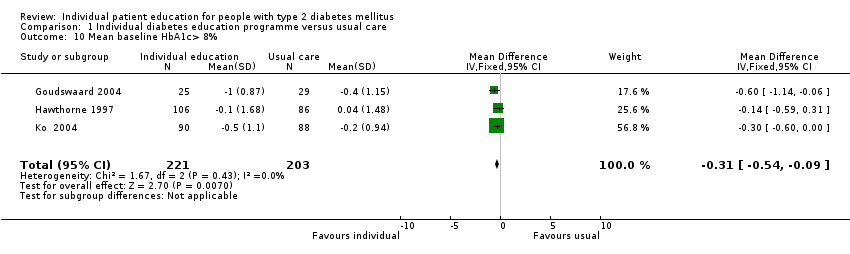
Comparison 1 Individual diabetes education programme versus usual care, Outcome 10 Mean baseline HbA1c> 8%.
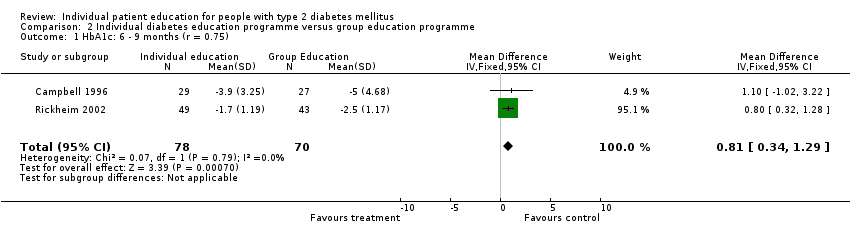
Comparison 2 Individual diabetes education programme versus group education programme, Outcome 1 HbA1c: 6 ‐ 9 months (r = 0.75).
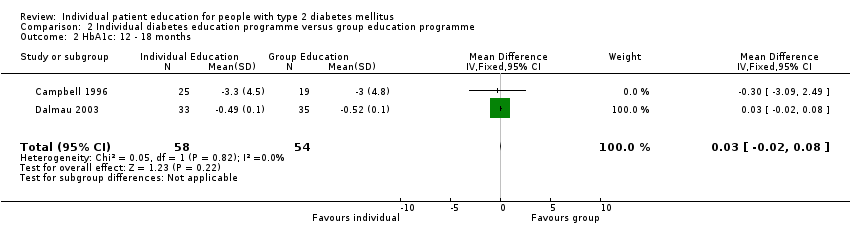
Comparison 2 Individual diabetes education programme versus group education programme, Outcome 2 HbA1c: 12 ‐ 18 months.
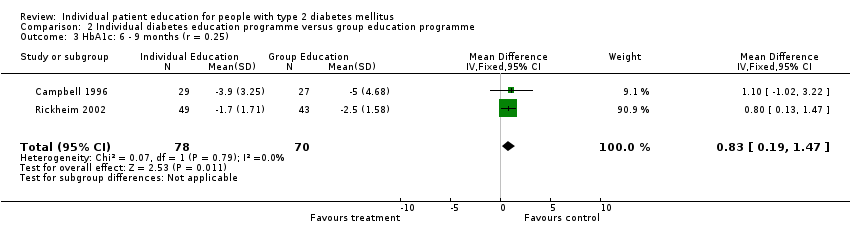
Comparison 2 Individual diabetes education programme versus group education programme, Outcome 3 HbA1c: 6 ‐ 9 months (r = 0.25).
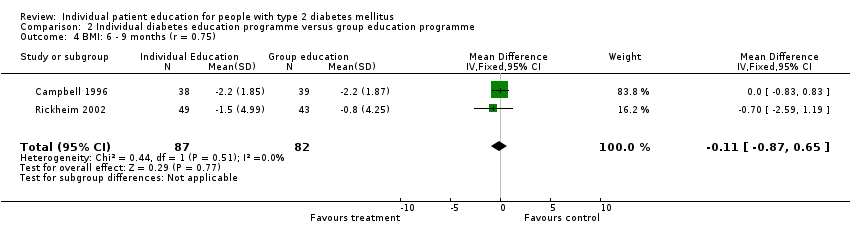
Comparison 2 Individual diabetes education programme versus group education programme, Outcome 4 BMI: 6 ‐ 9 months (r = 0.75).
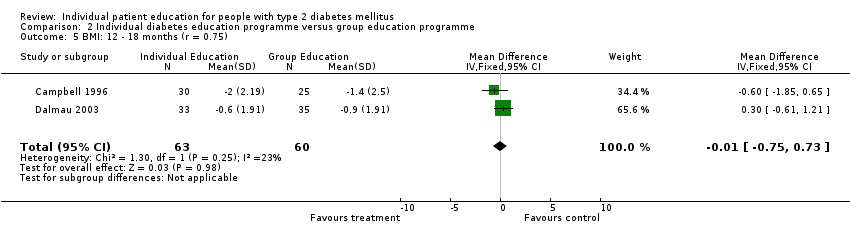
Comparison 2 Individual diabetes education programme versus group education programme, Outcome 5 BMI: 12 ‐ 18 months (r = 0.75).

Comparison 2 Individual diabetes education programme versus group education programme, Outcome 6 Systolic blood pressure: 12 ‐ 18 months.

Comparison 2 Individual diabetes education programme versus group education programme, Outcome 7 Diastolic blood pressure: 12 ‐ 18 months (r = 0.75).

Comparison 2 Individual diabetes education programme versus group education programme, Outcome 8 Total cholesterol: 12 ‐ 18 months.
| Outcome or subgroup title | No. of studies | No. of participants | Statistical method | Effect size |
| 1 HbA1c: 6 ‐ 9 months (r = 0.75) Show forest plot | 3 | 295 | Mean Difference (IV, Fixed, 95% CI) | ‐0.23 [‐0.49, 0.03] |
| 1.1 Both Sexes | 2 | 246 | Mean Difference (IV, Fixed, 95% CI) | ‐0.33 [‐0.67, 0.02] |
| 1.2 Women | 1 | 49 | Mean Difference (IV, Fixed, 95% CI) | ‐0.1 [‐0.50, 0.30] |
| 2 HbA1c: 12 ‐ 18 months (r = 0.75) Show forest plot | 4 | 632 | Mean Difference (IV, Fixed, 95% CI) | ‐0.08 [‐0.25, 0.08] |
| 3 HbA1c: 6 ‐ 9 months (r = 0.25) Show forest plot | 3 | 295 | Mean Difference (IV, Fixed, 95% CI) | ‐0.26 [‐0.69, 0.16] |
| 3.1 Both Sexes | 2 | 246 | Mean Difference (IV, Fixed, 95% CI) | ‐0.37 [‐0.92, 0.18] |
| 3.2 Women | 1 | 49 | Mean Difference (IV, Fixed, 95% CI) | ‐0.1 [‐0.78, 0.58] |
| 4 HbA1c: 12 ‐ 18 months (r = 0.25) Show forest plot | 4 | 632 | Mean Difference (IV, Fixed, 95% CI) | ‐0.05 [‐0.25, 0.14] |
| 5 BMI: 6 ‐ 9 months (r = 0.75) Show forest plot | 1 | Mean Difference (IV, Fixed, 95% CI) | Totals not selected | |
| 5.1 Women | 1 | Mean Difference (IV, Fixed, 95% CI) | 0.0 [0.0, 0.0] | |
| 6 BMI: 12 ‐ 18 months (r = 0.75) Show forest plot | 2 | Mean Difference (IV, Fixed, 95% CI) | Subtotals only | |
| 7 Systolic blood pressure: 12 ‐ 18 months (r = 0.75) Show forest plot | 3 | 625 | Mean Difference (IV, Fixed, 95% CI) | ‐1.86 [‐4.68, 0.95] |
| 8 Diastolic blood pressure: 12 ‐ 18 months (r = 0.75) Show forest plot | 3 | 624 | Mean Difference (IV, Fixed, 95% CI) | ‐1.61 [‐3.22, 0.00] |
| 9 Total cholesterol: 12 ‐ 18 months Show forest plot | 3 | 627 | Mean Difference (IV, Fixed, 95% CI) | ‐0.03 [‐0.16, 0.10] |
| 10 Mean baseline HbA1c> 8% Show forest plot | 3 | 424 | Mean Difference (IV, Fixed, 95% CI) | ‐0.31 [‐0.54, ‐0.09] |
| Outcome or subgroup title | No. of studies | No. of participants | Statistical method | Effect size |
| 1 HbA1c: 6 ‐ 9 months (r = 0.75) Show forest plot | 2 | 148 | Mean Difference (IV, Fixed, 95% CI) | 0.81 [0.34, 1.29] |
| 2 HbA1c: 12 ‐ 18 months Show forest plot | 2 | 112 | Mean Difference (IV, Fixed, 95% CI) | 0.03 [‐0.02, 0.08] |
| 3 HbA1c: 6 ‐ 9 months (r = 0.25) Show forest plot | 2 | 148 | Mean Difference (IV, Fixed, 95% CI) | 0.83 [0.19, 1.47] |
| 4 BMI: 6 ‐ 9 months (r = 0.75) Show forest plot | 2 | 169 | Mean Difference (IV, Fixed, 95% CI) | ‐0.11 [‐0.87, 0.65] |
| 5 BMI: 12 ‐ 18 months (r = 0.75) Show forest plot | 2 | 123 | Mean Difference (IV, Fixed, 95% CI) | ‐0.01 [‐0.75, 0.73] |
| 6 Systolic blood pressure: 12 ‐ 18 months Show forest plot | 2 | 95 | Mean Difference (IV, Fixed, 95% CI) | 4.12 [‐4.09, 12.32] |
| 7 Diastolic blood pressure: 12 ‐ 18 months (r = 0.75) Show forest plot | 2 | 95 | Mean Difference (IV, Fixed, 95% CI) | 1.52 [‐4.07, 7.11] |
| 8 Total cholesterol: 12 ‐ 18 months Show forest plot | 1 | Mean Difference (IV, Fixed, 95% CI) | Totals not selected | |