Scolaris Content Display Scolaris Content Display

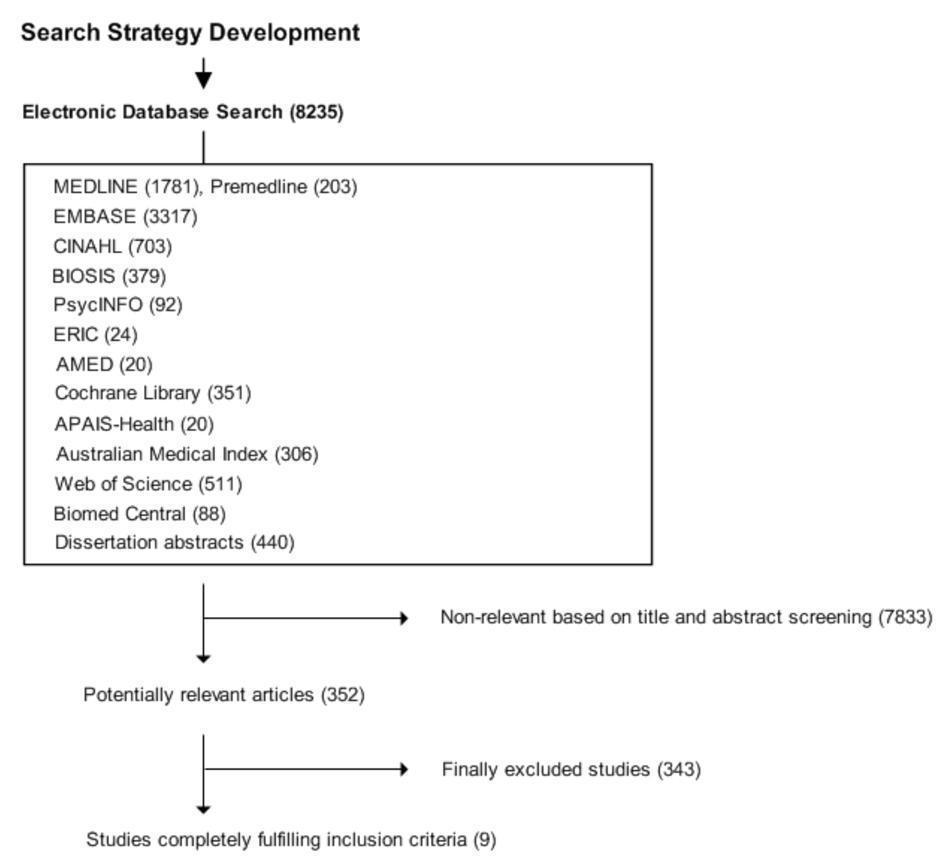
Amended QUOROM (quality of reporting of meta‐analyses) flow‐chart of study selection
Figuras y tablas -
Figure 1

Amended QUOROM (quality of reporting of meta‐analyses) flow‐chart of study selection

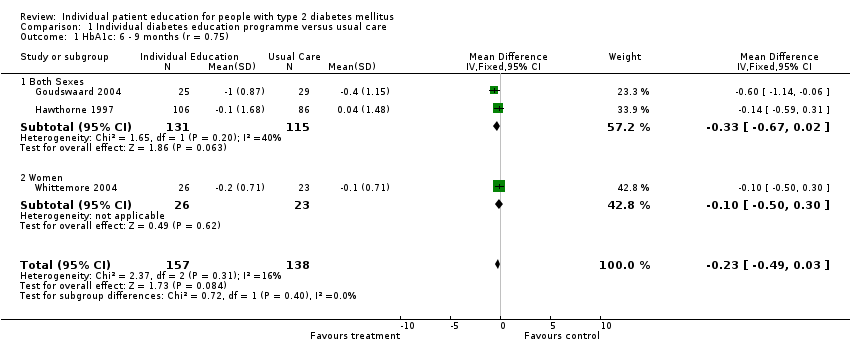
Comparison 1 Individual diabetes education programme versus usual care, Outcome 1 HbA1c: 6 ‐ 9 months (r = 0.75).
Figuras y tablas -
Analysis 1.1

Comparison 1 Individual diabetes education programme versus usual care, Outcome 1 HbA1c: 6 ‐ 9 months (r = 0.75).

Comparison 1 Individual diabetes education programme versus usual care, Outcome 2 HbA1c: 12 ‐ 18 months (r = 0.75).
Figuras y tablas -
Analysis 1.2

Comparison 1 Individual diabetes education programme versus usual care, Outcome 2 HbA1c: 12 ‐ 18 months (r = 0.75).

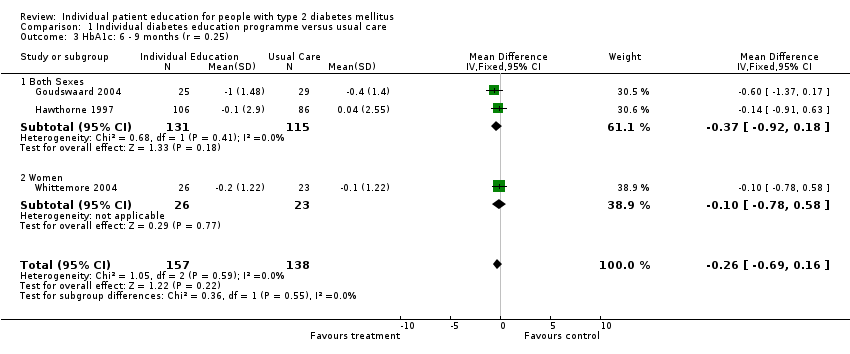
Comparison 1 Individual diabetes education programme versus usual care, Outcome 3 HbA1c: 6 ‐ 9 months (r = 0.25).
Figuras y tablas -
Analysis 1.3

Comparison 1 Individual diabetes education programme versus usual care, Outcome 3 HbA1c: 6 ‐ 9 months (r = 0.25).

Comparison 1 Individual diabetes education programme versus usual care, Outcome 4 HbA1c: 12 ‐ 18 months (r = 0.25).
Figuras y tablas -
Analysis 1.4

Comparison 1 Individual diabetes education programme versus usual care, Outcome 4 HbA1c: 12 ‐ 18 months (r = 0.25).

Comparison 1 Individual diabetes education programme versus usual care, Outcome 5 BMI: 6 ‐ 9 months (r = 0.75).
Figuras y tablas -
Analysis 1.5

Comparison 1 Individual diabetes education programme versus usual care, Outcome 5 BMI: 6 ‐ 9 months (r = 0.75).

Comparison 1 Individual diabetes education programme versus usual care, Outcome 6 BMI: 12 ‐ 18 months (r = 0.75).
Figuras y tablas -
Analysis 1.6

Comparison 1 Individual diabetes education programme versus usual care, Outcome 6 BMI: 12 ‐ 18 months (r = 0.75).

Comparison 1 Individual diabetes education programme versus usual care, Outcome 7 Systolic blood pressure: 12 ‐ 18 months (r = 0.75).
Figuras y tablas -
Analysis 1.7

Comparison 1 Individual diabetes education programme versus usual care, Outcome 7 Systolic blood pressure: 12 ‐ 18 months (r = 0.75).

Comparison 1 Individual diabetes education programme versus usual care, Outcome 8 Diastolic blood pressure: 12 ‐ 18 months (r = 0.75).
Figuras y tablas -
Analysis 1.8

Comparison 1 Individual diabetes education programme versus usual care, Outcome 8 Diastolic blood pressure: 12 ‐ 18 months (r = 0.75).

Comparison 1 Individual diabetes education programme versus usual care, Outcome 9 Total cholesterol: 12 ‐ 18 months.
Figuras y tablas -
Analysis 1.9

Comparison 1 Individual diabetes education programme versus usual care, Outcome 9 Total cholesterol: 12 ‐ 18 months.

Comparison 1 Individual diabetes education programme versus usual care, Outcome 10 Mean baseline HbA1c> 8%.
Figuras y tablas -
Analysis 1.10

Comparison 1 Individual diabetes education programme versus usual care, Outcome 10 Mean baseline HbA1c> 8%.

Comparison 2 Individual diabetes education programme versus group education programme, Outcome 1 HbA1c: 6 ‐ 9 months (r = 0.75).
Figuras y tablas -
Analysis 2.1

Comparison 2 Individual diabetes education programme versus group education programme, Outcome 1 HbA1c: 6 ‐ 9 months (r = 0.75).

Comparison 2 Individual diabetes education programme versus group education programme, Outcome 2 HbA1c: 12 ‐ 18 months.
Figuras y tablas -
Analysis 2.2

Comparison 2 Individual diabetes education programme versus group education programme, Outcome 2 HbA1c: 12 ‐ 18 months.

Comparison 2 Individual diabetes education programme versus group education programme, Outcome 3 HbA1c: 6 ‐ 9 months (r = 0.25).
Figuras y tablas -
Analysis 2.3

Comparison 2 Individual diabetes education programme versus group education programme, Outcome 3 HbA1c: 6 ‐ 9 months (r = 0.25).

Comparison 2 Individual diabetes education programme versus group education programme, Outcome 4 BMI: 6 ‐ 9 months (r = 0.75).
Figuras y tablas -
Analysis 2.4

Comparison 2 Individual diabetes education programme versus group education programme, Outcome 4 BMI: 6 ‐ 9 months (r = 0.75).

Comparison 2 Individual diabetes education programme versus group education programme, Outcome 5 BMI: 12 ‐ 18 months (r = 0.75).
Figuras y tablas -
Analysis 2.5

Comparison 2 Individual diabetes education programme versus group education programme, Outcome 5 BMI: 12 ‐ 18 months (r = 0.75).

Comparison 2 Individual diabetes education programme versus group education programme, Outcome 6 Systolic blood pressure: 12 ‐ 18 months.
Figuras y tablas -
Analysis 2.6

Comparison 2 Individual diabetes education programme versus group education programme, Outcome 6 Systolic blood pressure: 12 ‐ 18 months.

Comparison 2 Individual diabetes education programme versus group education programme, Outcome 7 Diastolic blood pressure: 12 ‐ 18 months (r = 0.75).
Figuras y tablas -
Analysis 2.7

Comparison 2 Individual diabetes education programme versus group education programme, Outcome 7 Diastolic blood pressure: 12 ‐ 18 months (r = 0.75).

Comparison 2 Individual diabetes education programme versus group education programme, Outcome 8 Total cholesterol: 12 ‐ 18 months.
Figuras y tablas -
Analysis 2.8

Comparison 2 Individual diabetes education programme versus group education programme, Outcome 8 Total cholesterol: 12 ‐ 18 months.

Comparison 1. Individual diabetes education programme versus usual care

Outcome or subgroup title

No. of studies

No. of participants

Statistical method

Effect size

1 HbA1c: 6 ‐ 9 months (r = 0.75) Show forest plot

3

295

Mean Difference (IV, Fixed, 95% CI)

‐0.23 [‐0.49, 0.03]

1.1 Both Sexes

2

246

Mean Difference (IV, Fixed, 95% CI)

‐0.33 [‐0.67, 0.02]

1.2 Women

1

49

Mean Difference (IV, Fixed, 95% CI)

‐0.1 [‐0.50, 0.30]

2 HbA1c: 12 ‐ 18 months (r = 0.75) Show forest plot

4

632

Mean Difference (IV, Fixed, 95% CI)

‐0.08 [‐0.25, 0.08]

3 HbA1c: 6 ‐ 9 months (r = 0.25) Show forest plot

3

295

Mean Difference (IV, Fixed, 95% CI)

‐0.26 [‐0.69, 0.16]

3.1 Both Sexes

2

246

Mean Difference (IV, Fixed, 95% CI)

‐0.37 [‐0.92, 0.18]

3.2 Women

1

49

Mean Difference (IV, Fixed, 95% CI)

‐0.1 [‐0.78, 0.58]

4 HbA1c: 12 ‐ 18 months (r = 0.25) Show forest plot

4

632

Mean Difference (IV, Fixed, 95% CI)

‐0.05 [‐0.25, 0.14]

5 BMI: 6 ‐ 9 months (r = 0.75) Show forest plot

1

Mean Difference (IV, Fixed, 95% CI)

Totals not selected

5.1 Women

1

Mean Difference (IV, Fixed, 95% CI)

0.0 [0.0, 0.0]

6 BMI: 12 ‐ 18 months (r = 0.75) Show forest plot

2

Mean Difference (IV, Fixed, 95% CI)

Subtotals only

7 Systolic blood pressure: 12 ‐ 18 months (r = 0.75) Show forest plot

3

625

Mean Difference (IV, Fixed, 95% CI)

‐1.86 [‐4.68, 0.95]

8 Diastolic blood pressure: 12 ‐ 18 months (r = 0.75) Show forest plot

3

624

Mean Difference (IV, Fixed, 95% CI)

‐1.61 [‐3.22, 0.00]

9 Total cholesterol: 12 ‐ 18 months Show forest plot

3

627

Mean Difference (IV, Fixed, 95% CI)

‐0.03 [‐0.16, 0.10]

10 Mean baseline HbA1c> 8% Show forest plot

3

424

Mean Difference (IV, Fixed, 95% CI)

‐0.31 [‐0.54, ‐0.09]

Figuras y tablas -
Comparison 1. Individual diabetes education programme versus usual care
Comparison 2. Individual diabetes education programme versus group education programme

Outcome or subgroup title

No. of studies

No. of participants

Statistical method

Effect size

1 HbA1c: 6 ‐ 9 months (r = 0.75) Show forest plot

2

148

Mean Difference (IV, Fixed, 95% CI)

0.81 [0.34, 1.29]

2 HbA1c: 12 ‐ 18 months Show forest plot

2

112

Mean Difference (IV, Fixed, 95% CI)

0.03 [‐0.02, 0.08]

3 HbA1c: 6 ‐ 9 months (r = 0.25) Show forest plot

2

148

Mean Difference (IV, Fixed, 95% CI)

0.83 [0.19, 1.47]

4 BMI: 6 ‐ 9 months (r = 0.75) Show forest plot

2

169

Mean Difference (IV, Fixed, 95% CI)

‐0.11 [‐0.87, 0.65]

5 BMI: 12 ‐ 18 months (r = 0.75) Show forest plot

2

123

Mean Difference (IV, Fixed, 95% CI)

‐0.01 [‐0.75, 0.73]

6 Systolic blood pressure: 12 ‐ 18 months Show forest plot

2

95

Mean Difference (IV, Fixed, 95% CI)

4.12 [‐4.09, 12.32]

7 Diastolic blood pressure: 12 ‐ 18 months (r = 0.75) Show forest plot

2

95

Mean Difference (IV, Fixed, 95% CI)

1.52 [‐4.07, 7.11]

8 Total cholesterol: 12 ‐ 18 months Show forest plot

1

Mean Difference (IV, Fixed, 95% CI)

Totals not selected

Figuras y tablas -
Comparison 2. Individual diabetes education programme versus group education programme