| Adverse events | Chang 2002 | Hartkamp 2004 | Petri 2002 | Petri 2004 | van Vollenhoven 1995 | van Vollenhoven 1999 | Nordmark 1002 |
| No. Participants | DHEA:61; Placebo:59 | DHEA:30; Placebo:30 | DHEA 100mg:63; DHEA 200mg: 64; Placebo:64 | DHEA:192; Placebo: 189 | DHEA:14; Placebo:14 | DHEA:10; Placebo:10 | DHEA: 20; Placebo:17 |
| Serious AEs | DHEA: 7 (11.5); Placebo: 18 (30.5) | | | DHEA: 33 (17); placebo: 27 (14) | DHEA: 1; placebo: 1 | DHEA: 1; placebo: 2 | |
| Withdrawal due to AE | | | DHEA 100: 4 (6); DHEA 200: 6 (9); placebo:3 (5) | DHEA: 11 (5.7); placebo:27 (14.3) | DHEA: 0; placebo: 0 | | |
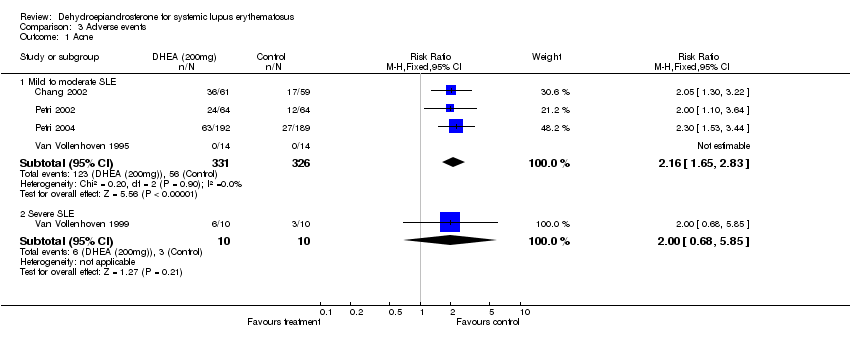
| Acne | DHEA: 59%; placebo: 29% | | DHEA 100: 26 (41); DHEA 200: 26 (41); placebo:12 (19) | DHEA: 63 (33.3); placebo: 27 (14.1) | DHEA:8 (57); placebo: 1 (7) | DHEA: 6; placebo:3 | |
| Hirsutism | | | DHEA 100: 7 (11); DHEA 200:5 (7.8); placebo: 3 (4.7) | DHEA: 31 (16.4); placebo: 3 (1.6) | DHEA: 2 (14); placebo:4 (28) | DHEA:4; placebo:2 | |
| Weight Gai | | | | | DHEA: 2(14); placebo:1 (7) | | |
| Rash | | | DHEA 100: 3 (4.8); DHEA 200: 7 (11); placebo: 3 (4.7) | DHEA: 62 (32.3); placebo: 75 (39.7) | DHEA :0 ; placebo: 2 (14) | | |
| Menarrhagia | | | DHEA 100:5 (7.9); DHEA 200: 5 (7.8); placebo: 3 (4.7) | | DHEA: 1 (7); placebo: 2 (14) | DHEA: 8; placebo :3 | |
| Headache | | | DHEA 100: 3 (4.8); DHEA 200: 4 (6.3); placebo:1 (1.6) | DHEA: 56 (29.2); placebo:42 (22.2) | | DHEA:4 ; placebo: 4 | |
| Abdominal Pain | | | DHEA 100: 3 (4.8); DHEA 200: 5 (7.8); placebo:0 | DHEA: 30 (25.6); placebo: 27 (14.3) | | | |
| Chest Pain | | | | DHEA: 22 (10.4); placebo: 14 (7.4) | | | |
| Arthralgia | | | | DHEA:71 (37.0); placebo: 68 (36) | | | |
| Asthenia | | | DHEA 100: 4 (6.3); DHEA 200: 3 (4.7); placebo:3 (4.7) | DHEA: 51 (26.6); Placebo45 (23.8) | | | |
| Myalgia | | | | DHEA: 69 (35.9); placebo: 42 (22.2) | | | |
| flu like symptoms | | | | DHEA: 42 (21.9); placebo: 39 (20.6) | | | |
| Stomatitis | | | | DHEA: 44 (22.9); placebo: 28 (14.8) | | | |
| Mood Change | | | | DHEA: 30 (15.6); placebo:28 (14.8) | DHEA; 1 (7); placebo: 0 | DHEA:1; placebo:3 | |
| Alopecia | | | | DHEA: 39 (20.3); placebo: 28 (14.8) | | DHEA: 0; placebo:1 | |
| Fever | | | | DHEA: 28 (14.6); placebo: 22 (11.6) | | | |
| Perihperal vascular disease | | | | DHEA: 20 (10.4); placebo: 19 (10.1) | | | |
| Sinusitis | | | | DHEA: 21 (10.4); placebo: 17 (9) | | | |
| Insomnia | | | DHEA 100: 4 (6.3); DHEA 200: 3 (4.7); placebo:2 (3.1) | | | DHEA: 2; placebo:1 | |