Deshidroepiandrosterona para el lupus eritematoso sistémico
Referencias
Referencias de los estudios incluidos en esta revisión
Referencias de los estudios excluidos de esta revisión
Referencias adicionales
Characteristics of studies
Characteristics of included studies [ordered by study ID]
Ir a:
| Methods | double blind RCT | |
| Participants | Total: 120 | |
| Interventions | Grp 1: DHEA 200mg/dy | |
| Outcomes | Stated primary: SLEDAI, HRQoL, flares | |
| Notes | Funding: Genelabs + National Science Council | |
| Risk of bias | ||
| Bias | Authors' judgement | Support for judgement |
| Allocation concealment? | Low risk | A ‐ Adequate |
| Methods | Double blind, controlled trial (Probably randomised but does not specify) | |
| Participants | Total: 60 | |
| Interventions | Grp 1: DHEA 200mg/dy | |
| Outcomes | Stated primary: Wellbeing and fatigue (not reported) SLEDAI, Bone mineral density | |
| Notes | Funding: Dutch Arthritis Association | |
| Risk of bias | ||
| Bias | Authors' judgement | Support for judgement |
| Allocation concealment? | Unclear risk | B ‐ Unclear |
| Methods | Double blind RCT | |
| Participants | Total: 37* (4 dropped out and not included in analysis, 41 recruited) | |
| Interventions | Grp 1: DHEA 20‐30mg/dy | |
| Outcomes | Stated primary: HRQoL and behaviour (various tools) SLEDAI; SLICC; Bone mineral density; biological markers; | |
| Notes | Funding: various non industry sources | |
| Risk of bias | ||
| Bias | Authors' judgement | Support for judgement |
| Allocation concealment? | Low risk | A ‐ Adequate |
| Methods | double blind RCT | |
| Participants | Total: 191 | |
| Interventions | Grp 1: DHEA 100mg/dy | |
| Outcomes | Stated primary: 'Responder' SLEDAI (not reported), HRQoL (not reported), Fatigue, (not reported), SLICC (not reported) biological markers | |
| Notes | Funding: Genelabs Technologies Inc | |
| Risk of bias | ||
| Bias | Authors' judgement | Support for judgement |
| Allocation concealment? | Unclear risk | B ‐ Unclear |
| Methods | double blind RCT | |
| Participants | Total: 381 | |
| Interventions | Grp 1: DHEA 200mg/dy | |
| Outcomes | Stated primary: "responders" on composite score SLEDAI, HRQoL, flares, SLAM, fatigue (BMD in subgroup) | |
| Notes | Funding: Genelabs Technologies Inc | |
| Risk of bias | ||
| Bias | Authors' judgement | Support for judgement |
| Allocation concealment? | Low risk | A ‐ Adequate |
| Methods | double blind RCT | |
| Participants | Total: 28* (2 dropped out before study started and not included in analysis ‐ 30 recruited) | |
| Interventions | Grp 1: DHEA 100mg/dy | |
| Outcomes | Stated primary: SLEDAI, prednisolone dose, HRQoL, Physician global VAS, flares, other biochemical markers | |
| Notes | Funding: Northern California Arthritis Foundation | |
| Risk of bias | ||
| Bias | Authors' judgement | Support for judgement |
| Allocation concealment? | Unclear risk | B ‐ Unclear |
| Methods | double blind RCT | |
| Participants | Total: 19 | |
| Interventions | Grp 1: DHEA 200mg/dy | |
| Outcomes | Stated primary: stabilise major lupus manifestation SLEDAI, SLAM, HRQoL, renal proteinuria, biological SLEDAI, Prednisolone dose, Patient global VAS, Physician global VAS, Bone mineral density, other biochemical markers | |
| Notes | Funding: NIH grant | |
| Risk of bias | ||
| Bias | Authors' judgement | Support for judgement |
| Allocation concealment? | Unclear risk | B ‐ Unclear |
HRQoL ‐ health related quality of life including SF36 and Patient Visual analogue scores
Characteristics of excluded studies [ordered by study ID]
Ir a:
| Study | Reason for exclusion |
| Case series; no control group | |
| Outcome measure not included in this review | |
| Case series; no control group | |
| Case series; no control group | |
| Case series; no control group | |
| Case series; no control group | |
| Study less than 3 months duration; placebo controlled trial | |
| Case series; no control group |
Data and analyses
| Outcome or subgroup title | No. of studies | No. of participants | Statistical method | Effect size |
| 1 SLEDAI Show forest plot | 3 | Mean Difference (IV, Fixed, 95% CI) | Subtotals only | |
| Analysis 1.1  Comparison 1 Disease Activity, Outcome 1 SLEDAI. | ||||
| 1.1 Mild to moderate SLE | 2 | 148 | Mean Difference (IV, Fixed, 95% CI) | ‐0.61 [‐2.12, 0.89] |
| 1.2 Severe SLE | 1 | 19 | Mean Difference (IV, Fixed, 95% CI) | ‐6.4 [‐13.12, 0.32] |
| Outcome or subgroup title | No. of studies | No. of participants | Statistical method | Effect size |
| 1 Patient Global Show forest plot | 3 | Mean Difference (IV, Fixed, 95% CI) | Subtotals only | |
| Analysis 2.1  Comparison 2 Quality of Life, Outcome 1 Patient Global. | ||||
| 1.1 Mild to Moderate SLE | 2 | 148 | Mean Difference (IV, Fixed, 95% CI) | ‐11.46 [‐19.08, ‐3.84] |
| 1.2 Severe SLE | 1 | 19 | Mean Difference (IV, Fixed, 95% CI) | ‐0.20 [‐3.67, 3.27] |
| 2 Physician Global Show forest plot | 3 | Mean Difference (IV, Fixed, 95% CI) | Subtotals only | |
| Analysis 2.2  Comparison 2 Quality of Life, Outcome 2 Physician Global. | ||||
| 2.1 Mild to moderate SLE | 2 | 148 | Mean Difference (IV, Fixed, 95% CI) | ‐3.16 [‐8.12, 1.80] |
| 2.2 Severe SLE | 1 | 19 | Mean Difference (IV, Fixed, 95% CI) | ‐9.80 [‐40.36, 20.76] |
| Outcome or subgroup title | No. of studies | No. of participants | Statistical method | Effect size |
| 1 Acne Show forest plot | 5 | Risk Ratio (M‐H, Fixed, 95% CI) | Subtotals only | |
| Analysis 3.1  Comparison 3 Adverse events, Outcome 1 Acne. | ||||
| 1.1 Mild to moderate SLE | 4 | 657 | Risk Ratio (M‐H, Fixed, 95% CI) | 2.16 [1.65, 2.83] |
| 1.2 Severe SLE | 1 | 20 | Risk Ratio (M‐H, Fixed, 95% CI) | 2.0 [0.68, 5.85] |
| 2 Hirsutism Show forest plot | 5 | Risk Ratio (M‐H, Fixed, 95% CI) | Totals not selected | |
| Analysis 3.2  Comparison 3 Adverse events, Outcome 2 Hirsutism. | ||||
| 2.1 Mild to moderate SLE | 4 | Risk Ratio (M‐H, Fixed, 95% CI) | 0.0 [0.0, 0.0] | |
| 2.2 Severe SLE | 1 | Risk Ratio (M‐H, Fixed, 95% CI) | 0.0 [0.0, 0.0] | |
| 3 Menstrual change Show forest plot | 4 | Risk Ratio (M‐H, Fixed, 95% CI) | Subtotals only | |
| Analysis 3.3  Comparison 3 Adverse events, Outcome 3 Menstrual change. | ||||
| 3.1 Mild to moderate SLE | 3 | 276 | Risk Ratio (M‐H, Fixed, 95% CI) | 1.2 [0.38, 3.77] |
| 3.2 Severe SLE | 1 | 20 | Risk Ratio (M‐H, Fixed, 95% CI) | 2.67 [0.98, 7.22] |

Comparison 1 Disease Activity, Outcome 1 SLEDAI.

Comparison 2 Quality of Life, Outcome 1 Patient Global.

Comparison 2 Quality of Life, Outcome 2 Physician Global.
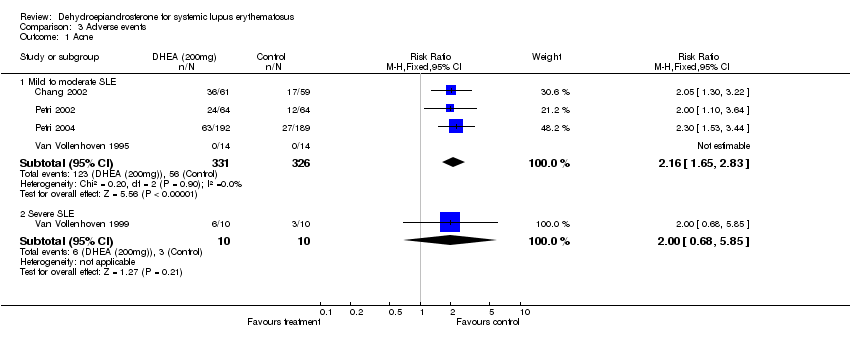
Comparison 3 Adverse events, Outcome 1 Acne.

Comparison 3 Adverse events, Outcome 2 Hirsutism.

Comparison 3 Adverse events, Outcome 3 Menstrual change.
| Study id | Assignment | Alloc concealment | Baseline | ITT | Dropouts | Outcome Blind |
| Chang 2002 | Yes | Probably Adequate | No detail presented | Yes | Yes (7/120) | Yes |
| Hartkamp 2004 | Unclear | Adequate | No (postmenopausal status higher in active arm; oestrogen use lower in active arm) | No (2 declined final dexa scan excluded | Yes (2/60) | Yes |
| Nordmark 2005 | Unclear | Unclear | Similar (DHEA treatment group had slightly more active disease | Unclear | Yes (3/41) | Yes |
| Petri 2002 | Unclear | Probably Adequate | Yes | Yes | No (49/191) | Yes |
| Petri 2004 | yes | Adequate | yes (although Anti dsDNA higher in active treatment group) | Yes | Yes (115/381) | Yes |
| Van Vollenhoven 1995 | Unclear | Unclear | Yes | No | Yes (2/28) | Yes |
| Van Vollenhoven 1999 | Yes | Probably Adequate | No Males in placebo group only, organs effected differed.Some differences in baseline activity scores with DHEA group tending to be higher (none statistically significant) | No | Yes (2/21) | Yes |
| KEY | Assignment random | Allocation concealed | Baseline characteristics similar | Intention to treat analysis | drop outs described | Outcomes blinded |
| Study | no. participants | placebo (SEM) | DHEA (SEM) | change vs placebo | ||
| Mild/Moderate | ||||||
| Chang 2002* | Placebo: 59; DHEA 61 | ‐1.4 (4.6) | ‐1.2 (5.4) | p=0.7 | ||
| Hartkamp 2004 | Placebo: 30; DHEA 30 | +0.3 (na) | +0.43 (na) | p=0.79 | ||
| Nordmark 2005 | Placebo: 17 DHEA 20 | reported as "no significant change" | ||||
| Petri 2002 | Placebo 64; DHEA 100 63; DHEA 200 64 | measured but not reported for all participants | ||||
| Petri 2004 | Placebo: 192 (146 reported) DHEA 189 (147 reported) | 17.8% deteriorated | 9.5% deteriorated | p=0.04 not reported for all participants ‐ only those with "active disease" | ||
| van Vollenhoven 1995* | Placebo: 14 DHEA 14 | +0.79 (0.75) | ‐1.71 (1.18) | p=0.09 | ||
| *Summarised in Meta‐analysis | ||||||
| Severe | ||||||
| van Vollenhoven 1999* | Placebo: 10 DHEA 9 | ‐3.9 (1.4) | ‐10.3 (3.1) | p=0.07 | ||
| *Summarised in Meta‐analysis |
| Study | No. participants | placebo (SEM) | DHEA (SEM) | change vs. placebo | |||
| Mild/Moderate Disease at baseline | |||||||
| Chang 2002* | Placebo: 59; DHEA 61 | ‐2.0 (0.49) | ‐2.6 (0.44) | p=0.355 | |||
| Petri 2004 | Placebo: 192 (146 reported) DHEA 189 (147 reported) | 10.3% deteriorated | 6.8% deteriorated | p= 0.29 Not reported for all participants ‐ only those with "active disease" | |||
| Severe disease at baseline | |||||||
| van Vollenhoven 1999 | Placebo: 10 DHEA: 9 | ‐2.4 (2.0) | ‐5.4 (2.34) | p=0.41 |
| study | No. Participants | placebo (SEM) | DHEA (SEM) | change vs. placebo | ||
| Mild to Moderate disease | ||||||
| Chang 2002 | Placebo 59: DHEA 61 | +5.4 (2.56) | ‐5.5 (3.46) | p=0.005 (adjusted for treat centre and treatment, no unadjusted presented) [95% CI from crude analysis ‐76.1 to 54.3] | ||
| Hartkamp 2004 | Placebo 30: DHEA 30 | measured but not reported | ||||
| Nordmark 2005 | Placebo 17: DHEA 20 | not measured | ||||
| Petri 2002 | Placebo 64: DHEA 100mg 62: DHEA 200mg 64 | measured but not reported | ||||
| Petri 2004 | Placebo 192 (reported 146): DHEA 189 (reported 147) | 22.6% deteriorated | 10.9% deteriorated | p=0.007 Not reported for all participants, only those with "active disease" | ||
| van Vollenhoven 1995 | Placebo 14: DHEA 14 | +2.4 (7.0) | ‐11.5 (5.7) | unadjusted 0.138, P vs placebo adjusted 0.022 | ||
| *Summarised in Meta‐analysis | ||||||
| Severe Disease | ||||||
| van Vollenhoven 1999 | Placebo 10: DHEA 9 | ‐23.5 (2.4) | ‐23.7 (4.8) | p= 0.53 |
| Adverse events | Chang 2002 | Hartkamp 2004 | Petri 2002 | Petri 2004 | van Vollenhoven 1995 | van Vollenhoven 1999 | Nordmark 1002 |
| No. Participants | DHEA:61; Placebo:59 | DHEA:30; Placebo:30 | DHEA 100mg:63; DHEA 200mg: 64; Placebo:64 | DHEA:192; Placebo: 189 | DHEA:14; Placebo:14 | DHEA:10; Placebo:10 | DHEA: 20; Placebo:17 |
| Serious AEs | DHEA: 7 (11.5); Placebo: 18 (30.5) | DHEA: 33 (17); placebo: 27 (14) | DHEA: 1; placebo: 1 | DHEA: 1; placebo: 2 | |||
| Withdrawal due to AE | DHEA 100: 4 (6); DHEA 200: 6 (9); placebo:3 (5) | DHEA: 11 (5.7); placebo:27 (14.3) | DHEA: 0; placebo: 0 | ||||
| Acne | DHEA: 59%; placebo: 29% | DHEA 100: 26 (41); DHEA 200: 26 (41); placebo:12 (19) | DHEA: 63 (33.3); placebo: 27 (14.1) | DHEA:8 (57); placebo: 1 (7) | DHEA: 6; placebo:3 | ||
| Hirsutism | DHEA 100: 7 (11); DHEA 200:5 (7.8); placebo: 3 (4.7) | DHEA: 31 (16.4); placebo: 3 (1.6) | DHEA: 2 (14); placebo:4 (28) | DHEA:4; placebo:2 | |||
| Weight Gai | DHEA: 2(14); placebo:1 (7) | ||||||
| Rash | DHEA 100: 3 (4.8); DHEA 200: 7 (11); placebo: 3 (4.7) | DHEA: 62 (32.3); placebo: 75 (39.7) | DHEA :0 ; placebo: 2 (14) | ||||
| Menarrhagia | DHEA 100:5 (7.9); DHEA 200: 5 (7.8); placebo: 3 (4.7) | DHEA: 1 (7); placebo: 2 (14) | DHEA: 8; placebo :3 | ||||
| Headache | DHEA 100: 3 (4.8); DHEA 200: 4 (6.3); placebo:1 (1.6) | DHEA: 56 (29.2); placebo:42 (22.2) | DHEA:4 ; placebo: 4 | ||||
| Abdominal Pain | DHEA 100: 3 (4.8); DHEA 200: 5 (7.8); placebo:0 | DHEA: 30 (25.6); placebo: 27 (14.3) | |||||
| Chest Pain | DHEA: 22 (10.4); placebo: 14 (7.4) | ||||||
| Arthralgia | DHEA:71 (37.0); placebo: 68 (36) | ||||||
| Asthenia | DHEA 100: 4 (6.3); DHEA 200: 3 (4.7); placebo:3 (4.7) | DHEA: 51 (26.6); Placebo45 (23.8) | |||||
| Myalgia | DHEA: 69 (35.9); placebo: 42 (22.2) | ||||||
| flu like symptoms | DHEA: 42 (21.9); placebo: 39 (20.6) | ||||||
| Stomatitis | DHEA: 44 (22.9); placebo: 28 (14.8) | ||||||
| Mood Change | DHEA: 30 (15.6); placebo:28 (14.8) | DHEA; 1 (7); placebo: 0 | DHEA:1; placebo:3 | ||||
| Alopecia | DHEA: 39 (20.3); placebo: 28 (14.8) | DHEA: 0; placebo:1 | |||||
| Fever | DHEA: 28 (14.6); placebo: 22 (11.6) | ||||||
| Perihperal vascular disease | DHEA: 20 (10.4); placebo: 19 (10.1) | ||||||
| Sinusitis | DHEA: 21 (10.4); placebo: 17 (9) | ||||||
| Insomnia | DHEA 100: 4 (6.3); DHEA 200: 3 (4.7); placebo:2 (3.1) | DHEA: 2; placebo:1 |
| Outcome | # patients(# trials) | Control baseline m | Wt absolute change | Relative % change | NNT (B) or NNT (H) | Statistical Sig | Quality of Evidence |
| SLEDAI (mild/moderate) (0‐105) | 148(2) | 6.55* | 0.6% reduction (0.6 points less on a scale of 0‐105) | 9.3% improvement | NA | not statistically significant | Gold |
| 95% confidence interval | ‐2.12 to 0.89 | ||||||
| SLEDAI (severe) (0‐105) | 19(1) | 9.4 | 6% reduction (6.4 points less on a scale of 0‐105) | 68% improvement | 3 | borderline statistically significant | Silver |
| 95% confidence interval | ‐13.12 to 0.32 | ||||||
| HRQoL (mild/moderate) Patient Global (0‐100) | 148 (2) | 28.5 | 11.5% reduction (11.5 point reduction on a scale of 0‐100) | 40.4% improvement | 5 | statistically significant | Gold |
| 95% confidence interval | ‐19.1 to ‐3.8 | ||||||
| HRQoL (severe) (0‐100) | 19 (1) | 52.6 | 0.2% reduction (0.2 point reduction on a scale of 0‐100) | 0.4% improvement | NA | not statistically significant | Silver |
| 95% confidence interval | ‐3.7 to 3.3 | ||||||
| Legend: | SLEDAI ‐ SLE disease activity index | NA=not applicable |
| Outcome | # patients (#trials) | Event rate (placebo) | Event rate (treated) | Relative risk | Absolute risk dif | NNH |
| Adverse Events (mild/moderate): Acne | 657 (4) | 56/326 (17.2%) | 123/331 (37.2%) | 2.2 | 0.2 | 5 |
| 95% confidence interval | 1.65 to 2.83 | 0.13 to 0.26 | ||||
| Adverse Events (mild/moderate): Menstrual Change | 276 (3) | 5/137 (3.6%) | 6/139 (4.3%) | 1.2 | 0.1 | not statistically significant |
| 95% confidence interval | 0.38 to 3.77 | ‐0.04 to 0.05 | ||||
| Outcome or subgroup title | No. of studies | No. of participants | Statistical method | Effect size |
| 1 SLEDAI Show forest plot | 3 | Mean Difference (IV, Fixed, 95% CI) | Subtotals only | |
| 1.1 Mild to moderate SLE | 2 | 148 | Mean Difference (IV, Fixed, 95% CI) | ‐0.61 [‐2.12, 0.89] |
| 1.2 Severe SLE | 1 | 19 | Mean Difference (IV, Fixed, 95% CI) | ‐6.4 [‐13.12, 0.32] |
| Outcome or subgroup title | No. of studies | No. of participants | Statistical method | Effect size |
| 1 Patient Global Show forest plot | 3 | Mean Difference (IV, Fixed, 95% CI) | Subtotals only | |
| 1.1 Mild to Moderate SLE | 2 | 148 | Mean Difference (IV, Fixed, 95% CI) | ‐11.46 [‐19.08, ‐3.84] |
| 1.2 Severe SLE | 1 | 19 | Mean Difference (IV, Fixed, 95% CI) | ‐0.20 [‐3.67, 3.27] |
| 2 Physician Global Show forest plot | 3 | Mean Difference (IV, Fixed, 95% CI) | Subtotals only | |
| 2.1 Mild to moderate SLE | 2 | 148 | Mean Difference (IV, Fixed, 95% CI) | ‐3.16 [‐8.12, 1.80] |
| 2.2 Severe SLE | 1 | 19 | Mean Difference (IV, Fixed, 95% CI) | ‐9.80 [‐40.36, 20.76] |
| Outcome or subgroup title | No. of studies | No. of participants | Statistical method | Effect size |
| 1 Acne Show forest plot | 5 | Risk Ratio (M‐H, Fixed, 95% CI) | Subtotals only | |
| 1.1 Mild to moderate SLE | 4 | 657 | Risk Ratio (M‐H, Fixed, 95% CI) | 2.16 [1.65, 2.83] |
| 1.2 Severe SLE | 1 | 20 | Risk Ratio (M‐H, Fixed, 95% CI) | 2.0 [0.68, 5.85] |
| 2 Hirsutism Show forest plot | 5 | Risk Ratio (M‐H, Fixed, 95% CI) | Totals not selected | |
| 2.1 Mild to moderate SLE | 4 | Risk Ratio (M‐H, Fixed, 95% CI) | 0.0 [0.0, 0.0] | |
| 2.2 Severe SLE | 1 | Risk Ratio (M‐H, Fixed, 95% CI) | 0.0 [0.0, 0.0] | |
| 3 Menstrual change Show forest plot | 4 | Risk Ratio (M‐H, Fixed, 95% CI) | Subtotals only | |
| 3.1 Mild to moderate SLE | 3 | 276 | Risk Ratio (M‐H, Fixed, 95% CI) | 1.2 [0.38, 3.77] |
| 3.2 Severe SLE | 1 | 20 | Risk Ratio (M‐H, Fixed, 95% CI) | 2.67 [0.98, 7.22] |