Intervenciones para la leishmaniasis cutánea del viejo mundo
Resumen
Antecedentes
La leishmaniasis cutánea, causada por una infección parasitaria, se considera una de las más graves enfermedades de la piel en muchos países de ingresos bajos y medios. La leishmaniasis cutánea del viejo mundo (LCVM) es causada por especies halladas en África, Asia, el Medio Oriente, el Mediterráneo y la India. Los tratamientos prescritos con mayor frecuencia son los antimoniales, aunque se han usado otros fármacos con éxito variable. Dado que la LCVM tiende a curarse espontáneamente, es necesario justificar la administración de tratamientos sistémicos y tópicos. Ésta es una actualización de una revisión Cochrane publicada por primera vez en 2008.
Objetivos
Evaluar los efectos de las intervenciones terapéuticas para la forma localizada de leishmaniasis cutánea del viejo mundo.
Métodos de búsqueda
Se actualizaron las búsquedas en las siguientes bases de datos hasta noviembre de 2016: Registro Especializado Cochrane de Piel (Cochrane Skin Specialised Register), CENTRAL, MEDLINE, Embase y LILACS. También se realizaron búsquedas en cinco registros de ensayos y se verificaron las listas de referencias de los estudios incluidos para obtener más referencias de ensayos controlados aleatorios (ECA) relevantes. Se escribió a los directores de programas nacionales, coordinadores generales, directores, médicos, responsables regionales de EMRO (OMS) de los países endémicos, compañías farmacéuticas y autores de los trabajos relevantes para solicitarles mayor información acerca de ensayos no publicados y en curso. Se llevó a cabo otra búsqueda separada de los efectos adversos de las intervenciones para la leishmaniasis cutánea del viejo mundo en septiembre de 2015 mediante MEDLINE.
Criterios de selección
Ensayos controlados aleatorios de tratamientos únicos o combinaciones en los pacientes inmunocompetentes con LCVM confirmada por frotis, histología, cultivo o reacción en cadena de la polimerasa. Los comparadores fueron: ningún tratamiento, placebo/vehículo u otro compuesto activo.
Obtención y análisis de los datos
Dos autores de la revisión evaluaron de forma independiente los ensayos para la inclusión, evaluaron el riesgo de sesgo y extrajeron los datos. Sólo se resumieron los datos cuando se pudieron identificar al menos dos estudios que investigaron tratamientos similares e informaron datos que podían agruparse. También se registraron los datos acerca de los efectos adversos de la búsqueda correspondiente.
Resultados principales
Se incluyeron 89 estudios (40 eran nuevos para esta actualización) en 10 583 pacientes con LCVM. Los estudios incluidos se realizaron principalmente en el Lejano o Medio Oriente en hospitales regionales, consultorios de salud locales y centros de investigación en enfermedades de la piel. Un 41,5% de los participantes eran mujeres (intervalo: 23% a 80%). La media de edad general de los participantes fue de 25 años (intervalo entre 12 y 56 años). La mayoría de los estudios duraron entre dos y seis meses, y el más largo duró dos años; la duración media fue de cuatro meses. La mayoría de los estudios presentaron un riesgo poco claro o alto para la mayoría de los dominios de sesgo. En casi un 40% de los estudios se observó una falta de cegamiento y sesgo de informe. Dos ensayos presentaron un bajo riesgo de sesgo para todos los dominios. Los ensayos informaron las especies causales de manera deficiente.
Aquí se proporcionan los resultados de las dos comparaciones principales identificadas: itraconazol (200 mg durante seis a ocho semanas) versus placebo; y pomada de paromicina (15% más 10% de urea, dos veces al día durante 14 días) versus un vehículo.
En la comparación de itraconazol oral versus placebo, a los 2,5 meses de seguimiento, 85/125 participantes en el grupo de itraconazol lograron la curación completa en comparación con 54/119 en el grupo de placebo (RR 3,70; IC del 95%: 0,35 a 38,99; tres estudios; 244 participantes). En un estudio, la curación microbiológica o histopatológica de las lesiones cutáneas sólo se produjo en el grupo de itraconazol después de un seguimiento medio de 2,5 meses (RR 17,00; IC del 95%: 0,47 a 612,21; 20 participantes). Sin embargo, aunque los análisis favorecen el itraconazol oral para estos resultados, no hay confianza en los resultados debido a la evidencia de confiabilidad muy baja. Más efectos secundarios de dolor abdominal leve y náuseas (RR 2,36; IC del 95%: 0,74 a 7,47; tres estudios; 204 participantes) y función hepática anormal leve (RR 3,08; IC del 95%: 0,53 a 17,98; tres estudios; 84 participantes) ocurrieron en el grupo con itraconazol (así como informes de cefaleas y mareos), en comparación con el grupo con placebo, pero de nuevo se calificó la certeza de la evidencia como muy baja, por lo que no hay seguridad acerca de los resultados.
Cuando se comparó la paromomicina con el vehículo, no hubo diferencias en el número de participantes que lograron la curación completa (RR de 1,00; IC del 95%: 0,86; 1,17; 383 participantes; dos estudios) y la curación microbiológica o histopatológica de las lesiones cutáneas después de un seguimiento medio de 2,5 meses (RR 1,03; IC del 95%: 0,88 a 1,20; 383 participantes, dos estudios), pero el grupo de paromicina tuvo más reacciones cutáneas/locales (como inflamación, vesiculación, dolor, enrojecimiento o prúrito) (RR 1,42; IC del 95%: 0,67 a 3,01; cuatro estudios; 713 participantes). Para todos estos resultados, la confiabilidad de la evidencia fue muy baja, por lo que no hay seguridad acerca de estos resultados.
Los autores de ensayos no informaron el porcentaje de lesiones curadas después de finalizado el tratamiento ni la velocidad de curación para ninguna de estas comparaciones clave.
Conclusiones de los autores
Hubo evidencia de muy baja confiabilidad para apoyar la efectividad del itraconazol y la pomada de paromomicina para la LCVM en cuanto a la curación (es decir, curación microbiológica o histopatológica y porcentaje de participantes completamente curados). Las dos intervenciones provocaron más efectos adversos (leves) que las comparaciones, pero no puede establecerse ninguna conclusión con respecto a la seguridad debido a la confiabilidad muy baja de la evidencia para este resultado.
Se disminuyó la valoración de los resultados clave de estas dos comparaciones por el alto riesgo de sesgo, la incongruencia entre los resultados y la imprecisión. Se necesitan estudios internacionales amplios y bien diseñados que evalúen los efectos a largo plazo de los tratamientos actuales y que permitan una conclusión fiable acerca de los tratamientos. Los ensayos futuros deben especificar las especies de leishmaniasis; faltan ensayos sobre los tipos causados por Leishmania infantum, L aethiopica y L donovani. Sería también útil la investigación sobre los efectos del tratamiento de pacientes en edad fértil, niños, pacientes con enfermedades concomitantes y los inmunocomprometidos.
Fue difícil evaluar la eficacia general de cualquiera de los numerosos tratamientos debido a la variabilidad en los regímenes terapéuticos examinados, y porque los ECA evaluaron diferentes especies de Leishmania y se realizaron en diferentes zonas geográficas. Algunos resultados que se buscaron pero no se hallaron fueron: el grado de deterioro funcional y estético, el cambio en la capacidad para detectar la Leishmania, la calidad de vida y la aparición de resistencia. Sólo había datos limitados sobre la prevención de la cicatrización.
PICO
Resumen en términos sencillos
Tratamientos para la leishmaniasis cutánea del viejo mundo
Antecedentes
La leishmaniasis cutánea del viejo mundo (LCVM) es una infección causada por el parásito Leishmania , que se transmite a los seres humanos por la picadura de flebótomos. Es una enfermedad grave de la piel, asociada con diversos signos, síntomas y grados de severidad. Se quería evaluar la competencia y la seguridad de todos los tratamientos disponibles para la LCVM.
Pregunta de la revisión
Se evaluaron los participantes con una respuesta inmunitaria normal y LCVM diagnosticada por métodos de laboratorio. Los tratamientos debían administrarse solos o en combinación con otro tratamiento y se compararon con ningún tratamiento, un placebo (una sustancia inactiva) solo u otro tratamiento activo. Algunos de los resultados principales de interés fueron: el porcentaje de heridas cicatrizadas después de finalizado el tratamiento, el número de participantes con curación completa después de finalizado el tratamiento, la velocidad de curación, los efectos secundarios del tratamiento y la eliminación de parásitos (infección).
Características de los estudios
Se revisaron 89 ensayos clínicos, que incorporaron un total de 10 583 pacientes con LCVM. Se incluyeron participantes de ambos sexos y de todas las edades (media de 24,5 años); la mayoría de los participantes eran mayores de 18 años de edad. La mayoría de los estudios se realizaron en centros únicos de diferentes países, principalmente en el Lejano o Medio Oriente y durante dos a seis meses. Se incluyeron diversos tratamientos, como los antimoniales, los antimicóticos y los antibióticos, que fueron administrados directamente sobre la piel o en una herida, tomados por vía oral o mediante aplicación física (p.ej., tratamiento láser, termoterapia, etc.). La mayoría de los estudios incluidos evaluaron la LCVM causada por dos especies de parásitos conocidos como Leishmania major (L. major) y Leishmania tropica (L. tropica).
Resultados clave
La evidencia está actualizada hasta noviembre 2016.
Dos de los tratamientos más importantes evaluados en esta revisión fueron el itraconazol, un antimicótico por vía oral, y la paromomicina, un antibiótico en forma de pomada. Las comparaciones en los ensayos fueron con un comprimido de placebo o una crema inactiva (vehículo).
Los participantes recibieron 200 mg de itraconazol durante seis a ocho semanas o pomada de paromomicina a una concentración de un 15% más 10% de urea, dos veces al día durante 14 días.
Cuando se evaluaban en promedio 2,5 meses después del tratamiento, más participantes se habían curado por completo y no presentaban infección parasitaria con itraconazol que el placebo, pero también presentaron más efectos secundarios (gastralgia leve, náuseas y función hepática anormal, así como cefaleas y mareos).
En la comparación de la pomada de paromomicina con un placebo, no hubo diferencias en el número de participantes completamente curados o sin parásitos cuando se los evaluó en promedio 2,5 meses después del tratamiento, pero los pacientes del grupo de tratamiento con paromomicina tuvieron más reacciones de piel, como inflamación, formación de ampollas, dolor, eritema o prurito.
Sin embargo, como la confiabilidad de la evidencia de estos resultados para estas comparaciones particulares fue muy baja, no hay seguridad acerca de la exactitud de estos resultados.
Ninguna de las comparaciones de tratamientos clave evaluó el porcentaje de heridas curadas después de finalizado el tratamiento y la velocidad de curación (tiempo hasta la curación).
Calidad de la evidencia
La confiabilidad general de la evidencia para los diferentes resultados en las dos comparaciones principales fue muy baja. Las principales razones fueron que los estudios no eran cegados o tenían un tamaño de la muestra pequeño, lo que disminuye la precisión de los resultados. Parte de la evidencia sólo se centró en jóvenes, y los resultados variaron significativamente entre cada estudio.
Se necesita más investigación para completar las siguientes brechas de investigación: 1) ensayos de LCVM causada por otros tipos de infección como L. infantum, L. aethiopica, o L. donovani; 2) que involucren subgrupos específicos de pacientes como los niños; 3) que evalúen la efectividad y la seguridad de diferentes fármacos antileishmaniosis en comparación con placebo en las formas de autocuración de la leishmaniosis o con el tratamiento antimonial tradicional de primera elección en forma complicada (definida como más de cuatro lesiones de más de 4 cm de tamaño, localizadas cerca de una abertura o de pequeñas articulaciones, para las cuales el tratamiento previo ha fallado); y 4) que evalúen áreas como la cicatrización de heridas y los resultados informados por el paciente, como la calidad de vida. Además, pocos estudios evaluaron temas relevantes como la farmacorresistencia. Se requiere colaboración internacional para mejorar la calidad y la estandarización de los ensayos futuros y así desarrollar un mejor enfoque basado en la evidencia.
Authors' conclusions
Summary of findings
| Itraconazole (200 mg for 6‐8 weeks) versus placebo for Old World cutaneous leishmaniasis | ||||||
| Patient or population: patients with Old World cutaneous leishmaniasis | ||||||
| Outcomes | Illustrative comparative risks* (95% CI) | Relative effect | No of participants | Certainty of the evidence | Comments | |
| Assumed risk | Corresponding risk | |||||
| Placebo | Itraconazole (200 mg for 6‐8 weeks) | |||||
| Percentage of lesions cured after the end of treatment | Not measured in this comparison | |||||
| Percentage of participants with complete cure | Study population | RR 3.70 | 244 | ⊕⊝⊝⊝ | — | |
| 454 per 1000 | 1000 per 1000 | |||||
| Moderate | ||||||
| 100 per 1000 | 370 per 1000 | |||||
| Adverse effects Mild abdominal pain and nausea Adverse effects Mild abnormal liver function | 40 per 1000 0 per 1000 | 95 per 1000 0 per 1000 | RR 2.36 RR 3.08 | 204 84 | ⊕⊝⊝⊝ ⊕⊝⊝⊝ | — |
| Speed of healing (time taken to be 'cured') | Neither of the studies reported speed of healing (time taken to be 'cured') in this comparison. | |||||
| Microbiological or histopathological cure of skin lesions | Not estimable | Not estimable | RR 17.00 | 20 | ⊕⊝⊝⊝ | There were zero events in the placebo group |
| *The basis for the assumed risk (e.g. the median control group risk across studies) is provided in footnotes. The corresponding risk (and its 95% confidence interval) is based on the assumed risk in the comparison group and the relative effect of the intervention (and its 95% CI). | ||||||
| GRADE Working Group grades of evidence | ||||||
| aDowngraded by 4 levels due to: risk of bias (2 RCTs have many uncertain items), inconsistency (there is considerable heterogeneity ‐ I² = 73%), and imprecision (2 levels due to wide 95% confidence intervals, crossing the line of no effect). | ||||||
| Paromomycin ointment versus matched vehicle for Old World cutaneous leishmaniasis | |||||
| Patient or population: patients with Old World cutaneous leishmaniasis | |||||
| Outcomes | Illustrative comparative risks* (95% CI) | Relative effect | No of participants | Certainty of the evidence | |
| Assumed risk | Corresponding risk | ||||
| Vehicle | Paromomycin ointment (15% + 10% urea) twice daily for 14 days | ||||
| Percentage of lesions cured after the end of treatment | Not measured in this comparison | ||||
| Percentage of participants with complete cure | Study population | RR 1.00 | 383 | ⊕⊝⊝⊝ | |
| 623 per 1000 | 623 per 1000 | ||||
| Moderate | |||||
| 619 per 1000 | 619 per 1000 | ||||
| Adverse effects Skin/local reactions | Study population | RR 1.42 | 713 | ⊕⊝⊝⊝ | |
| 96 per 1000 | 136 per 1000 | ||||
| Moderate | |||||
| 90 per 1000 | 128 per 1000 | ||||
| Speed of healing (time taken to be 'cured') | Not measured in this comparison | ||||
| Microbiological or histopathological cure of skin lesions | Study population | RR 1.03 | 383 | ⊕⊝⊝⊝ | |
| 859 per 1000 | 884 per 1000 | ||||
| Moderate | |||||
| 792 per 1000 | 816 per 1000 | ||||
| *The basis for the assumed risk (e.g. the median control group risk across studies) is provided in footnotes. The corresponding risk (and its 95% confidence interval) is based on the assumed risk in the comparison group and the relative effect of the intervention (and its 95% CI). | |||||
| GRADE Working Group grades of evidence | |||||
| aDowngraded by 4 levels due to risk of bias (1 RCT has many uncertain risks), indirectness (2 levels because one of the studies focused on young people), and imprecision (the confidence interval around the estimate risk ratio ranges from a 14% reduction to a 17% increase in the risk ratio for healing with paromomycin). | |||||
Background
Please see Table 1 for a glossary of terms used.
| Term | Definition |
| Antimonials | Pharmaceutical agents containing antimony. Antimony‐containing compounds (meglumine antimoniate and sodium stibogluconate) are the principal medications used to treat leishmaniases, an infection caused by a protozoan parasite. |
| Arthralgia | Pain in the joints. The causes of arthralgia are varied and range, from a joints perspective, from degenerative and destructive processes such as osteoarthritis and sports injuries to inflammation of tissues surrounding the joints, such as bursitis. |
| Cardiac arrhythmia | An arrhythmia is an abnormal heart rhythm. Many types of arrhythmia have no symptoms. When symptoms are present these may include palpitations or feeling a pause between heartbeats. More seriously there may be lightheadedness, passing out, shortness of breath, or chest pain. |
| Cutaneous necrosis | The death of living tissues in response to disease or injury. |
| Cytolysis | The degeneration or dissolution of cell caused by the disruption of cell membrane. |
| Exudate | A fluid with a high content of protein and cellular debris that has escaped from blood vessels and has been deposited in tissues or on tissue surfaces, usually as a result of inflammation. |
| Human monocytes | Monocytes are the biggest type of white blood cell in the immune system. Originally formed in the bone marrow, they are released into our blood and migrate into the connective tissue where they differentiate into macrophages. When certain germs enter the body, they quickly rush to the site of attack. |
| Hypotension | A systolic blood pressure reading (the top number) of 90 millimetres of mercury (mmHg) or less a diastolic blood pressure reading (the bottom number) of 60 mmHg or less is generally considered low blood pressure. The causes of low blood pressure can range from dehydration to serious medical or surgical disorders. |
| Immune response modifier | Any of a broad family of biomolecules that up‐ or down‐regulate, or restore immune responsiveness, which are generated after T cells recognise an antigen present on the surface of a self‐antigen‐presenting cell, which, once activated, produce multiple cytokines. |
| Immunolabeling | A biochemical process that enables the detection and localisation of an antigen to a particular site within a cell, tissue, or organ. Antigens are organic molecules, usually proteins, capable of binding to an antibody. These antigens can be visualised using a combination of antigen‐specific antibodies as well as a means of detection, called a tag, that is covalently linked to the antibody. If the immunolabeling process is meant to reveal information about a cell or its substructures, the process is called immunocytochemistry. Immunolabeling of larger structures is called immunohistochemistry. |
| In vitro | Biological processes or reactions made to occur outside the living organism in an artificial environment, such as a culture medium. |
| Intralesional meglumine antimoniate | Meglumine antimoniate (or Glucantime) is a medicine used for treating leishmaniasis. It belongs to a group of compounds known as the pentavalent antimonials. |
| Lymphadenopathies | Lymph nodes that have an abnormal in size, number or consistency; often used as a synonym for swollen or enlarged lymph nodes. Common causes of lymphadenopathy are infection, autoimmune disease, or malignancy. |
| Lymphatic channels | The vessels that transport lymph throughout the body. Lymph is a clear fluid that contains cells important for forming antibodies that fight infection. |
| Lymphokine | Any of various soluble protein mediators released by sensitised lymphocytes on contact with antigen, and believed to play a role in macrophage activation, lymphocyte transformation, and cell‐mediated immunity. They regulate immune responses through differentiation, amplification, and inhibition of cell functions. Lymphokines may also have a cytotoxic effector function. Used as biologic response modifiers in the treatment of cancer. |
| Macrophages | White blood cells (activated monocytes) that protect the body against infection and foreign substances by breaking them down into antigenic peptides recognised by circulating T cells. |
| Miltefosine | An oral alkyl phosphocholine analogue used to treat cutaneous and visceral leishmaniasis. Interacts with lipids and sterols in the Leishmania membrane resulting in inhibition of mitochondria and apoptotic cell death. |
| Mucous membranes | The mucous membranes (or mucosae or mucosas; singular mucosa) are linings of mostly endodermal origin, covered in epithelium, which are involved in absorption and secretion. They line cavities that are exposed to the external environment and internal organs. |
| Myalgia | Myalgia, or muscle pain, is a symptom of many diseases and disorders. The most common causes are the overuse or over‐stretching of a muscle or group of muscles. Myalgia without a traumatic history is often due to viral infections. Long‐term myalgias may be indicative of a metabolic myopathy, some nutritional deficiencies or chronic fatigue syndrome. |
| Nodular lymphangitis | Nodular lymphangitis is a distinct clinical entity, separate from lymphangitis. This disorder is characterised by inflammatory nodules along the lymphatics draining a primary skin infection |
| Papule | A solid, rounded growth that is elevated from the skin, usually inflammatory but nonsuppurative. A papule is usually less than 1 cm across. |
| Parenteral | Administration of a medicinal or therapeutic substance, other than through the gastrointestinal or respiratory tracts, e.g. by intravenous, intramuscular or subcuticular injection. |
| Pentamidine | Pentamidine (e.g. isethionate) is an antiprotozoal and antifungal agent of the class of aromatic diamidines, administered intravenously or intramuscularly in treatment of early African trypanosomiasis and leishmaniasis, and intravenously, intramuscularly, or by oral inhalation in treatment and prophylaxis of Pneumocystis carinii pneumonia. |
| Pentavalent antimony | Pentavalent antimonials are a group of compounds used for the treatment of leishmaniasis. The first pentavalent antimonial used was urea stibamine: first introduced in the 1930s, it fell out of favour in the 1950s due to higher toxicity compared to sodium stibogluconate. The compounds currently available for clinical use are: sodium stibogluconate (Pentostam; manufactured by GlaxoSmithKline; available in the USA and UK), which is administered by slow intravenous injection, intralesional or intramuscular injection, and meglumine antimoniate (Glucantime; manufactured by Aventis; available in Brazil, France and Italy), which is administered by intramuscular, intralesional, or intravenous injection. |
| Promastigotes | Term now generally used instead of 'leptomonad' or 'leptomonad stage' to avoid confusion with the flagellate genus Leptomonas. It denotes the flagellate stage of a trypanosomatid protozoan in which the flagellum arises from a kinetoplast in front of the nucleus and emerges from the anterior end of the organism; usually an extracellular phase, as in the insect intermediate host (or in culture) of Leishmania parasites. |
| Protozoan | Any of a group of single‐celled, usually microscopic, eukaryotic organisms, such as amoebas, ciliates, flagellates, and sporozoans. |
| ThermoMed device | The ThermoMed is a battery‐operated device that delivers precisely controlled localised current field radiofrequency heat to selectively destroy certain diseased tissue and is recommended by the World Health Organization as an alternative therapy for cutaneus leishmaniasis. |
| Thermotherapy | The treatment of disease by the application of heat. Thermotherapy may be administered as dry heat with heat lamps, diathermy machines, electric pads, or hot water bottles or as moist heat with warm compresses or immersion in warm water. Warm soaks or compresses may be used to treat local infections, relax muscles and relieve pain in patients with motor problems, and promote circulation in peripheral vascular disorders such as thrombophlebitis. |
Description of the condition
Definition
Desjeux 1996 describes leishmaniasis as "a group of diseases caused by infection with protozoan parasites of the genus Leishmania", transmitted by bites from sandflies infected with the parasite. Leishmaniasis has two main clinical forms of presentation (cutaneous and visceral), which are associated with a broad range of signs, symptoms, and degrees of severity (Herwaldt 1999; Reithinger 2007). Depending on its geographical distribution, cutaneous leishmaniasis (CL) is classified as New World cutaneous leishmaniasis (NWCL) or Old World cutaneous leishmaniasis (OWCL). The latter commonly – though not exclusively – presents as chronic, painless ulcers or nodules. Treatment of cutaneous leishmaniasis is complex and should depend on the Leishmania species involved, the area of acquisition of the infection, and the clinical form (Monge‐Maillo 2013). Management may vary from local or systemic treatment to no treatment.
Epidemiology and impact
In many tropical and subtropical low‐ and middle‐income countries (LMICs), protozoan parasites are amongst the most common infectious agents and have serious consequences for socioeconomic development (Alvar 2006; WHO 2002). The World Health Organization (WHO) considers leishmaniasis to be one of the most serious parasitic diseases, and the World Health Assembly has advocated for prioritising their control (WHO 2007).
An estimated 700,000 to 1.2 million new CL cases occur each year (Alvar 2012). CL is widely distributed, with 70% to 75% of the global incidence located mainly in 10 countries: Afghanistan, Algeria, Colombia, Brazil, Iran, Syria, Ethiopia, North Sudan, Costa Rica, and Peru (Alvar 2012). Global incidence of OWCL is estimated at more than 900,000 cases per year, distributed from the Mediterranean basin across the Near East to Northwest India, with a few foci in Central China as well as a thin band across West Africa and in the Horn of Africa (Alvar 2012; Pigott 2014). OWCL is also increasingly present in immigrants, military personnel, humanitarian aid workers, tourists, and travellers from endemic areas (Reithinger 2007).
Immunosuppression is also a factor that can increase the prevalence of CL, altering its clinical presentation and treatment response (van Griensven 2014). This factor is most closely associated with HIV, but recent years have seen a worldwide increase in other immunosuppressive conditions, mainly because of better medical care for chronic illnesses and the use of immunosuppressive drugs like tumour necrosis factor (TNF) inhibitors (van Griensven 2014). In any case, the reported leishmaniasis case figures seem to be only a fraction of the true burden, and the disease appears to be underestimated and on the rise in several countries (Alvar 2012). Leishmaniasis, as with many other neglected tropical diseases (NTDs), occurs mostly in LMICs, affecting rural and remote locations that may escape official data sources (WHO 2010).
Aetiology and transmission
Five Leishmania species cause OWCL: L major, L tropica, L infantum, L donovani, andL aethiopica (Pace 2014). Most cases are due to L major, with around 500,000 cases per year; L tropica, with 400,000 cases per year; followed by L aethiopica, with 50,000 cases per year (den Boer 2011). Transmission of leishmaniasis is through a complex life cycle involving sandflies belonging to the Phlebotomus species (Pace 2014). Non‐vector transmission (e.g. by accidental laboratory infection, blood transfusion, or organ transplantation) is possible but rare (Cardo 2006). Transmission of leishmaniasis can be either anthroponotic or zoonotic (Pace 2014).
Zoonotic cutaneous leishmaniasis (ZCL), occurring mostly in rural areas, is where the parasite is transmitted from a range of animals to humans (WHO 2010). It is geographically distributed in the Middle East, North‐western China, and North Africa, where it may be caused by L major, and in the Mediterranean basin where it is mostly caused by L infantum (Pace 2014). The Old World ZCL often heals spontaneously after two to four months, although in some cases it may persist for as long as five years (WHO 2010).
Anthroponotic cutaneous leishmaniasis (ACL) is transmitted from person to person, mainly in urban areas; it is geographically distributed in the Middle East, the Indian subcontinent, and western Asia (WHO 2010). ACL is mostly caused by L tropica and also by L donovani, which may cause post‐kala‐azar dermal leishmaniasis (PKDL) in Asia (India, Nepal, and Bangladesh) and in East Africa (Ethiopia, Kenya, and Sudan) (Alvar 2012).
Clinical manifestations
CL can affect the skin and mucous membranes and has been categorised into five different clinical forms: localised, recidivans, diffuse, mucosal, and PKDL.
Localised leishmaniasis
In the localised form, the parasite is confined to the skin (Gonzalez 2008). After an incubation period of 1 to 12 weeks, a papule or bump develops at the site of the insect bite, and the papule grows and turns into an ulcer (González 2009). A typical lesion of the localised form of CL is a painless papule or ulcer covered with an adherent crust of dried exudate and located on exposed parts of the body such as the face, arms, or legs (Gonzalez 2008; González 2009). CL due to L infantum usually causes single lesions. By contrast, L tropica frequently causes multiple lesions, as does L major, in this case often severely inflamed and ulcerated lesions that heal slowly and cause large disfiguring or disabling scars. Other variations exist as well: some people may have as many as 200 simple skin lesions, with some growing but not ulcerating (sporotrichoid), while certain Leishmania species also infect the lymphatic system, producing lesions along the lymphatic channels (nodular lymphangitis) (Gonzalez 2008). Secondary bacterial infection is common, causing pain and serious disability (Blum 2014). Most lesions heal spontaneously over months or years, leaving permanent scarring with skin thinning. Scarring of leishmaniasis typically displays a depigmented centre and a pigmented border (Reithinger 2007).
Leishmaniasis recidivans
This form appears in around five per cent of people with CL by L tropica and is characterised by microsatellite and confluent lesions that relapse and finally ulcerate on the border of previous scars (Sharifi 2010; WHO 2010).
Diffuse leishmaniasis
This form affects only the skin but with generalised skin lesions; it is seen mainly in Africa and transmitted by L aethiopica (Alrajhi 2003).
Mucosal leishmaniasis
In mucosal leishmaniasis, the parasite may spread to the mucous membranes, especially those of the nose, mouth, and throat, causing extensive damage and disfiguration. It mainly occurs in South America, but it can also be caused by species from Old World countries including L tropica, L major, and L infantum (WHO 2010).
Post‐kala‐azar dermal leishmaniasis
PKDL is a form of diffuse cutaneous leishmaniasis and a sequel of visceral leishmaniasis (VL) that may appear in affected individuals up to 20 years after being partially treated or untreated or even in those who supposedly received adequate treatment (Rathi 2005). PKDL is mostly seen in areas where L donovani is endemic, such as in Asia (India, Nepal, and Bangladesh) and East Africa (Ethiopia, Kenya, and Sudan) (Alvar 2012).
Diagnosis
Clinically diagnosed OWCL should be confirmed using the traditional diagnostic techniques of smear, parasite culture, and histological analysis of skin by aspiration, scrapings, or biopsies (Saab 2015). Circulating antibodies in the bloodstream are generally low or undetectable in cases of OWCL (Masmoudi 2013). Modern molecular diagnostic techniques, mainly the polymerase chain reaction test (PCR), appear to be the most sensitive single diagnostic test for species identification in skin samples (Faber 2003; Schallig 2002). Identification of the Leishmania species involved is essential for selecting the most appropriate treatment.
Description of the intervention
Issues of treatment in CL are difficult to deal with because there are many factors that can influence the efficacy of drugs: the size, the number, and the appearance of the lesions; the duration of the disease prior to treatment; the frequency and time to self‐healing; the frequency of relapse and re‐infection; the frequency and severity of either mucosal or diffuse involvement; immunosuppression; co‐infections; prior anti‐Leishmania treatment; and the knowledge of resistance to anti‐Leishmania drugs (Gonzalez 2008). Laboratory studies have described acquired resistance to anti‐Leishmania drugs for decades, but only recently has clinical resistance been described. Monitoring resistance is currently controversial due to an inadequate correlation between clinical and in vitro resistance and a need for knowledge about the biochemical and molecular mechanisms of resistance (Croft 2006).
The location of the lesion (e.g. face or joints) and the patient's sex and age often determine the choice of treatment (González 2009). Other factors are intrinsic and related to the different Leishmania species (Safi 2012). An effective treatment in one geographical area for a given organism may not work in a different geographical area or for a different organism in the same location. In these cases, efficacy depends not only on the Leishmania species but also on the response of the person to the parasite and factors such as immunity, variable clinical response to treatments, drug toxicity, drug resistance, HIV co‐infection and adherence (Blum 2014).
Different authors have described many treatments for OWCL (Modabber 2007; WHO 2008; WHO 2010), of which we summarise the most relevant in Table 2. Nonetheless, several authors have pointed out the lack of properly controlled clinical trials (Hepburn 2001, Herwaldt 1999; Moskowitz 1999; Monge‐Maillo 2013). Another disadvantage and paradox is the lack of availability of most of these drugs in rural and poorer areas where leishmanias appears most frequently (Gonzalez 2008). Systemic treatments are generally given to those with CL who present with big (≥ 5 cm), multiple (> 5), or disseminated lesions; in those who have simple lesions involving cosmetically sensitive areas or joints, with mucosal reaction, or with the presence of nodular lymphangitis or lymphadenopathies; or for whom local therapy has failed (Blum 2014). For people with immunosuppression, there is controversy. Some experts consider that acquired or induced immunosuppression is a risk factor for developing mucosal leishmaniasis, so they recommend systemic treatment. Meanwhile, other experts have considered different treatment for the same type of people (Blum 2012).
| Drug | Doses |
| Systemic antimonials | |
| Sodium stibogluconate (Pentostam, Stibanate) Meglumine antimonate (Glucantime) Combined with pentoxifylline | 20 mgSb v+/kg/d intramuscularly or intravenously for 20‐30 days 400 mg orally 3 times a day for 10–20 days |
| Intralesional antimonials | |
| Sodium stibogluconate (Pentostam, Stibanate) Meglumine antimonate (Glucantime) | 1–5 mL per session every 3–7 days. Up to 10 sessions depending on the clinical response, but most patients require ≤ 5 sessions |
| Non‐antimonial systemic treatments | |
| Fluconazole | 200 mg orally daily for 6 weeks |
| Miltefosine | 50 mg orally three times daily for 28 days |
| Liposomal amphotericin B | 3 mg/kg/d IV on days 1‐5 and 10 (18 mg/kg total dose) |
| Non‐antimonial topical or intralesional therapies | |
| 15% paromomycin/12% methylbenzethonium chloride | Ointment twice daily for 10‐20 days |
| 15% paromomycin/0.5% gentamicin sulphate | Twice a day for 20 days |
| Physical therapies | |
| Cryotherapy with liquid nitrogen | Frozen for 10‐30 s and thaw applied locally 2‐3 times in each session, repeated every 1‐4 weeks to complete healing (usually 2‐4 sessions) |
| Local heat therapy | 50°‐55ºC for 30 s by: Infrared light Direct current electrical stimulation Ultrasound Laser Radiofrequency waves ThermoMed device |
Systemic and intralesional antimonials
Meglumine antimoniate and sodium stibogluconate
The current mainstays of systemic treatment for OWCL are the pentavalent antimony (Sbv+) compounds sodium stibogluconate (SSG) (Pentostam, Stibanate) and meglumine antimoniate (MA) (Glucantime) (Asilian 2004a; WHO 2010); they often constitute the control condition in trials of new treatments. The recommended dosage is 20 mgSbv+/kg/d intramuscularly (IM) or intravenously (IV) for 20 to 30 days (WHO 2010); oral administration is not an option. SSG and MA can also be administered intralesionally (IL) with the recommended dosage of 1 mL to 5 mL per session every 3 to 7 days. Up to 10 sessions are needed depending on the clinical response, but most people require less than five sessions.
Despite the widespread use of SSG and MA, there are concerns about their cost, toxicity, and the development of drug resistance. Parenteral antimonial drugs are associated with severe adverse and often dose‐dependent effects, including nausea, vomiting, diarrhoea, skin eruptions, dizziness, cardiac arrhythmia, hypotension, arthralgia, myalgia, abdominal discomfort, headache, reversible elevation of hepatocellular enzymes, occasional anaemia, and thrombocytopaenia (Aronson 2010; Ejaz 2014; Esfandiarpour 2002; Farajzadeh 2015; Mohebali 2007; Momeni 2002). Pain at the site of the injection is greater in intralesional administration than in the intravenous/intramuscular route (Iraji 2005; Momeni 2002; Salmanpour 2006). Whilst there is no general consensus on optimum treatment, there are active lines of research to identify alternatives to systemic antimonials (Jowkar 2012). Momeni 2002 has investigated combination therapies with allopurinol, and Sadeghian 2006a with pentoxifylline, as treatments that may help to reduce drug resistance by increasing the efficacy of the antimonials, reducing their doses, or both.
Infiltration of skin lesions (injecting a substance directly into the infected lesion) can be very painful. Adverse effects of IL treatments are burning at the site of injection, itching, inflammation, and vasovagal shock due to severe pain (Layegh 2009; Mapar 2010). A safe and efficient therapeutic method for IL injection is the use of a Dermojet device (Bogenrieder 2003). Preventing blood‐borne transmission of other infectious diseases in LMICs entails reducing the use of injections, implementing blood safety practices, and providing sterile injection equipment in healthcare centres (Kermode 2004; Simonsen 1999). Several studies provide evidence for the efficacy of intralesional pentavalent antimonials for OWCL, mainly in Asia and the Mediterranean basin (Alkhawajah 1997; Uzun 2004). Moreover, local administration reduces the systemic toxicity of antimonials; people may receive anywhere from a few injections or – for those with multiple or complicated lesions – daily injections for up to 40 days (Mujtaba 1999). (Complicated CL is defined as more than 4 lesions over 4 cm in size, which are periorificial or located close to small joints, for which previous treatment has failed. Clinically important lymphatic dissemination is present, as well as underlying immunosuppressive conditions, and "there is significant comorbidity for which systemic treatments could be contraindicated in a benefit–risk assessment (e.g. unbalanced diabetes, malnutrition)" (Gradoni 2017).)
Self‐limiting lesions are normally amenable to weekly or alternate day IL injections of SSG or MA (Alkhawajah 1997; Mujtaba 1999). According to some authors, deficient infiltration of the lesions is one of the most common and important causes of treatment failure with IL antimonials (Faghihi 2003). There are also other studies that have evaluated the association of intralesional pentavalent antimonials as a way to increase the efficacy (Asilian 2003; Munir 2008).
Non‐antimonial systemic treatments
Oral antifungal
Oral azole antifungal drugs (fluconazole, ketoconazole, itraconazole) are potential therapeutic agents in CL. The first reports of oral ketoconazole for the treatment of CL in both the New and the Old World came out in the early 1980s (Urcayo 1982; Weinrauch 1983a; Weinrauch 1983b). However, reports of liver toxicity and low cure rates for certain species led to ketoconazole being withdrawn from the market, making it necessary to search for other azoles (Alrajhi 2002). In the mid‐ to late 1980s, another azole called itraconazole was touted as a treatment for CL (Borelli 1987; Cauwenberg 1986), with different cure rates depending on the species involved (Momeni 1996; Nassiri‐Kashani 2005). Fluconazole, another antifungal azole, has also been used as an alternative therapy for CL, with good cure rates at different doses (Alrajhi 2002; Emad 2011).
Oral dapsone
Some studies have proposed the antibiotic/antileprotic drug dapsone as an inexpensive oral alternative to the treatment currently used for CL (Dogra 1986; Dogra 1991), although the main side effect of dapsone is blood cell destruction and anaemia (Dogra 1991).
Oral allopurinol
Allopurinol (a medicine used to treat gout) alters protein synthesis and inhibits the growth of Leishmania in vitro (Momeni 2002); different authors have assessed its use as a potential therapeutic agent for the treatment of both CL and VL, mainly in combination with pentavalent antimonials (Chunge 1985; Jha 1983; Kager 1981; Momeni 2002).
Oral antibiotics
Researchers have also reported several other oral antibiotics like metronidazole and cotrimoxazole as possibly promising anti‐Leishmania agents in the treatment of VL (Rodriguez‐Cuartero 1990), while others have looked into the efficacy of a short‐term course of antibiotic rifampicin for CL (Bygbjerg 1980). Oral azithromycin is another antibiotic that is effective in vitro and in mice (Minodier 2007), but research has not established it as superior to antimonials for OWCL in humans (Layegh 2007), even when combined with allopurinol (Dastgheib 2012). Thus, azithromycin needs further investigation for human leishmaniasis.
Oral pentoxifylline
Oral pentoxifylline, used in people with vascular diseases, also has anti‐Leishmania effects (Lessa 2001), decreasing the inflammatory reaction and the resulting tissue damage (Sadeghian 2006a). Pentoxifylline has a good safety profile, although nausea, arthralgias, dizziness, abdominal pain, and diarrhoea can occur (Lessa 2001).
Oral miltefosine
Oral miltefosine, which was originally developed as an anticancer drug, is active against the Leishmania membrane (Croft 2006). Miltefosine was included in the WHO essential medicines list as an anti‐leishmaniasis medicine in March 2011 (WHO 2011), and in March 2014, the US Food and Drug Administration (FDA) approved oral miltefosine for visceral, cutaneous, and mucosal leishmaniasis (FDA 2014). Miltefosine seems active against most Leishmania species, but with variable efficacy depending on geographical regions, even for the same species (Monge‐Maillo 2015; Soto 2004; Stojkovic 2007). Limited experience with miltefosine for OWCL shows efficacy, mostly against L major (Dorlo 2011; Mohebali 2007; Stojkovic 2007). The most commonly reported adverse drug reactions associated with miltefosine are transient gastrointestinal discomfort, nausea, vomiting, abdominal pain, and mild elevation of liver enzymes and serum creatinine (Mohebali 2007). Women of childbearing age require contraception beyond the end of treatment because this drug is contraindicated during pregnancy (Sindermann 2006).
Oral zinc sulphate
Early studies on oral zinc sulphate reported promising results for the treatment of CL (Sharquie 1996; Sharquie 1997; Sharquie 2001), although more recent studies have not reported good cure rates (Yazdanpanah 2011).
Oral artesunate
Artemisinin is effective against promastigotes in vitro, and artemisinin and artemether are leishmanicidal for amastigotes in infected murine macrophages (Adam 2008; Keiser J 2007). However, an RCT performed in Sudan did not show that artesunate combined with sulphamethoxypyrazine/pyrimethamine was better than placebo for OWCL (Adam 2009).
Other oral drugs
Jiang 2002 was the first to describe using omeprazole, a common treatment for peptic ulcer diseases, as a potential antiparasitic drug for the growth of L donovani in a laboratory setting, and Nilforoushzadeh 2008 concluded it was a good alternative to antimonials when these have to be given in a lower dose.
Parenteral liposomal amphotericin B
Amphotericin B, an antifungal drug used since 1960 (Sampaio 1960), is commonly used for treating American mucocutaneous leishmaniasis, HIV co‐infection, and visceral leishmaniasis (VL) in areas where Leishmania is resistant to antimonial and pentamidine drugs (Karamian 2007; Laguna 1999; Musa 2005; Sampaio 1997; Sundar 2007a; Thakur 1996). There has been little experience with this drug for OWCL due to pentavalent antimonials' dominance as the most commonly systemic regimens until now. However, the toxicity of pentavalent antimonials has prompted an increase in the administration of amphotericin B (mostly the lipid formulations), with promising results mainly with L major and L tropica (Solomon 2011; Wortmann 2010). Zanger 2011 also reported a case of OWCL due to L aethiopica in a immunosuppressed person with response to liposomal amphotericin B.
Non‐antimonial topical or intralesional therapies
Mild disease caused by L major is often self‐healing (Alkhawajah 1997; Nilforoushzadeh 2006). OWCL can be managed with local care alone and may not require other specific therapies when it is a simple CL (Shazad 2005), defined as CL: not caused by Leishmania species with common mucosal dissemination; not a diffuse, recurrent or post‐kala‐azar CL; with no lymphatic nodes affected; with small lesions; with fewer than five lesions; with lesions that are not localised in joints or aesthetic areas; or in people who are not immunocompromised (Nilforoushzadeh 2006). Topical and local therapies are attractive options that are appropriate for early self‐limiting lesions, offering reduced systemic toxicity and possibilities for outpatient treatment (Iraji 2004).
Topical antifungals
Early research on topical antifungals was based on clotrimazole, miconazole, and ketoconazole. The only RCT performed was in Saudi Arabia; investigators compared clotrimazole and miconazole and concluded that clotrimazole was more effective (Larbi 1995). Topical ketoconazole was tested in Afghanistan, but it did not significantly change the course of the lesions (Storer 2005).
Topical paromomycin (aminosidine)
Topical formulations often offer easier administration, fewer adverse effects, and sometimes cost‐effectiveness, although there may be difficulties in getting enough of the active drug absorbed through the skin (Jowkar 2012). Paromomycin is an antibiotic in the aminoglycoside family, originally identified as an anti‐Leishmania drug in the 1960s. Parenteral formulations have been used for VL (Sundar 2007b), and topical preparations for CL since 1987 (Asilian 1995). The literature uses the names paromomycin, aminosidine, monomycin, and neomycin E interchangeably, although the active principle is the same (Bryceson 1994). Two main topical preparations are available for CL: 15% paromomycin sulphate dissolved in a soft white paraffin base, either with 12% methyl benzethonium chloride (MBCL) or with 10% urea (Faghihi 2003; Shazad 2005). Paromomycin ointment combined with MBCL has been shown to be more efficacious than with urea (Iraji 2005). The original paromomycin formulation is no longer used because of its toxicity, and newer penetration‐enhancing formulations have been subjected to clinical evaluation (Davis 2003). More recently, studies have also evaluated new combinations of paromomycin plus gentamycin (Ben Salah 2009). Of the topical preparations, paromomycin ointment is commonly the first‐line treatment in uncomplicated CL (Asilian 2006). Adverse effects encountered were redness, pruritus, burning, oedema, local pain, inflammation, contact dermatitis, urticaria, or lymphadenitis with pain (Ben Salah 2013).
Intralesional zinc sulphate
Intralesional zinc sulphate had a direct anti‐Leishmania effect against L major and L tropica species in both an in vitro and in vivo study (Firooz 2005; Najim 1998).
Topical imiquimod
Topical imiquimod is an immune response modifier used for treating genital warts and premalignant skin cancer conditions, first used in combination with antimony for American CL (Arevalo 2007).
Intralesional hypertonic sodium chloride
Intralesional hypertonic sodium chloride solution (HSCS) can act by its osmotic effect to destroy the parasite as well as the surrounding tissue of the granuloma (Sharquie 1995; Sharquie 1997). It appears to be a cheap, safe, and effective local method for treating CL.
Intralesional interferon‐gamma (IFN‐γ)
Intralesional interferon (IFN‐ɣ) is a lymphokine originally used for the treatment of leprosy, cancer, HIV, and chronic granulomatous disease, and it has been shown to enhance the leishmanicidal capacity of human monocytes in vitro (Badaro 1990; Passwell 1986).
Topical aminoglycoside ointment (WR279,396)
The topical aminoglycoside ointment (WR279,396) is a hydrophilic formulation of paromomycin 15% plus a second aminoglycoside (gentamicin 0.5%) that was developed for topical administration, avoiding the potential skin irritation of other combinations performed with MBCL. Researchers in Tunisia have studied this combination of ointment (WR279,396) for L major, with better results than vehicle (Ben Salah 2009).
Intralesional metronidazole
Metronidazole was initially the first line treatment for trichomoniasis and later for amoebiasis and giardiasis. Its effectiveness for cutaneous leishmaniasis is controversial. Several case reports and a clinical trial performed in Iraq showed good cure rates for OWCL with intralesional metronidazole (Al‐Waiz 2004). However, a more recent clinical trial performed in Iran showed that metronidazole is ineffective (Mapar 2010). Moreover intralesional metronidazole injection was very painful.
Topical miltefosine
Pre‐clinical animal studies initially evaluated topical miltefosine, showing a potential benefit for NWCL and OWCL (Schmidt‐Ott 1999). A trial in Syria did not demonstrate efficacy of topical miltefosine for OWCL (Garnier 2002). However, a recent RCT in Iran showed that topical miltefosine was significantly more efficacious than meglumine antimoniate (Asilian 2014).
Topical dapsone
Dapsone is a synthetic sulfone employed orally for infectious diseases such as leprosy and for certain cutaneous disorders such as nodulocystic acne. However, the potential for systemic toxicity has limited its use in many cases. Topical formulations have also been developed especially for acne, thus reducing the possible systemic secondary effects (Stotland 2009). For OWCL an RCT in Iran compared dapsone 5% gel mask plus intralesional meglumine antimoniate (ILMA) versus cryotherapy plus ILMA, but investigators did not find any statistically significant difference in cure rates (Fekri 2015).
Topical 0.045% pharmaceutical chlorite (DAC N‐055)
DAC N‐055 seems to promote tissue regeneration, which may be of benefit for cutaneous lesions due to OWCL (Migdal 2011). A clinical trial in Afghanistan compared this treatment, both alone and in combination with bipolar high frequency electrocauterisation, versus intralesional antimonials (Stahl 2014). Use of electrocauterisation is based on the fact that physical wound debridement practised with bipolar high frequency electrosurgical cauterisation (HF‐EC) seems to speed up wound healing (Jebran 2014). The results of the RCT showed that DAC N‐055 alone was significantly more efficacious than ILMA (Stahl 2014).
Topical Thio‐Ben
An Iranian study reported promising results in OWCL using topical thioxolone plus benzoxonium chloride, or Thio‐Ben (Daie Parizi 1992; Daie Parizi 1996). Thioxolone, which has long been topically administered for the treatment of acne and psoriasis, is recognised as a safe drug. A later RCT from Iran compared topical Thio‐Ben plus cryotherapy versus meglumine antimoniate (Glucantime) plus cryotherapy (Daie Parizi 2015), showing that topical Thio‐Ben plus cryotherapy had good efficacy for OWCL, with fewer side affects than ILMA.
Physical therapies
People with OWCL may receive a range of physical treatments, including vaporisation, cauterisation, freezing, surgical excision, and the application of local heat.
Laser
Carbon dioxide (CO₂) lasers have been used to vaporise CL lesions, thereby destroying affected tissue without significant side effects in normal tissue (Asilian 2004b). Studies have shown that a single session is enough, with lesions healing within three to four weeks, with quite admissible cosmetic results, although the procedure is painful and requires local anaesthetic (Shamsi Meymandi 2011).
Trichloroacetic acid (TCA)
The efficacy of TCA for treating CL could be due to the destruction of infected tissue and skin regeneration (Nilforoushzadeh 2006).
Cryotherapy
Cryotherapy with liquid nitrogen has been used to treat individual lesions, destroying infected tissue, but it is labour intensive (Layegh 2009). As an effective, painless, low‐cost technique with few side effects, it is an especially good option for children (Layegh 2009; Salmanpour 2006). However, it is not suitable for multiple or complicated lesions (Alrajhi 2003; Bassiouny 1982; Layegh 2009; Leibovici 1986; Minodier 2007; Mosleh 2008; Ranawaka 2011).
Thermotherapy
Laboratory studies have reported that Leishmania parasites cannot multiply in macrophages when temperatures are greater than 39ºC (Berman 1981; Sacks 1983). These findings have stimulated investigations into the efficacy of thermotherapy for CL with direct‐current electrical stimulation (Sharquie 1998), ultrasound (Aram 1987), infrared light (Junaid 1986), hot‐water baths (Neva 1984), laser (Asilian 2004b; Babajev 1991; Meawad 1997; Rodriguez 1990), radiofrequency waves, and ThermoMed device (Reithinger 2005; Sadeghian 2007; Aronson 2010). The procedure is painful and may require local anaesthetic (Sadeghian 2007).
Topical photodynamic therapy
Photodynamic therapy is a light‐mediated technique that causes cytolysis of Leishmania parasites, resulting in an effective and safe therapeutic option for OWCL (Asilian 2006).
Mesotherapy
Mesotherapy is based on the use of a specific amount of variable substance (hormones, nutrients, enzymes, pharmaceuticals, and detergents, among others) and is not an invasive technique. People have received it for treating cellulite and acne scars, reducing aging skin, and rejuvenating the hands and neck (Amin 2006; Rohrich 2003). One RCT performed in Iran compared mesotherapy with ILMA, finding no difference in cure rates between the two therapeutic options (Kashani 2010).
Methods for promoting healing
Methods used in wound healing, including dressing and antiseptics, are often employed in ulcerative lesions of CL to accelerate cure, normalise epithelialisation, and reduce scarring, especially at cosmetic sites (Stahl 2014). Compromised wound healing due to repetitive trauma, contamination, and infection are major problems encountered in people with OWCL, and it is important to improve scar formation or at least not interfere with the natural healing process (Gonzalez 2008). A recent consensus panel on recommendations for chronic and acute wound dressings reported that "hydrocolloid (polymer dressings with medium absorption properties and containing carboxymethylcellulose) and low‐adherent dressings seem to be the most suitable dressings for the epithelialisation stage of chronic and acute wounds" (Vaneau 2007). The highest impact of scarring and ulcerative lesions is on the faces of young women, which exposes them to stigma and which may affect their marriage prospects (Weigel 2001; Reithinger 2005b). To assess the cosmetic impact, clinicians often use the Burn Scar Index (also known as the Vancouver Scar Scale) to document change in scar appearance (Baryza 1995), which should be ideally measured six months after completion of treatment (Modabber 2007).
Alternative therapies
Increasing treatment failure with antimonial drugs has accelerated the search for alternative therapies (Nilforoushzadeh 2007). Up to 80% of the world's population may depend on medicinal plants as the only source of remedies for this disease; modern drugs may be either too expensive or wholly inaccessible (Fatima 2005). Practitioners of both traditional and modern medicine in Iran have long used herbal remedies and honey (Nilforoushzadeh 2007; Zerehsaz 1999). Different plants with medicinal value (Azadirachta indica, Acacia nilotica, and Allium sativa), traditionally used in the west and central parts of Sudan, have proven to have active anti‐Leishmania activity on L major promastigotes in vitro (Fatima 2005; Khalid 2005). Honey is effective for wound healing through enhancement of granulation and epithelialisation stages, enhancement of debridement, and downsizing of wound malodour (Moore 2001; Pieper 2003). Studies have described that honey from flowers in Australia and New Zealand has antibacterial effects (Pieper 2003).
How the intervention might work
OWCL is a heterogeneous group of diseases that differ in their clinical presentation, prognosis, and response to different the therapeutic interventions. There are two main factors affecting response to treatment: the species of Leishmania and the clinical form of the disease.
The mechanisms of action of the different therapeutic options for OWCL are diverse and may act over different targets, which can result in a complementary effect when working in combination (González 2009). There are two main types of therapeutic options: local physical therapies and local or systemic pharmacological therapies (Gonzalez 2008). Physical therapies such as HSCS, CO₂ lasers, TCA, cryotherapy, thermotherapy, and photodynamic therapy can destroy the parasite, the infected tissues, and the locally formed granulomas (González 2009). Pharmacological therapies, such as pentavalent antimonials, amphotericin B and its lipid formulations, miltefosine, paromomycin, and pentamidine, seem to enter the host cells and act against amastigotes, compromising the parasite metabolism, altering the parasite membrane fluidity or damaging the parasite mitochondria, among other mechanisms of action (Gonzalez 2008).
Therapeutic interventions could work in several ways: healing the forms of disease that would run a chronic course without treatment (L aethiopica); avoiding the progression of the disease to more complex clinical forms (mucocutaneous leishmaniasis, diffuse cutaneous leishmaniasis, leishmaniasis recidivans, etc.); speeding the healing of those forms that would naturally cure (L major); avoiding sequelae and disfiguring residual lesions (L major, L tropica, L infantum); and decreasing the human reservoir in anthroponotic forms (L tropica).
As a wide range of interventions are available, from physical or pharmacological local therapy to parenteral treatment, and response to treatment varies depending on the Leishmania species, knowing the optimal therapeutic approach in each situation is of great interest. This review aims to analyse the different interventions in order to provide the best treatment options for OWCL.
Why it is important to do this review
Controlling CL currently depends on early detection and rapid treatment (González 2009). The mainstays of treatment have been pentavalent antimonials, but other oral and topical treatment alternatives have become available in recent years (Gonzalez 2008). Global health development policies have mainly focused on innovative research to develop effective and affordable tools to tackle neglected tropical diseases (NTDs) and provide necessary new knowledge (WHO 2010). WHO is now prioritising the delivery of drugs that are currently available and using existing resources to reduce mortality, morbidity, and disability as a result of NTDs in low‐income countries (Savioli 2006). However, evidence for the comparative effectiveness, cost‐effectiveness, and safety of different treatment strategies is needed to improve disease control.
This systematic review focused on addressing the effects of treatments for the localised form of CL due to L tropica and L major, which account for more than 90% of CL in the Old World (WHO 2010). Since the overwhelming majority of OWCL cases heal spontaneously within 3 to 18 months (Blum 2014), the rationale for using systemic and topical treatments needs to be well established and preferably stratified for different geographic regions and Leishmania species. Separate Cochrane Reviews have addressed treatments for American CL and prevention measures for all types of cutaneous and mucosal leishmaniasis (González 2009; González 2015).
The protocol of this review was first entitled 'Interventions for solitary or limited cutaneous leishmaniasis'. However, we split the clinical subject into two reviews. We amended the title of the present review, first published in 2008 (Gonzalez 2008), to 'Interventions for Old World cutaneous leishmaniasis', and we also published a separate Cochrane Review, entitled 'Interventions for American cutaneous and mucocutaneous leishmaniasis' (González 2009). Thus, some parts of the Background and Methods sections are common to both reviews.
Objectives
To assess the effects of therapeutic interventions for the localised form of Old World cutaneous leishmaniasis.
Methods
Criteria for considering studies for this review
Types of studies
Randomised controlled trials.
Types of participants
All immunocompetent people who had localised OWCL confirmed by parasitological diagnostic methods (i.e. tissue smears, histology, culture or PCR).
Types of interventions
The interventions were either single therapy or combination therapy. The comparators were either no treatment, placebo/vehicle only, or another active compound.
1. Systemic and intralesional antimonials
1.1 Meglumine antimoniate (Glucantime)
1.2 Sodium stibogluconate (Pentostam)
2. Non‐antimonial systemic treatments
2.1 Oral antifungals
2.2 Oral dapsone
2.3 Oral allopurinol
2.4 Oral antibiotics
2.5 Oral pentoxifylline
2.6 Oral miltefosine
2.7 Oral zinc sulphate
2.8 Oral artesunate
3. Non‐antimonial topical or intralesional therapies
3.1 Topical antifungals
3.2 Topical paromomycin (aminosidine)
3.3 Intralesional zinc sulphate
3.4 Topical imiquimod
3.5 Intralesional hypertonic sodium chloride (HSCS)
3.6 Intralesional interferon‐gamma (IFN‐γ)
3.7 Topical aminoglycoside ointment (WR279,396)
3.8 Intralesional metronidazole
3.9 Topical miltefosine
3.10 Topical dapsone
3.11 Topical 0.045% pharmaceutical chlorite (DAC N‐055)
3.12 Topical Thio‐Ben
4. Physical therapies
4.1 Laser
4.2 Trichloroacetic acid
4.3 Cryotherapy
4.4 Thermotherapy
4.5. Topical photodynamic therapy
4.6. Mesotherapy
5. Measures for promoting healing
6. Alternative therapies
Types of outcome measures
We did not limit the measurement of any outcomes based on length of follow‐up.
Primary outcomes
-
Percentage of lesions cured after the end of treatment
-
Percentage of participants with a complete cure after the end of treatment
By cured, we meant that all inflammatory signs disappeared (either skin oedema, hardening, or both) and that complete scarring or healthy repair occurred in ulcerative lesions. We did not consider lesions to be healed if there was no re‐epithelialised skin, or if inflammatory signs remained after follow‐up.
Secondary outcomes
-
Speed of healing (time taken to be 'cured')
-
Duration of remission and percentage of people with treated lesions that recur within six months, one year, two years, and three years
-
Degree of functional and aesthetic impairment
-
Prevention of scarring
-
Quality of life
-
Adverse effects
Tertiary outcomes
-
Change in ability to detect Leishmania by parasitological diagnostic methods (e.g. smear, PCR, or culture)
-
"Emergence of treatment failures (defined as a decline in the efficacy of a drug against a population of parasites previously susceptible to that compound. The definition assumes that the original susceptibility of the population is known, which is not always the case for Leishmania)" (Ponte‐Sucre 2003)
-
Microbiological or histopathological cure of skin lesions
-
Development of cell‐mediated immunity (i.e. positive leishmanin skin test)
Search methods for identification of studies
We aimed to identify all relevant RCTs regardless of language or publication status (published, unpublished, in press, or in progress).
Electronic searches
For this update, we revised all our search strategies in line with current Cochrane Skin practices. Details of the previous search strategies are available in Gonzalez 2008.
We searched the following databases up to 17 November 2016:
-
Cochrane Skin Specialised Register, using the search strategy in Appendix 1.
-
Cochrane Central Register of Controlled Trials (CENTRAL; 2016, Issue 10) in the Cochrane Library, using the strategy in Appendix 2.
-
MEDLINE via Ovid (from 1946), using the strategy in Appendix 3
-
Embase via Ovid (from 1974) using the strategy in Appendix 4.
-
LILACS (Latin American and Caribbean Health Science Information database, from 1982) using the strategy in Appendix 5.
Trials registers
We searched the following trials registers in October 2015 using the term 'cutaneous leishmaniasis'.
-
ISRCTN registry (www.isrctn.com).
-
ClinicalTrials.gov (www.clinicaltrials.gov).
-
Australian New Zealand Clinical Trials Registry (www.anzctr.org.au).
-
World Health Organization International Clinical Trials Registry Platform (ICTRP) (apps.who.int/trialsearch/).
-
EU Clinical Trials Register (www.clinicaltrialsregister.eu).
Searching other resources
References from unpublished studies
We checked the bibliographies of included studies and key papers identified by our searches for further references to relevant trials.
Unpublished literature
We wrote to national programme managers, general coordinators, directors, clinicians, regional officers from endemic countries in the WHO Eastern Mediterranean Region, pharmaceutical companies, and relevant authors for further information about unpublished and ongoing trials. We also contacted the following tropical medicine centres.
-
Department of Infectious Diseases and Tropical Medicine at the University of Munich, Germany.
-
Swiss Tropical Institute, Switzerland; Prince Leopold Institute of Tropical Medicine, Belgium.
-
McGill Centre for Tropical Disease, Canada.
-
Tulane University School of Public Health & Tropical Medicine, USA.
-
London School of Hygiene & Tropical Medicine, UK.
-
Tropical Medicine at the Liverpool School of Tropical Medicine, UK.
-
Department of Public Health and Tropical Medicine James Cook, University of North Queensland, Australia.
-
Institut Pasteur, France.
-
Bernhard Nocht Institute, Germany.
-
TropEdEurop, Spain.
Adverse effects
We searched MEDLINE (Ovid) from 1946 to 30 September 2015 for adverse or side effects of interventions for Old World cutaneous leishmaniasis using the search strategy in Appendix 6.
Data collection and analysis
Some parts of this review use text that was originally published in other Cochrane Reviews (predominantly van Zuuren 2015, Ingram 2015, and Delamere 2008; the latter was an exemplar Cochrane Review at the time the original review was written).
Selection of studies
We checked the titles and abstracts identified from the searches by at least two authors (JHM, PC, PLP, BMM, EGM). If it was unclear, then two authors obtained the full text study for independent assessment (BMM, EGM). The authors decided which trials met the inclusion criteria. The authors resolved any disagreements by discussion, with referral to a third author (AR) if necessary. We describe excluded studies and reasons for exclusion in the Characteristics of excluded studies table.
Data extraction and management
At least two independent authors (MP, LR, JHM, PLP) carried out data extraction using a pre‐designed data extraction form. We extracted data for all outcomes for all relevant drugs, paying attention particularly to the doses and therapy frequencies. We resolved disagreements by discussion. We obtained the missing data from trial authors when possible.
Assessment of risk of bias in included studies
The quality assessment included an evaluation of the following components for each included study, since there is some evidence that these are associated with biased estimates of treatment effect (Higgins 2011).
-
The method for generating the randomisation sequence.
-
The method for concealing allocation – it was considered 'adequate' if personnel and participants could not have foreseen assignment.
-
Blinding (participants, clinicians, outcome assessors).
-
Loss to follow‐up in each arm (split into postrandomisation exclusions and later losses if possible), and whether participants were analysed in the groups to which they were originally randomised (intention‐to‐treat).
In addition, the quality assessment also included the following.
-
Declaration of sample size calculation.
-
Definition of inclusion and exclusion criteria.
-
Reporting of Leishmania species involved.
-
Time of follow‐up.
-
Baseline comparability of severity of infection, age, sex, and duration of complaint.
-
Conflict of interest.
We assessed these other risks of bias. When trials reported two or more incorrectly, we judged them to be at high risk. When trials reported only one incorrectly, we judged them to be at unclear risk. We recorded the information in 'Risk of bias' tables (Characteristics of included studies) and described the quality of each study based on these components.
Measures of treatment effect
We reported all outcome data with their associated 95% confidence interval (CI). We expressed results as risk ratios (RR) and 95% CIs for dichotomous outcomes. We presented continuous outcomes with the same scale as reported in each trial, with a mean change from baseline with its associated standard deviation (SD), or as weighted mean difference (MD) or standardised mean difference (SMD) if more than one study was available.
If enough information was available in the study reports, we decided to describe hazard ratios (HR) for time‐to‐event outcome data.
Unit of analysis issues
We found that most RCTs included in this review assessed participants instead of lesions as the unit of analysis. When lesions were used as unit of analysis, comparisons were performed with lesions cured over lesions at start, not taking into account the correlation of multiple lesions per participant. We only pooled together studies which reported number of participants cured (not number of lesions), due to unit of analysis issues.
The approach followed to 3‐arm trials, was comparing the arms in pairs (A vs B, B vs C, and A vs C).
We only considered parallel group designs for all clinical trials. We did not consider cross‐over trials in this review because they are an inappropriate design for treatments that can potentially cure an infectious disease. We did not find any particular additional important information in the specific search for adverse effects for every particular treatment. Authors described these qualitatively in the Results and Discussion sections.
Dealing with missing data
For all missing data from trials that were less than 10 years old, we tried to contact the authors. Only six of the trials explicitly stated intention‐to‐treat (ITT) analysis. Where an ITT was not stated, we used the numbers originally randomised to the groups in order to calculate effect estimates.
For each study, we took all participants that were randomised into account when introducing the data in our tables. We sent emails to study authors asking for more information, and we recorded these emails and their responses. When we had no response, we assumed that missing data were treatment failures. Concerning the losses to follow‐up, it was not always possible to determine the arm in which the losses occurred, making ITT analyses impossible. In that case, we introduced only available data into the tables for analysis.
Assessment of heterogeneity
To assess the consistency of the study results, we obtained the I² statistic, which measures the proportion of total variation across studies that is due to heterogeneity rather than chance. I² lies between 0% and 100%. A value of 0% indicates no observed heterogeneity, and larger values show increasing heterogeneity. We analysed statistical heterogeneity using a Chi² test (on 1 degree of freedom, with a significance level of 0.05) (Higgins 2003).
Assessment of reporting biases
In this review, the low number of studies evaluating similar interventions and comparisons did not permit an assessment of publication bias. In future updates, if a sufficient number of trials assessing similar effects are identified for inclusion in this review, publication bias will be assessed according to the recommendations on testing for funnel plot asymmetry (Egger 1997) as described in section 10.4.3.1 of the Cochrane Handbook for Systematic Reviews of Interventions (Higgins 2011). If asymmetry is identified we will try to assess other possible causes and these will be explored in the discussion if appropriate
Data synthesis
We performed data synthesis only when we were able to identify at least two studies investigating similar treatments and reporting data amenable to pooling. Although there is inevitably a degree of heterogeneity between the studies included in a review, we entered these into a meta‐analysis if clinical reasoning could explain the heterogeneity and if there was a coherent argument for combining the studies. We used the random‐effects model, as this is more conservative in the presence of heterogeneity.
The percentage of lesions cured after the end of treatment was the primary outcome measure if available. If this were not available, we used secondary and tertiary outcomes. To estimate differences between treatments, we pooled trials that evaluated similar interventions and controls and calculated a weighted treatment effect across trials, using a random‐effects model. Where it was not possible to perform a meta‐analysis, we summarised the data for each trial.
Subgroup analysis and investigation of heterogeneity
In view of the limited number of included studies covering any one specific intervention, we did not conduct any of the subgroup analyses that we originally planned: Leishmania species, location and severity of infection, geographical setting, diagnostic techniques, type of treatment (topical, systemic, or combination), and relapse or re‐infection.
We assessed clinical heterogeneity by examining the characteristics of the studies, the similarity between the types of participants, the interventions, the comparisons, and the outcomes as specified in the criteria for included studies.
Sensitivity analysis
We plan to carry out a sensitivity analysis by excluding studies at high risk of bias.
Summary of findings tables
We used the GRADE approach to rate certainty of the evidence (for each outcomes) and strength of recommendations (Guyatt 2008). For better understanding of the review, we highlighted the GRADE assessments in 'Summary of findings' tables of key comparisons and outcomes.
Depending on the study design, risk of bias, consistency of the results across studies, and precision of the overall estimated across studies, certainty of evidence can be high, moderate, low, or very low.
Results
Description of studies
Results of the search
The previous version of this review identified 49 trials with 5559 randomised participants (Gonzalez 2008).
The update searches of the five databases (see Electronic searches) retrieved 517 records. Our searches of other resources identified six ongoing studies. We obtained no response from the institutions we contacted to try to identify further trials.
Once we removed duplicates, we had a total of 521 records. We excluded 452 records based on titles and abstracts and obtained the full text of the remaining 69 records. We excluded 15 studies (see Characteristics of excluded studies) and included 40, taking the total number of included studies to 89 (see Characteristics of included studies).
There are eight studies awaiting assessment: (Farajzadeh 2016a; Farajzadeh 2016b; Hanif 2016; Jaffary 2016; Na‐Bangchang 2016; Rajabi 2016; Refai 2016; Sattar 2012) (see Characteristics of studies awaiting classification). We found six ongoing trials (see Characteristics of ongoing studies).
Two studies were reported in two references: Nilforoushzadeh 2006 and Shanehsaz 2015.
For a further description of our screening process, see the study flow diagram Figure 1.

Study flow diagram.
Included studies
We included 89 studies (including 40 new to this update) involving 10,583 randomised participants with Old World cutaneous leishmaniasis (see Characteristics of included studies table).
Design
All of the studies were RCTs: 30 were placebo‐controlled, and 59 had an active treatment comparator. Seventy‐two took place after the year 2000; 85 were single‐centre studies, and the other 4 were multicentre studies (Asilian 1995; Asilian 2003; Ben Salah 2009; Ejaz 2014).
Sample sizes
The number of participants included in the individual studies ranged from 18 to 444; the most common sample size was 50 to 120 participants (interquartile range).
Setting
The studies included in this review took place in different countries, mainly in the Far or Middle East. Fifty‐three took place in Iran; seven in India; five in Africa (Sudan and Tunisia), four each in Saudi Arabia and Afghanistan; three each in Pakistan, Iraq, and Syria; two each in Kuwait and Sri Lanka; and one each in Yemen, Turkey, and the USA (recruiting Department of Defense healthcare beneficiaries who were likely to have been infected in Iraq or in Kuwait). Most studies took place in regional hospitals, teaching hospitals, local healthcare clinics, and skin disease research centres. A few studies were in military hospitals or army medical centres.
Participants
The studies had a mean of 41.5% of women participants, but this ranged from 23% to 80%. Four RCTs conducted by military institutions only included men (Aronson 2010; Ejaz 2014; Mashood 2001; Shazad 2005). Mean age in the individual studies ranged from 12 years to 56 years, with an overall mean age of 24.5 years. There were three RCTs including participants exclusively under 14 years (Asilian 1995; Asilian 2003; Lynen 1992). This review focused on L major andL tropica infections because of the paucity of studies involving L infantum,L aethiopica, orL donovani.
Interventions
Trials evaluated a wide range of interventions, which we categorised into six types.
-
Systemic and intralesional antimonials (8 studies).
-
Non‐antimonial systemic treatments (28 studies).
-
Non‐antimonial topical or intralesional therapies (28 studies).
-
Physical therapies (28 studies).
-
Measures for promoting healing (1 study).
-
Alternative therapies (5 studies).
The 89 studies covered 68 comparisons, and 59 included an active control arm. Duration of the intervention in most studies ranged between two and eight weeks (mean six weeks).
We describe examples of the first four categories in the Methods section under Types of interventions. The study on promotion of healing compared two topical interventions: diminazene aceturate (Berenil) versus cetrimide plus chlorhexidine (Savlon). Examples of alternative therapies were topical interventions based on substances like garlic, herbal extracts, or honey.
Systemic and intralesional antimonials included meglumine antimoniate (MA) and sodium stibogluconate (SSG) administered intramuscularly (IM) or intralesionally (IL). The standard dosage was 20 mg/kg/d, though some studies used higher doses such as 30 mg/kg/d or 60 mg/kg/d. The standard schedule frequency was 20 days (three weeks), but in some studies the treatment was extended until achieving cure.
Non‐antimonial systemic treatments included oral antifungals such as ketoconazole, itraconazole, and fluconazole. Trials compared itraconazole only against placebo or no treatment, whereas the trials on ketoconazole and fluconazole compared increasing dosages. Some trials compared ketoconazole versus intramuscular or intralesional SSG and intralesional meglumine antimoniate (ILMA). This treatment category also included oral dapsone versus placebo, oral allopurinol versus intramuscular meglumine antimoniate (IMMA) or intravenous sodium stibogluconate (IVSSG), oral antibiotics alone or combined versus placebo or IMMA, oral pentoxifylline alone or combined versus IMMA, oral zinc sulphate versus IMMA and oral artesunate versus placebo.
Non‐antimonial topical or intralesional therapies comprised topical antifungals like miconazole, ketoconazole, amphotericin B, and clotrimazole as well as topical paromomycin alone or in combination with oral ketoconazole, photodynamic therapy, intralesional zinc sulphate, hypertonic sodium chloride (HSCS), INF‐ɣ, metronidazole, topical imiquimod, miltefosine, dapsone, 0.045% pharmaceutical chlorite (DAC N‐055), and Thio‐Ben. The vast majority were tested against ILMA or ILSSG, with some therapies also compared to placebo/vehicle (topical paromomycin) or different regimens of paromomycin (photodynamic therapy).
Physical therapies included ablative or fractional CO₂ laser, compared against each other, IMMA, or cryotherapy. Trichloroacetic acid (TCA), alone or combined with non‐ablative CO₂ laser, was compared with ILMA. Cryotherapy, alone or combined with 15% paromomycin and/or ILMA, was compared with ILMA alone or combined. Cryotherapy was also combined with topical treatments such as 3% salicylic acid cream and 3% sodium nitrite cream and compared against cryotherapy plus 3% salicylic acid cream plus a vehicle. Thermotherapy using radiofrequency waves was compared with ILMA, ILSSG, and IMSSG. Another type of thermotherapy included electrocauterisation, tested with or without DAC N‐055.
Measures for promoting healing included topical diminazene aceturate (Berenil) versus topical cetrimide and chlorhexidine (Savlon), and trials of alternative therapies included topical interventions alone or combined compared with ILMA (topical honey plus ILMA; topical Cassia fistula alone or with fruit gel plus ILMA; and topical Achilles millefolium cream plus ILMA) or IMMA (topical herbal extract).
Heterogeneity in study design, medium to high levels of data bias, missing standard deviations, and a mix of different comparators, dosing regimens, and scheduled frequency did not, in general, permit pooling of the data or allow us to make accurate and direct comparisons of a substantial number of the interventions.
Outcomes
Three RCTs did not clearly report the time points when the primary outcome was assessed (Dandashli 2005; Mapar 2010; Salmanpour 2006), and the remaining studies reported a time ranging from the end of treatment to six months after treatment.
-
Percentage of lesions cured after the end of treatment. Only 18 RCTs reported the primary outcome as percentage of lesions cured at three months after the end of treatment (Al Hamdi 2010; Alkhawajah 1997; Aronson 2010; Asilian 2004a; Asilian 2006; Dandashli 2005; El‐Sayed 2010; Firooz 2005; Harms 1991; Jowkar 2012; Khatami 2013; Larbi 1995; Maleki 2012; Mujtaba 1999; Ranawaka 2015; Shamsi Meymandi 2011; Shanehsaz 2015; Sharquie 2001).
-
Percentage of participants with a complete cure after the end of treatment. The rest of the studies reported the percentages in terms of participants cured.
Varying numbers of studies reported the following secondary outcome measures.
-
Speed of healing (time taken to be 'cured') in 16 studies (Alrajhi 2002; Aronson 2010; Asilian 2004b; Ben Salah 2009; Farajzadeh 2015; Jaffary 2014b; Jebran 2014; Layegh 2009; Mujtaba 1999; Nilforoushzadeh 2007; Nilforoushzadeh 2013; Ranawaka 2015; Reithinger 2005; Sharquie 1997; Sharquie 2001; Stahl 2014).
-
Duration of remission and percentage of people with treated lesions that recur within more than 6 months in nine studies (Al‐Fouzan 1991; Bumb 2013; Ejaz 2014; Faghihi 2003; Fekri 2015; Mujtaba 1999; Ranawaka 2010; Ranawaka 2015; Sadeghian 2006b).
-
Degree of functional or aesthetic impairment (no studies measured this outcome).
-
Prevention of scarring in eight studies (Alkhawajah 1997; Asilian 2004b; Asilian 2006; Faghihi 2003; Mujtaba 1999; Sadeghian 2007; Sharquie 1997; Sharquie 2001).
-
Quality of life (no studies measured this outcome).
-
Adverse effects in all but eight studies (Al Hamdi 2010; Asilian 2014; Farajzadeh 2015; Kochar 2006; Nilforoushzadeh 2004; Nilforoushzadeh 2008; Nilforoushzadeh 2012; Nilforoushzadeh 2013).
Three studies did not report secondary outcomes (Jaffar 2006; Kochar 2006; Nilforoushzadeh 2004).
A number of studies also reported tertiary outcome measures.
-
Change in ability to detect Leishmania by parasitological diagnostic methods (e.g. smear, polymerase chain reaction (PCR), or culture). Two RCTs reported results where Leishmania was detected by parasitological diagnostic methods (e.g. PCR or culture, positive smears) (Jaffary 2014A; Jebran 2014). No studies reported emergence of resistance.
-
Emergence of treatment failures (defined as a decline in the efficacy of a drug against a population of parasites previously susceptible to that compound (Ponte‐Sucre 2003). The definition assumes that the original susceptibility of the population is known, which is not always the case for Leishmania). No studies reported this outcome.
-
Microbiological or histopathological cure of skin lesions, reported in 15 studies (Aronson 2010; Asilian 1995; Asilian 2003; Asilian 2004a; Ben Salah 1995; Dogra 1990; Dogra 1991; Dogra 1996; Harms 1991; Jebran 2014; Kashani 2010; Kochar 2000; Momeni 2002; Nilforoushzadeh 2006; Shamsi Meymandi 2011).
-
Development of cell‐mediated immunity (i.e. positive leishmanin skin test). One study reported the percentage of participants who developed Leishman bodies three months after treatment (Kashani 2010).
Excluded studies
We excluded 15 RCTs for the reasons described in the Characteristics of excluded studies tables and below.
-
Participants were randomly selected but not randomly assigned to the treatment groups.
-
Cross‐over studies.
-
No assessment of clinical primary outcomes.
-
Review and meta‐analysis.
-
Participants included in the study were immunocompromised and chronically ill patients.
Studies awaiting assessment
We identified seven studies from full‐text screening (Farajzadeh 2016a; Farajzadeh 2016b; Hanif 2016; Jaffary 2016; Na‐Bangchang 2016; Rajabi 2016; Refai 2016), and one by assessing an abstract (Sattar 2012). These studies evaluated the following.
-
Intralesional injection of zinc sulphate versus ILMA (Glucantime)e.
-
IMMA plus vehicle versus IMMA plus topical terbinafine.
-
Intralesional versus oral chloroquine administration.
-
ILMA (Glucantime) plus topical trichloroacetic acid (TCA) 50% versus ILMA alone versus fractional carbon dioxide laser.
-
Shiunko ointment versus vehicle.
-
Topical liposomal form of azithromycin versus ILMA (Glucantime).
-
Radiofrequency‐induced heat therapy versus ILMA (Glucantime).
-
Topical ointment prepared from the stem extract of Morinda citrifolia.
We will evaluate them in a future update of this review.
Ongoing studies
We identified six ongoing studies (Characteristics of ongoing studies).
Risk of bias in included studies
Please see Figure 2 for the 'Risk of bias' summary: review authors' judgments about each risk of bias item for each included study, and see Figure 3 for the 'Risk of bias' graph: review authors' judgments about each risk of bias item presented as percentages across all included studies.

Risk of bias summary: review authors' judgments about each risk of bias item for each included study.

Risk of bias graph: review authors' judgments about each risk of bias item presented as percentages across all included studies.
Our assessment of the risk of bias in the included studies has broadly followed the criteria set in the protocol. We thought the quality of the RCTs was generally poor for the following reasons.
Allocation
Forty‐two (47.2%) studies clearly described an adequate method of random sequence generation, meriting a judgment of low risk of bias, whereas the risk of bias in the rest of the studies (47/89, 52.8%) was unclear (Characteristics of included studies; Figure 2; Figure 3).
Of the 42 studies that were at low risk for sequence generation, only 12 (13.5%) also used an adequate method of allocation concealment (Aronson 2010; Ben Salah 1995; Ben Salah 2009; Ben Salah 2013; Farajzadeh 2015; Firooz 2005; Firooz 2006; Khatami 2013; Nassiri‐Kashani 2005; Nilforoushzadeh 2014b; Daie Parizi 2015; Ranawaka 2015; see Characteristics of included studies for details). However, in most studies (77, 86.5%), the method used to conceal the allocation prior to assignment was unclear.
Blinding
Only 21 studies were at low risk of performance bias because they clearly reported blinding participants or used other methods that we judged as unlikely to add risk of bias. Thirty‐three studies did not provide enough information about the blinding of the participants. Among the 35 studies that did not blind the intervention and were at high risk of bias, there were some interventions that were impossible to blind due to the different administration routes (Esfandiarpour 2002; Farajzadeh 2015; Jaffary 2014b; Nilforoushzadeh 2013; Daie Parizi 2015; Sadeghian 2007; Salmanpour 2001; Salmanpour 2006).
With regard to the blinding of the outcome assessment, most studies 62/89 (69.7%) did not provide enough information about the blinding. Authors described 20 studies as blinded, and we therefore judged them to be at low risk of bias, whereas we judged 7 studies to be at high risk. See Characteristics of included studies for further details on who was blinded.
Incomplete outcome data
Of the 89 included studies, we considered the risk of bias for 39 (43.8%) to be low; for 24 (27.0%), unclear; and for 26 (29.2%), high.
Dropouts
The overall number of participants lost to follow‐up was 1439, or 13.6% of the total number of study participants included in the review. We have categorised the dropouts into groups according to the percentage of evaluable participants (Characteristics of included studies).
Intention‐to‐treat analyses
Sixty‐four studies accounted for losses to follow‐up, while the other 25 did not report dropouts. However, 55 out of the 64 studies did not carry out intention‐to‐treat (ITT) analyses, or rather they just assessed participants who completed treatment. For each study, we took all randomised participants into account when introducing the data in our tables. We assumed that missing data were treatment failures. Concerning the loss to follow‐up, it was not always possible to determine the arm in which the losses occurred, complicating ITT analyses. In that case, we introduced only available data into the tables for analysis.
Selective reporting
Of the 89 included studies, 53 (59.55%) reported all expected outcomes, meriting a judgment of low risk of bias. We considered 22 studies (25.72%) to be at unclear risk of bias. Fourteen studies (15.73%) failed to report, or reported only incompletely (making it impossible to enter the data into meta‐analysis), results for a key outcome that would be expected to have been reported, and we therefore considered these studies to be at high risk of bias.
Other potential sources of bias
We assessed other potential sources of bias such as sample size calculation, the reporting of Leishmania species and baseline comparability among intervention groups. If a study reported all three items correctly, we classified it as being at low risk of bias. If at least one of the items were not reported correctly, we classified it as being at high risk of bias, and if the study did not report enough information to assess if there were other biases present, we classified it as being at unclear risk of bias. Of the 89 included studies, we considered the risk of bias to be high in 41 (46.07%), unclear in 28 (31.46%), and low in 20 (22.47%).
Effects of interventions
See: Summary of findings for the main comparison Itraconazole (200 mg for 6 to 8 weeks) versus placebo for Old World cutaneous leishmaniasis; Summary of findings 2 Paromomycin ointment versus vehicle for Old World cutaneous leishmaniasis
Please see the 'Summary of findings' tables, where we have summarised the certainty of the body of evidence for two of the most clinically important comparisons (summary of findings Table for the main comparison; summary of findings Table 2). We have produced two forest plots for our primary outcome, with subgroups for each comparison (see Figure 4; Figure 5), and we have summarised adverse effects in seven tables (see Table 3; Table 4; Table 5; Table 6; Table 7; Table 8; Table 9).
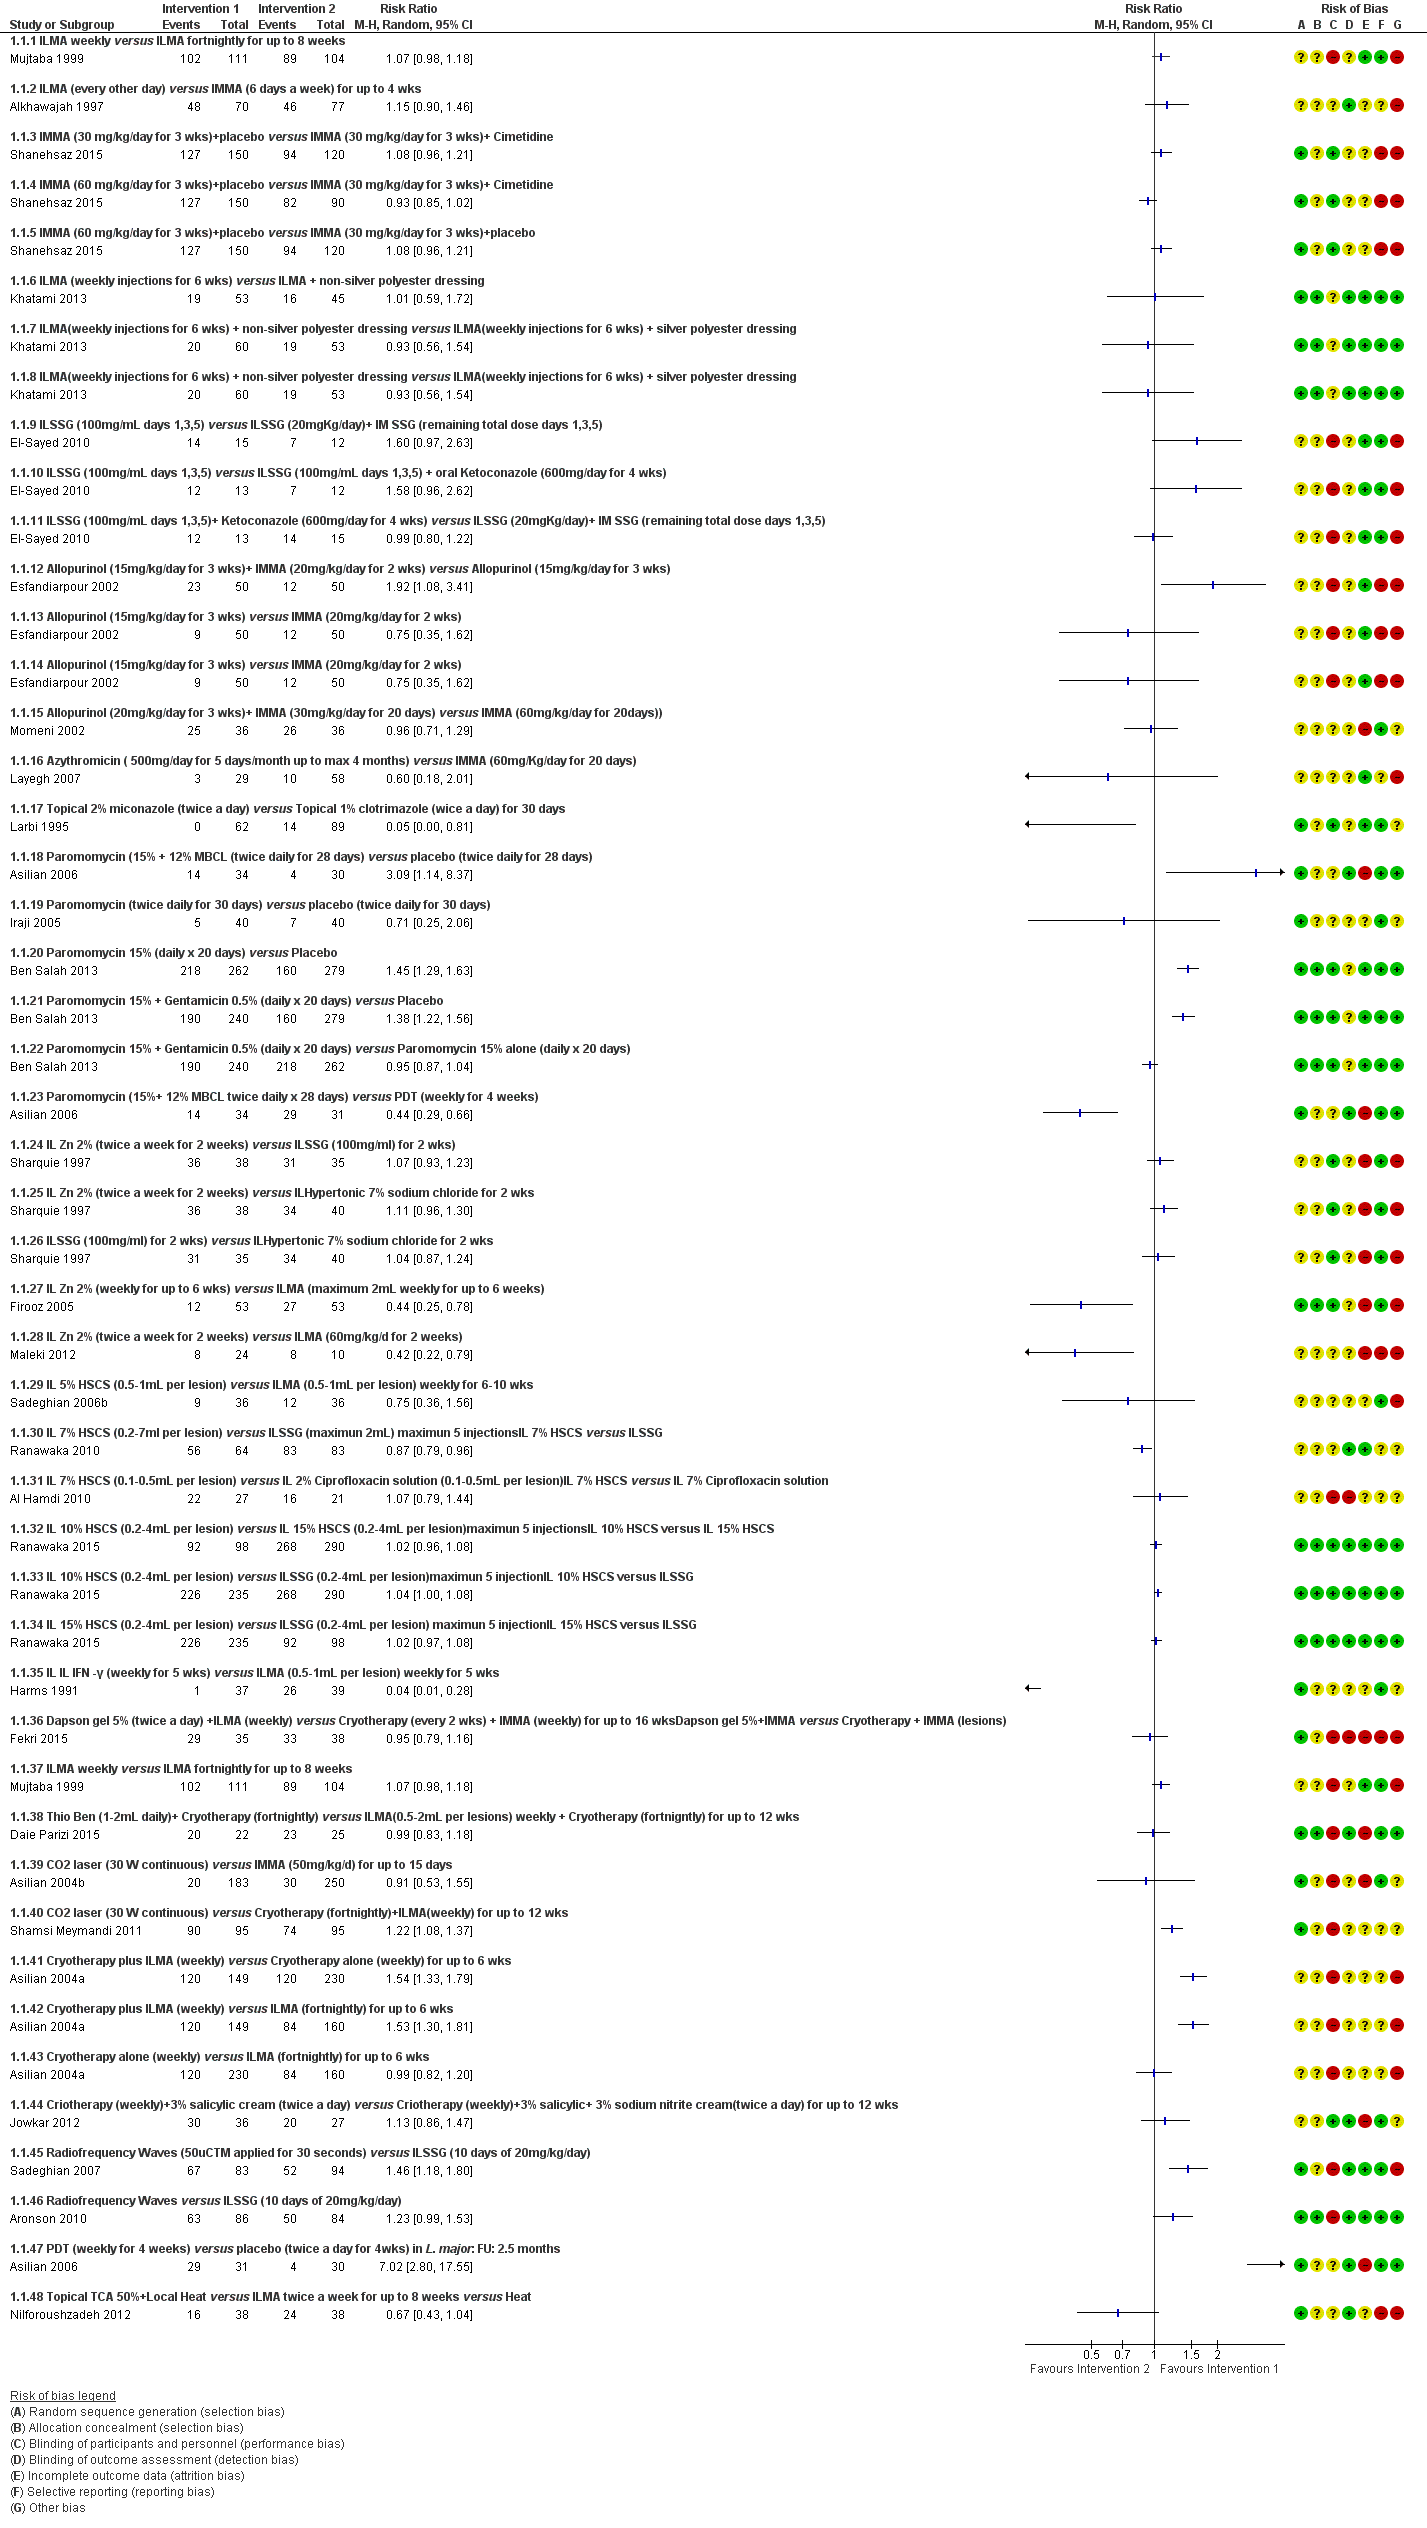
Forest Plot of Primary Outcome: Lesions Cured (Various comparisons)
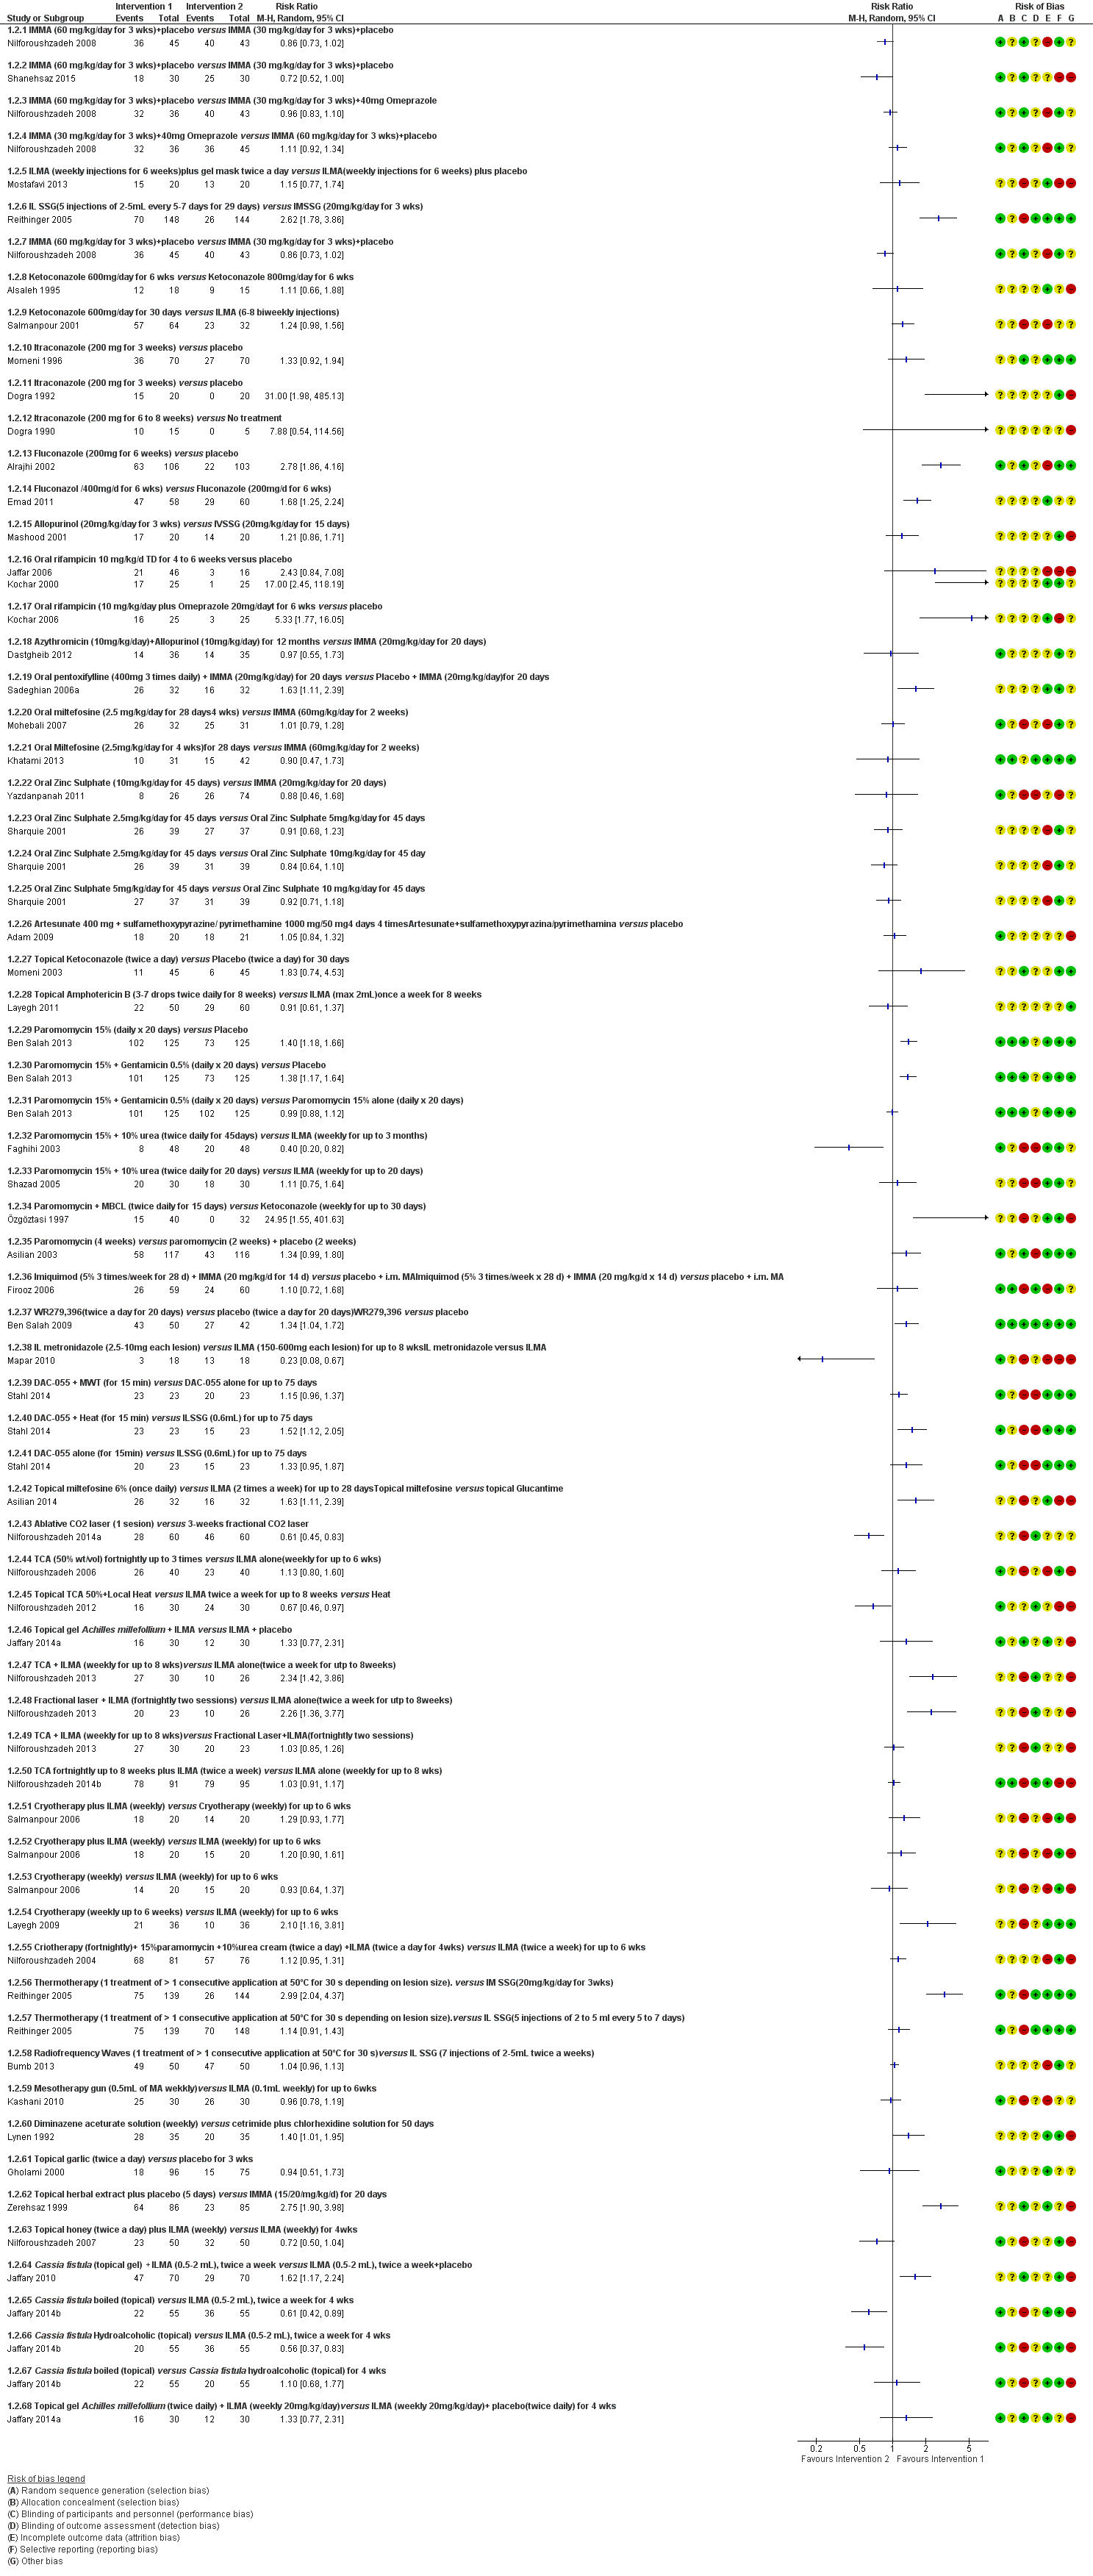
Forest plot of primary outcome: 1.2 Participants cured (Various comparisons)
| Study | Method of assessment | Timing | Interventions | Adverse effects |
| Quote: "Biochemical tests were done to detect any toxic effects of the drug." | Biochemical tests were done at the end of 1 week, 2 weeks and 4 weeks post‐ treatment. | I1: oral rifampicin 1200 mg/d I2: placebo | Intervention 23 participants evaluated for AEs. Quote: "The drug was well‐tolerated and no side‐effects were seen in any participant." Placebo 23 participants evaluated for AEs. Not reported | |
| Quote: "clinical examination, liver function tests, renal function tests" | Quote: "Before, during, and after completion of treatment" | I1: oral rifampicin 10 mg/kg/d I2: placebo | Intervention 46 participants evaluated for AEs. Elevation liver enzymes: 1 (2%) Placebo 16 participants evaluated for AEs. Not reported | |
| Haemoglobin, leukocyte count, and liver test | Biochemical tests were done at the end of 2 week, 4 weeks and 6 weeks post‐treatment | I1: oral rifampicin + omeprazole I2: placebo | Intervention 1 23 participants evaluated for AEs. Intervention 2 21 participants evaluated for AEs. Quote: "All participants tolerated the drug and placebo very well and no side effect was reported." | |
| Not described | Azythromycin group: monthly up to 4 months | I1: azithromycin 500 mg/d I2: IMMA 60 mg/kg/d | Intervention 1 22 participants evaluated for AEs (35 lesions). Nausea and vomiting: 2 (9%) Intervention 2 27 participants evaluated for AEs (58 lesions). Myalgia: 3 (11%); Erythema: 1 (3.7%). | |
| Quote: "Complete haemogram, including haemoglobin and liver and renal function tests Participants were questioned about expected adverse effects for 3 days (Days 5–7) following administration of the doses." | Haemogram: 1 and 2 months Clinical AEs: days 5‐7; 19‐21; 33‐35; 47‐19. | I1: artesunate I2: placebo | Intervention 1 20 participants evaluated for AEs. Placebo 21 participants evaluated for AEs. Skin rash with itching: 1 (4.7%) Quote: "There was no significant difference in biological tests (liver and renal function tests) in all the participants before and after treatment." | |
| Interview, physical examination, laboratory test, evaluation for pain, standardised questionnaire for the occurrence of systemic side effects (e.g. vertigo, tinnitus). Diminished hearing was verified with audiometer. Laboratory test. | Quote: "Investigators observed each participant each day that the topical creams were administered and at follow‐up study visits (days 50‐100‐180). Clinical and laboratory evidence of side effects was determined on D10 and D20." | I1: WR 279,396 I2: placebo | Intervention 50 participants evaluated for AEs. Erythema at the site of application: 15 (30%); mild pain within 30 minutes of application: 7 (14 %); mild increases and decreases in hearing acuity from baseline: 14 (28%); change hearing acuity: 14 (28%); vertigo: 0 (0%); Increase serum creatinine: 0 (0%); Death: 0 (0%) Placebo 42 participants evaluated for AEs. Erythema at the site of application: 10 (24%); mild pain within 30 minutes of application: 6 (14 %); mild increases and decreases in hearing acuity from baseline: 9 (21%); change hearing acuity: 9 (21%); vertigo: 0 (0%); increase serum creatinine: 0 (0%); death: 0 (0%) | |
| Quote: "Participants were interviewed and underwent laboratory tests three times" | Quote: "In Allopurinol group, the participants which were visited and received medication underwent laboratory tests three times (before, one month a2fter, and end of the treatment) | I1: azithromycin + allopurinol I2: IMMA | Intervention 1 36 participants evaluated for AEs. Gastrointestinal complaints and headache severe: 1 (2.7%); slight gastrointestinal complications (nausea, heartburn, and epigastric pain): 3 (8.3%) Intervention 2 35 participants evaluated for AEs. Myalgia: 2 (5.7%) |
AE: adverse effect; IMMA: intramuscular meglumine antimoniate.
| Study | Method of assessment | Timing | Interventions | Adverse effects |
| Clinical evaluation and laboratory tests | Days 15, 45 and 105 | I1: paromomycin I2: placebo | 126 participants evaluated for AEs. During treatment: oedema, local pain, vesiculation: 1 (0.7%) After treatment: redness, pain, vesiculation, and inflammation: 8 (6.3%) Quote: "There were no significant differences in four laboratory test results of safety (SGOT, BUN, Hb, and WBC) between the groups either before or after treatment." | |
| Clinical evaluation, physical examination, advice to participants, laboratory test: liver function, haemoglobin and white blood cell count | Days 15, 45 and 105 | I1: paromomycin I2: placebo | 57 participants evaluated for AEs. Quote: "A local reaction (inflammation, vesication, pain and/or red ness) was recorded for 12 participants, with no significant difference between the 2 groups." Laboratory test changes: 0 (0%) | |
| Not described | At the end of treatment (day 30) and 1 month post‐treatment | I1: paromomycin + MBCL I2: oral ketoconazole | 40 participants (62 lesions) evaluated for AEs Quote: "Treatment‐related adverse effects were only observed in the paromomycin group. The most common side‐effect was the development of irritant contact dermatitis. No subjects withdrew because of this adverse effect." | |
| Clinical evaluation | Days 15, 29, 45 and 105 | I1: paromomycin I2: placebo | 108 participants evaluated for AEs. Quote: "Treatment was well tolerated, and no adverse reactions to the ointment were observed or reported in either group." | |
| Not described | Quote "Clinical evaluation and follow‐up were performed fortnightly until 1 month post treatment and then monthly until 3 months post treatment, and finally every 3 months until 1 year post treatment" | I1: paromomycin + urea I2: ILMA weekly | Not described | |
| Not described | Week 1 and week 6 post‐treatment and at 6 months after treatment was completed | I1: paromomycin + urea I2: ILMA weekly | 30 participants evaluated for AEs. Cutaneous reactions (erythematosus, urticaria or lymphadenitis with pain): 1 (3%) Quote: "No systemic toxic reaction attributable to the drug was observed." | |
| Clinical evaluation | Days 7, 14, 21 and 30 | I1: paromomycin I2: placebo | 30 participants evaluated for AEs. Mild contact dermatitis: 3 (10%) | |
| Not described | Weekly during treatment and monthly for up 2 months | I1: photodynamic therapy I2: paromomycin I3: placebo | 19 participants (34 lesions) evaluated for AEs. Quote: "Adverse side‐effects seen in some participants in all groups were pruritus, burning, redness, discharge, oedema, and pain, but all were generally mild and tolerable." | |
| Quote: "Renal toxic effects and ototoxic effects from aminoglycoside exposure were ascertained by means of serum creatinine measurements at the end of therapy (at 20 days) and participants' daily reports of tinnitus and vertigo." | Quote: "Safety end points were assessed daily during therapy (20 days)." | I1:Paromomycin ‐Gentamicin I2: paromomycin Alone I3: vehicle Control | Intervention 1: 125 participants evaluated for AEs. Erythema: 6 (5%); local infection: 0 (0%); inflammation: 0 (0%); vesicles mild‐moderate: 31 (25%); mild oedema: 2 (2%); pain: 2 (2%); mild bronchitis: 5 (4%); paronychia: 2 (2%); superinfection: 3 (2%); upper respiratory tract infection: 0 (0%); oropharyngeal pain: 4 (3%); skin irritation: 3 (2%); tinnitus: 0 (0%); vertigo: 0 (0%); creatinine serum changes: 0 (0%) Intervention 2: 125 participants evaluated for AEs. Erythema: 7 (6%); local infection: 0 (0%); inflammation: 0 (0%); vesicles mild‐moderate: 32 (26%); mild‐moderate oedema: 3 (3%); pain: 2 (2%); bronchitis mild‐moderate: 3 (3%); paronychia: 0 (0%); superinfection: 0 (0%); upper respiratory tract infection: 2 (2%); oropharyngeal pain: 3 (2%); skin irritation: 9 (7%); tinnitus: 0 (0%); vertigo: 0 (0%); creatinine serum changes: 0 (0%) |
AE: adverse effect; BUN: blood urea nitrogen; Hb: haemoglobin; ILMA: intralesional meglumine antimoniate; SGOT: serum glutamic‐oxaloacetic transaminase; WBC: white blood cells.
| Study | Method of assessment | Timing | Interventions | Adverse effects |
| Not described | Quote: "Participants were seen at 10‐15 day intervals after injection, and at 6 weeks post treatment" | I1: IL 2% zinc sulphate I2: IL 7% sodium chloride I3: ILSSG 2‐5 mL per lesion | 19 participants evaluated for AEs. Quote: "Apart from pain at the time of injection, no appreciable side‐effect was noted." | |
| Not described | Not described | I1: IL zinc sulphate I2: ILMA weekly | 31 participants evaluated for AEs. Severe pain caused vasovagal shock: 2 (6.4%) | |
| Not described | Not described | I1: IL zinc sulphate I2: ILMA weekly | 36 participants evaluated for AEs. Pain: 13 (36.1%); burning at site injection: 3 (8.4%); itching: 3 (8.4%); inflammation: 7 (19.4%) | |
| Not described | 14, 28, 42, and 56 days after starting the treatment | I1: IL 2% zinc sulphate I2: ILMA weekly | 24 participants evaluated for AEs. Quote: "The side effects seen in both groups were pain after injection and hyperpigmentation." Burning after injection and necrosis of the lesions: 24 (100%); inflammation and swelling: 3 (12.5%) |
AE: adverse effect; IL: intralesional; ILMA: intralesional meglumine antimoniate; ILSSG: intralesional sodium stibogluconate.
| Study | Method of assessment | Timing | Interventions | Adverse effects |
| Not described | Quote: "Participants were seen at 10‐15 day intervals after injection, and at 6 week post treatment" | I1: IL 2% zinc sulphate I2: IL 7% HSCS I3: ILSSG 2‐5 mL per lesion | 17 participants evaluated for AEs. Quote: "No side‐effect other than pain at the time of injection was noted." | |
| Not described | Not described | I1: IL 5% HSCS I2: ILMA 0.5‐1 mL/week | 36 participants evaluated for AEs. Allergic reaction (erythema, oedema, and pruritus): 0 (0%); sporotrichoid dissemination: 3 (8.3%) | |
| Not described | Quote: "Participants were seen weekly for the first three injections; fortnightly for the fourth and fifth injections; then monthly until cure. Participants were followed‐up every 3 months after cure for 18 months to assess recurrences and evidence of visceralization." | I1: ILSSG I2: IL 7% HSCS | 67 participants evaluated for AEs. Leishmaniasis recidivans: 0 (0%) Quote: "There were no systemic side effects with SSG or HS. Pain during injection was the only local side effect noted with both therapies. After healing, scarring was minimal, but postinflammatory hyperpigmentation was observed in all participants for both treatments, which faded out over 6–8 months." |
AE: adverse effect; IL: intralesional; ILSSG: intralesional sodium stibogluconate; HSCS: hypertonic sodium chloride solution.
| Study | Method of assessment | Timing | Interventions | Adverse effects |
| Not described | 1, 3, 4, 8, 12 and 24 weeks after treatment | I1: CO₂ I2: IMMA 50 mg/kg/d | 123 participants evaluated for AEs. Quote: "Complications were seen in (4) 4.5% of participants and included hyperpigmentation, persistent redness." Hypertonic scars: 5 (4%) | |
| Quote: "Follow‐up was performed and any side‐effects were recorded." | Quote: "Follow‐up evaluation was performed by clinical assessment of treated lesions at weeks 2, 6, 12 and 16." | I1: CO₂ I2: cryotherapy + MA | 80 participants (95 lesions) evaluated for AEs. Hyperpigmentation + trivial scar: 20 (25%); atrophic scar: 7 (8.75%); hypertrophic scar: 1 (1.25%); sporotrichoid: 1 (1.25%); raised papular lesions: 1 (1.25%); persistent erythema: 3 (3.75%); hypopigmentation + trivial scar: 4 (5%) | |
| Not described | Quote: "Participants were followed in the first, third, and sixth months after treatment with the final evaluation in the sixth month." | I1: ablative CO₂ laser I2: fractional CO₂ laser | Intervention 1: 30 participants evaluated for AEs. Erythema: 2 (6.7%) Intervention 2: 30 participants evaluated for AEs. Erythema: 4 (13.3%) |
AE: adverse effect; IMMA: intramuscular meglumine antimoniate; MA: meglumine antimoniate.
| Study | Method of assessment | Timing | Interventions | Adverse effects |
| Not described | Fortnightly until 6 months post‐treatment and 2 weeks and 4 weeks post‐treatment | I1: cryotherapy + ILMA I2: cryotherapy alone I3: ILMA alone | Intervention 1: 100 participants evaluated for AEs. Postinflammatory hypopigmentation: 5 (5%) Intervention 2: 200 participants evaluated for AEs. Postinflammatory hypopigmentation: 10 (5%) | |
| Not described | Not described | I1: ILMA alone I2: cryotherapy alone I3: cryotherapy + ILMA | Intervention 2: 20 participants evaluated for AEs. Erythema and oedema of the lesions and perilesional area: (28%) Intervention 3: 20 participants evaluated for AEs. Erythema and oedema of the lesions and perilesional area: (33%) Quote: "There were no serious side‐effects in any of the treatment groups" | |
| Not described | Quote: "Weekly for up to six weeks of treatment and six months after." | I1: cryotherapy I2: ILMA | 36 participants evaluated for AEs. Hypopigmentation: 2 (5.5%); hyperpigmentation: 7 (19.4%). Quote: "the most common adverse reactions were erythema and oedema of the treated site, which appeared during the initial hours of treatment, and blistering of the treatment site, which became evident 1–2 days after treatment and responded well to local treatment." | |
| Quote: "Follow‐up was performed and any side‐effects were recorded." | Quote: "Follow‐up evaluation was performed by clinical assessment of treated lesions at weeks 2, 6, 12 and 16." | I1: CO₂ I2: cryotherapy + MA | 80 participants (95 lesions) evaluated for AEs. Hyperpigmentation + trivial scar: 15 (18.7%); atrophic scar: 6 (7.5%); hypertrophic scar: 0 (0%); sporotrichoid: 0 (0%); raised papular lesions: 0 (0%); persistent erythema: 0 (0%); hypopigmentation + trivial scar: 15 (18.8%) | |
| Quote: "During these visits the healing process of the ulcer, change of diameter and induration of lesions and complications were assessed." | Quote: "The participants were evaluated every 2 weeks up to 12 weeks." | I1: cryotherapy + 3% salicylic + 3% sodium nitrite I2: cryotherapy + 3% salicylic + placebo | Intervention 1: 36 participants evaluated for AEs. Erythema, a burning sensation and skin irritation: 7 (19.4%) Intervention 2: 27 participants evaluated for AEs. Erythema, a burning sensation and skin irritation: 1 (3.7%) |
AE: adverse effect; ILMA: intralesional meglumine antimoniate; MA: meglumine antimoniate.
| Study | Method of assessment | Timing | Interventions | Adverse effects |
| Quote: "The occurrence of adverse effects was evaluated blindly by means of participant interviews and physical examinations." | Quote: "The occurrence of adverse effects was evaluated … during follow‐up visits." | I1: ILSSG 2‐5 mL per lesion I2: IMSSG 20 mg/kg I3: thermotherapy | 138‐108 participants evaluated for AEs. Secondary infections: 8 (5.7%). Quote: "The original CL ulcer often increased in size immediately after and up to 2 weeks after treatment." | |
| Quote: "Appearance of lesions at subsequent follow‐up visits and occurrence of unwanted side‐effects were also recorded on the form." | Weekly 4 weeks and monthly up to 6 months | I1: thermotherapy I2: ILMA weekly | 57 participants (83 lesions) evaluated for AEs. Satellite lesions: 1 (1.7%) | |
| Quote: "Interview, physical examination, laboratory testing (complete blood count, creatine phosphokinase, amylase, lipase, complete metabolic profile), and electrocardiograms." | Quote: "Daily for the first 10 days and follow‐up at 2, 6, and 12–24 months post treatment" | I1: thermotherapy I2: ILSSG | 27 participants evaluated for AEs. Serious AE: 4 (15%); ECG changes: 10 (37%); abdominal discomfort: 1 (4%); wound infection: 5 (19%); musculoskeletal: 5 (19%); headache: 3 (11%); fatigue: 5 (19%); rash: 1 (4%); blister reaction: 25 (93%); erythema: 7 (26%); oozing: 21 (78%) | |
| Quote: "The occurrences of adverse effects were evaluated by means of participant interviews and physical examinations during follow‐up visits." | Quote: "During treatment, all participants were then followed for four visits at weekly intervals … After initial treatment, all participants were scheduled for four subsequent follow‐up visits: 10 days after baseline and 1‐month, 2 months and 6 months after treatment." | I1: thermotherapy I2: ILMA weekly | 189 participants evaluated for AEs Not reported | |
| Not described | Not described | I1: radiofrequency heat treatment I2: ILSSG | Quote: "RFHT was cosmetically acceptable because it was associated with less scarring and hyperpigmentation compared with intralesional SSG injections." | |
| Quote: "In case of clinical signs for a superinfection, a smear was taken, Gram stained and microscopically evaluated for the presence of bacteria and/or fungi." | Quote: "Adverse events such as bacterial or fungal superinfections of the wounds, the formation or scars and the rate of re‐ulcerations were monitored during the treatment and follow‐up period." | I1: electrocauterisation + DAC N‐055. I2: electrocauterisation + placebo. | Intervention 1: 38 participants evaluated for AEs. Bacterial and fungal superinfections: 3 (8.0%); Keloïd formation: 2 (5%) Intervention 2: 32 participants evaluated for AEs. Bacterial and fungal superinfections: 3 (9.0%); Keloïd formation: 2 (6%) |
AE: adverse effect; CL: cutaneous leishmaniasis; ILMA: intralesional meglumine antimoniate; ILSSG: intralesional sodium stibogluconate; IMSSG: intramuscular sodium stibogluconate.
We describe only those outcomes with data below. If a particular primary, secondary, or tertiary outcome is missing, then this is because we did not find suitable data. Pooling of outcome data across studies to provide a summary estimate of effect was only possible for five interventions and comparisons; these investigated the effects of topical paromomycin, itraconazole, radiofrequency waves, oral dapsone, and intramuscular meglumine antimoniate (IMMA). We categorised a substantial number of the studies included in this review as being at unclear or high risk of bias (see Figure 2 and Figure 3), so readers should interpret the results with caution.
We have addressed our pre‐specified outcomes under the following intervention headings.
-
Systemic and intralesional antimonials.
-
Non‐antimonial systemic treatments.
-
Non‐antimonial topical or intralesional therapies.
-
Physical therapies.
-
Measures for promoting healing.
-
Alternative therapies.
We have also referred in the text to tables where we have summarised reports of adverse effects of the different interventions.
1. Systemic and intralesional antimonials
1.1 Meglumine antimoniate
1.1.1 Different doses of intralesional meglumine antimoniate
Primary outcome: percentage of lesions cured after the end of treatment
An RCT from Pakistan compared intralesional meglumine antimoniate (ILMA) weekly versus fortnightly, until complete cure or up to eight weeks (Mujtaba 1999). Two months after treatment, 92% (102/111) of the lesions were cured in the weekly, and 85.6% (89/104) in the fortnightly group. There was no statistical difference between weekly and fortnightly administration (risk ratio (RR) 1.07, 95% confidence interval (CI) 0.98 to 1.18; N = 215; 1 study, Analysis 1.1).
Secondary outcome: speed of healing (time taken to be 'cured')
Most lesions had healed at six weeks in both groups with minimal or absent scarring.
Secondary outcome: adverse effects
Authors did not report adverse effects in any of the participants, except transient pain at the site of the injections in both groups.
1.1.2 Intralesional versus intramuscular meglumine antimoniate
Primary outcome: percentage of lesions cured after the end of treatment
One RCT from Saudi Arabia compared ILMA every other day versus IMMA 6 days a week, over a 30‐day period until the lesions had blanched (Alkhawajah 1997). The authors reported a comparable cure rate: 68.6% (48/70) and 59.7% (46/77) of the of lesions in the respective groups at the end of the treatment period (RR 1.15, 95% CI 0.90 to 1.46; N = 147; 1 study, Analysis 2.1).
Secondary outcome: adverse effects
Regarding adverse effects, both groups reported pain at the site of injection, but it was greater in the ILMA group.
1.1.3 Different doses of IMMA
Primary outcome: percentage of lesions cured after the end of treatment
An RCT from Syria compared IMMA 60 mg/kg/d plus placebo versus IMMA 30 mg/kg/d plus placebo or cimetidine for three weeks (Shanehsaz 2015). Three months after treatment, 91.1% (82/90) of the lesions were cured in the IMMA 60 mg plus placebo group, 84.6% (127/150) in the IMMA 30 mg plus cimetidine group, and 78.3% (94/120) in IMMA 30 mg plus placebo group. We did not find any significant differences in cure rates between the IMMA 30 mg plus cimetidine group versus the IMMA 30 mg plus placebo group (RR 1.08, 95% CI 0.96 to 1.21; N = 270; 1 study, Analysis 3.1) or between the IMMA 30 mg plus cimetidine group versus the IMMA 60 mg group (RR 0.93, 95% CI 0.85 to 1.02; N = 240; 1 study, Analysis 4.1). Cure rates were significantly higher in the IMMA 60 mg group compared with the IMMA 30 mg plus placebo group (RR 1.16 95% CI 1.04 to 1.30; N = 210; 1 study, Analysis 5.1).
Primary outcome: percentage of participants with a complete cure after the end of treatment
A pooled analysis of two trials showed that cure rates in the IMMA 60 mg group were better than in the IMMA 30 mg plus placebo group (RR 0.83, 95% CI 0.71 to 0.96; N = 148; Nilforoushzadeh 2008; Shanehsaz 2015, Analysis 6.1). We assessed the certainty of evidence as low, which means we are uncertain whether there is much difference in cure rate between these two concentrations of IMMA.
An RCT from Iran compared IMMA 60 mg/kg/d plus placebo versus IMMA 30 mg/kg/d plus placebo or omeprazole for three weeks (Nilforoushzadeh 2008). Three months after treatment, there was complete cure in 93% (40/43) of participants in the IMMA 60 mg plus placebo group, 89% (32/36) in the IMMA 30 mg plus omeprazole group, and 80% (36/45) in the IMMA 30 mg plus placebo group. There were no significant differences in cure rates in any comparisons: IMMA 30 mg plus omeprazole versus IMMA 60 mg (RR 0.96, 95% CI 0.83 to 1.10; N = 79; 1 study, Analysis 7.1), IMMA 30 mg plus placebo versus IMMA 60 mg plus placebo (RR 0.86, 95% CI 0.73 to 1.02; N = 88; 1 study, Analysis 8.1), or IMMA 30 mg plus omeprazole versus IMMA 30 mg plus placebo (RR 1.11, 95% CI 0.92 to 1.34; N = 81; 1 study, Analysis 9.1).
Secondary outcome: adverse effects
Regarding adverse effects, Shanehsaz 2015 reported serious adverse effects in 83.3% (n = 25) participants in the IMMA 60 mg dose group and 60% (n = 18) participants in the IMMA 30 mg group; 40% (n = 12) of participants in the IMMA 60 mg dose group and 23.3% (n = 7) in the 30 mg group experienced skin hypersensitivity, while there were five and three cases, respectively, of cardiac toxicity (QT prolongation) (Analysis 6.2). Hence, there were fewer serious adverse effects (RR 0.72, 95% CI 0.52 to 1.00; N = 60, 1 study), fewer skin reactions (RR 0.58, 95% CI 0.27 to 1.28; N = 60, 1 study), and less QT prolongation (RR 0.60, 95% CI 0.16 to 2.29; N = 60, 1 study) in the IMMA 30 mg plus placebo group, but none of the results were significant.
In Nilforoushzadeh 2008, the authors reported one case of anaphylactic shock to meglumine antimoniate (not described).
1.1.4 ILMA alone versus ILMA plus silver or non‐silver dressing
Primary outcome: percentage of lesions cured after the end of treatment
One RCT from Iran compared weekly injections of ILMA for 6 weeks alone versus ILMA at the same dose plus silver or non‐silver dressing (Khatami 2013). We performed an ITT analysis considering the lesions allocated in each arm at the beginning of the study: 26 participants with 45 lesions in the ILMA‐alone group, 31 participants with 60 lesions in the ILMA plus silver dressing group, and 26 participants with 53 lesions in the ILMA plus non‐silver dressing group. At one month after treatment, 35.5% (16/45) of lesions were cured in the ILMA‐alone group, 33.3% (20/60) in the ILMA plus silver dressing group, and 35.8% (19/53) in the ILMA plus non‐silver dressing group. There were no significant differences in cure rates between groups: ILMA plus non‐silver dressing versus ILMA alone (RR 1.01, 95% CI 0.59 to 1.72; N = 98, Analysis 10.1); ILMA plus silver dressing versus ILMA alone (RR 0.94, 95% CI 0.55 to 1.60; N = 105, Analysis 11.1); or ILMA plus silver dressing versus ILMA plus non‐silver dressing (RR 0.93, 95% CI 0.56 to 1.54; N = 113, Analysis 12.1).
Secondary outcome: adverse effects
Regarding adverse effects, participants reported itching and burning in 7.5% (n = 3) of lesions in ILMA alone group, 10.9% (n = 6) of lesions in the ILMA plus silver group, and 17.7% (n = 8) lesions in the ILMA plus non‐silver group; there was also oedema in 12.5% (n = 5), 7.2% (n = 4), and 6.6% (n = 3) of the lesions, respectively. One lesion in each group showed exudation, and another lesion was accompanied by dermatitis in the ILMA plus non‐silver group. There were no significant differences in any adverse effects rates in any comparison (Analysis 10.2; Analysis 10.3; Analysis 11.2; Analysis 11.3; Analysis 12.2; Analysis 12.3).
1.1.5 ILMA plus gel mask versus ILMA plus vehicle
Primary outcome: percentage of participants with a complete cure after the end of treatment
One RCT from Iran compared ILMA (weekly injections for six weeks) plus gel mask twice a day with ILMA (weekly injections for six weeks) plus placebo (Mostafavi 2013). At the end of treatment, 75% (15/20) and 65% (13/20) of participants, respectively, had complete cure. There were no significant differences in cure rates between groups (RR 1.15, 95% CI 0.77 to 1.74; N = 40; 1 study, Analysis 13.1).
Secondary outcome: adverse effects
Regarding adverse effects, none of the participants from either group suffered severe adverse effects such as local irritation or pruritus.
1.2 Sodium stibogluconate
1.2.1 Intralesional versus intramuscular sodium stibogluconate (SSG)
Primary outcome: percentage of lesions cured after the end of treatment
An RCT from Iran compared ketoconazole 200 mg three times daily for four weeks plus intralesional sodium stibogluconate (ILSSG) (100 mg/mL on days 1, 3, and 5) versus intralesional plus intramuscular sodium stibogluconate (20 mg/kg/d intralesionally on days 1, 3, and 5, and 80 mg/kg/d intramuscularly simultaneously) versus ILSSG alone (100 mg/mL on days 1, 3, and 5) (El‐Sayed 2010). The authors reported that two months after treatment, 92.3% (12/13), 93.3% (14/15), and 58.3% (7/12) of lesions were cured in the respective groups. There were no significant differences between intralesional plus intramuscular SSG versus ILSSG alone (RR 1.60, 95% CI 0.97 to 2.63; N = 27; 1 study, Analysis 14.1).
Primary outcome: percentage of participants with a complete cure after the end of treatment
An RCT from Afghanistan compared ILSSG (five injections of 2 mL to 5 mL every 5 to 7 days, depending on lesion size) for up to 29 days versus intramuscular sodium stibogluconate (IMSSG) (20 mg/kg/d for 21 days) (Reithinger 2005). Two months after treatment, 47.3% (70/148) and 18% (26/144) of participants had complete cure in the ILSSG and IMSSG groups, respectively (RR 2.62, 95% CI 1.78 to 3.86; N = 292; 1 study, Analysis 15.1).
Secondary outcome: speed of healing (time taken to be 'cured')
In Reithinger 2005, the speed of healing took a median of 75 days in the ILSSG group and 100 days or more for the IMSSG group (the original paper reported that the time to cure was significantly shorter for participants treated with thermotherapy; P = 0.003, by the log‐rank test).
Secondary outcome: adverse effects
Regarding adverse effects, Reithinger 2005 reported that one participant experienced bradycardia and one an undefined local reaction in the ILSSG group. In the IMSSG group, one participant reported bradycardia, one tachycardia, and one palpitation. There were no significant differences in adverse effects rates between groups (RR 0.32, 95% CI 0.03 to 3.08; N = 292; 1 study, Analysis 15.2). In El‐Sayed 2010, all participants from ILSSG group suffered pain and swelling at the intralesional site, which calmed on its own within two days. IMSSG was associated with pain at the injection site.
2. Non‐antimonial systemic treatments
2.1 Oral antifungals
2.1.1 Different doses of ketoconazole
Primary outcome: percentage of participants with a complete cure after the end of treatment
An RCT from Kuwait compared oral ketoconazole at 600 mg/d versus 800 mg/d for six weeks or until the participant was cured, whichever occurred earlier (Alsaleh 1995). The authors reported that at the end of treatment, 66.7% (12/18) and 60% (9/15) of participants in the respective groups had a complete cure (RR 1.11, 95% CI 0.66 to 1.88; N = 33; 1 study Analysis 16.1). Thereafter, investigators followed up participants every one to two months for a period of six months, with no change.
Secondary outcome: adverse effects
None of the participants from either group relapsed during a six‐month follow‐up. With regard to adverse effects, one participant had nausea and vomiting in the ketoconazole 800 mg/d group. There were no significant differences in adverse effects rates between groups (RR 0.28, 95% CI 0.01 to 6.43; N = 33; 1 study, Analysis 16.2).
2.1.2 Ketoconazole versus ILMA
Primary outcome: percentage of participants with a complete cure after the end of treatment
An RCT from Iran compared oral ketoconazole 600 mg/d for 30 days versus six to eight injections of ILMA, biweekly (Salmanpour 2001). The authors reported that six weeks after treatment, 89% (57/64) and 72% (23/32) of participants in the respective groups had a complete cure. There were no significant differences between groups (RR 1.24, 95% CI 0.98 to 1.56; N = 96; 1 study, Analysis 17.1).
Secondary outcome: adverse effects
In the ketoconazole group the most common side effect cited was nausea and abdominal pain, and liver enzymes doubled in two participants, returning to normal two weeks after the end of treatment. There were no significant differences in adverse effects rates between groups (RR 2.54, 95% CI 0.13 to 51.36; N = 96; 1 study, Analysis 17.2). In the ILMA group, the most common side effect was redness and swelling after the injection. None of the side effects were significant enough to discontinue treatment.
2.1.3 Ketoconazole plus ILSSG versus ILSSG alone versus ILSSG plus IMSSG
Primary outcome: percentage of lesions cured after the end of treatment
An RCT from Iran compared oral ketoconazole plus ILSSG for four weeks versus ILSSG plus IMSSG versus ILSSG alone (El‐Sayed 2010). The authors reported that two months after treatment, 92.3% (12/13), 93.3% (14/15), and 58.3% (7/12) of the lesions were cured in the respective groups. There were no significant differences between comparisons of either ketoconazole plus ILSSG versus ILSSG alone (RR 1.58, 95% CI 0.96 to 2.62; N = 25; 1 study, Analysis 18.1) nor between ketoconazole plus ILSSG versus ILSSG plus IMSSG (RR 0.99, 95% CI 0.80 to 1.22; N = 28; 1 study, Analysis 19.1).
Secondary outcome: adverse effects
Regarding adverse effects, in one trial all participants complained of pain and swelling at the intralesional injection site that subsided on its own within days; no participants in the oral ketoconazole group reported adverse effects (El‐Sayed 2010).
We also found one trial comparing oral ketoconazole with topical paromomycin/MBCL (Özgöztasi 1997); we assess this comparison in the topical paromomycin section (section 3.2 below).
2.1.4 Itraconazole versus placebo
Primary outcome: percentage of participants with a complete cure after the end of treatment
Three RCTs compared itraconazole versus placebo and reported complete cure three months after the end of treatment as a primary outcome (Al‐Fouzan 1991; Dogra 1996; Nassiri‐Kashani 2005). Although heterogeneity was high (P = 0.02; I² = 73%), the three studies obtained results favouring itraconazole, so we decided to maintain the pool of results and the meta‐analysis (RR 3.70, 95% CI 0.35 to 38.99; N = 244; 3 studies, Analysis 22.1).
Please see summary of findings Table for the main comparison, where we assessed the certainty of evidence as very low, which means we are very uncertain about the difference in cure with itraconazole compared to placebo.
Two RCTs evaluated complete cure of participants at other time points. An RCT from Iran compared oral itraconazole for three weeks versus placebo (Momeni 1996). Fifty‐one days after treatment, results showed complete cure of participants in 51.4% (36/70) and 38.6% (27/70) of the participants, respectively. There were no significant differences in cure rates between groups (RR 1.33, 99% CI 0.82 to 2.18; N = 140; 1 study, Analysis 21.1). An RCT from India compared oral itraconazole for six weeks with placebo (Dogra 1992). At the end of the treatment period, 75% (15/20) of participants in the oral itraconazole group and 0% (0/20) of the participants in the placebo groups achieved a complete cure. There were no statistically significant differences in cure rates between groups (RR 31.00, 99% CI 0.83 to 1151.33; N = 40; 1 study, Analysis 20.1).
Secondary outcome: adverse effects
In Al‐Fouzan 1991, two participants from the itraconazole group reported nausea and headache during the course of treatment, and one participant had elevated liver enzymes that returned back to normal upon discontinuation of the drug. Dogra 1992 reported nausea in 12 cases (30%) between the itraconazole and dapsone groups. In the itraconazole group, two participants (10%) also had mildly abnormal liver function that reverted after completion of therapy. In Momeni 1996, six participants in the itraconazole group and four participants in the placebo group complained of mild abdominal pain and nausea. None of the laboratory values were outside normal limits. In Dogra 1996, one participant showed abnormal liver function and one nausea in the itraconazole group. Participants in the placebo group did not report adverse effects. In Nassiri‐Kashani 2005, the most common adverse effects were gastrointestinal complaints and headache – reported only in the itraconazole group during the follow‐up period. Participants in the placebo group reported adverse effects only during the treatment period.
Participants of itraconazole group had more side effects, including mild abdominal pain and nausea (RR 2.36, 95% CI 0.74 to 7.47; 3 studies, N = 204, Analysis 22.2) as well as mild abnormal liver function (RR 3.08, 95% CI 0.53 to 17.98; N = 84, 3 studies, Analysis 22.2). However, the very low certainty of the evidence means we are uncertain about these results (summary of findings Table for the main comparison).
Tertiary outcomes: microbiological or histopathological cure of skin lesions
In Dogra 1996, parasitological cure was significantly higher (Fisher's exact test P = 0.048) in participants receiving itraconazole compared to placebo. Parasitological cure occurred in 80% (8/10) of itraconazole‐treated participants but in none of the participants in the placebo group at six weeks follow‐up (RR 17.0, 95% CI 0.47 to 612.21; N = 20; 1 study, Analysis 22.3).
Please see summary of findings Table for the main comparison where we assessed the certainty of evidence.
2.1.5 Itraconazole versus no treatment
Primary outcome: percentage of participants with a complete cure after the end of treatment
An RCT from India compared oral itraconazole 200 mg/d for six weeks versus no treatment (Dogra 1990). The authors reported complete cure of participants in 66.7% (10/15) of the treatment group but in none of the no treatment group. Low statistical power meant that these differences could have been due to chance (RR 7.88, 99% CI 0.23 to 265.70; N = 20; 1 study, Analysis 23.1).
Secondary outcomes: duration of remission and percentage of people with treated lesions that recur within six months, one year, two years, and three years
Participants responding to therapy had no relapses at three‐month follow‐up.
Secondary outcome: adverse effects
Regarding adverse effects, the drug was generally well tolerated, although 20% (3/15) of participants in the itraconazole group reported mild headache and dizziness. There were no significant differences in adverse effects rates between groups (RR 2.63, 95% CI 0.16 to 43.63; N = 20; 1 study, Analysis 23.2).
Tertiary outcomes: microbiological or histopathological cure of skin lesions
At six weeks, 66.7% (10/15) of the participants in the itraconazole group were free of parasites. Untreated participants were still parasitologically active. Low statistical power meant that these differences could have been due to chance (RR 7.88, 95% CI 0.54 to 114.56; N = 20; 1 study, Analysis 23.3).
2.1.6 Fluconazole versus placebo
Primary outcome: percentage of lesions cured after the end of treatment
One RCT from Aleppo, Syria compared fluconazole 200 mg/d for six weeks versus placebo (Dandashli 2005). The authors reported that at the end of treatment, 28.4% (75/264) of the lesions in the fluconazole group and 9.8% (10/102) in the placebo group had completely resolved. Cure rates were higher in the oral fluconazole group compared with placebo (RR 2.90, 95% CI 1.56 to 5.38, Analysis 24.1).
Primary outcome: percentage of participants with a complete cure after the end of treatment
One RCT from Saudi Arabia compared oral fluconazole 200 mg/d versus placebo for six weeks (Alrajhi 2002). Three months after treatment, 59% (63/106) participants in the oral fluconazole and 21% (22/103) in the placebo group had achieved complete cure (RR 2.78, 95% CI 1.86 to 4.16; N = 209; 1 study, Analysis 24.2).
Secondary outcome: speed of healing (time taken to be 'cured')
Only Alrajhi 2002 reported the speed of healing, finding that this took a median of 8.5 weeks in the fluconazole group and 11.2 weeks in the placebo group (the original paper reported that the time to cure was significantly shorter for participants treated with thermotherapy; P < 0.001, by the log‐rank test). Also, none of the participants with complete healing had a relapse during a mean follow‐up of seven months.
Secondary outcome: adverse effects
In both studies participants from reported mild and similar side effects, although the authors did not describe them (Alrajhi 2002; Dandashli 2005).
2.1.7 Different doses of fluconazole
Primary outcome: percentage of participants with a complete cure after the end of treatment
One RCT from Iran compared oral fluconazole 400 mg/d versus 200 mg/d for six weeks (Emad 2011). The authors reported that at the end of treatment, 48.3% (29/60) of participants in the 200 mg group and 81% (47/58) in the 400 mg group achieved complete cure (RR 1.68, 95% CI 1.25 to 2.24; N = 118; 1 study, Analysis 25.1).
Secondary outcome: adverse effects
Regarding adverse effects, two participants in the 400 mg group discontinued treatment because of a rise of serum creatinine and liver enzymes. Participants in the 400 mg group reported 45 (75%) cases of cheilitis and 10 (16.6%) cases of nausea, compared to none in the 200 mg group (cheilitis: RR 94.08, 95% CI 5.93 to 1492.36; nausea: RR 21.71, 95% CI 1.30 to 362.21; N = 118; 1 study, Analysis 25.2).
2.2 Oral dapsone
2.2.1 Dapsone versus placebo
Primary outcome: percentage of participants with a complete cure after the end of treatment
Two RCTs comparing oral dapsone versus placebo reported complete cure after the end of treatment as a primary outcome (Dogra 1991; Dogra 1992). Although heterogeneity was high (P = 0.02; I² = 73%), both studies obtained results favouring dapsone, so we decided to maintain the pool of results and meta‐analysis (RR 24.08, 95% CI 1.44 to 403.43; N = 160; 2 studies; I² = 71%, Analysis 26.1).
Secondary outcomes: duration of remission and percentage of people with treated lesions that recur within six months, one year, two years, and three years
In Dogra 1992, participants initially responding to therapy did not relapse at follow‐up, while two cases with single lesions (10%) demonstrated spontaneous healing in the placebo group at three months' follow‐up.
Secondary outcome: adverse effects
Regarding adverse effects, 30% (n = 12) of participants in the dapsone group experienced nausea. In Dogra 1991, 5% (3/60) of participants in the dapsone group developed anaemia and 15% (9/60), nausea. Nausea rates were higher in the dapsone group compared with placebo (RR 21.86, 95% CI 3.04 to 157.29; N = 160; 2 studies; I² = 0%, Analysis 26.2).
Tertiary outcomes: microbiological or histopathological cure of skin lesions
Regarding the parasitological cure, 5% (3/60) of participants in the placebo group showed healing with negative smears one month after treatment (Dogra 1991).
2.3 Oral allopurinol
2.3.1 Allopurinol versus IMMA
Primary outcome: percentage of participants with a complete cure after the end of treatment
An RCT from Iran compared oral allopurinol 15 mg/kg/d for three weeks versus IMMA 30 mg/kg/d for two weeks versus oral allopurinol 15 mg/kg/d plus IMMA 30 mg/kg/d simultaneously, using the same dosage schedule (Esfandiarpour 2002). The authors reported that 18% (9/50) of participants receiving allopurinol alone achieved complete cure, compared to 24% (12/50) in the IMMA group and 46% (23/50) in the allopurinol plus IMMA group at the end of the treatment period. The group receiving allopurinol plus IMMA had better cure rates than those receiving allopurinol alone (RR 3.83, 95% CI 1.71 to 8.60; N = 100; 1 study, Analysis 27.1) or IMMA alone (RR 1.92, 95% CI 1.08 to 3.41; N = 100; 1 study, Analysis 28.1). There was no difference regarding cure rates between the groups receiving allopurinol alone versus IMMA alone (RR 0.75, 95% CI 0.35 to 1.62; N = 100; 1 study, Analysis 29.1).
An RCT from Iran compared oral allopurinol 20 mg/kg/d plus IMMA 10 mg/kg/d versus IMMA 20 mg/kg/d alone for up to 28 days (Ejaz 2014). There was no data to address the primary outcome of percentage of participants with a complete cure.
Another RCT in an Iranian army camp compared oral allopurinol 20 mg/kg/d plus low‐dose IMMA 30 mg/kg/d for 20 days versus IMMA 60 mg/kg/d for 20 days (Momeni 2002). In this trial the authors reported that 51 days after treatment, 69% (25/36) and 72% (26/36) of participants, respectively, achieved a complete cure (RR 0.96, 95% CI 0.71 to 1.29; N = 72; 1 study, Analysis 30.1).
Secondary outcome: adverse effects
Esfandiarpour 2002 observed a few adverse effects in the allopurinol group: three participants experienced nausea and heartburn, and two saw a mild increase in serum glutamic‐oxaloacetic transaminase and serum glutamic pyruvic transaminase levels. In Momeni 2002 participants tolerated the drugs well, and only 17% (6/36) in the combined treatment group complained of mild abdominal pain and nausea; however, 3% (1/36) of participants in the IMMA group developed skin eruption, and 11% (4/36) suffered generalised muscle pain and weakness. There was no significant difference between groups in total adverse effects (Analysis 30.2). Ejaz 2014 reported secondary infection in 12.1% (n = 21) of participants in the allopurinol plus IMMA group and in 12.5% (n = 19) of participants in the IMMA group, myalgia in 5.7% (n = 10) and 7.9% (n = 12), anorexia in 7.5% (n = 13) and 5.9% (n = 9), and ECG changes in 0.6% (n = 1) and 1.98% (n = 3), respectively. In the IMMA alone group one participant suffered chest pain; two, pain at the injection site; and five, abscess. There was no significant difference regarding adverse effects rates between the two groups (Analysis 31.1).
Tertiary outcomes: microbiological or histopathological cure of skin lesions
Only one study reported that 83.3% (30/36) of participants in the allopurinol plus IMMA group and 75% (27/36) in the IMMA alone group had parasitologically free lesions one month after the end of treatment (Momeni 2002). There was no difference regarding cure rates between groups ((RR 1.11, 95% CI 0.88 to 1.41; participants = 72; studies = 1) Analysis 30.3).
2.3.2 Oral allopurinol versus intravenous sodium stibogluconate
Primary outcome: percentage of participants with a complete cure after the end of treatment
An RCT with participants from the Pakistani army compared oral allopurinol 20 mg/kg/d versus intravenous sodium stibogluconate (IVSSG) for 15 days (Mashood 2001). The authors reported at the end of the treatment period, 85% (17/20) of participants in the allopurinol group and 70% (14/20) in the IVSSG group achieved a complete cure. There was no significant difference regarding cure rates between groups (RR 1.21, 95% CI 0.86 to 1.71; N = 40; 1 study, Analysis 32.1).
Secondary outcome: adverse effects
Mashood 2001 observed adverse effects that included nausea, vomiting, anorexia, and diarrhoea in 5% (1/20) of participants in the allopurinol group and 20% (4/20) of participants in the IVSSG group. In the SSG group, 10% (2/20) of participants experienced liver abnormalities and 15% (3/20), myalgia and body aches. In the allopurinol group, 5% (1/20) had elevated liver enzymes, and 10% (2/20), macular rash, but there was no myalgia or body aches. There was no significant difference in adverse effects rates between the allopurinol group and IVSSG alone group (Analysis 32.2).
2.4 Oral antibiotics
For a summary of adverse effects of oral antibiotics please see Table 3.
2.4.1 Oral rifampicin versus placebo
Primary outcome: percentage of participants with a complete cure after the end of treatment
An RCT from Saudi Arabia compared oral rifampicin 10 mg/kg/d for four to six weeks versus placebo (Jaffar 2006). Three months after treatment, 45.7% (21/46) of participants in the oral rifampicin group and 18.8% (3/16) of the placebo group achieved complete cure. There was no difference in cure rates between oral rifampicin and placebo (RR 2.43, 95% CI 0.84 to 7.08; N = 62; 1 study, Analysis 33.1).
Two RCTs from India address the primary outcome of percentage of participants with a complete cure at the end of treatment. Kochar 2000 compared 10 mg/kg/d oral rifampicin for four weeks versus placebo, reporting that 68% (17/25) and 4% (1/25) of participants, respectively, achieved complete cure by the end of the treatment period (RR 17.00, 95% CI 2.45 to 118.19; N = 50; 1 study, Analysis 33.1). Kochar 2006 compared 10 mg/kg/d oral rifampicin plus 20 mg/d omeprazole for six weeks versus placebo, reporting that 64% (16/25) participants in the rifampicin group and 12% (3/25) in the placebo group had achieved a complete cure at the end of the treatment period (RR 5.33, 95% CI 1.77 to 16.05; N = 50; 1 study, Analysis 34.1).
Secondary outcome: adverse effects
Jaffar 2006 reported that one participant had elevated liver enzymes that returned back to normal upon discontinuation of the drug. Kochar 2000 reported that the drug was very well tolerated, and there were no adverse effects during therapy.
Tertiary outcomes: microbiological or histopathological cure of skin lesions
Kochar 2000 reported an absence of parasites in 8% (2/25) and 32% (8/25) of partially healed lesions in the rifampicin and placebo groups, respectively, at the end of treatment (RR 0.25, 95% CI 0.06 to 1.06; N = 50; 1 study, Analysis 33.2).
2.4.2 Oral terbinafine plus cryotherapy versus IMMA plus cryotherapy
Secondary outcome: speed of healing (time taken to be 'cured')
An RCT from Iran compared cryotherapy (liquid nitrogen via a cotton swab for 10 s to 25 s every two weeks for four weeks) plus either oral terbinafine 500 mg/d for four weeks or plus IMMA 15 mg/kg/d (Farajzadeh 2015). After three months' follow‐up, the crude hazard ratio was 0.53 (95% CI 0.30 to 0.98) and after adjustment for sex, it was 0.35 (95% CI 0.19 to 0.69). A Kaplan‐Meier analysis indicated that the difference in complete treatment between the groups was not significant.
2.4.3 Azithromycin with or without allopurinol versus IMMA
Primary outcome: percentage of lesions with a complete cure after the end of treatment
An RCT from Iran compared azithromycin 500 mg for five days/month up to a maximum of four months with IMMA 60 mg/kg/d for 20 days (Layegh 2007). After 16 weeks of follow‐up, 10.3% (13/29) and 34.4% (20/58) of the lesions were cured in the respective groups (RR 0.60, 95% CI 0.18 to 2.01; N = 87; 1 study, Analysis 35.1).
Primary outcome: percentage of participants with a complete cure after the end of treatment
An RCT from Iran compared azithromycin 10 mg/kg/d (maximum 500 mg/d) plus allopurinol 10 mg/kg for one month versus IMMA 20 mg/kg/d for 20 days (Dastgheib 2012); 38.9% (14/36) and 40% (14/35) of participants, respectively, had achieved complete cure at two months after treatment (RR 0.97, 95% CI 0.55 to 1.73; N = 71, Analysis 36.1). There was no statistical difference in cure rates between azithromycin plus allopurinol versus IMMA in ulcerated (P = 0.40) and non‐ulcerated (P = 0.37) lesions or with regard to the site of lesions (P = 0.30).
Secondary outcome: adverse effects
Regarding adverse effects, Dastgheib 2012 reported that one (2.7%) participant in the azithromycin plus allopurinol group had gastrointestinal complaints and severe headache, and three (8.3%) experienced slight gastrointestinal complications (nausea, heartburn, and epigastric pain). Layegh 2007 described only nausea and vomiting in two participants (9%) in the azithromycin alone group. Only Dastgheib 2012 reported myalgia in two (5.7%) participants in the IMMA group. There were no significant differences in adverse effects rates between groups (Analysis 35.2; Analysis 36.2).
2.5 Oral pentoxifylline
2.5.1 Oral pentoxifylline plus IMMA versus placebo plus IMMA
Primary outcome: percentage of participants with a complete cure after the end of treatment
An RCT from Iran compared oral pentoxifylline 400 mg three times daily plus IMMA 20 mg/kg/d versus IMMA 20 mg/kg/d plus placebo, for 20 days (Sadeghian 2006a). Three months after treatment, 81.3% (26/32) and 50% (16/32) of the participants in the respective groups had achieved complete cure (RR 1.63; 95% CI 1.11, 2.39, Analysis 37.1).
Secondary outcome: adverse effects
Regarding adverse effects, one participant in the IMMA plus placebo group had an allergic macule‐papular itchy rash. There were no significant differences in adverse effects rates between groups (RR 0.33, 95% CI 0.01 to 7.89; N = 64; 1 study, Analysis 37.2).
2.6 Oral miltefosine
2.6.1 Oral miltefosine versus IMMA
Primary outcome: percentage of participants with a complete cure after the end of treatment
An RCT in Iran compared oral miltefosine 2.5 mg/kg/d for four weeks versus IMMA 20 mg/kg/d for two weeks (Mohebali 2007). Three months after treatment, 81.3% (26/32) and 80.6% (25/31) of participants in the respective groups had achieved complete cure (RR 1.01; 95% CI 0.79, 1.28, Analysis 38.1).
An RCT from Iran compared oral miltefosine 2.5 mg/kg/d for four weeks versus IMMA 60 mg/kg/d for two weeks (Khatami 2012). At one month after treatment, 32% (10/31) and 35.7% (15/42) of the participants in the respective groups had achieved complete cure (RR 0.90, 95% CI 0.47 to 1.73; N = 73; 1 study, Analysis 39.1).
Secondary outcome: adverse effects
Mohebali 2007 did not report any relapse at six months post‐treatment. With regard to adverse effects, during the first week participants from the miltefosine group suffered from nausea, vomiting, diarrhoea, abdominal pain, and cough. Participants from the IMMA group had only diarrhoea and local pain. During the second week, participants receiving miltefosine suffered from nausea, vomiting, abdominal pain, headache, itch, and fever. Participants receiving IMMA developed those adverse effects as well as local pain, chest pain, and cough. Khatami 2012 only reported that adverse effects were higher in the miltefosine arm (nine cases versus one case).
2.7 Oral zinc sulphate
2.7.1 Different doses of oral zinc sulphate
Primary outcome: percentage of participants with a complete cure after the end of treatment
An RCT from Iraq compared oral zinc sulphate at different doses: 2.5 mg/kg/d, 5 mg/kg/d, or 10 mg/kg/d, versus no treatment (Sharquie 2001). The authors reported that 45 days after treatment, 66.7% (26/39) in the 2.5 mg/kg/d group, 73% (27/37) in the 5 mg/kg/d group, and 79% (31/39) in the 10 mg/kg/d group had achieved complete cure. In the control group, all lesions were still active at day 45. There were no significant differences in cure rates between oral zinc sulphate 2.5 mg/kg/d versus 5 mg/kg/d (RR 0.91, 95% CI 0.68 to 1.23; N = 76; 1 study, Analysis 40.1); 2.5 mg/kg/d versus 10 mg/kg/d (RR 0.84, 95% CI 0.64 to 1.10; N = 78; 1 study, Analysis 41.1); or 5 mg/kg/d versus 10 mg/kg/d (RR 0.92, 95% CI 0.71 to 1.18; N = 76; 1 study, Analysis 42.1).
Secondary outcome: speed of healing (time taken to be 'cured')
In the zinc sulphate 2.5 mg/kg/d group, the mean time taken to cure was 30.8 days (range 21 to 45): 29.96 days (range 15 to 45) in the 10 mg/kg/d group and 28.32 days (range 15 to 45) in the 10 mg/kg/d (the original paper reported that the time to cure was not statistically significant between the different treatment groups). None of the participants recovered in the control group.
Secondary outcome: prevention of scarring
In all treatment groups there was minimal or no scarring at the site of lesions.
Secondary outcome: adverse effects
Regarding adverse effects, one participant each in the 2.5 mg/kg/d, 5 mg/kg/d, and 10 mg/kg/d group had nausea and vomiting. Only one participant from the 5 mg/kg/d group had a leishmanid reaction, while two participants in the 2.5 mg/kg/d group and two from the 5 mg/kg/d group, plus one participant in the 10 mg/kg/d group, had oedema. There were no significant differences in adverse effects rates between groups (Analysis 40.2; Analysis 41.2; Analysis 42.2).
2.7.2 Oral zinc sulphate versus IMMA
Primary outcome: percentage of participants with a complete cure after the end of treatment
An RCT from Iran compared oral zinc sulphate (ZS) in a dose of 10 mg/kg/d for 45 days versus IMMA 20 mg/kg/d for up to 20 days (Yazdanpanah 2011). The authors reported that 45 days after treatment, 30.2% (8/26) and 35.5% (26/74) of the respective groups achieved complete cure (RR 0.88, 95% CI 0.46 to 1.68; N = 100; 1 study, Analysis 43.1).
Secondary outcome: adverse effects
Regarding adverse effects, the authors did not report any adverse effects in the oral zinc sulphate group, but six participants in the IMMA group dropped out because of adverse effects, including severe erythema and pruritus at inoculation site and severe muscular pain.
2.8 Oral artesunate
2.8.1 Oral artesunate plus sulphamethoxypyridazine/pyrimethamine versus placebo
Primary outcome: percentage of participants with a complete cure after the end of treatment
An RCT from Sudan compared oral artesunate plus sulphamethoxypyrazine/pyrimethamine (400 mg artesunate plus 1000 mg/50 mg sulphamethoxypyrazine/pyrimethamine for four days, four times each two weeks) versus placebo (Adam 2009). The authors reported that 72 days after treatment, 90% (18/20) and 85.7% (18/21) of the respective groups had a complete cure (RR 1.05, 95% CI 0.84 to 1.32; N = 41; 1 study, Analysis 44.1).
Secondary outcome: adverse effects
One participant in the placebo arm developed a mild skin rash with itching. There was no significant difference in biological tests (liver and renal function tests) in any of the participants before or after treatment.
3. Non‐antimonial topical or intralesional therapies
3.1 Topical antifungals
3.1.1 Topical 2% miconazole versus topical 1% clotrimazole
Primary outcome: percentage of lesions with a complete cure after the end of treatment
An RCT from Saudi Arabia compared 2% miconazole cream twice a day with 1% clotrimazole cream twice a day for 30 days (Larbi 1995). The authors reported there was no lesions healed in the miconazole group and 15% (14/89) of the lesions healed completely in the clotrimazole group at the end of treatment (RR 0.05, 95% CI 0.00 to 0.81; N = 151; 1 study, Analysis 45.1).
Secondary outcome: adverse effects
In both treatment groups, the medication was well tolerated, with no reported adverse effects.
3.1.2 Ketoconazole cream versus vehicle
Primary outcome: percentage of participants with a complete cure after the end of treatment
An RCT from Iran compared topical ketoconazole versus vehicle, twice daily for 21 days (Momeni 2003). The authors reported that 51 days after treatment, 24% (11/45) and 13% (6/45) of the participants in the respective groups achieved complete cure. There were no significant differences in cure rates between topical ketoconazole and vehicle (RR 1.83, 95% CI 0.74 to 4.53; N = 90; 1 study, Analysis 46.1).
Secondary outcome: adverse effects
Regarding adverse effects, the drugs were well tolerated, and only two participants (group unknown) complained of mild pruritus at the site of the lesions.
3.1.3 Amphotericin B versus ILMA
Primary outcome: percentage of participants with a complete cure after the end of treatment
An RCT from Iran compared topical liposomal amphotericin B (3 to 7 drops twice daily) versus ILMA (maximum 2 mL) for eight weeks (Layegh 2011). We performed an ITT analysis considering the participants allocated in each arm at the beginning of the study. After six months of follow‐up, 44% (22/50) and 48.3% (29/60) of the participants in the amphotericin B and ILMA groups, respectively, achieved complete cure (RR: 0.91, 95% CI 0.61 to 1.37; N = 110; 1 study, Analysis 47.1).
Secondary outcome: adverse effects
One (1.7%) participant in amphotericin B group presented hypersensitivity, and five (10%) mild pruritus around the lesions. Seven (11.7%) participants in the ILMA group suffered erythema and oedema at the injection site. There were no significant differences in any hypersensitivity rates (RR 3.59, 95% CI 0.15 to 86.19), mild pruritus rates (RR 13.16, 95% CI 0.75 to 232.30), or erythema and oedema rates (RR 0.08, 95% CI 0.00 to 1.36) between groups (N = 110; 1 study, Analysis 47.2).
3.2 Topical paromomycin (aminosidine)
For a summary of adverse effects of topical paromomycin please see Table 4.
3.2.1 Paromomycin versus vehicle
Primary outcome: percentage of lesions cured after the end of treatment
An RCT from Iran compared topical 15% paromomycin sulphate in 12% MBCL (PR‐MBCL) versus vehicle, twice daily for 30 days (Asilian 2006). Two months after treatment, 41.2% (14/34) and 13.3% (4/30) of the lesions in the PR‐MBCL and placebo groups, respectively, had completely healed (RR 3.09, 95% CI 1.14 to 8.37; N = 64; 1 study Analysis 48.1).
An RCT from Iran compared topical 15% paromomycin in 10% urea (PR‐U) versus vehicle, twice daily for 30 days (Iraji 2005); 12.5% (5/40) and 17.5% (7/40) of the lesions in the respective groups had healed completely one month after treatment (RR 0.71, 95% CI 0.25 to 2.06; N = 80; 1 study, Analysis 49.1).
Primary outcome: percentage of participants with a complete cure after the end of treatment
A pooled analysis of two trials showed no significant differences in cure rates between topical PR‐U and vehicle (RR 1.00; 95% CI 0.86, 1.17; Asilian 1995; Ben Salah 1995; Analysis 50.1). Please see summary of findings Table 2 where we assessed the certainty of evidence as very low, meaning that we are uncertain whether there is much difference in cure rate between paromomycin and vehicle.
An RCT from Iran compared PR‐U versus vehicle, twice daily for 14 days (Asilian 1995). Two and a half months after treatment, 63.5% (80/126) and 63.2% (79/125) of those receiving PR‐U and vehicle, respectively, achieved a complete cure.
An RCT from Tunisia compared PR‐U in soft white paraffin versus vehicle, twice daily for 14 days (Ben Salah 1995). Two and a half months after treatment (day 105), 60.6% (40/66) in each group achieved complete cure.
An RCT from Tunisia compared topical 15% paromomycin plus gentamicin 0.5% versus 15% paromomycin alone versus vehicle, daily for 20 days (Ben Salah 2013). Five and a half months after treatment (day 168), 80% (101/125), 82% (102/125) and 58% (73/125) of participants, respectively, had achieved a complete cure. Paromomycin alone (RR 1.40, 95% CI 1.18 to 1.66, Analysis 51.1) and paromomycin plus gentamicin (RR 1.38, 95% CI 1.17 to 1.64, Analysis 52.1) were more efficacious than vehicle. There was no significant difference between topical 15% paromomycin plus gentamicin 0.5% and 15% paromomycin alone (RR 0.99, 95% CI 0.88 to 1.12; N = 250; 1 study, Analysis 53.1).
Secondary outcome: prevention of scarring
Only Asilian 2006 reported that at the end of the study there was no significant difference in number of deep or disfiguring scars between the PR‐MBCL group (8/34 lesions; 23.5%) and vehicle group (3/10; 10%) (RR 2.35; 95% CI 0.69 to 8.07; N = 64; 1 study, Analysis 48.2). However, we have used the number of lesions originally randomised in presenting the data in this analysis, whereas in the original paper the authors assessed scarring only in lesions that were completely healed at the end of the study (which perhaps makes more sense as a denominator). Both methods of calculating the degree of scarring failed to show any significant differences.
Secondary outcome: adverse effects
Twelve participants between the PR‐U and vehicle groups in Ben Salah 1995 reported a local reaction (inflammation, vesiculation, pain and/or redness); 8 participants from the PR‐U group and 11 from the vehicle group in Asilian 1995 complained about redness, local pain, vesiculation, and inflammation; 3 participants in the PR‐U group in Iraji 2005 reported mild contact dermatitis; and participants in all three groups in Asilian 2006 reported mild and tolerable itch, burning, redness, discharge, oedema, and pain. In Ben Salah 2013, all adverse effects deemed by the investigators to be at least possibly related to a study treatment were reactions of mild or moderate severity at the application site. The paromomycin group reported a little more skin/local reaction (RR 1.42, 95% CI 0.67 to 3.01; N = 713, Analysis 50.2); however, the very low certainty of the evidence means we are not confident about these results (summary of findings Table 2).
Tertiary outcomes: microbiological or histopathological cure of skin lesions
In a pooled analysis of two studies comparing PR‐U versus placebo, there was no significant difference in the number of negative parasitologic smears at a mean follow‐up of 2.5 months (RR 1.03; 95% CI 0.88 to 1.20; Asilian 1995; Ben Salah 1995; Analysis 50.3). The certainty of evidence was very low, meaning we are uncertain whether there was any difference in parasitological cure between the two groups. In another study (Asilian 2006), 64.7% (22/34) in the PR‐MBCL group and 20% (6/30) in the vehicle group were parasitologically free two months after the end of treatment (RR 3.24, 95% CI 1.52 to 6.90; N = 64; 1 study, Analysis 48.3).
3.2.2 PR‐U versus ILMA
Primary outcome: percentage of participants with a complete cure after the end of treatment
An RCT from Iran compared PR‐U ointment, twice per day for a mean duration of 45 days and a maximum duration of 3 months versus ILMA weekly (Faghihi 2003). At less than two months after treatment, the authors reported complete cure of participants in 16.6% (8/48) and 41.7% (20/48) of the PR‐U and ILMA groups, respectively (RR 0.40, 95% CI 0.20 to 0.82; N = 96; 1 study, Analysis 54.1).
Another RCT from Iran compared PR‐U ointment twice a day for 20 days versus ILMA (dose unspecified) every other day for 20 days (Shazad 2005). One week after the end of treatment, 66.7% (20/30) and 60% (18/30) participants of the respective groups achieved complete cure (RR 1.11, 95% CI 0.75 to 1.64; N = 60; 1 study, Analysis 55.1).
Secondary outcomes: duration of remission and percentage of people with treated lesions that recur within six months, one year, two years, and three years
Faghihi 2003 reported a reactivation in 6.3% (3/48) of the participants in both groups at one year after complete recovery, due to lymphatic spread in the PR‐U group and non‐lymphatic spread in the ILMA group (RR 1.00, 95% CI 0.21 to 4.71; N = 96; 1 study, Analysis 54.2). Scarring occurred in 4.2% (2/48) of participants in the PR‐U group and for 8.3% (4/48) in the ILMA group (RR 0.50, 95% CI 0.10 to 2.60; N = 96; 1 study, Analysis 54.3).
Secondary outcome: adverse effects
Regarding adverse effects, Shazad 2005 reported that 1/30 in the PR‐U group and 3/30 participants in the ILMA treatment group withdrew from the study because of cutaneous reactions like erythematosus, urticaria, or lymphadenitis with pain. They were all put on systemic MA and cured thereafter. They did not observe any systemic toxic reaction attributable to the drug. There were no significant differences in adverse effects rates between groups (RR 0.33, 95% CI 0.04 to 3.03; N = 60; 1 study Analysis 55.2).
3.2.3 PR‐MBCL versus oral ketoconazole
Primary outcome: percentage of participants with a complete cure after the end of treatment
An RCT from Turkey compared topical PR‐MBCL twice per day for 15 days versus oral ketoconazole 600 mg/d for 30 days (Özgöztasi 1997). One month after the end of treatment the authors reported complete cure of participants in 37.5% (15/40) of the paromomycin group and none in the ketoconazole group (RR 24.95, 95% CI 1.55 to 401.63; N = 72; 1 study, Analysis 56.1).
Secondary outcome: adverse effects
Irritant contact dermatitis was the most common adverse effect described in the PR‐MBCL group. In contrast, the ketoconazole‐treated participants reported no adverse effects.
Tertiary outcomes: microbiological or histopathological cure of skin lesions
The PR‐MBCL and the ketoconazole groups showed incomplete improvement (absence of parasites on culture or smear): just 20% (8/40) and 21.9% (7/32) of participants, respectively, had achieved a microbiological cure at four weeks post‐treatment (RR 0.91, 95% CI 0.37 to 2.25; N = 72; 1 study, Analysis 56.2).
3.2.4 PR‐MBCL versus topical photodynamic therapy (PDT)
Primary outcome: percentage of lesions cured after the end of treatment
An RCT from Iran compared topical PR‐MBCL twice daily for 28 days versus topical PDT every week for four weeks (Asilian 2006). Two months after treatment, results showed complete cure of lesions in 41.2% (14/34) and 93.5% (29/31) of the PR‐MBCL and PDT groups, respectively (RR 0.44, 95% CI 0.29 to 0.66; N = 65; 1 study, Analysis 57.1).
Secondary outcome: prevention of scarring
At the end of the study, there was no statistical difference (Fisher's exact test P = 0.0558) in the number of deep or disfiguring scars between paromomycin (8/24) and PDT groups (0/31) (RR 15.54, 95% CI 0.39 to 625.57; N = 65; 1 study, Analysis 57.2).
Secondary outcome: adverse effects
Both groups experienced mild and tolerable itch, burning, redness, discharge, oedema, and pain.
Tertiary outcomes: microbiological or histopathological cure of skin lesions
Two months after the end of treatment, 64.7% (22/34) of the lesions in the PR‐MBCL group were parasitologically free, as were all 31 lesions in the PDT group (RR 0.65, 95% CI 0.51 to 0.84; N = 65; 1 study, Analysis 57.3).
3.2.5 Different regimens of topical paromomycin
Primary outcome: percentage of participants with a complete cure after the end of treatment
An RCT from Iran compared two tubes of 15 g of paromomycin ointment (each tube was enough for two applications per day for 14 days) for a four‐week treatment versus one tube of 15 g of paromomycin ointment for two weeks plus vehicle for two additional weeks (Asilian 2003). Two and a half months after treatment, results showed complete cure of participants in 50% (58/117) and 37% (43/116) of the four‐week and two‐week regimens, respectively. There was no significant difference in cure rates between the four‐week and the two‐week treatment (RR 1.34, 95% CI 0.99 to 1.80; N = 233; 1 study, Analysis 58.1).
Secondary outcome: adverse effects
Participants tolerated the treatment well, and investigators did not observe any adverse effect or adverse reactions to the ointment in either group.
Tertiary outcomes: microbiological or histopathological cure of skin lesions
Three months (105 days) after treatment initiation, there was a small difference in parasitological cure in favour of the four‐week regimen 49/117 (41%) versus 33/116 (28.4%) respectively (RR 1.47, 95% CI 1.03 to 2.11; N = 233; 1 study, Analysis 58.2).
3.3 Intralesional zinc sulphate
For a summary of adverse effects of intralesional zinc sulphate please see Table 5.
3.3.1 Intralesional (IL) zinc sulphate versus ILSSG versus IL hypertonic sodium chloride solution (HSCS)
Primary outcome: percentage of lesions with a complete cure after the end of treatment
An RCT from Iraq compared mono doses of IL 2% zinc sulphate solution versus ILSSG 100 mg/mL versus IL 7% HSCS (Sharquie 1997). Investigators left a few lesions on unimportant and unexposed parts of the body as controls. At six weeks after treatment, 94.8% (36/38), 88.5% (31/35), and 85% (34/40) of the lesions, respectively, had healed completely. There were no statistical differences between any comparison: 2% zinc sulphate solution versus ILSSG (RR 1.07, 95% CI 0.93 to 1.23; N = 73; 1 study, Analysis 59.1); 2% zinc sulphate solution versus IL 7% HSCS (RR 1.11, 95% CI 0.96 to 1.30; N = 78; 1 study, Analysis 60.1), or ILSSG versus IL 7% HSCS (RR 1.04, 95% CI 0.87 to 1.24; N = 75; 1 study, Analysis 61.1). In the untreated group, nine participants with 38 lesions were followed up for six weeks, showing no decrease in the size of the lesions and no disappearance of parasites.
Secondary outcome: speed of healing (time taken to be 'cured')
Sharquie 1997 reported that in the zinc sulphate group most lesions were cured by 30 days. In the HSCS and in the ILSSG group, lesions were cured after 30 days.
Secondary outcome: prevention of scarring
In all three groups the scar was minimal or absent after healing, but all participants developed postinflammatory hyperpigmentation. In the control group, some lesions (mainly on the lower limbs) showed signs of infection.
Secondary outcome: adverse effects
Regarding adverse effects, all participants from both groups in the Sharquie 1997 study had pain at the time of the injection.
3.3.2 IL zinc sulphate versus ILMA
Primary outcome: percentage of lesions with a complete cure after the end of treatment
An RCT from Iran compared IL zinc sulphate up to six times weekly versus ILMA up to six times weekly (maximum 2 mL) (Firooz 2005). At five weeks after treatment, 22.6% (12/53) and 50.9% (27/53) of the lesions in the respective groups had healed completely (RR 0.44, 95% CI 0.25 to 0.78; N = 106; 1 study, Analysis 62.1). However, baseline characteristics were unbalanced: both mean diameter induration and mean diameter ulceration were higher in the zinc sulphate group (induration: 10.0 mm (standard deviation (SD) 11.4)), and ulceration: 2.7 mm (SD 4.6)) than in the MA group (induration: 2.4 mm (SD 8.7) and ulceration 0.6 mm (SD 3.6)). However, the authors claimed that there was no significant difference between the two groups (P > 0.05; exact p value not reported).
An RCT from Iran compared two double bouts of IL zinc sulphate, delivered at a two‐week interval, versus six weekly bouts of ILMA 60 mg/kg/d (Maleki 2012). At eight weeks after starting treatment, 33.3% (8/24) and 80% (8/10) of participants achieved complete cure in the respective groups (RR 0.42, 95% CI 0.22 to 0.79; N = 34; 1 study, Analysis 63.1).
Primary outcome: percentage of participants with a complete cure after the end of treatment
One RCT from Iran compared IL zinc sulphate with ILMA at a maximum dose of 2 mL (Iraji 2004). In cases with slight to mild improvement, the authors gave another injection after two weeks. The authors reported complete cure in 53% (26/49) and 38% (21/55) of participants in the respective groups at the end of the treatment period. There were no significant differences in cure rates between groups (RR 1.39, 95% CI 0.91 to 2.13; N = 104; 1 study, Analysis 62.2).
Secondary outcome: adverse effects
In Firooz 2005, the most commonly observed adverse effect was pain, found in 25% (18/72) of participants: in 36.1% (13/36) of participants in the zinc sulphate group and 13.9% (5/36) in the ILMA group (RR 2.60, 95% CI 1.03 to 6.54, Analysis 62.3). In the zinc sulphate group, 8.4% (3/36) of participants complained about burning at the injection site. Itching occurred in 8.4% (3/36) and in 25% (9/36), and inflammation in 19.4% (7/36) and 22.2% (8/36) of the cases in the zinc sulphate and ILMA group, respectively. There were no significant differences in other adverse effects rates between groups (Analysis 62.3). Iraji 2004 reported pruritus, erythema, and scaling in the periphery of the injection site in three cases in the ILMA group; IL zinc sulphate was painful, and the severity caused vasovagal shock in two cases. There were no significant differences in skin reactions (RR 7.84, 95% CI 0.42 to 148.08; N = 104; 1 study, Analysis 62.3) or severe pain rates (RR 5.60, 95% CI 0.28 to 113.87; N = 104; 1 study, Analysis 62.3) between groups. In another study the side effects seen in both groups were pain after injection and hyperpigmentation (Maleki 2012). All participants in the zinc sulphate group experienced burning after injection and necrosis of the lesions, and three of these participants also had inflammation and swelling. There were no significant differences in inflammation and swelling rates between groups (RR 3.08, 95% CI 0.17 to 54.71; N = 34; 1 study, Analysis 63.2).
3.4 Topical imiquimod
3.4.1 Imiquimod cream versus IMMA
Primary outcome: percentage of participants with a complete cure after the end of treatment
An RCT from Iran compared 5% imiquimod cream three times per week for 28 days plus IMMA 20 mg/kg/d for 14 days versus vehicle plus IMMA at the same dose (Firooz 2006). At 3.5 months after treatment, 44.1% (26/59) and 40% (24/60) of participants in the treatment and control groups, respectively, achieved complete cure (RR 1.10, 95% CI 0.72 to 1.68; N = 119; 1 study, Analysis 64.1).
Secondary outcome: duration of remission and percentage of people with treated lesions that recur within six months, one year, two years, and three years
At four months after treatment, relapse occurred in 1/32 participants available for assessment and treated with imiquimod plus IMMA, and in 3/37 control participants (RR 0.39, 95% CI 0.04 to 3.52; N = 69; 1 study, Analysis 64.2).
Secondary outcome: adverse effects
The only adverse effects related to topical treatment were moderate itch and a burning sensation in three imiquimod‐treated participants. There were no significant differences between groups (RR 7.12, 95% CI 0.38 to 134.84; N = 119; 1 study, Analysis 64.3).
3.5 Intralesional hypertonic sodium chloride solution
For details about the adverse effects of intralesional hypertonic sodium chloride solution (HSCS) please see Table 6.
3.5.1 IL 7% HSCS versus ILSSG
Primary outcome: percentage of lesions with a complete cure after the end of treatment
An RCT from Sri Lanka compared IL HSCS (0.2 mL to 4 mL per lesion and maximum 5 injections) versus ILSSG (maximum 2 mL and 5 injections) (Ranawaka 2010). Average duration of treatment was 8.78 weeks and 5.11 weeks, respectively. At 18 months of follow‐up, 92.2% (86/96) and 100% (136/136) lesions had healed completely in the respective groups (RR 0.87, 95% CI 0.79 to 0.96; N = 147; 1 study, Analysis 65.1). There was no difference in treatment response between therapies with regard to the size, duration, or location (head, trunk, upper, and lower extremities) of the lesions.
Secondary outcome: prevention of scarring
In both groups the scar was minimal or absent after healing, but all participants developed postinflammatory hyperpigmentation.
Secondary outcome: adverse effects
There were no systemic adverse effects with ILSSG or HSCS in Ranawaka 2010. Pain during injection was the only local side effect noted with both therapies. After healing, scarring was minimal, but all participants receiving both treatments had postinflammatory hyperpigmentation, which faded over six to eight months.
3.5.2 IL 5% HSCS versus ILMA
Primary outcome: percentage of lesions cured after the end of treatment
An RCT from Iran compared IL HSCS (0.5 mL to 1 mL) with ILMA (0.5 mL to 1 mL) weekly for 6 to 10 weeks (Sadeghian 2006b). At the end of treatment, 25% (9/36) and 33.3% (12/36) lesions had healed in the respective groups (RR 0.75, 95% CI 0.36 to 1.56; N = 72; 1 study, Analysis 66.1).
Secondary outcome: adverse effects
In the HSCS group, there were three cases of sporotrichotic dissemination but with no allergic reactions. In the ILMA group, there were three cases of sporotrichotic dissemination, two satellite lesions, and two allergic reactions including redness, oedema, and severe itch around the lesions. There were no significant differences in sporotrichotic dissemination rates (RR 1.00, 95% CI 0.22 to 4.63; N = 72; 1 study) or allergic reactions rates (RR 0.20, 95% CI 0.01 to 4.03; N = 72; 1 study) between groups (Analysis 66.2).
3.5.3 IL 7% HSCS versus IL ciprofloxacin solution
Primary outcome: percentage of lesions cured after the end of treatment
An RCT from Iraq compared IL 7% HSCS (0.1 mL to 0.5 mL per lesion) with IL ciprofloxacin solution 2 mg/mL (0.1 mL to 0.5 mL per lesion) (Al Hamdi 2010). At two months after treatment, 76.2% (16/21) and 81.5% (22/27) of the lesions had healed in the respective groups. There was no difference in cure rates between IL HSCS and IL ciprofloxacin (RR 1.07, 95% CI 0.79 to 1.44; N = 48; 1 study, Analysis 67.1).
3.5.4 IL 10% HSCS versus IL 15% HSCS versus ILSSG
Primary outcome: percentage of lesions cured after the end of treatment
An RCT from Sri Lanka compared IL 10% HSCS versus IL 15% HSCS versus ILSSG (0.2 mL to 4 mL per lesion and maximum five injections) (Ranawaka 2015). The authors reported that three months after treatment, 93% (268/290), 93.6% (92/98), and 96.3% (226/235) of the lesions in the respective groups had completely healed. There was no difference in cure rates between any comparison: IL 15% HSCS versus IL 10 % HSCS (RR 1.02, 95% CI 0.96 to 1.08; N = 388, Analysis 68.1); ILSSG versus IL 10% HSCS (RR 1.04, 95% CI 1.00 to 1.08; N = 525, Analysis 69.1); and ILSSG versus IL 15% HSCS (RR 1.02, 95% CI 0.97 to 1.08; N = 333; 1 study, Analysis 70.1).
Secondary outcome: speed of healing (time taken to be 'cured')
There was no difference in speed of healing between IL 15% HSCS versus IL 10% HSCS (MD −1.45, 95% CI −4.34 to 1.44 weeks; N = 388; 1 study, Analysis 68.3). Lesions in ILSSG group cured significantly faster than in 10% HSCS group (MD −5.20, 95% CI −6.31 to −4.09 weeks; N = 525, Analysis 69.3) and in IL 15% HSCS group (MD −6.65, 95% CI −9.41 to −3.89 weeks; N = 333, Analysis 70.3).
Secondary outcome: duration of remission and percentage of people with treated lesions that recur within six months, one year, two years, and three years
After six months of follow‐up, the authors described four cases of relapse in 10% HSCS group, four cases in 15% HSCS group and three in the ILSSG group (Ranawaka 2015). There was no significant difference in this outcome in any comparisons: 15% HSCS versus 10% HSCS (RR 2.93, 95% CI 0.75 to 11.50; N = 362; 1 study, Analysis 68.2), ILSSG versus 10% HSCS (RR 0.90 95% CI 0.20 to 3.96, Analysis 69.2), and ILSSG versus 15% HSCS (RR 1.02, 95% CI 0.97 to 1.08, Analysis 70.2).
Secondary outcome: adverse effects
All participants experienced pain during injections, particularly in the 15% HSCS group. All lesions presented postinflammatory hyperpigmentation, which faded over six to eight months. Ulceration and necrosis occurred in 30% (30/98) of the lesions treated with 15% HSCS and in 3.1% (9/290) of the lesions in the 10% HSCS group. There were statistically significant differences in ulceration and necrosis rates between the IL 15% HCS group and the 10% HSCS group (RR 9.86, 95% CI 4.86 to 20.04; N = 388; 1 study, Analysis 68.4) and between the IL 15% HCS group and ILSSG group (RR 145.41, 95% CI 8.98 to 2354.65; N = 333; 1 study, Analysis 70.4), with more events in the IL 15% HCS group.
3.6 IL interferon‐gamma (IFN‐γ)
3.6.1 IL IFN‐ γ versus ILMA
Primary outcome: percentage of lesions with a complete cure after the end of treatment
An RCT from Syria compared IL IFN‐γ versus ILMA once weekly for five weeks (Harms 1991). At one month after treatment, 3% (1/37) and 76% (29/38) of the lesions had healed completely in the respective groups. The cure rates in the IL IFN‐γ group were significantly lower than in the ILMA group (RR 0.04, 95% CI 0.01 to 0.28; N = 76; 1 study, Analysis 71.1).
Secondary outcome: adverse effects
In the IFN‐γ arm, pain at the injection site of was mild on 68 occasions, moderate on 47, and severe on 38. In the ILMA group it was mild on 55 occasions, moderate on 51, and severe on 40. Other adverse effects included local maculopapular erythema in the ILMA group and headache in the IFN‐γ group.
Tertiary outcomes: microbiological or histopathological cure of skin lesions
Parasitological assessment one month after the end of treatment showed 65% (24/37) and 100% (38/38) of the lesions were parasite‐free in the IFN‐γ and ILMA groups, respectively (RR 0.65, 95% CI 0.51 to 0.83; N = 75; 1 study, Analysis 71.2).
3.7 Topical aminoglycoside ointment (WR279,396)
3.7.1 WR279,396 ointment versus placebo
Primary outcome: percentage of participants with a complete cure after the end of treatment
An RCT from Tunisia compared WR279,396 (a third generation aminoglycoside ointment) versus vehicle twice daily for 20 days (Ben Salah 2009). After a six‐month follow‐up, 86% (43/50) and 64% (27/42) of the participants in the respective groups achieved complete cure (RR 1.34, 95% CI 1.04 to 1.72; N = 92, Analysis 72.1).
Secondary outcome: adverse effects
Regarding adverse effects, 30% (n = 15) of participants from the WR279,396 and 24% (n = 10) from the vehicle groups suffered from erythema at the site of application (RR 1.26, 95% CI 0.63 to 2.50; N = 92; 1 study); 14% from both groups (n = 7 and n = 6, respectively) had mild pain within 30 minutes of application (RR 0.98, 95% CI 0.36 to 2.69; N = 92; 1 study); 28% (n = 14) and 21% (n = 9) presented mild increases and decreases in hearing acuity from baseline; 28% (n = 14) and 21% (n = 9) had changed hearing acuity (RR 1.31, 95% CI 0.63 to 2.71; N = 92; 1 study), and there were no deaths reported in either group. See Analysis 72.2.
3.8 Intralesional metronidazole
3.8.1 IL metronidazole versus ILMA
Primary outcome: percentage of participants with a complete cure after the end of treatment
An RCT compared weekly intralesional metronidazole (2.5 mg to 10 mg = 0.5 mL to 2 mL for each lesion) with weekly ILMA (150 mg to 600 mg = 0.5 mL to 2 mL for each lesion) for up to eight weeks (Mapar 2010). At the end of treatment, 16.6% (3/18) and 72.2% (13/18) of participants in the respective groups achieved complete cure (RR 0.23, 95% CI 0.08 to 0.67; N = 36, Analysis 73.1).
Secondary outcome: adverse effects
Authors did not describe any systemic or local adverse effects with metronidazole, but two participants in the ILMA group suffered local inflammatory reactions with oedema and induration that diminished in about 10 days. There were no significant differences in local inflammatory reactions rates between groups (RR 0.20, 95% CI 0.01 to 3.89; N = 36; 1 study, Analysis 73.2). In both groups the participants reported severe pain at the site of injections, but in the ILMA group it was intolerable.
3.9 Topical miltefosine
3.9.1 Topical miltefosine versus ILMA
Primary outcome: percentage of participants with a complete cure after the end of treatment
An RCT from Iran compared topical miltefosine ointment 6% once daily versus ILMA twice a week for up to 28 days (Asilian 2014). At one month after treatment, 81.3% (26/32) and 50.0% (16/32) of the participants in the respective groups achieved complete cure (RR 1.63, 95% CI 1.11 to 2.39; N = 64; 1 study, Analysis 74.1).
3.10 Topical dapsone
3.10.1 Niosomal dapsone 5% gel mask plus ILMA versus cryotherapy plus ILMA
Primary outcome: percentage of lesions cured after the end of treatment
An RCT from Iran compared niosomal dapsone 5% gel mask (twice a day) plus ILMA (weekly) versus cryotherapy (every two weeks) plus ILMA (weekly) for up to 16 weeks (Fekri 2015). At 16‐week follow‐up, 82% (29/35) and 86% (33/38) of the lesions had healed in the respective groups (RR 0.95, 95% CI 0.79 to 1.16; N = 73; 1 study, Analysis 75.1).
3.11 Topical 0.045% pharmaceutical chlorite (DAC N‐055)
3.11.1 Topical 0.045% pharmaceutical chlorite (DAC N‐055) with and without bipolar high frequency electrocauterisation versus ILSSG
Primary outcome: percentage of participants with a complete cure after the end of treatment
An RCT from Afghanistan compared 0.045% pharmaceutical chlorite (DAC N‐055) plus bipolar high frequency electrocauterisation for 15 minutes versus 0.045% DAC N‐055 for 15 minutes alone versus ILSSG 0.6 mL for up to 75 days (Stahl 2014). After a 75‐day follow‐up, the authors reported a complete cure in 100% (23/23), 87% (20/23), and 65% (15/23) of the participants in the respective groups. There was no difference between DAC N‐055 plus electrocauterisation versus DAC N‐055 alone (RR 1.15, 95% CI 0.96 to 1.37; N = 46; 1 study, Analysis 76.1). DAC N‐055 plus electrocauterisation was more efficacious than ILSSG (RR 1.52, 95% CI 1.12 to 2.05; N = 46; 1 study, Analysis 77.1), and DAC N‐055 alone was not more efficacious than ILSSG (RR 1.33, 95% CI 0.95 to 1.87; N = 46; 1 study, Analysis 78.1).
Secondary outcome: speed of healing (time taken to be 'cured')
The hazard ratio for DAC N‐055 versus ILSSG was 4.4 (95% CI 2.2 to 8.7) in the per protocol analysis (P < 0.001) and 3.2 (95% CI 1.6 to 6.3) in the intention‐to‐treat analysis (P < 0.001). The lesion closed three to four times faster in the DAC N‐055 group than in the ILSSG group.
Secondary outcome: adverse effects
Regarding adverse effects, four participants developed reulceration of lesions in the DAC N‐055 plus electrocauterisation group, three in the DAC N‐055 alone group, and seven in the ILSSG group. There were no significant differences in reulceration rates between DAC N‐055 plus electrocauterisation versus DAC N‐055 alone (RR 1.33, 95% CI 0.34 to 5.30; N = 46; 1 study, Analysis 76.2). Two participants (8.7%) developed keloids and keloid scars in the DAC N‐055 plus electrocauterisation group.
3.12 Topical Thio‐Ben
3.12.1 Topical Thio‐Ben plus cryotherapy versus ILMA plus cryotherapy
Primary outcome: percentage of lesions cured after the end of treatment
An RCT from Iran compared 1 mL to 2 mL of Thio‐Ben tincture daily plus cryotherapy (liquid nitrogen (−195°C) fortnightly versus ILMA weekly (dose of 0.5 mL to 2 mL per lesion) plus cryotherapy (Daie Parizi 2015). After three months' follow‐up 91% (20/22) and 92% (23/25) of the lesions had healed completely in the respective groups. There was no difference between Thio‐Ben plus cryotherapy and ILMA plus cryotherapy (RR 0.99, 95% CI 0.83 to 1.18; N = 47; 1 study, Analysis 79.1).
Secondary outcome: speed of healing (time taken to be 'cured')
On average, lesions required the same amount of time to achieve a complete cure: 2.45 months in the Thio‐Ben plus cryotherapy group and 2.41 months in the ILMA plus cryotherapy group (Daie Parizi 2015).
Secondary outcomes: duration of remission and percentage of people with treated lesions that recur within six months, one year, two years, and three years
The rate of relapse was slightly, but not significantly, higher in the Thio‐Ben group 20% (4/22) than in the ILMA group 13% (3/25) (RR 1.52, 95% CI 0.38 to 6.04; N = 47; 1 study, Analysis 79.2).
Secondary outcome: adverse effects
Regarding adverse effects, investigators observed itching and mild erythema in almost all cases with different degrees of severity, and oedema especially after cryotherapy in almost all lesions. Participants from the ILMA plus cryotherapy group experienced pain at the injection site in almost all cases, while three participants reported dizziness and nausea (RR 0.16, 95% CI 0.01 to 2.96; N = 47; 1 study), and one had a hypersensitive reaction (RR 0.38, 95% CI 0.02 to 8.80; N = 47; 1 study, Analysis 79.3). There was poor adherence to treatment particularly among children.
4. Physical therapies
4.1 Laser
See Table 7 for a summary of adverse effects of lasers and Table 8 for a summary of adverse effects of cryotherapy.
4.1.1 CO₂ laser versus IMMA
Primary outcome: percentage of lesions cured after the end of treatment
An RCT from Iran compared CO₂ laser applied to the lesion (30 W, continuous) versus IMMA (50 mg/kg/d) for 15 days (this treatment was repeated after 15 days of rest) (Asilian 2004b). At six weeks after treatment, 11% (20/183) and 12% (30/250) of the lesions had healed completely in the respective groups (RR 0.91, 95% CI 0.53 to 1.55; N = 433; 1 study, Analysis 80.1).
Secondary outcomes: speed of healing
The time taken to be cured was one month for the CO₂ laser group and three months for the IMMA group.
Secondary outcome: prevention of scarring
In the laser group, study authors considered most scars to be 'acceptable', except in five cases (4%) in which the lesions were located on the joints or neck, and the resulting scars were raised and hypertrophic.
Secondary outcome: adverse effects
In the laser group, 3% (4/123) of participants experienced hyperpigmentation and persistent redness (RR 12.28, 95% CI 0.67 to 226.62; N = 433; 1 study, Analysis 80.2), and five participants had hypertrophic scarring (RR 0.16, 95% CI 0.01 to 2.96; N = 47; 1 study, Analysis 80.2). In the IMMA group, 9% (22/250) of participants reported myalgia, sensitivity, headache, urticaria, and nausea; these were higher in the IMMA group than in the laser group (RR 0.03, 95% CI 0.00 to 0.50; N = 433; 1 study, Analysis 80.2).
4.1.2 CO₂ laser versus cryotherapy plus ILMA
Primary outcome: percentage of lesions cured after the end of treatment
An RCT from Iran compared CO₂ laser (30 W, continuous) applied to the lesion (repeated maximum 3 to 5 times) versus combined cryotherapy (liquid nitrogen 10 s to 25 s) biweekly plus ILMA (0.5 mL to 2 mL per lesion) weekly until complete cure or up to 12 weeks (Shamsi Meymandi 2011). At 12 weeks, 94.7% (90/95) and 77.9% (74/95) of the lesions had healed in the respective groups. CO₂ laser was more efficacious than cryotherapy plus ILMA (RR 1.22, 95% CI 1.08 to 1.37; N = 190; 1 study, Analysis 81.1).
Secondary outcomes: duration of remission and percentage of people with treated lesions that recur within six months, one year, two years, and three years
There was no worsening (increase in size of the lesions) or relapse after the two types of treatment.
Secondary outcome: adverse effects
The authors reported adverse effects to participants (80 participants per group). In the laser group, 25% (n = 20) of participants had hyperpigmentation and trivial scarring, compared to 18.7% (n = 15) in the cryotherapy plus ILMA group (RR 1.33, 95% CI 0.73 to 2.44; N = 190; 1 study); 8.75% (n = 7) and 18.8% (n = 15), respectively, had atrophic scars (RR 0.47, 95% CI 0.20 to 1.09; N = 190; 1 study), and 5% (n = 4) in the laser group only had hypopigmentation plus trivial scarring (RR 9.00, 95% CI 0.49 to 164.88; N = 190; 1 study; Analysis 81.2).
4.1.3 Ablative CO₂ laser versus fractional CO₂ laser
Primary outcome: percentage of participants with a complete cure after the end of treatment
An RCT from Iran compared ablative CO₂ laser (10 ns, frequency: use of 20 kHz, and power: 25 Kw for one session) versus fractional CO₂ laser (energy: 25, one pulse, pass: 1, dot cycle: 6) until complete cure or up to 12 weeks (Nilforoushzadeh 2014a). At six months' follow‐up, 46.7% (28/60) and 76.7% (46/60) of participants in the respective groups achieved a complete cure (RR 0.61, 95% CI 0.45 to 0.83; N = 120; 1 study, Analysis 82.1).
Secondary outcome: adverse effects
Nilforoushzadeh 2014a reported erythema in two participants (3.3%) in the ablative CO₂ laser group and four (6.7%) in the fractional CO₂ laser group (RR 0.50, 95% CI 0.10 to 2.63; N = 120; 1 study, Analysis 82.2).
4.2 Trichloroacetic acid
4.2.1 Trichloroacetic acid versus ILMA
Primary outcome: percentage of participants with a complete cure after the end of treatment
An RCT from Iran compared trichloroacetic acid (TCA) 50% (wt/vol) applied fortnightly until complete re‐epithelialisation or up to three times versus ILMA (0.5 mL to 2 mL per lesion) weekly until complete re‐epithelialisation of the lesions or up to six weeks (Nilforoushzadeh 2006). At the end of the treatment period, 65% (26/40) and 57.5% (23/40) of participants in the respective groups achieved a complete cure (RR 1.13, 95% CI 0.80 to 1.60; N = 80; 1 study, Analysis 83.1).
Secondary outcomes: duration of remission and percentage of people with treated lesions that recur within six months, one year, two years, and three years
Recurrence occurred in 12.5% (5/40) of the cases in the TCA group and 10% (4/40) in the ILMA group after three months' follow‐up (RR 1.25, 95% CI 0.36 to 4.32; N = 80; 1 study, Analysis 83.2).
Secondary outcome: adverse effects
The observed adverse effects included mild erythema and itch (two cases in the ILMA group), with no significant differences between groups (RR 0.20, 95% CI 0.01 to 4.04; N = 80; 1 study, Analysis 83.3).
Tertiary outcomes: microbiological or histopathological cure of skin lesions
Parasitological assessment at week 6 showed 72.5% (29/40) and 75% (30/40) of the lesions were parasite‐free in the TCA and ILMA groups, respectively. Parasitologic tests were positive at week 6 in 27.5% (11/40) and 25% (10/40) of the cases in the TCA and ILMA groups, respectively. There were no significant differences in parasitologic test rates between groups ((RR 0.97, 95% CI 0.74 to 1.26; participants = 80; studies = 1 Analysis 83.4).
4.2.2 Non‐ablative laser plus TCA versus ILMA
Primary outcome: percentage of participants with a complete cure after the end of treatment
An RCT from Iran compared non‐ablative laser (weekly for four consecutive weeks) plus TCA (applied weekly for up to two weeks) versus ILMA (twice a week up to eight weeks) alone (Nilforoushzadeh 2012). At six months' follow‐up, 42.1% (16/30) and 63.2% (24/30) of the participants in the respective groups achieved a complete cure (RR 0.67, 95% CI 0.46 to 0.97; N = 60, Analysis 84.1).
Primary outcome: percentage of lesions cured after the end of treatment
The authors performed a subgroup analysis according to sex. In the male group, 36.3% (8/22) of the lesions treated with laser plus TCA, and 53.3% (8/15) receiving ILMA, had healed completely at six months (RR 0.68, 99% CI 0.26 to 1.77; N = 37). In females, cure rates in the respective groups were 50% (8/16) and 69.6% (16/23) (RR 0.72, 99% CI 0.34 to 1.50; N = 39; Analysis 84.2).
4.2.3 TCA plus ILMA versus factional laser plus ILMA versus ILMA alone
Primary outcome: percentage of participants with a complete cure after the end of treatment
An RCT from Iran compared TCA (applied weekly for up to eight consecutive weeks until the lesion was frosted) plus ILMA versus fractional laser (fortnightly two sessions) plus ILMA versus ILMA alone twice a week until complete re‐epithelialisation of the lesions or up to eight weeks (Nilforoushzadeh 2013). At six months' follow‐up, 90% (27/30) of the participants in the TCA plus ILMA group, 87% (20/23) in the fractional laser plus ILMA group, and 38.5% (10/26) in the ILMA alone group achieved complete cure. Cure rates were significantly higher in the TCA plus ILMA group compared with ILMA alone (RR 2.34, 95% CI 1.42 to 3.86; N = 56; 1 study, Analysis 85.1). ILMA alone was less efficacious than fractional laser and ILMA (RR 2.26, 95% CI 1.36 to 3.77; N = 49; 1 study, Analysis 86.1). There was no difference in complete cure rates between TCA plus ILMA versus fractional laser plus ILMA (RR 1.03, 95% CI 0.85 to 1.26; N = 53; 1 study, Analysis 87.1).
Secondary outcome: speed of healing (time taken to be 'cured')
Analysis of time to heal data in the Nilforoushzadeh 2013 study only showed significant differences in mean time to heal between TCA plus ILMA versus ILMA alone groups (MD −1.60, 95% CI −2.35 to −0.85 weeks, Analysis 85.2).
Secondary outcome: adverse effects
Nilforoushzadeh 2013 reported adverse effects in 80% (n = 72) of participants. There were five (6.9%) cases of local irritation, two (2.8%) cases of infection, one (1.4%) case of enlargement of lesion, and three (4.2%) cases of satellite lesions. The study did not describe the adverse effects by intervention.
4.2.4 TCA plus ILMA versus ILMA alone
Primary outcome: percentage of participants with a complete cure after the end of treatment
An RCT from Iran compared TCA 50% (applied fortnightly up to frosting the lesion) plus ILMA (twice a week until complete
resolution of the lesions or up to eight weeks) versus ILMA alone (twice a week until complete resolution of the lesions or up to eight weeks) (Nilforoushzadeh 2014b). At the end of the treatment period, 85.7% (78/91) and 80% (76/95) of the participants in the respective groups achieved a complete cure (RR 1.07, 95% CI 0.94 to 1.22; N = 186; 1 study Analysis 88.1). The authors also performed an analysis by the type of lesions (papule, nodule, plaque or ulcerative nodule), but they did not observe any difference between groups.
4.3 Cryotherapy
4.3.1 Cryotherapy alone versus ILMA plus cryotherapy versus ILMA monotherapy
Primary outcome: percentage of participants with a complete cure after the end of treatment
An RCT from Iran compared a combination of cryotherapy (freezing time was 10 s to 30 s with a thawing interval of 20 s) plus ILMA (after 5 to 10 min of cryotherapy) versus cryotherapy alone versus ILMA monotherapy (0.2 mL to 1.5 mL per session per week) (Salmanpour 2006). Ninety per cent (18/20), 70% (14/20), and 75% (15/20) of the participants in the respective groups had achieved a complete cure; however, authors did not report the time of this assessment. There were no statistical difference in cure rates between any comparisons: cryotherapy plus ILMA versus cryotherapy alone (RR 1.29, 95% CI 0.93 to 1.77; N = 40; 1 study, Analysis 89.1); cryotherapy plus ILMA versus ILMA alone (RR 1.20, 95% CI 0.90 to 1.61; N = 40; 1 study, Analysis 90.1), or cryotherapy alone versus ILMA alone (RR 0.93, 95% CI 0.64 to 1.37; N = 40; 1 study, Analysis 91.1).
An RCT from Iran compared cryotherapy (liquid nitrogen (−195°C) twice to the lesion for 10 s to 15 s, with a thawing interval of 20 s) versus ILMA monotherapy (0.2 mL to 1.5 mL per lesion) weekly for up to six weeks (Layegh 2009). At six months' follow‐up, 58.3% (21/36) and 27.8% (10/36) of the cryotherapy and ILMA group, respectively, achieved a complete cure (RR 2.10, 95% CI 1.16 to 3.81; N = 72; 1 study, Analysis 92.1).
Primary outcome: percentage of lesions cured after the end of treatment
An RCT from Iran compared cryotherapy (liquid nitrogen (−195°C) 10 s to 25 s with a thawing interval of 20 s) plus ILMA (after thawing, 0.5 mL to 2 mL per lesion) versus cryotherapy alone versus ILMA alone (0.5 mL to 2 mL per lesion) fortnightly until complete cure or for up to six weeks (Asilian 2004a). At the end of the treatment period, 80.5% (120/149), 52.2% (120/230) and 52.5% (84/160) of the lesions in the respective groups had healed completely. Cure rates were significantly higher in the cryotherapy plus ILMA group compared with cryotherapy alone (RR 1.54, 95% CI 1.33 to 1.79; N = 379; 1 study, Analysis 93.1) and ILMA alone (RR 1.53, 95% CI 1.30 to 1.81; N = 309; 1 study Analysis 94.1). There were no significant differences in cure rates between ILMA alone and cryotherapy alone groups (RR 0.99, 95% CI 0.82 to 1.20; N = 390; 1 study, Analysis 95.1).
Secondary outcome: speed of healing (time taken to be 'cured')
Only one study reported that none of the cured lesions recurred during the six‐month follow‐up period (Asilian 2004a).
Secondary outcome: adverse effects
Asilian 2004a reported mild adverse side effects, such as postinflammatory hypopigmentation: 5/100 of cases in the combined cryotherapy and ILMA group and 10/230 in the cryotherapy group. There were no significant differences in adverse effects rates between groups (Analysis 93.2; Analysis 94.2; Analysis 95.2). In Salmanpour 2006 there were no serious side effects in any of the treatment groups. However, 35% of the cases in the cryotherapy plus ILMA group, 60% in the cryotherapy alone group, and 20% in the ILMA alone group showed erythema and oedema of the lesions and perilesional area, but these adverse effects rates were not statistically different (Analysis 89.2; Analysis 90.2; Analysis 91.2). The most common adverse effects reported by Layegh 2009 were erythema and oedema at the treated site; these adverse reactions appeared during the initial hours after treatment. Layegh 2009 also described blistering at the treatment site, which became evident one or two days after treatment with a good response to local treatment. Other minor adverse effects are shown in Table 8.
Tertiary outcomes: microbiological or histopathological cure of skin lesions
Only Asilian 2004a reported that all cured lesions showed negative direct smears at the end of treatment and six weeks after treatment.
4.3.2 Triple combination of cryotherapy plus 15% paromomycin plus ILMA versus ILMA monotherapy
Primary outcome: percentage of participants with a complete cure after the end of treatment
An RCT from Iran compared a combined triple therapy of cryotherapy (fortnightly for up to 3 sessions) plus 15% paromomycin plus 10% urea cream applied twice a day for 4 weeks plus ILMA (twice a day for four weeks after cryotherapy) versus ILMA monotherapy twice every week until complete healing or for a maximum of six weeks (Nilforoushzadeh 2004). At six weeks after treatment, 84% (68/81) and 75% (57/76) of the participants in the respective groups had achieved complete cure. There were no significant differences in cure rates between groups (RR 1.12, 95% CI 0.95 to 1.31; N = 157; 1 study, Analysis 96.1).
4.3.3 Triple combination cryotherapy plus 3% salicylic acid cream plus 3% sodium nitrite cream versus cryotherapy plus 3% salicylic acid cream plus vehicle
Primary outcome: percentage of lesions cured after the end of treatment
An RCT from Iran compared cryotherapy (once a week) plus 3% salicylic acid cream (twice a day) plus 3% sodium nitrite cream (twice a day) versus cryotherapy plus 3% salicylic acid cream for up to 12 weeks (Jowkar 2012). At the end of the treatment period, 83.3% (30/36) and 74.1% (20/27) of the lesions in the respective groups had healed completely (RR 1.13, 95% CI 0.86 to 1.47; N = 63; 1 study, Analysis 97.1).
Secondary outcome: adverse effects
Jowkar 2012 reported erythema, a burning sensation, and skin irritation in seven participants (19.4%) in the cryotherapy plus salicylic acid plus sodium nitrate group, and in one participant (3.7%) in the cryotherapy plus salicylic acid plus vehicle group. Statistically, this was not a significant difference (RR 5.25, 95% CI 0.69 to 40.17; N = 63; 1 study, Analysis 97.2). See Table 8.
4.4 Thermotherapy
For a summary of adverse effects of thermotherapy please see Table 9.
4.4.1 Thermotherapy using radiofrequency waves versus ILMA
Primary outcome: percentage of lesions cured after the end of treatment
One RCT from Iran compared controlled localised heating using a radiofrequency heat generator (4 MHz, maximum output 90 W weekly) versus ILMA (0.1 mL to 4 mL per lesion) for four consecutive weeks (Sadeghian 2007). Six months after treatment, 80.7% (67/83) and 55.3% (52/94) of the lesions in the respective groups had healed completely. Cure rates were significantly higher in the thermotherapy group compared with ILMA (RR 1.46, 95% CI 1.18 to 1.80; N = 177; 1 study, Analysis 98.1).
We assessed the certainty of evidence as very low.
Primary outcome: percentage of participants with a complete cure after the end of treatment
There were two studies assessing complete cure after the end of treatment (Sadeghian 2007; Safi 2012). Heterogeneity was substantial (P = 0.08; I² = 68%), although both effects are in the same direction. The pooled analysis showed no significant difference in cure rates between thermotherapy and ILMA groups (RR 1.23, 95% CI 0.97 to 1.55; N = 499; 2 studies, Analysis 98.2).
We assessed the certainty of evidence as very low.
Secondary outcomes: duration of remission and percentage of people with treated lesions that recur within six months, one year, two years, and three years
Only the study from Iran reported not finding relapse from lesions with complete response in either group after six months of follow‐up (Sadeghian 2007).
Secondary outcome: prevention of scarring
Sadeghian 2007 reported that although all participants with complete response in both groups had scars, the size of the scars was smaller in the heat‐treated group (15.9 mm before and 11.2 mm after treatment) than in the ILMA‐treated group (15.0 mm before and 14.8 mm after treatment).
Secondary outcome: adverse effects
In Sadeghian 2007, allergic reactions such as erythema, oedema, and pruritus occurred in the ILMA group in four participants with 10 lesions, and there were also four cases of post‐treatment sporotrichotic lesions and three cases of satellite lesions. There was only one case with satellite lesions after treatment in the ILMA group. Safi 2012 reported mild and minimal adverse effects only in the ILMA group.
Participants treated with controlled localised heating reported fewer allergic reactions (RR 0.05, 95% CI 0.00 to 0.76; N = 117, 1 study, Analysis 98.3) but with very low‐certainty evidence.
4.4.2 Thermotherapy using radiofrequency waves versus intralesional or intravenous sodium stibogluconate (SSG)
Primary outcome: percentage of lesions cured after the end of treatment
An RCT from Iraq and Kuwait compared IVSSG (20 mg/kg/d) for 10 doses versus one session of thermotherapy using radiofrequency waves (50 uCTM applied for 30 s) (Aronson 2010). Two months after treatment, 73.3% (63/86) and 59.5% (50/84) of lesions had healed completely in the respective groups. There was no difference in cure rates between groups ((RR 1.23, 95% CI 0.99 to 1.53; participants = 170; studies = 1); Analysis 99.1).
Primary outcome: percentage of participants with a complete cure after the end of treatment
An RCT from Afghanistan compared ILSSG (five injections every five to seven days depending on the lesion size) for up to 29 days versus IMSSG (20 mg/kg/d) daily for 21 days versus thermotherapy using radiofrequency waves (one session of > 1 consecutive application at 50ºC for 30 s depending on lesion size) (Reithinger 2005). Two months after treatment, 47.3% (70/148), 18% (26/144) and 54% (75/139) of the participants in the respective group had achieved a complete cure. Cure rates were significantly higher in the thermotherapy group compared with IMSSG (RR 2.99, 95% CI 2.04 to 4.37; N = 283; 1 study, Analysis 100.1), but there was no difference compared with ILSSG (RR 1.14, 95% CI 0.91 to 1.43; N = 287; 1 study, Analysis 101.1).
An RCT from India compared ILSSG (2 mL to 5 mL per lesion twice a week, for seven injections over 29 days versus thermotherapy using radiofrequency waves (one treatment of two or more consecutive applications at 50ºC for 30 s depending on lesion size) (Bumb 2013). Six months after treatment, 98% and 94% of participants in the respective groups had achieved a complete cure (RR 1.04, 95% CI 0.96 to 1.13; N = 100; 1 study, Analysis 102.1).
Secondary outcome: speed of healing (time taken to be 'cured')
In the Reithinger 2005 study, the speed of healing took a median of 75 days for the ILSSG group, 100 days or more for the IMSSG group, and 53 days for the thermotherapy group (the original paper reported that the time to cure was significantly shorter for participants treated with thermotherapy; P = 0.003, by the log‐rank test). Bumb 2013 described a median time to heal of 11 weeks (95% CI 8 to 12) in the thermotherapy group and 10 weeks (95% CI 8 to 12) in the ILSSG group. In Aronson 2010, time to heal was similar (P = 0.24) in both groups in the analysis using blinded reading of photographs.
Secondary outcome: adverse effects
Reithinger 2005 described secondary infection in 3.7% (5/148) of participants in the ILSSG group, 1.4% (2/144) in the IMSSG group, and 5.7% (8/139) in the thermotherapy group, and there were no statistical differences in either comparison: thermotherapy versus ILSSG (RR 4.14, 99% CI 0.55 to 31.03; N = 283; 1 study, Analysis 100.2) or thermotherapy versus IMSSG (RR 1.70, 99% CI 0.41 to 7.17; N = 287; 1 study, Analysis 101.2). The authors also reported one participant with bradycardia and one an undefined local reaction in the ILSSG group. In the IMSSG group, one participant reported bradycardia, one tachycardia, and one palpitation. In the thermotherapy group, some participants experienced superficial second degree burns. In Bumb 2013, radiofrequency heat treatment (RFHT) was associated with less scarring and hyperpigmentation compared with ILSSG. Aronson 2010 reported four participants (15%) in the thermotherapy group and three (11%) in the ILSSG group suffered serious adverse effects (RR 1.30, 95% CI 0.30 to 5.64; N = 170; 1 study, Analysis 99.2). See Table 9.
4.4.3 Electrocauterisation plus DAC n‐055 or electrocauterisation
Secondary outcome: speed of healing (time taken to be 'cured')
An RCT from Afghanistan compared bipolar high‐frequency electrocauterisation plus daily moist‐wound‐treatment (MWT) with polyacrylate hydrogel including 0.045% DAC N‐055 versus electrocauterisation plus vehicle (Jebran 2014). The speed of healing took a median of 43.15 days for the electrocauterisation plus DAC N‐055 group and 42 days for the electrocauterisation group.
Secondary outcome: adverse effects
Six participants in each group had bacterial and fungal superinfections (8% in the electrocauterisation plus DAC n‐055 group and 9% in the electrocauterisation group; RR 0.85, 95% CI 0.29 to 2.50; N = 135; 1 study, Analysis 103.1), and two participants in electrocauterisation plus DAC n‐055 group and four participants in the electrocauterisation group reported Keloïd formation (5% and 6%, respectively; RR 0.42, 95% CI 0.08 to 2.24; N = 135; 1 study, Analysis 103.1). Other minor adverse effects are shown in Table 9.
4.5 Topical photodynamic therapy (PDT)
4.5.1 Topical PDT versus vehicle
Primary outcome: percentage of lesions cured after the end of treatment
An RCT from Iran compared topical PDT every week for four weeks (0% 5‐aminolevulinic acid (5‐ALA) hydrochloride in a water‐in‐oil cream) (Asilian 2006). Lesions irradiated using visible red light at 100 J/cm² per treatment session) with vehicle twice daily also for 28 days. Two months after treatment, 93.5% (29/31) of the lesions in the PDT group and 13.3% (4/30) in the vehicle groups healed completely. Cure rates were significantly higher in the PDT group compared with vehicle (RR 7.02, 95% CI 2.80 to 17.55; N = 61; 1 study, Analysis 104.1).
Secondary outcome: prevention of scarring
At the end of the study, none of the lesions had deep or disfiguring scars in the PDT group. However, 20% (3/30) of the lesions in the vehicle group had deep or disfiguring scars (RR 0.14, 95% CI 0.01 to 2.57; N = 61; 1 study, Analysis 104.2). Both groups had mild and tolerable itch, burning, redness, discharge, oedema, and pain as adverse effects.
Tertiary outcomes: microbiological or histopathological cure of skin lesions
Two months after treatment, parasitological cure rates were significantly higher in the PDT group (100%, 31/31 lesions) compared to placebo (20%, 6/30) (RR 4.69, 95% CI 2.37 to 9.31; N = 61; 1 study, Analysis 104.3).
The same author also compared PDT with topical paromomycin plus methyl benzethonium chloride, which we analyse in section 3.2, 'Topical paromomycin (aminosidine)'.
4.6 Mesotherapy
4.6.1 Mesotherapy versus ILMA
Primary outcome: percentage of participants with a complete cure after the end of treatment
One RCT from Iran compared mesotherapy (0.05 mL injection of MA in each shot in the depth of 2 mm) versus ILMA (0.1 mL of MA) for up six weeks (Kashani 2010). Three months after treatment, 83.3% (25/30) and 86.7% (26/30) of participants in the respective groups had achieved complete cure (RR 0.96, 95% CI 0.78 to 1.19; N = 60; 1 study, Analysis 105.1).
Secondary outcome: speed of healing (time taken to be 'cured')
The authors did not report significant improvement in ulcer, induration, erythema, or scar size between the two groups. However, the study described faster improvement in participants who received mesotherapy compared to ILMA: ulcerated lesions improved at the rate of 0.27 cm per week (SD 0.14) and 0.15 cm per week (SD 0.72), respectively, with an improvement for erythema of 0.31 cm per week (SD 0.15) and 0.22 cm per week (SD 0.07).
Secondary outcome: adverse effects
Pain severity evaluated by VAS was significantly higher in the ILMA group than in the mesotherapy group (7.67 cm versus 6.06 cm; P = 0.005). Two participants in the mesotherapy group and one in the ILMA group suffered an allergic reaction. There were no significant differences in allergic reaction rates between groups (RR 2.00, 95% CI 0.19 to 20.90; N = 60; 1 study; Analysis 105.2).
Tertiary outcomes: development of cell‐mediated immunity (i.e. positive leishmanin skin test)
Three months after treatment, there were positive Leishmania antibodies in three participants in the mesotherapy group and two participants in the ILMA group. There were no significant differences in adverse effects rates between groups (RR 1.50, 95% CI 0.27 to 8.34; N = 60; 1 study) (Analysis 105.3).
5. Measures for promoting healing
5.1 Topical diminazene aceturate (Berenil) versus topical cetrimide plus chlorhexidine (Savlon)
Primary outcome: percentage of participants with a complete cure after the end of treatment
An RCT from Sudan compared diminazene aceturate solution versus cetrimide plus chlorhexidine solution for 50 days (Lynen 1992). At the end of the treatment period, 80% (28/35) and 57% (20/35) of participants of in the respective groups achieved a complete cure, with a statistically significant difference in between groups and in favour of the diminazene aceturate solution (RR 1.40, 95% CI 1.01 to 1.95; N = 70; 1 study, Analysis 106.1).
Secondary outcomes: duration of remission and percentage of people with treated lesions that recur within six months, one year, two years, and three years
In the diminazene aceturate group, three re‐ulcerations occurred (two after 20 days and one after 25 days of cure). In the chlorhexidine group, two re‐ulcerations occurred after 35 days of cure.
Secondary outcome: adverse effects
Extreme drying of ulcers and surrounding skin occurred in participants in the diminazene aceturate solution (Berenil) group. Participants from the cetrimide plus chlorhexidine solution (Savlon) group experienced a slight burning sensation and drying of the skin at the site of treatment.
6. Alternative therapies
6.1 Garlic cream
6.1 Topical garlic cream versus vehicle
Primary outcome: percentage of participants with a complete cure after the end of treatment
An RCT from Iran compared 5% garlic cream treatment versus vehicle twice a day under occlusion with sterile gauze for three hours, for three weeks (Gholami 2000). At 40 days after treatment, 18.75% (18/96) and 20% (15/75) of the participants in the respective groups had achieved a complete cure. There were no significant differences in cure rates between groups (RR 0.94, 95% CI 0.51 to 1.73; N = 171; 1 study, Analysis 107.1).
6.2 Herbal extract
6.2.1 Topical herbal extract versus IMMA
Primary outcome: percentage of participants with a complete cure after the end of treatment
An RCT from Iran compared topical herbal extract Z‐HE, covered with a dressing for five consecutive days plus placebo injection (0.5 mL saline) versus IMMA (15 mg/kg/d to 20 mg/kg/d) plus vehicle (petrolatum and charcoal powder) for 20 consecutive days (Zerehsaz 1999). Six weeks after treatment, 74.4% (64/86) and 27.1% (23/85) of participants in the respective groups had achieved complete cure. There was a statistically significant difference in cure rates between topical herbal extract Z‐HE compared with IMMA (RR 2.75, 95% CI 1.90 to 3.98; N = 171; 1 study, Analysis 108.1).
Secondary outcome: adverse effects
Participants in the IMMA reported urticaria and generalised itch.
6.3 Honey
6.3.1 Topical honey plus ILMA versus ILMA monotherapy
Primary outcome: percentage of participants with a complete cure after the end of treatment
An RCT from Iran compared topical honey soaked gauze twice a day plus ILMA (weekly) versus ILMA (weekly) for four weeks (Nilforoushzadeh 2007). Results showed that two and a half to three months after treatment, 46% (23/50) and 64% (32/50) of the participants in the respective groups had achieved a complete cure, but with no significant difference between them (RR 0.72, 95% CI 0.50 to 1.04; N = 100; 1 study, Analysis 109.1).
Secondary outcome: speed of healing (time taken to be 'cured')
The mean time taken to be cured after omitting dropouts was 7.04 weeks and 6.3 weeks in the honey plus ILMA and the ILMA groups, respectively.
6.4 Cassia fistula
6.4.1 Topical Cassia fistula fruit gel plus ILMA versus ILMA plus vehicle
Primary outcome: percentage of participants with a complete cure after the end of treatment
An RCT from Iran compared topical Cassia fistula fruit gel plus ILMA (0.5 mL to 2 mL) twice a week versus ILMA (0.5 mL to 2 mL) twice a week plus vehicle (Jaffary 2010). Results showed that three months after treatment, compete healing occurred in 67.1% and 41.4% of the participants in the respective groups. There was a statistically significant difference in cure rates in favour of Cassia fistula fruit gel as an adjuvant to ILMA compared with ILMA monotherapy (RR 1.62, 95% CI 1.17 to 2.24; N = 140; 1 study, Analysis 110.1).
Secondary outcome: adverse effects
Nine (12.9%) participants in each group suffered from adverse effects such as itching and erythema (RR 1.00, 95% CI 0.42 to 2.37; N = 140; 1 study, Analysis 110.2).
6.4.2 Topical concentrated boiled Cassia fistula versus topical Cassia fistula hydroalcoholic versus ILMA
Primary outcome: percentage of participants with a complete cure after the end of treatment
An RCT from Iran compared topical concentrated boiled Cassia fistula versus topical Cassia fistula hydroalcoholic versus ILMA (0.5 mL to 2 mL), twice a week for four weeks (Jaffary 2014b). Results showed that four months after treatment, 40% (22/55), 36% (20/55), and 65% (36/55) of the participants in the respective groups had achieved complete cure. Efficacy of ILMA was higher than concentrated boiled extract (RR 0.61, 95% CI 0.42 to 0.89; N = 110; 1 study, Analysis 111.1) and hydroalcoholic extract of Cassia fistula (RR 0.56, 95% CI 0.37 to 0.83; N = 110; 1 study, Analysis 112.1), but there was no significant difference between application of concentrated boiled extract and hydroalcoholic extract of Cassia fistula (RR 1.10, 95% CI 0.68 to 1.77; N = 110; 1 study, Analysis 113.1).
Secondary outcome: speed of healing (time taken to be 'cured')
Participants receiving ILMA healed more quickly than those treated with concentrated boiled extract of Cassia fistula (MD −1.80 weeks, 95% CI −3.49 to −0.11; N = 110; 1 study, Analysis 111.2), but there was no difference between concentrated boiled extract of Cassia fistula and hydroalcoholic extract (MD −0.30 weeks, 95% CI −1.70 to 1.10; N = 110; 1 study, Analysis 113.2). There was also no difference between hydroalcoholic extract of Cassia fistula and ILMA (MD −1.50 weeks, 95% CI −3.20 to 0.20; N = 110; 1 study, Analysis 112.2).
Secondary outcome: adverse effects
Three (5.5%) participants in the concentrated boiled extract group and two (3.6%) in the other groups withdrew from the study due to an allergic reaction to the medications. There was no significant difference among these three groups in this regard: boiled extract of Cassia fistula versus ILMA (RR 1.50, 95% CI 0.26 to 8.63; N = 110; 1 study, Analysis 111.3), hydroalcoholic extract of Cassia fistula versus ILMA (RR 1.00, 95% CI 0.15 to 6.85; N = 110; 1 study, Analysis 112.3), or boiled extract of Cassia fistula versus hydroalcoholic extract of Cassia fistula (RR 1.50, 95% CI 0.26 to 8.63; N = 110; 1 study, Analysis 113.3).
6.5Achilles millefolium
6.5.1 TopicalAchilles millefolium cream plus ILMA versus vehicle plus ILMA
Primary outcome: percentage of participants with a complete cure after the end of treatment
An RCT from Iran compared topical gel of 5% Achilles millefolium (twice daily) plus ILMA (weekly injections at 20 mg/kg/d) versus ILMA (weekly injections of 20 mg/kg/d) plus vehicle (twice daily) for four weeks (Jaffary 2014a). Two months after treatment, 53% (16/30) and 40% (12/30) of the participants in the respective groups had achieved a complete cure. There was no difference in cure rates between Achilles millefolium as an adjuvant to ILMA compared with ILMA monotherapy (RR 1.33, 95% CI 0.77 to 2.31; N = 60; 1 study, Analysis 114.1).
Secondary outcome: adverse effects
Eight (26.6%) participants in the Achilles millefolium group reported mild or moderate severe itching and redness, and one experienced severe itching and increasing wound discharge. In the control group, two participants reported mild itching (6.6%) and one, severe itching (3.3%). There were no significant differences in itching rates between groups (RR 3.00, 95% CI 0.90 to 10.01; N = 60; 1 study, Analysis 114.2)
Tertiary outcomes: microbiological or histopathological cure of skin lesions
Six weeks after treatment, 33% of the participants in the Achilles millefolium group and 40% in the control group had parasitological cure (RR 0.83, 95% CI 0.43 to 1.63; N = 60; 1 study, Analysis 114.3).
Results from the MEDLINE search for adverse effects
We performed a MEDLINE search for adverse or side effects combined with therapeutic terms. However, we could only find general papers reporting known adverse effects derived from the evaluated drugs that are already mentioned in the Background under the Description of the intervention section.
Discussion
Summary of main results
The randomised controlled trials (RCTs) included in this review assessed a broad range of treatments and many different clinical questions. Yet together, there were few opportunities to describe and pool useful data. We have some concerns regarding the precision of data reported in several studies. Furthermore, because most RCTs were at high risk of bias, it was difficult to conclude whether one treatment was more beneficial than the comparator much of the time. Many interventions ruled ineffective in an essentially inconclusive study could still prove to have some benefit if evaluated with greater statistical power. Nonetheless, this review accurately documents the existing RCT evidence on the usefulness of treatments, and that relevant information can be extracted for practice and future research.
We found 89 RCTs that covered more than 20 different interventions, broadly categorised into six main groups: antimonial drugs, non‐antimonial systemic treatments, non‐antimonial topical and intralesional treatments, physical therapies, methods for promoting healing, and alternative therapies. Given that sample size per se is not a source of potential bias but a source of potential imprecision that may lead to bias, care has to be exercised in not concluding that the evaluation of the efficacy of interventions of small‐sized RCTs was untrustworthy.
It was difficult to evaluate the efficacy of any of the multiple treatments due to the variable treatment regimens examined and because the studies evaluated different Leishmania species and took place in different geographical areas. Moreover, most of the studies compared different regimens, and only a few RCTs compared treatments with sham therapies.
We created 'Summary of findings' tables for two comparisons (summary of findings Table for the main comparison; summary of findings Table 2); however, where measured, we rated all of the key outcomes included as very low‐certainty evidence, so we are not confident that the results found are conclusive.
-
A pooled analysis of three RCTs comparing itraconazole versus placebo favoured itraconazole with very low certainty of evidence, in terms of the following outcomes.
-
Percentage of participants with complete cure (N = 244).
-
Adverse effects (mild abdominal pain and nausea (N = 204) and mild abnormal liver function (N = 84).
-
Microbiological or histopathological cure of skin lesions (N = 20, only in one RCT).
-
-
A pooled analysis of two RCTs comparing paromomycin ointment plus 10% urea versus vehicle showed no difference in cure rate between interventions with a very low certainty of evidence, in terms the following outcomes.
-
Percentage of participants with complete cure (N = 383).
-
Microbiological or histopathological cure of skin lesions (N = 383).
-
-
However, the paromomycin group had more skin/local reactions, as assessed in four studies (N = 713).
Neither of the key comparisons offer data on the percentage of lesions cured after the end of treatment and speed of healing (i.e. time taken to be cured).
Overall completeness and applicability of evidence
Not all of the trials assessed the primary, secondary, and tertiary outcomes that we hoped to evaluate in this review. Our two main comparisons did not report our primary outcome of the percentage of lesions cured, and the comparisons that did measure this outcome (along with percentage of participants cured) lacked data on long‐term effects. Assessing the two primary outcomes, we established that dealing with participants rather than with numbers of lesions proved to be a better cure criteria: lesions cured did not provide a realistic reflection of the number of participants that achieved complete cure or rather, whether all their lesions had healed. In addition, from a clinical perspective, it may be more relevant to know whether a person is completely or partially cured irrespective of the number of lesions fully healed by the tested drug. In fact, only 18 RCTs reported the primary outcome as percentage of lesions cured; the rest reported the percentages in terms of participants cured.
The main secondary outcome reported in our studies was the description of adverse effects, which is key when deciding a specific therapeutic option. Several RCTs also reported other secondary outcomes, but none reported the degree of functional and aesthetic impairment or quality of life. Only two tertiary outcomes were reported ('Microbiological or histopathological cure of skin lesions' in 15 trials and 'Development of cell‐mediated immunity (i.e. positive leishmanin skin test)' in just one trial.
Many of the included studies did not specify the infecting species of leishmaniasis or made assumptions regarding the disease‐causing species. We did not find any RCTs related to L aethiopica infections. There is also a lack of evidence for L infantum andL donovani: of the 41 new studies included in this updated systematic review, only two studies assessed L donovani‐infected participants, and another one assessed the efficacy of a treatment in one L infantum‐infected participant together with 66L major‐ and oneL tropica‐infected participants. Twenty studies reported L major, L tropica, or both.
Most included participants were adults, and all were immunocompetent; thus, our findings are not necessarily applicable to subsets of people such as women of childbearing age, children, people with co‐morbid conditions, and immunocompromised individuals with no drug interactions.
The difficulty in determining the actual time point for cure in clinically significant terms in these studies is due to a lack of any universal measure for successful cure in OWCL. In fact, we found that most of the included RCTs did not explore cure rates past three months after treatment cessation. On the contrary, in most cases they assessed the primary outcome at the end of treatment or before three months.
The applicability of the results of this review to clinical practice is limited. The most important limitation in order to determine a specific conclusion for clinical practice is the short follow‐up period reported in most studies. This impedes finding the real cure rate for OWCL because it is not possible to clearly confirm healing without long‐term assessment (e.g. until at least six months after treatment has finished). There are no studies evaluating liposomal amphotericin B as a systemic treatment. Currently, because of the toxicity of pentavalent antimonials in most developed countries when systemic treatment is needed for OWCL, liposomal amphotericin B could be a good option, but at the time of writing there was no published information regarding its effectiveness.
Quality of the evidence
Most included trials were poorly designed and reported. Poor reporting is a major issue, and most studies were at unclear risk for one or more important bias domains in the 'Risk of bias' assessment. Risk of bias was generally moderate due to performance, attrition, or reporting bias. Most studies did not guard properly against performance bias (by blinding participants and healthcare professionals). Blinded outcome assessment was unclear. Adequate randomisation was reported in 47.2% (42/89) of the included studies. Only 13.5% (12/89) reported adequate allocation concealment. Double‐blinding was found in 44.9% (40/89) of the studies. There was inadequate description of baseline characteristics in 10.1% (9/89) of the studies. Thirty point three per cent (27/89) of the studies reported sample size calculation. Only two studies assessed compliance (Firooz 2006; Lynen 1992). The causative parasite was not mentioned in 32.6% (29/89) of the studies, and 34.8% (31/89) of the trials mentioned the endemic nature of the parasite in the area, assuming that was the species causing the disease. The timing for outcome assessment was not reported in 2.2% (2/89) of the trials.
Because resources for clinical research into neglected diseases are limited, there is a need to prioritise and carry out properly designed clinical trials. We found many mistakes in the write‐up of published manuscripts. Thus, it is essential that submitted journal manuscripts undergo rigorous peer review.
For the two main comparisons, we created 'Summary of findings' tables and conducted GRADE assessments on the certainty of evidence for the key outcomes, which we found to be very low. Risk of bias, as highlighted above, was one of the reasons for downgrading the evidence. We also downgraded evidence for imprecision, as many of the confidence intervals were very wide, likely due to the small sample size and low number of events in many of the studies assessed. Furthermore, in two cases (for 'participants complete cure' in the comparison itraconazole versus placebo, and 'microbiological/histopathological cure of skin lesions' in the comparison paromomycin ointment versus vehicle), we downgraded evidence for inconsistency due to the high I² values and the inconsistent direction or size of effect. In addition, we also observed indirectness in the outcomes measured in the comparison paromomycin ointment versus vehicle, as the evidence assessed only focused on young people.
Overall, considerable numbers of participants withdrew or were lost to follow‐up. Most trial authors stated that they performed an adherence assessment, but results were seldom shown in the assessed studies.
Potential biases in the review process
Studies with more positive effects are more likely to be published than those with less conclusive results (Chalmers 2009), or those written in languages other than English (Bigby 2003). To tackle the problem of publication bias, we wrote to authors from endemic countries and the WHO asking for information. Besides, we searched databases of ongoing trials and others as well. However, the fact that eight studies have not yet been incorporated and are awaiting classification may be a source of potential bias.
Agreements and disagreements with other studies or reviews
Khatami 2007 performed a non‐Cochrane systematic review on acute Old World cutaneous leishmaniasis. They included 50 studies with a total of 5515 participants. However, we detected quite a few inconsistent results. Firstly, review authors cited 51 RCTs instead of the 50 reported in the abstract and the Materials and methods, and we excluded three of these in our review for several reasons (Dogra 1986; El On 1992; Trau 1987): one was a cross‐over trial, which is an inappropriate design for evaluating potential curative treatments in an infection (El On 1992), and we considered the generation of the randomisation sequence to be inadequate in the other two. We considered another four trials to be non‐randomised in our review (Crawford 2005; el‐Safi 1990; Mapar 2001; Vardy 2001). One RCT that Khatami 2007 included dealt with two case reports (el‐On 1985). Secondly, if clinical trials reported in the paper's tables III to VII are included, review authors mentioned only 47 studies, while omitting 4. However, we do agree with Khatami 2007 in terms of the variable quality and methods of RCTs, providing weak evidence for treatment of OWCL, and regarding the importance of properly designing RCTs to improve their quality and to provide better evidence for the treatment of OWCL.
Two non‐systematic reviews gathered evidence on Old World cutaneous leishmaniasis treatments (Blum 2014;Monge‐Maillo 2013). The fact that these reviews did not use a systematic approach confers many biases and does not assure inclusion of all published studies. One study was more restrictive on selecting the studies and included only controlled clinical trials (Blum 2014), whereas the other was more permissive and also included other published data based on retrospective studies and large case series. However, review authors analysed the methodology of each of the studies, considering that only clinical trials were able to give a high quality of evidence (Monge‐Maillo 2013). Moreover, these studies were not so restrictive regarding the period of follow‐up needed and considered all the end points reported (percentages of lesions and of participants cured). In this way review authors considered certain therapeutic regimens such as dapsone for L tropica or itraconazole for L major to have a a higher quality of evidence than in the Cochrane Review. Even though these reviews (Blum 2014, Monge‐Maillo 2013) do not have the methodological rigour of a Cochrane Review, they are relevant in clinical practice because they give therapeutic recommendations stratified according to their level of evidence and Leishmania species implicated.

Study flow diagram.

Risk of bias summary: review authors' judgments about each risk of bias item for each included study.

Risk of bias graph: review authors' judgments about each risk of bias item presented as percentages across all included studies.

Forest Plot of Primary Outcome: Lesions Cured (Various comparisons)

Forest plot of primary outcome: 1.2 Participants cured (Various comparisons)

Comparison 1 ILMA weekly versus ILMA fortnightly for up to 8 weeks, Outcome 1 Lesions cured.
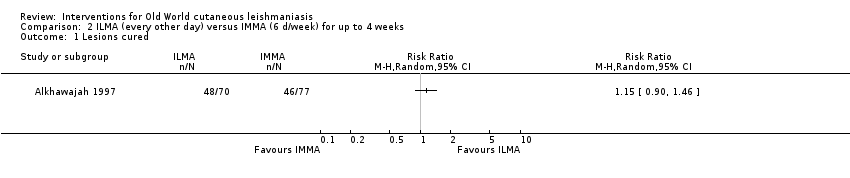
Comparison 2 ILMA (every other day) versus IMMA (6 d/week) for up to 4 weeks, Outcome 1 Lesions cured.
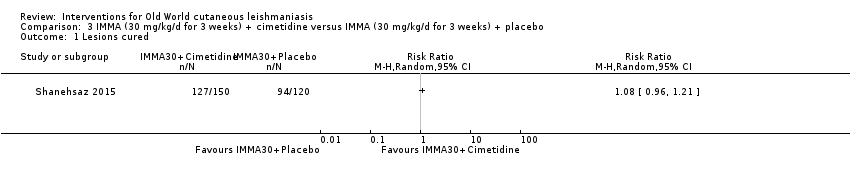
Comparison 3 IMMA (30 mg/kg/d for 3 weeks) + cimetidine versus IMMA (30 mg/kg/d for 3 weeks) + placebo, Outcome 1 Lesions cured.
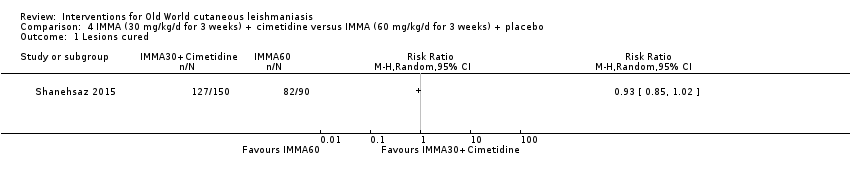
Comparison 4 IMMA (30 mg/kg/d for 3 weeks) + cimetidine versus IMMA (60 mg/kg/d for 3 weeks) + placebo, Outcome 1 Lesions cured.

Comparison 5 IMMA (60 mg/kg/d for 3 weeks) + placebo versus IMMA (30 mg/kg/d for 3 weeks) + placebo, Outcome 1 Lesions cured.
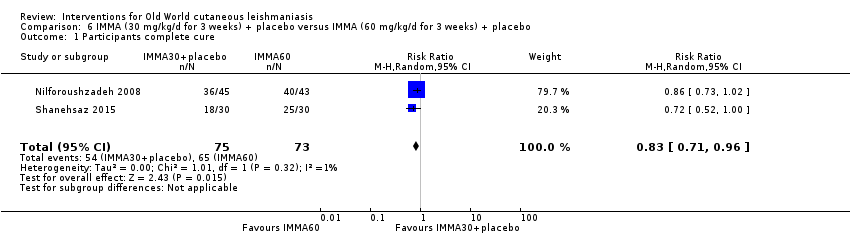
Comparison 6 IMMA (30 mg/kg/d for 3 weeks) + placebo versus IMMA (60 mg/kg/d for 3 weeks) + placebo, Outcome 1 Participants complete cure.
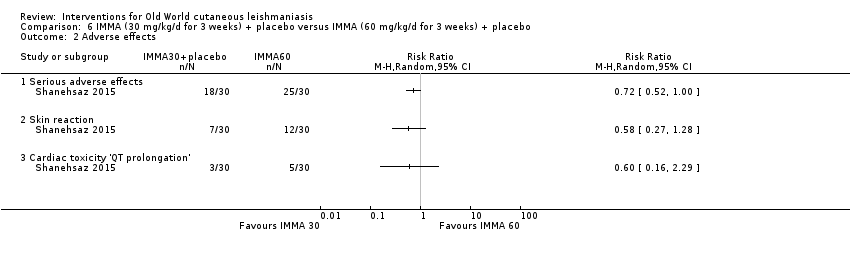
Comparison 6 IMMA (30 mg/kg/d for 3 weeks) + placebo versus IMMA (60 mg/kg/d for 3 weeks) + placebo, Outcome 2 Adverse effects.
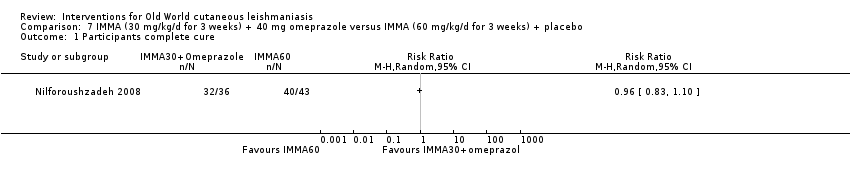
Comparison 7 IMMA (30 mg/kg/d for 3 weeks) + 40 mg omeprazole versus IMMA (60 mg/kg/d for 3 weeks) + placebo, Outcome 1 Participants complete cure.

Comparison 8 IMMA (30 mg/kg/d for 3 weeks) + placebo versus IMMA (60 mg/kg/d for 3 weeks) + placebo, Outcome 1 Participants complete cure.
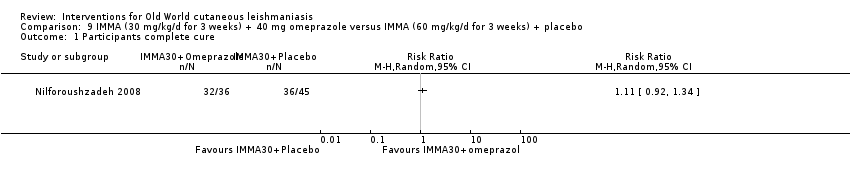
Comparison 9 IMMA (30 mg/kg/d for 3 weeks) + 40 mg omeprazole versus IMMA (60 mg/kg/d for 3 weeks) + placebo, Outcome 1 Participants complete cure.

Comparison 10 ILMA + non‐silver polyester dressing versus ILMA (weekly injections for 6 weeks), Outcome 1 Lesions cured.
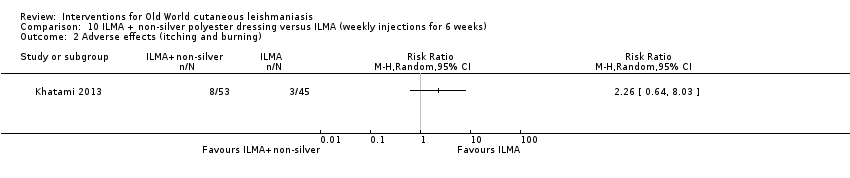
Comparison 10 ILMA + non‐silver polyester dressing versus ILMA (weekly injections for 6 weeks), Outcome 2 Adverse effects (itching and burning).

Comparison 10 ILMA + non‐silver polyester dressing versus ILMA (weekly injections for 6 weeks), Outcome 3 Adverse effects (oedema).

Comparison 11 ILMA (weekly injections for 6 weeks) + silver polyester dressing versus ILMA (weekly injections for 6 weeks), Outcome 1 Lesions cured.

Comparison 11 ILMA (weekly injections for 6 weeks) + silver polyester dressing versus ILMA (weekly injections for 6 weeks), Outcome 2 Adverse effects (itching and burning).
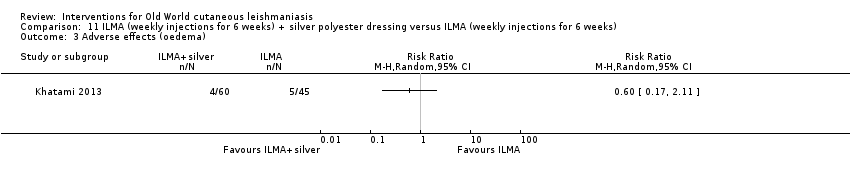
Comparison 11 ILMA (weekly injections for 6 weeks) + silver polyester dressing versus ILMA (weekly injections for 6 weeks), Outcome 3 Adverse effects (oedema).

Comparison 12 ILMA (weekly injections for 6 weeks) + silver polyester dressing versus ILMA (weekly injections for 6 weeks) + non‐silver polyester dressing, Outcome 1 Lesions cured.
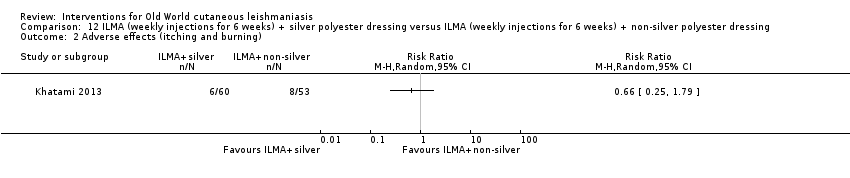
Comparison 12 ILMA (weekly injections for 6 weeks) + silver polyester dressing versus ILMA (weekly injections for 6 weeks) + non‐silver polyester dressing, Outcome 2 Adverse effects (itching and burning).

Comparison 12 ILMA (weekly injections for 6 weeks) + silver polyester dressing versus ILMA (weekly injections for 6 weeks) + non‐silver polyester dressing, Outcome 3 Adverse effects (oedema).
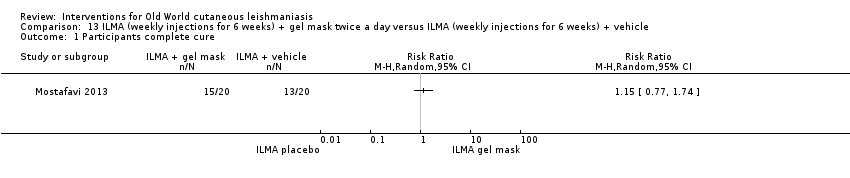
Comparison 13 ILMA (weekly injections for 6 weeks) + gel mask twice a day versus ILMA (weekly injections for 6 weeks) + vehicle, Outcome 1 Participants complete cure.

Comparison 14 ILSSG (20 mg/kg/d) + IMSSG (remaining total dose days 1, 3, 5) versus ILSSG (1000 mg/mL days 1, 3, 5), Outcome 1 Lesions cured.
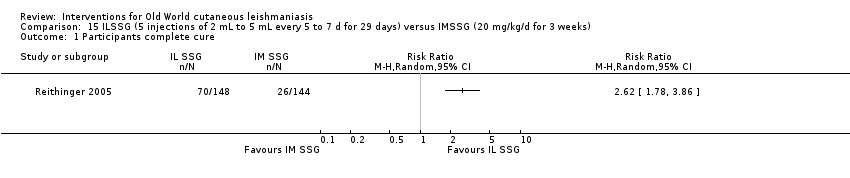
Comparison 15 ILSSG (5 injections of 2 mL to 5 mL every 5 to 7 d for 29 days) versus IMSSG (20 mg/kg/d for 3 weeks), Outcome 1 Participants complete cure.
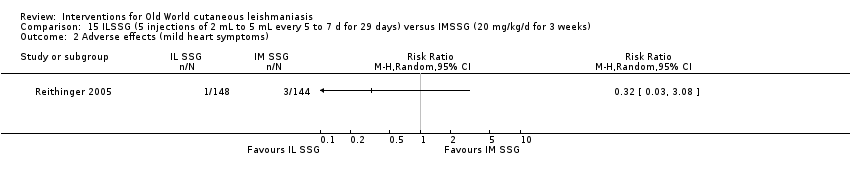
Comparison 15 ILSSG (5 injections of 2 mL to 5 mL every 5 to 7 d for 29 days) versus IMSSG (20 mg/kg/d for 3 weeks), Outcome 2 Adverse effects (mild heart symptoms).

Comparison 16 Ketoconazole 600 mg/d for 6 weeks versus ketoconazole 800 mg/d for 6 weeks, Outcome 1 Participants complete cure.
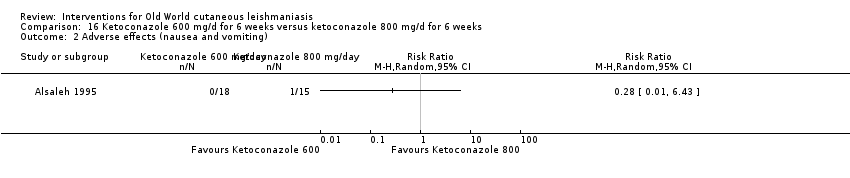
Comparison 16 Ketoconazole 600 mg/d for 6 weeks versus ketoconazole 800 mg/d for 6 weeks, Outcome 2 Adverse effects (nausea and vomiting).
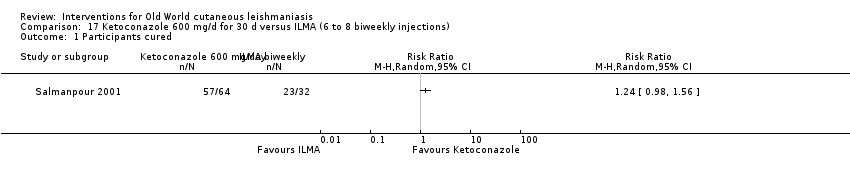
Comparison 17 Ketoconazole 600 mg/d for 30 d versus ILMA (6 to 8 biweekly injections), Outcome 1 Participants cured.

Comparison 17 Ketoconazole 600 mg/d for 30 d versus ILMA (6 to 8 biweekly injections), Outcome 2 Adverse effect (liver enzymes increase).

Comparison 18 ILSSG (100 mg/mL days 1, 3, 5) + oral ketoconazole (600 mg/d for 4 weeks) versus ILSSG (100 mg/mL days 1, 3, 5), Outcome 1 Lesions cured.
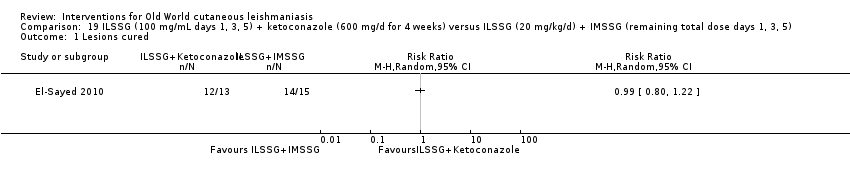
Comparison 19 ILSSG (100 mg/mL days 1, 3, 5) + ketoconazole (600 mg/d for 4 weeks) versus ILSSG (20 mg/kg/d) + IMSSG (remaining total dose days 1, 3, 5), Outcome 1 Lesions cured.

Comparison 20 Itraconazole (200 mg for 6 weeks) versus placebo, Outcome 1 Participants complete cure.

Comparison 21 Itraconazole (200 mg for 3 weeks) versus placebo, Outcome 1 Participants complete cure.
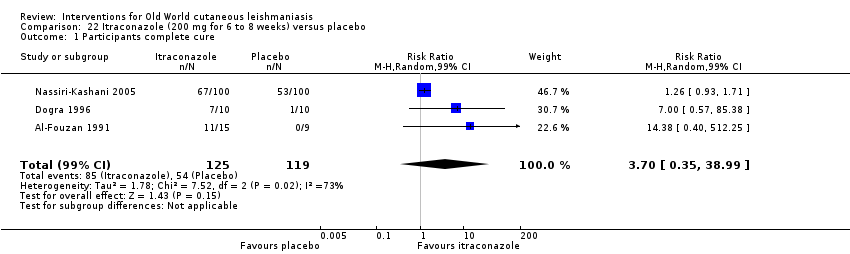
Comparison 22 Itraconazole (200 mg for 6 to 8 weeks) versus placebo, Outcome 1 Participants complete cure.
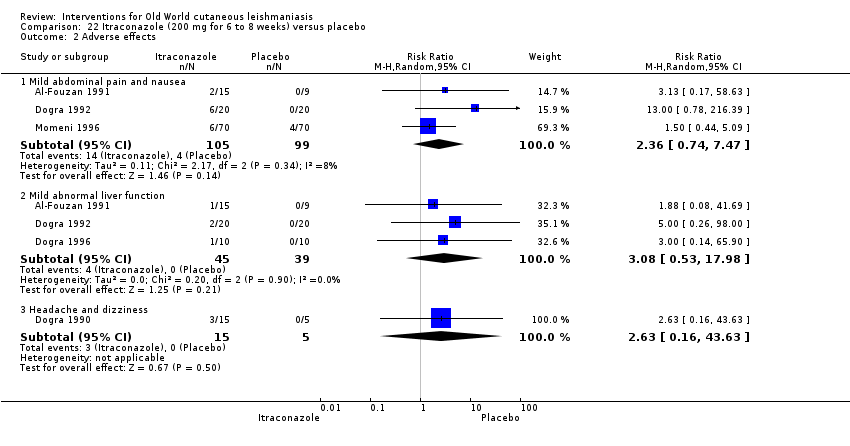
Comparison 22 Itraconazole (200 mg for 6 to 8 weeks) versus placebo, Outcome 2 Adverse effects.
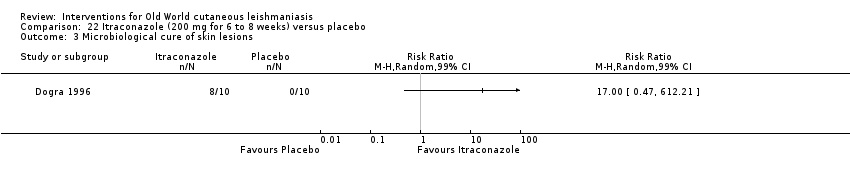
Comparison 22 Itraconazole (200 mg for 6 to 8 weeks) versus placebo, Outcome 3 Microbiological cure of skin lesions.
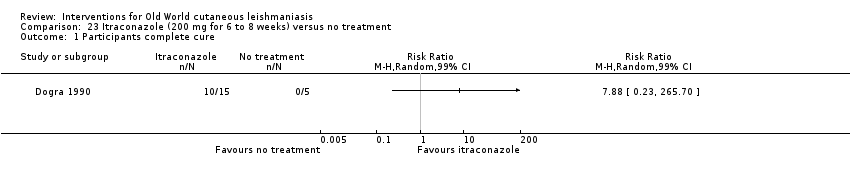
Comparison 23 Itraconazole (200 mg for 6 to 8 weeks) versus no treatment, Outcome 1 Participants complete cure.
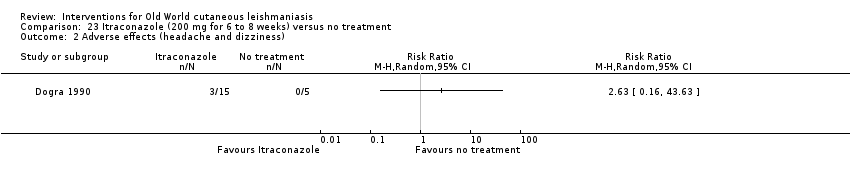
Comparison 23 Itraconazole (200 mg for 6 to 8 weeks) versus no treatment, Outcome 2 Adverse effects (headache and dizziness).
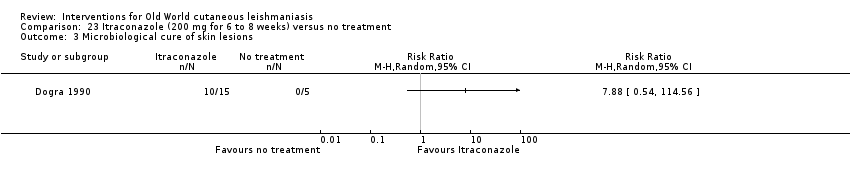
Comparison 23 Itraconazole (200 mg for 6 to 8 weeks) versus no treatment, Outcome 3 Microbiological cure of skin lesions.
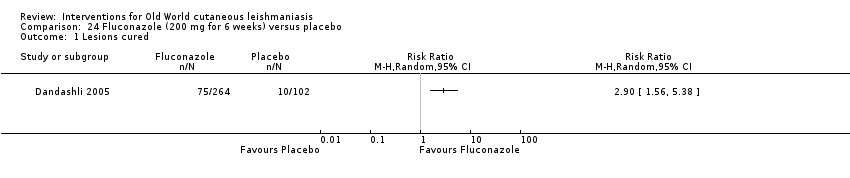
Comparison 24 Fluconazole (200 mg for 6 weeks) versus placebo, Outcome 1 Lesions cured.

Comparison 24 Fluconazole (200 mg for 6 weeks) versus placebo, Outcome 2 Participants complete cure.

Comparison 25 Fluconazole (400 mg/d for 6 weeks) versus fluconazole (200 mg/d for 6 weeks), Outcome 1 Participants complete cure.

Comparison 25 Fluconazole (400 mg/d for 6 weeks) versus fluconazole (200 mg/d for 6 weeks), Outcome 2 Adverse effects.
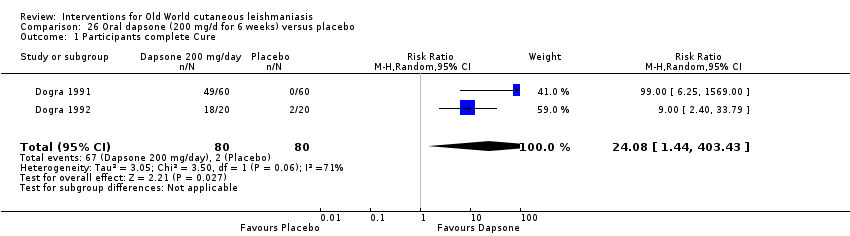
Comparison 26 Oral dapsone (200 mg/d for 6 weeks) versus placebo, Outcome 1 Participants complete Cure.

Comparison 26 Oral dapsone (200 mg/d for 6 weeks) versus placebo, Outcome 2 Adverse effects.

Comparison 27 Allopurinol (15 mg/kg/d for 3 weeks) + IMMA (20 mg/kg/d for 2 weeks) versus allopurinol (15 mg/kg/d for 3 weeks), Outcome 1 Lesions cured.

Comparison 28 Allopurinol (15mg/kg/d for 3 weeks)+ IMMA (20 mg/kg/d for 2 weeks) versus IMMA (20 mg/kg/d for 2 weeks), Outcome 1 Lesions cured.

Comparison 29 Allopurinol (15 mg/kg/d for 3 weeks) versus IMMA (20 mg/kg/d for 2 weeks), Outcome 1 Lesions Cured.

Comparison 30 Allopurinol (20 mg/kg/d for 3 weeks) + IMMA (30 mg/kg/d for 20 days) versus IMMA (60 mg/kg/d for 20 d), Outcome 1 Lesions cured.

Comparison 30 Allopurinol (20 mg/kg/d for 3 weeks) + IMMA (30 mg/kg/d for 20 days) versus IMMA (60 mg/kg/d for 20 d), Outcome 2 Adverse effects.

Comparison 30 Allopurinol (20 mg/kg/d for 3 weeks) + IMMA (30 mg/kg/d for 20 days) versus IMMA (60 mg/kg/d for 20 d), Outcome 3 Microbiological cure of skin lesions.

Comparison 31 Allopurinol (20 mg/kg/d for 3 weeks)+ IMMA (10 mg/kg/d for 20 d) versus IMMA (20 mg/kg/d for 28 d), Outcome 1 Adverse effects.

Comparison 32 Allopurinol (20 mg/kg/d for 3 weeks) versus IVSSG (20 mg/kg/d for 15 d), Outcome 1 Participants complete cured.
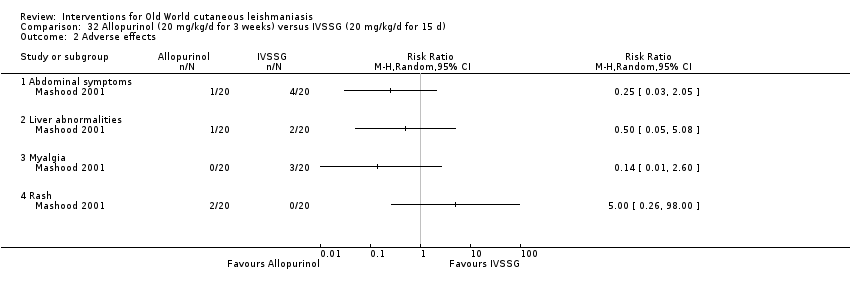
Comparison 32 Allopurinol (20 mg/kg/d for 3 weeks) versus IVSSG (20 mg/kg/d for 15 d), Outcome 2 Adverse effects.

Comparison 33 Oral rifampicin (10 mg/kg/d for 4 to 6 weeks) versus placebo, Outcome 1 Participants complete cure.

Comparison 33 Oral rifampicin (10 mg/kg/d for 4 to 6 weeks) versus placebo, Outcome 2 Microbiological cure of skin lesions.

Comparison 34 Oral rifampicin (10 mg/kg/d) + omeprazole (20 mg/d) for 6 weeks versus placebo, Outcome 1 Participants complete cure.

Comparison 35 Azythromicin (500 mg/d for 5 d/month up to 4 months) versus IMMA (60 mg/kg/d for 20 d), Outcome 1 Lesions cured.

Comparison 35 Azythromicin (500 mg/d for 5 d/month up to 4 months) versus IMMA (60 mg/kg/d for 20 d), Outcome 2 Adverse effects.
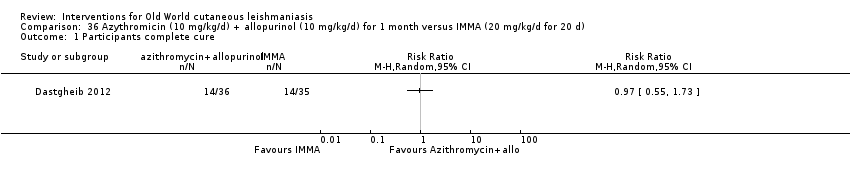
Comparison 36 Azythromicin (10 mg/kg/d) + allopurinol (10 mg/kg/d) for 1 month versus IMMA (20 mg/kg/d for 20 d), Outcome 1 Participants complete cure.
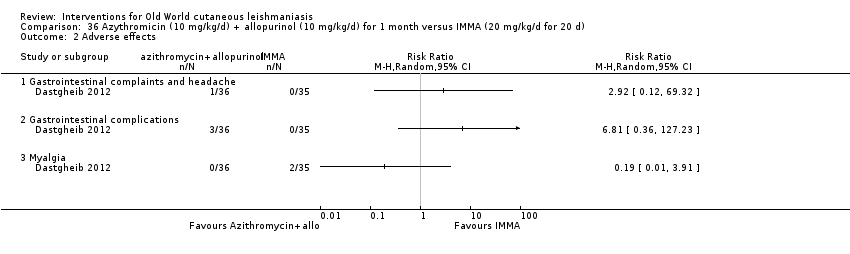
Comparison 36 Azythromicin (10 mg/kg/d) + allopurinol (10 mg/kg/d) for 1 month versus IMMA (20 mg/kg/d for 20 d), Outcome 2 Adverse effects.

Comparison 37 Oral pentoxifylline (400 mg 3 times daily) + IMMA (20 mg/kg/d) for 20 d versus placebo + IMMA (20 mg/kg/d) for 20 d, Outcome 1 Participants complete cure.

Comparison 37 Oral pentoxifylline (400 mg 3 times daily) + IMMA (20 mg/kg/d) for 20 d versus placebo + IMMA (20 mg/kg/d) for 20 d, Outcome 2 Adverse effects.

Comparison 38 Oral miltefosine (2.5 mg/kg/d for 4 weeks) versus IMMA (60 mg/kg/d for 2 weeks), Outcome 1 Participants complete cure.
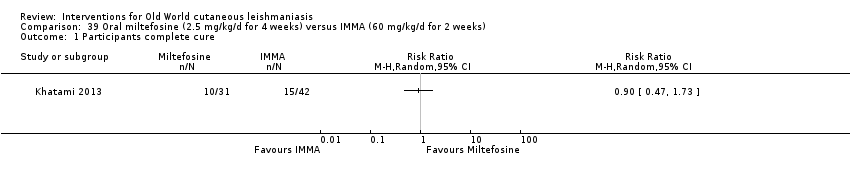
Comparison 39 Oral miltefosine (2.5 mg/kg/d for 4 weeks) versus IMMA (60 mg/kg/d for 2 weeks), Outcome 1 Participants complete cure.

Comparison 40 Oral zinc sulphate 2.5 mg/kg/d for 45 days versus oral zinc sulphate 5 mg/kg/d for 45 d, Outcome 1 Participants complete cure.
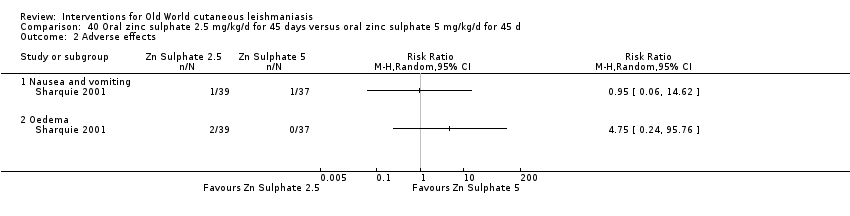
Comparison 40 Oral zinc sulphate 2.5 mg/kg/d for 45 days versus oral zinc sulphate 5 mg/kg/d for 45 d, Outcome 2 Adverse effects.

Comparison 41 Oral zinc sulphate 2.5 mg/kg/d for 45 d versus oral zinc sulphate 10 mg/kg/d for 45 d, Outcome 1 Participants complete cure.
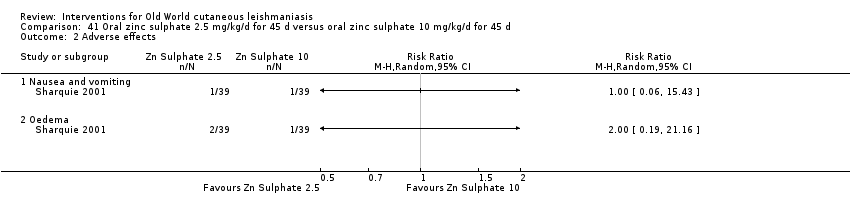
Comparison 41 Oral zinc sulphate 2.5 mg/kg/d for 45 d versus oral zinc sulphate 10 mg/kg/d for 45 d, Outcome 2 Adverse effects.
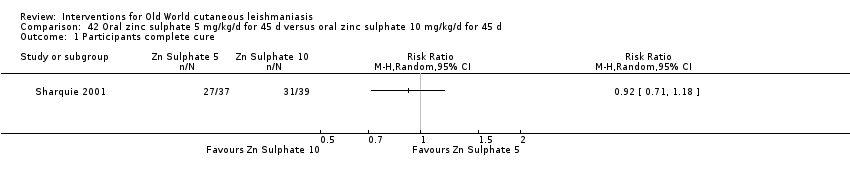
Comparison 42 Oral zinc sulphate 5 mg/kg/d for 45 d versus oral zinc sulphate 10 mg/kg/d for 45 d, Outcome 1 Participants complete cure.
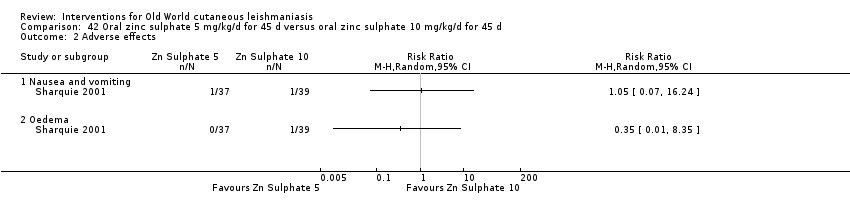
Comparison 42 Oral zinc sulphate 5 mg/kg/d for 45 d versus oral zinc sulphate 10 mg/kg/d for 45 d, Outcome 2 Adverse effects.
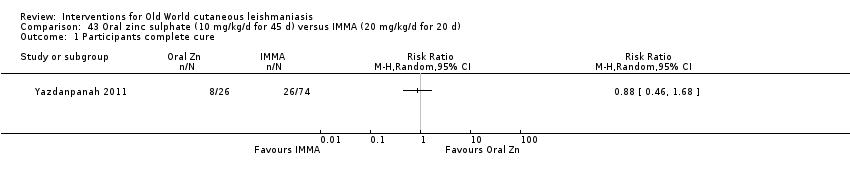
Comparison 43 Oral zinc sulphate (10 mg/kg/d for 45 d) versus IMMA (20 mg/kg/d for 20 d), Outcome 1 Participants complete cure.
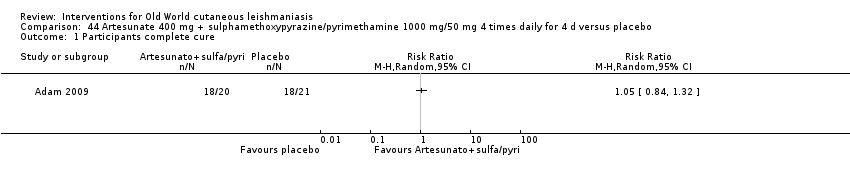
Comparison 44 Artesunate 400 mg + sulphamethoxypyrazine/pyrimethamine 1000 mg/50 mg 4 times daily for 4 d versus placebo, Outcome 1 Participants complete cure.
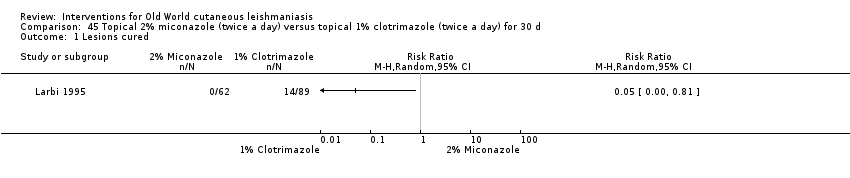
Comparison 45 Topical 2% miconazole (twice a day) versus topical 1% clotrimazole (twice a day) for 30 d, Outcome 1 Lesions cured.
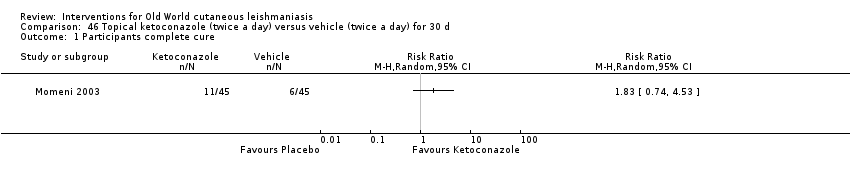
Comparison 46 Topical ketoconazole (twice a day) versus vehicle (twice a day) for 30 d, Outcome 1 Participants complete cure.

Comparison 47 Topical amphotericin B (3 to 7 drops twice daily for 8 weeks) versus ILMA (max 2 mL) once a week for 8 weeks, Outcome 1 Participants complete cure (ITT).

Comparison 47 Topical amphotericin B (3 to 7 drops twice daily for 8 weeks) versus ILMA (max 2 mL) once a week for 8 weeks, Outcome 2 Adverse effects.

Comparison 48 Paromomycin 15% + 12% MBCL (twice daily for 28 d) versus vehicle (twice daily for 28 d), Outcome 1 Lesions cured.

Comparison 48 Paromomycin 15% + 12% MBCL (twice daily for 28 d) versus vehicle (twice daily for 28 d), Outcome 2 Scarring.

Comparison 48 Paromomycin 15% + 12% MBCL (twice daily for 28 d) versus vehicle (twice daily for 28 d), Outcome 3 Microbiological cure of skin lesions.
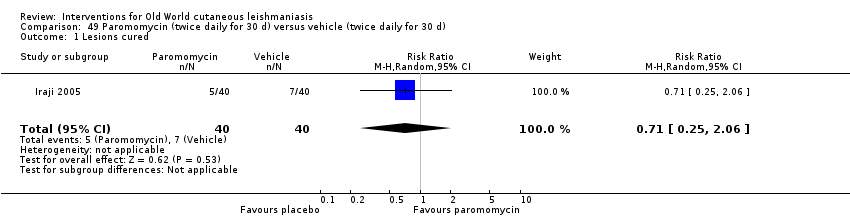
Comparison 49 Paromomycin (twice daily for 30 d) versus vehicle (twice daily for 30 d), Outcome 1 Lesions cured.
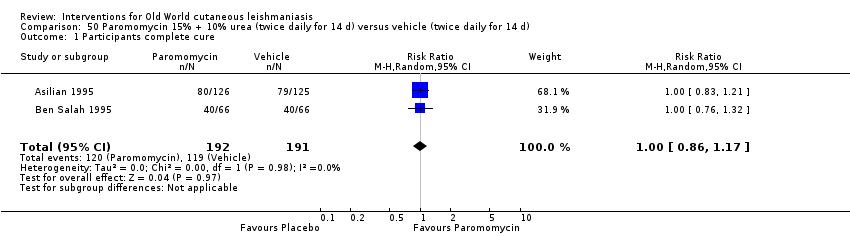
Comparison 50 Paromomycin 15% + 10% urea (twice daily for 14 d) versus vehicle (twice daily for 14 d), Outcome 1 Participants complete cure.
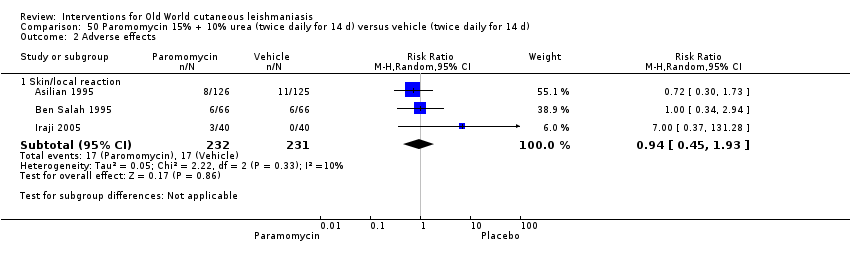
Comparison 50 Paromomycin 15% + 10% urea (twice daily for 14 d) versus vehicle (twice daily for 14 d), Outcome 2 Adverse effects.
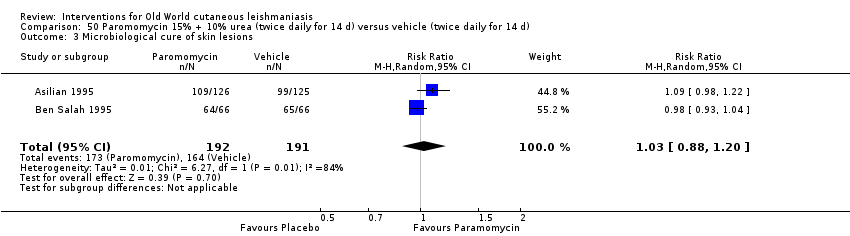
Comparison 50 Paromomycin 15% + 10% urea (twice daily for 14 d) versus vehicle (twice daily for 14 d), Outcome 3 Microbiological cure of skin lesions.
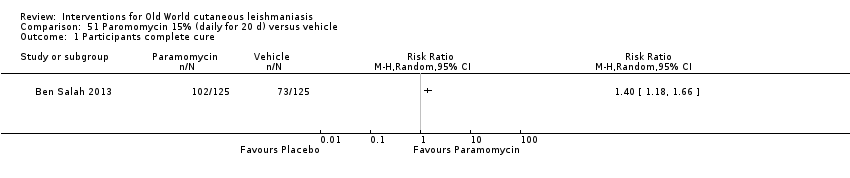
Comparison 51 Paromomycin 15% (daily for 20 d) versus vehicle, Outcome 1 Participants complete cure.

Comparison 52 Paromomycin 15% + gentamicin 0.5% (daily for 20 d) versus vehicle, Outcome 1 Participants complete cure.

Comparison 53 Paromomycin 15% + gentamicin 0.5% (daily for 20 d) versus paromomycin 15% alone (daily for 20 d), Outcome 1 Participants complete cure.

Comparison 54 Paromomycin 15% + 10% urea (twice daily for 45 d) versus ILMA (weekly for up to 3 months), Outcome 1 Participants complete cure.

Comparison 54 Paromomycin 15% + 10% urea (twice daily for 45 d) versus ILMA (weekly for up to 3 months), Outcome 2 Recurrence.
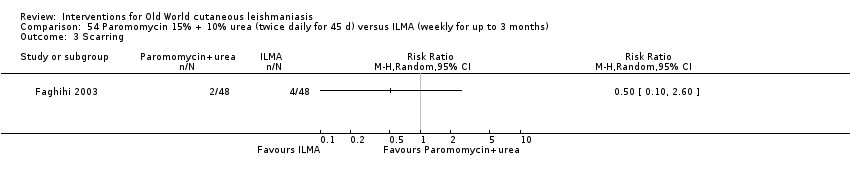
Comparison 54 Paromomycin 15% + 10% urea (twice daily for 45 d) versus ILMA (weekly for up to 3 months), Outcome 3 Scarring.
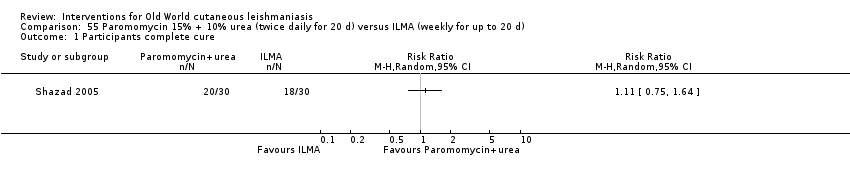
Comparison 55 Paromomycin 15% + 10% urea (twice daily for 20 d) versus ILMA (weekly for up to 20 d), Outcome 1 Participants complete cure.

Comparison 55 Paromomycin 15% + 10% urea (twice daily for 20 d) versus ILMA (weekly for up to 20 d), Outcome 2 Adverse effects.
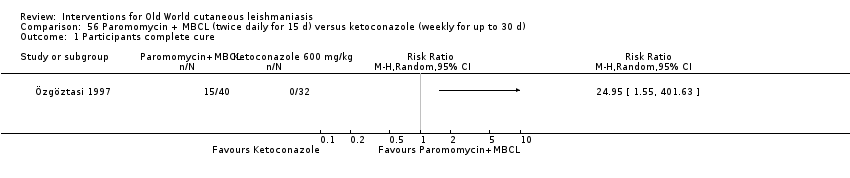
Comparison 56 Paromomycin + MBCL (twice daily for 15 d) versus ketoconazole (weekly for up to 30 d), Outcome 1 Participants complete cure.

Comparison 56 Paromomycin + MBCL (twice daily for 15 d) versus ketoconazole (weekly for up to 30 d), Outcome 2 Microbiological cure of skin lesions.
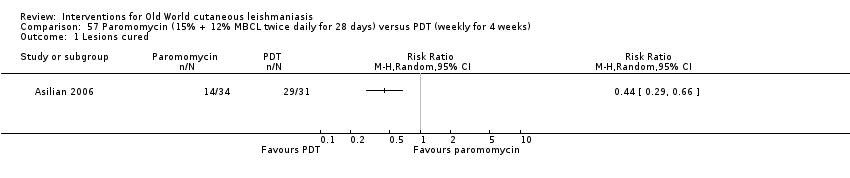
Comparison 57 Paromomycin (15% + 12% MBCL twice daily for 28 days) versus PDT (weekly for 4 weeks), Outcome 1 Lesions cured.
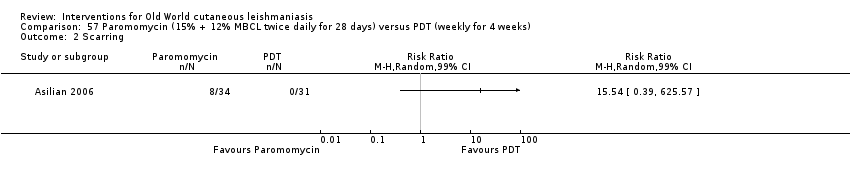
Comparison 57 Paromomycin (15% + 12% MBCL twice daily for 28 days) versus PDT (weekly for 4 weeks), Outcome 2 Scarring.

Comparison 57 Paromomycin (15% + 12% MBCL twice daily for 28 days) versus PDT (weekly for 4 weeks), Outcome 3 Microbiological cure of skin lesions.

Comparison 58 Paromomycin (4 weeks) versus paromomycin (2 weeks) + vehicle (2 weeks), Outcome 1 Participants complete cure.

Comparison 58 Paromomycin (4 weeks) versus paromomycin (2 weeks) + vehicle (2 weeks), Outcome 2 Microbiological cure of skin lesions.
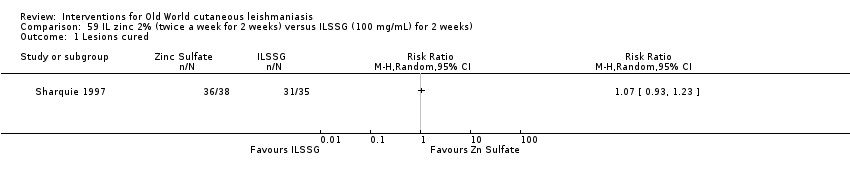
Comparison 59 IL zinc 2% (twice a week for 2 weeks) versus ILSSG (100 mg/mL) for 2 weeks), Outcome 1 Lesions cured.

Comparison 60 IL zinc 2% (twice a week for 2 weeks) versus IL 7% HSCS for 2 weeks, Outcome 1 Lesions cured.
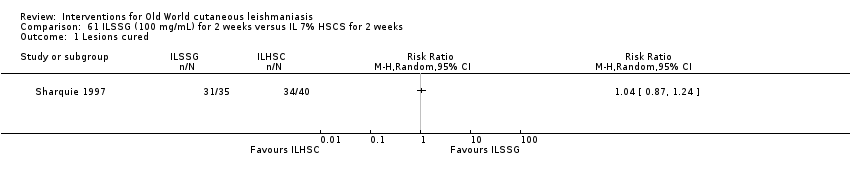
Comparison 61 ILSSG (100 mg/mL) for 2 weeks versus IL 7% HSCS for 2 weeks, Outcome 1 Lesions cured.
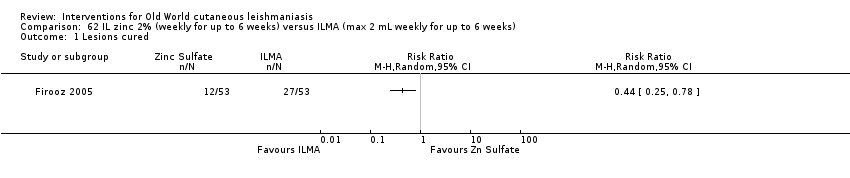
Comparison 62 IL zinc 2% (weekly for up to 6 weeks) versus ILMA (max 2 mL weekly for up to 6 weeks), Outcome 1 Lesions cured.

Comparison 62 IL zinc 2% (weekly for up to 6 weeks) versus ILMA (max 2 mL weekly for up to 6 weeks), Outcome 2 Participants complete cured.
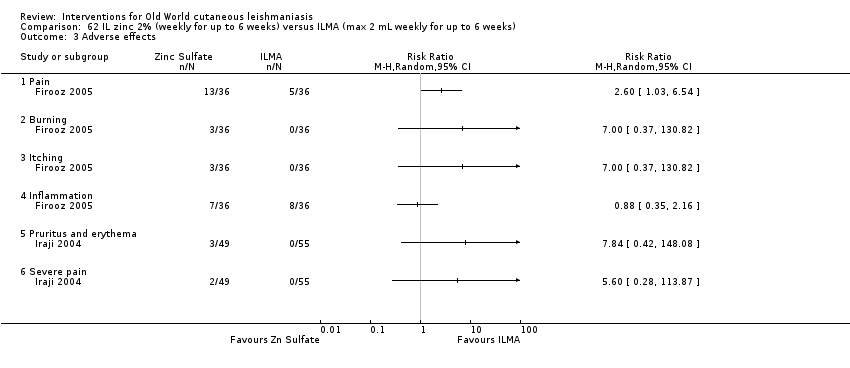
Comparison 62 IL zinc 2% (weekly for up to 6 weeks) versus ILMA (max 2 mL weekly for up to 6 weeks), Outcome 3 Adverse effects.
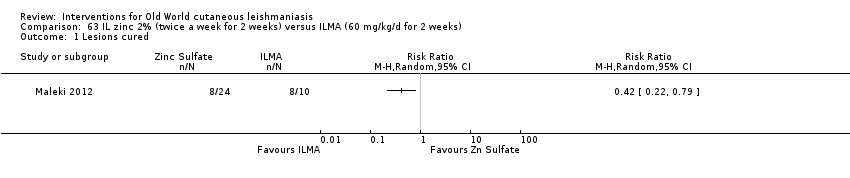
Comparison 63 IL zinc 2% (twice a week for 2 weeks) versus ILMA (60 mg/kg/d for 2 weeks), Outcome 1 Lesions cured.

Comparison 63 IL zinc 2% (twice a week for 2 weeks) versus ILMA (60 mg/kg/d for 2 weeks), Outcome 2 Adverse effects.
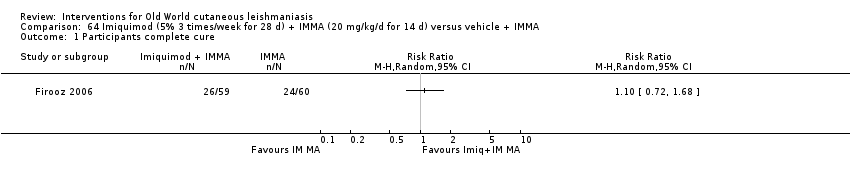
Comparison 64 Imiquimod (5% 3 times/week for 28 d) + IMMA (20 mg/kg/d for 14 d) versus vehicle + IMMA, Outcome 1 Participants complete cure.

Comparison 64 Imiquimod (5% 3 times/week for 28 d) + IMMA (20 mg/kg/d for 14 d) versus vehicle + IMMA, Outcome 2 Participants with treated lesions that recur.

Comparison 64 Imiquimod (5% 3 times/week for 28 d) + IMMA (20 mg/kg/d for 14 d) versus vehicle + IMMA, Outcome 3 Adverse effects.
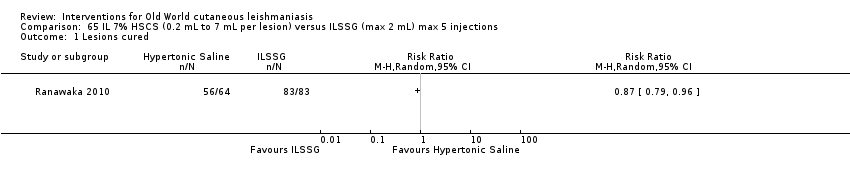
Comparison 65 IL 7% HSCS (0.2 mL to 7 mL per lesion) versus ILSSG (max 2 mL) max 5 injections, Outcome 1 Lesions cured.

Comparison 66 IL 5% HSCS (0.5 mL to 1 mL per lesion) versus ILMA (0.5 mL to 1 mL per lesion) weekly for 6 to 10 weeks, Outcome 1 Lesions cured.

Comparison 66 IL 5% HSCS (0.5 mL to 1 mL per lesion) versus ILMA (0.5 mL to 1 mL per lesion) weekly for 6 to 10 weeks, Outcome 2 Adverse effects.

Comparison 67 IL 7% HSCS (0.1 mL to 0.5 mL per lesion) versus IL 2% ciprofloxacin solution (0.1 mL to 0.5 mL per lesion), Outcome 1 Lesions cured.

Comparison 68 IL 15% HSCS (0.2 mL to 4 mL per lesion) maximum 5 injections versus IL 10% HSCS (0.2 mL to 4 mL per lesion), Outcome 1 Lesions cured.
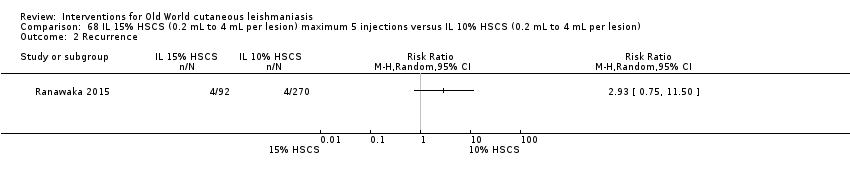
Comparison 68 IL 15% HSCS (0.2 mL to 4 mL per lesion) maximum 5 injections versus IL 10% HSCS (0.2 mL to 4 mL per lesion), Outcome 2 Recurrence.

Comparison 68 IL 15% HSCS (0.2 mL to 4 mL per lesion) maximum 5 injections versus IL 10% HSCS (0.2 mL to 4 mL per lesion), Outcome 3 Speed of healing (weeks).
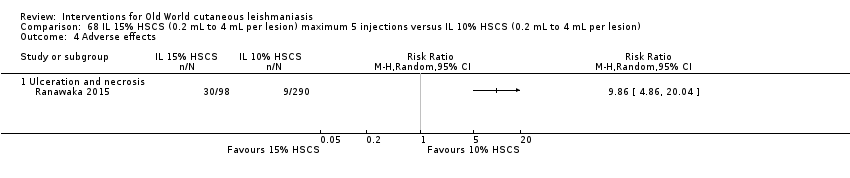
Comparison 68 IL 15% HSCS (0.2 mL to 4 mL per lesion) maximum 5 injections versus IL 10% HSCS (0.2 mL to 4 mL per lesion), Outcome 4 Adverse effects.
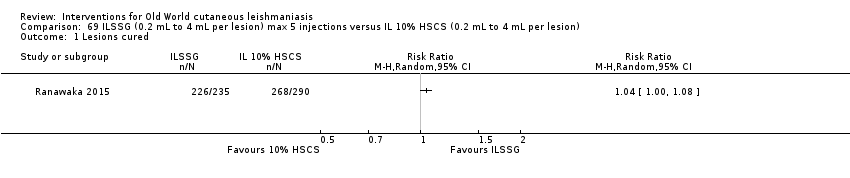
Comparison 69 ILSSG (0.2 mL to 4 mL per lesion) max 5 injections versus IL 10% HSCS (0.2 mL to 4 mL per lesion), Outcome 1 Lesions cured.

Comparison 69 ILSSG (0.2 mL to 4 mL per lesion) max 5 injections versus IL 10% HSCS (0.2 mL to 4 mL per lesion), Outcome 2 Recurrence.

Comparison 69 ILSSG (0.2 mL to 4 mL per lesion) max 5 injections versus IL 10% HSCS (0.2 mL to 4 mL per lesion), Outcome 3 Speed of healing (weeks).

Comparison 69 ILSSG (0.2 mL to 4 mL per lesion) max 5 injections versus IL 10% HSCS (0.2 mL to 4 mL per lesion), Outcome 4 Adverse effects.
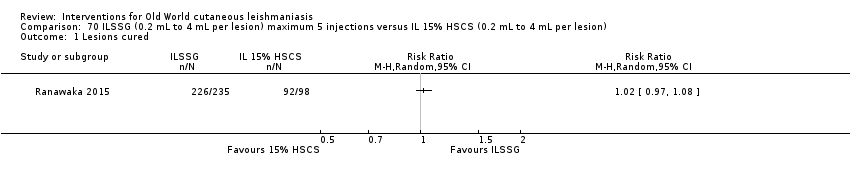
Comparison 70 ILSSG (0.2 mL to 4 mL per lesion) maximum 5 injections versus IL 15% HSCS (0.2 mL to 4 mL per lesion), Outcome 1 Lesions cured.

Comparison 70 ILSSG (0.2 mL to 4 mL per lesion) maximum 5 injections versus IL 15% HSCS (0.2 mL to 4 mL per lesion), Outcome 2 Recurrence.
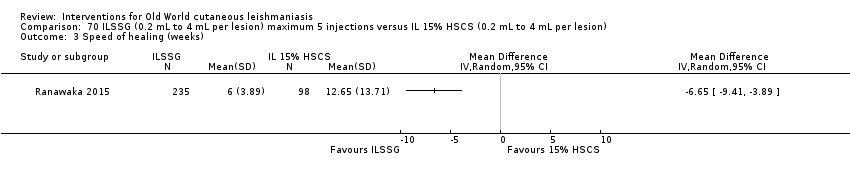
Comparison 70 ILSSG (0.2 mL to 4 mL per lesion) maximum 5 injections versus IL 15% HSCS (0.2 mL to 4 mL per lesion), Outcome 3 Speed of healing (weeks).

Comparison 70 ILSSG (0.2 mL to 4 mL per lesion) maximum 5 injections versus IL 15% HSCS (0.2 mL to 4 mL per lesion), Outcome 4 Adverse effects.

Comparison 71 IL IFN‐γ (weekly for 5 weeks) versus ILMA (0.5 mL to 1 mL per lesion) weekly for 5 weeks, Outcome 1 Lesions cured.
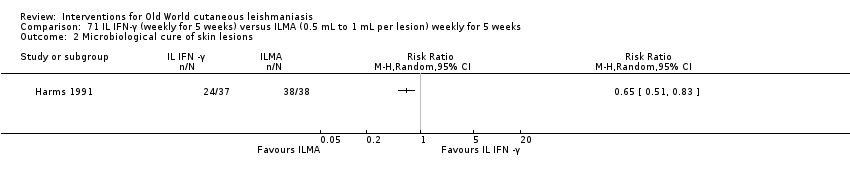
Comparison 71 IL IFN‐γ (weekly for 5 weeks) versus ILMA (0.5 mL to 1 mL per lesion) weekly for 5 weeks, Outcome 2 Microbiological cure of skin lesions.

Comparison 72 WR279,396 (twice a day for 20 d) versus vehicle (twice a day for 20 d), Outcome 1 Participants complete cure.

Comparison 72 WR279,396 (twice a day for 20 d) versus vehicle (twice a day for 20 d), Outcome 2 Adverse effects.

Comparison 73 IL metronidazole (2.5 mg to 10 mg each lesion) versus ILMA (150 mg to 600 mg each lesion) for up to 8 weeks, Outcome 1 Participants complete cure.
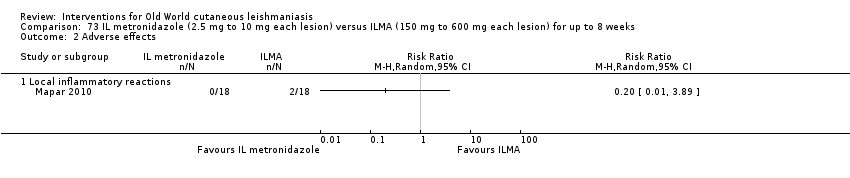
Comparison 73 IL metronidazole (2.5 mg to 10 mg each lesion) versus ILMA (150 mg to 600 mg each lesion) for up to 8 weeks, Outcome 2 Adverse effects.

Comparison 74 Topical miltefosine 6% (once daily) versus ILMA (twice a week) for up to 28 d, Outcome 1 Participants complete cure.

Comparison 75 Dapsone gel 5% (twice a day) + ILMA (weekly) versus cryotherapy (every 2 weeks) + IMMA (weekly) for up to 16 weeks, Outcome 1 Lesions cured.
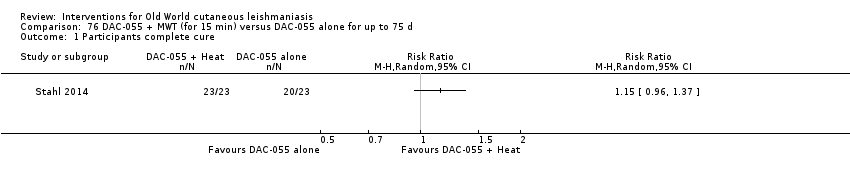
Comparison 76 DAC‐055 + MWT (for 15 min) versus DAC‐055 alone for up to 75 d, Outcome 1 Participants complete cure.
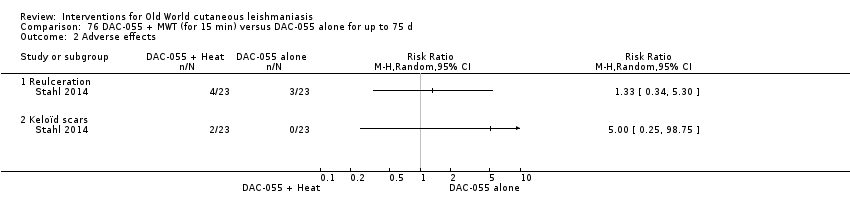
Comparison 76 DAC‐055 + MWT (for 15 min) versus DAC‐055 alone for up to 75 d, Outcome 2 Adverse effects.

Comparison 77 DAC‐055 + heat (for 15 min) versus ILSSG (0.6 mL) for up to 75 d, Outcome 1 Participants complete cure.
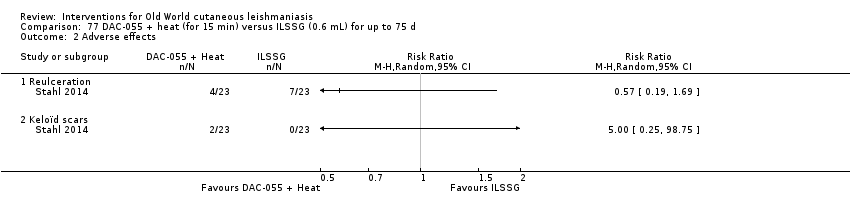
Comparison 77 DAC‐055 + heat (for 15 min) versus ILSSG (0.6 mL) for up to 75 d, Outcome 2 Adverse effects.

Comparison 78 DAC‐055 alone (for 15 min) versus ILSSG (0.6 mL) for up to 75 d, Outcome 1 Participants complete cure.

Comparison 78 DAC‐055 alone (for 15 min) versus ILSSG (0.6 mL) for up to 75 d, Outcome 2 Adverse effects.

Comparison 79 Thio‐Ben (1 mL to 2 mL daily) + cryotherapy (fortnightly) versus ILMA (0.5 mL to 2 mL per lesions) weekly + cryotherapy (fortnightly) for up to 12 weeks, Outcome 1 Lesions cured.
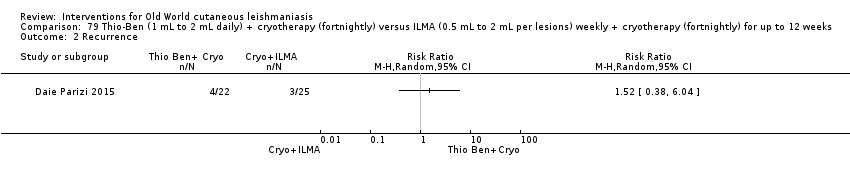
Comparison 79 Thio‐Ben (1 mL to 2 mL daily) + cryotherapy (fortnightly) versus ILMA (0.5 mL to 2 mL per lesions) weekly + cryotherapy (fortnightly) for up to 12 weeks, Outcome 2 Recurrence.
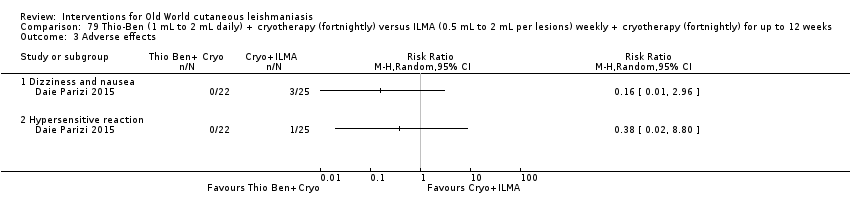
Comparison 79 Thio‐Ben (1 mL to 2 mL daily) + cryotherapy (fortnightly) versus ILMA (0.5 mL to 2 mL per lesions) weekly + cryotherapy (fortnightly) for up to 12 weeks, Outcome 3 Adverse effects.

Comparison 80 CO₂ laser (30 W continuous) versus IMMA (50 mg/kg/d) for up to 15 d, Outcome 1 Lesions cured.

Comparison 80 CO₂ laser (30 W continuous) versus IMMA (50 mg/kg/d) for up to 15 d, Outcome 2 Adverse effects.

Comparison 81 CO₂ laser (30 W continuous) versus cryotherapy (fortnightly) + ILMA (weekly) for up to 12 weeks, Outcome 1 Lesions cured.
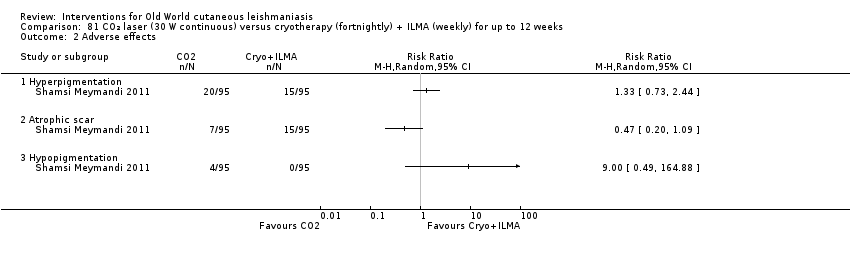
Comparison 81 CO₂ laser (30 W continuous) versus cryotherapy (fortnightly) + ILMA (weekly) for up to 12 weeks, Outcome 2 Adverse effects.

Comparison 82 Ablative CO₂ laser (25 kW for 1 session) versus 3 weeks fractional CO₂ laser, Outcome 1 Partcipants complete cure.
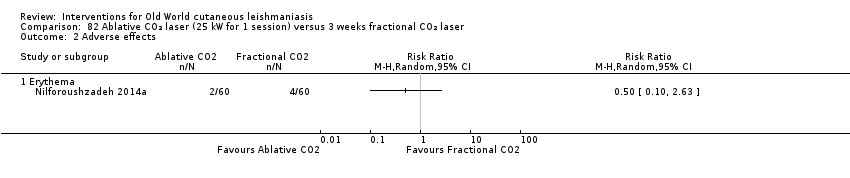
Comparison 82 Ablative CO₂ laser (25 kW for 1 session) versus 3 weeks fractional CO₂ laser, Outcome 2 Adverse effects.

Comparison 83 TCA (50% wt/vol) fortnightly up to 3 times versus ILMA alone (weekly for up to 6 weeks), Outcome 1 Participants complete cure.
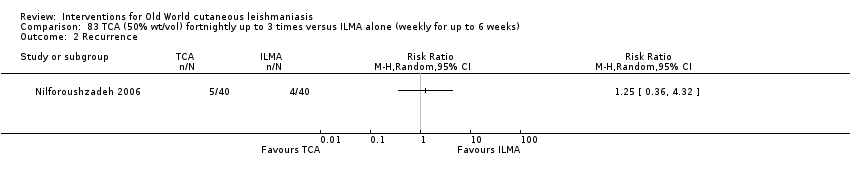
Comparison 83 TCA (50% wt/vol) fortnightly up to 3 times versus ILMA alone (weekly for up to 6 weeks), Outcome 2 Recurrence.

Comparison 83 TCA (50% wt/vol) fortnightly up to 3 times versus ILMA alone (weekly for up to 6 weeks), Outcome 3 Adverse effects.

Comparison 83 TCA (50% wt/vol) fortnightly up to 3 times versus ILMA alone (weekly for up to 6 weeks), Outcome 4 Microbiological cure of skin lesions.
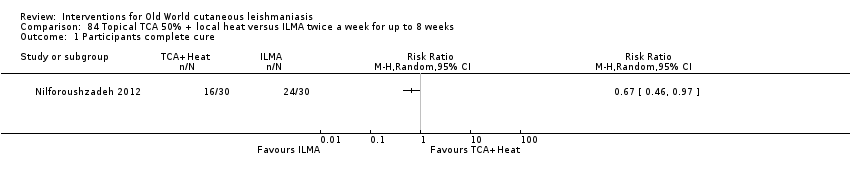
Comparison 84 Topical TCA 50% + local heat versus ILMA twice a week for up to 8 weeks, Outcome 1 Participants complete cure.
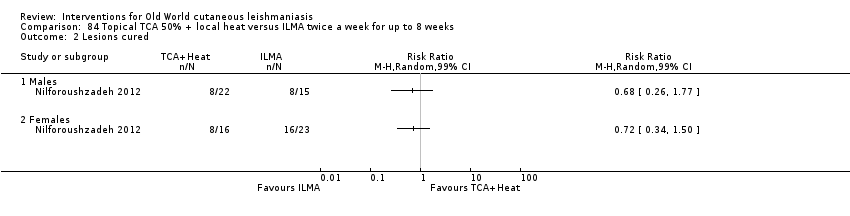
Comparison 84 Topical TCA 50% + local heat versus ILMA twice a week for up to 8 weeks, Outcome 2 Lesions cured.

Comparison 85 TCA + ILMA (weekly for up to 8 weeks) versus ILMA alone (twice a week for up to 8 weeks), Outcome 1 Participants complete cure.

Comparison 85 TCA + ILMA (weekly for up to 8 weeks) versus ILMA alone (twice a week for up to 8 weeks), Outcome 2 Speed of healing (weeks).
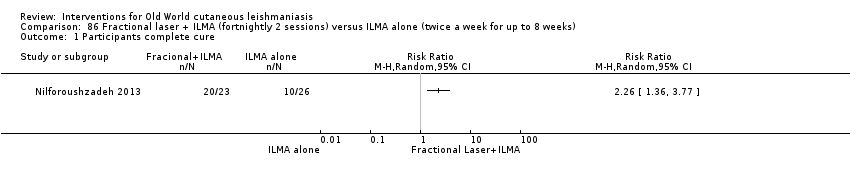
Comparison 86 Fractional laser + ILMA (fortnightly 2 sessions) versus ILMA alone (twice a week for up to 8 weeks), Outcome 1 Participants complete cure.

Comparison 87 TCA + ILMA (weekly for up to 8 weeks) versus fractional laser + ILMA (fortnightly 2 sessions), Outcome 1 Participants complete cure.

Comparison 87 TCA + ILMA (weekly for up to 8 weeks) versus fractional laser + ILMA (fortnightly 2 sessions), Outcome 2 Speed of healing (weeks).

Comparison 88 TCA fortnightly up to 8 weeks + ILMA (twice a week) versus ILMA alone (weekly for up to 8 weeks), Outcome 1 Participants complete cure.
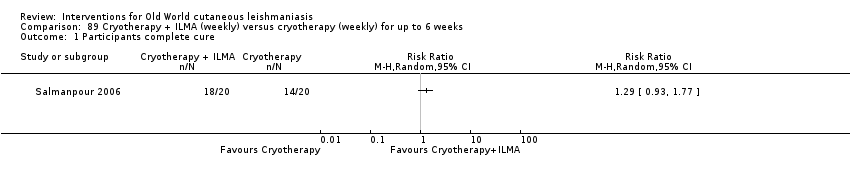
Comparison 89 Cryotherapy + ILMA (weekly) versus cryotherapy (weekly) for up to 6 weeks, Outcome 1 Participants complete cure.

Comparison 89 Cryotherapy + ILMA (weekly) versus cryotherapy (weekly) for up to 6 weeks, Outcome 2 Adverse effects.
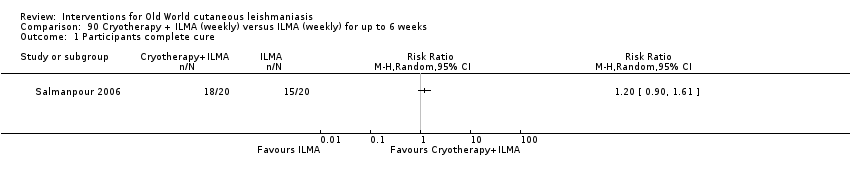
Comparison 90 Cryotherapy + ILMA (weekly) versus ILMA (weekly) for up to 6 weeks, Outcome 1 Participants complete cure.

Comparison 90 Cryotherapy + ILMA (weekly) versus ILMA (weekly) for up to 6 weeks, Outcome 2 Adverse effects.

Comparison 91 Cryotherapy + ILMA (weekly) versus ILMA alone (weekly) for up to 6 weeks, Outcome 1 Participants complete cure.
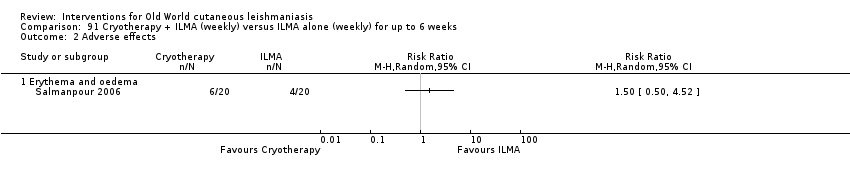
Comparison 91 Cryotherapy + ILMA (weekly) versus ILMA alone (weekly) for up to 6 weeks, Outcome 2 Adverse effects.

Comparison 92 Cryotherapy (weekly) versus ILMA (weekly) for up to 6 weeks, Outcome 1 Participants complete cure.
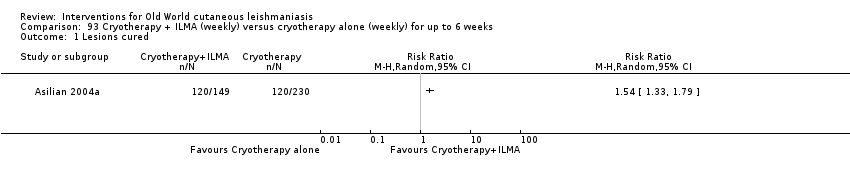
Comparison 93 Cryotherapy + ILMA (weekly) versus cryotherapy alone (weekly) for up to 6 weeks, Outcome 1 Lesions cured.

Comparison 93 Cryotherapy + ILMA (weekly) versus cryotherapy alone (weekly) for up to 6 weeks, Outcome 2 Adverse effects.

Comparison 94 Cryotherapy + ILMA (weekly) versus ILMA (fortnightly) for up to 6 weeks, Outcome 1 Lesions cured.

Comparison 94 Cryotherapy + ILMA (weekly) versus ILMA (fortnightly) for up to 6 weeks, Outcome 2 Adverse effects.
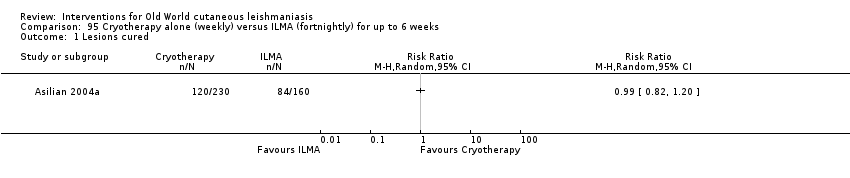
Comparison 95 Cryotherapy alone (weekly) versus ILMA (fortnightly) for up to 6 weeks, Outcome 1 Lesions cured.

Comparison 95 Cryotherapy alone (weekly) versus ILMA (fortnightly) for up to 6 weeks, Outcome 2 Adverse effects.

Comparison 96 Cryotherapy (fortnightly) + 15% paromomycin + 10% urea cream (twice a day) + ILMA (twice a day for 4 weeks) versus ILMA (twice a week) for up to 6 weeks, Outcome 1 Participants complete cure.

Comparison 97 Cryotherapy (weekly) + 3% salicylic + 3% sodium nitrite cream (twice a day) for up to 12 weeks versus cryotherapy (weekly) + 3% salicylic cream (twice a day), Outcome 1 Lesions cured.
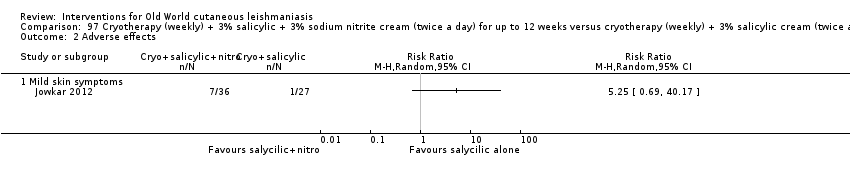
Comparison 97 Cryotherapy (weekly) + 3% salicylic + 3% sodium nitrite cream (twice a day) for up to 12 weeks versus cryotherapy (weekly) + 3% salicylic cream (twice a day), Outcome 2 Adverse effects.
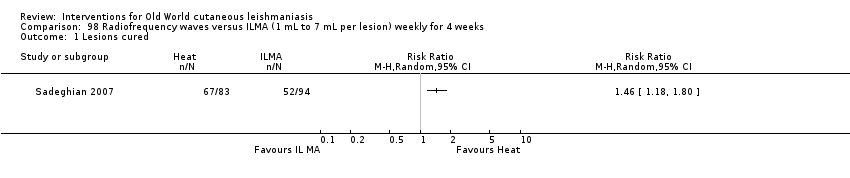
Comparison 98 Radiofrequency waves versus ILMA (1 mL to 7 mL per lesion) weekly for 4 weeks, Outcome 1 Lesions cured.
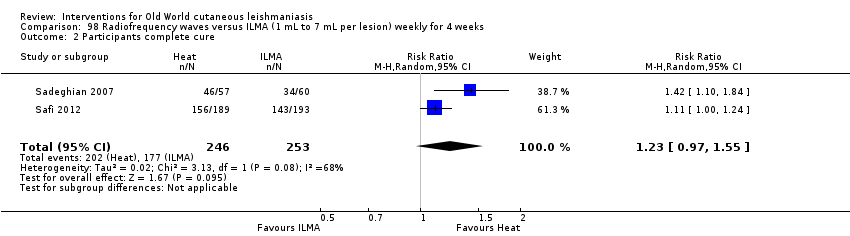
Comparison 98 Radiofrequency waves versus ILMA (1 mL to 7 mL per lesion) weekly for 4 weeks, Outcome 2 Participants complete cure.
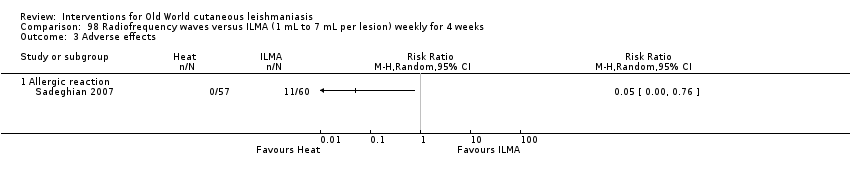
Comparison 98 Radiofrequency waves versus ILMA (1 mL to 7 mL per lesion) weekly for 4 weeks, Outcome 3 Adverse effects.

Comparison 99 Radiofrequency waves (50 uCTM applied for 30 s) versus ILSSG (10 days of 20 mg/kg/d), Outcome 1 Lesions cured.

Comparison 99 Radiofrequency waves (50 uCTM applied for 30 s) versus ILSSG (10 days of 20 mg/kg/d), Outcome 2 Adverse effects (serious).

Comparison 100 Radiofrequency waves (1 treatment of > 1 consecutive application at 50ºC for 30 s) versus IMSSG (20 mg/kg/d for 3 weeks), Outcome 1 Participants complete cure.

Comparison 100 Radiofrequency waves (1 treatment of > 1 consecutive application at 50ºC for 30 s) versus IMSSG (20 mg/kg/d for 3 weeks), Outcome 2 Adverse event (secondary infection).
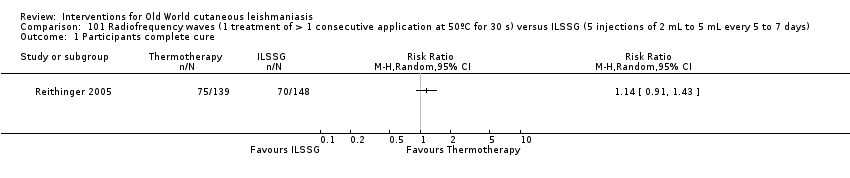
Comparison 101 Radiofrequency waves (1 treatment of > 1 consecutive application at 50ºC for 30 s) versus ILSSG (5 injections of 2 mL to 5 mL every 5 to 7 days), Outcome 1 Participants complete cure.

Comparison 101 Radiofrequency waves (1 treatment of > 1 consecutive application at 50ºC for 30 s) versus ILSSG (5 injections of 2 mL to 5 mL every 5 to 7 days), Outcome 2 Adverse event (secondary infection).

Comparison 102 Radiofrequency waves versus ILSSG, Outcome 1 Participants complete cure.
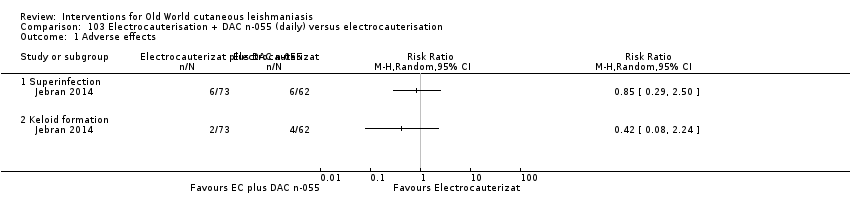
Comparison 103 Electrocauterisation + DAC n‐055 (daily) versus electrocauterisation, Outcome 1 Adverse effects.
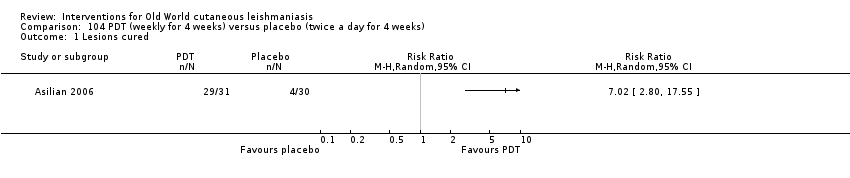
Comparison 104 PDT (weekly for 4 weeks) versus placebo (twice a day for 4 weeks), Outcome 1 Lesions cured.

Comparison 104 PDT (weekly for 4 weeks) versus placebo (twice a day for 4 weeks), Outcome 2 Scarring.

Comparison 104 PDT (weekly for 4 weeks) versus placebo (twice a day for 4 weeks), Outcome 3 Microbiological cure of skin lesions.

Comparison 105 Mesotherapy gun (0.5 mL of MA weekly) versus ILMA (0.1 mL weekly) for up to 6 weeks, Outcome 1 Participants complete cure.
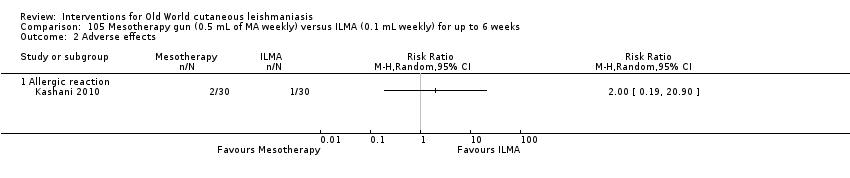
Comparison 105 Mesotherapy gun (0.5 mL of MA weekly) versus ILMA (0.1 mL weekly) for up to 6 weeks, Outcome 2 Adverse effects.

Comparison 105 Mesotherapy gun (0.5 mL of MA weekly) versus ILMA (0.1 mL weekly) for up to 6 weeks, Outcome 3 Development of cell‐mediated immunity.

Comparison 106 Diminazene aceturate solution (weekly) versus cetrimide + chlorhexidine solution for 50 d, Outcome 1 Participants complete cure.
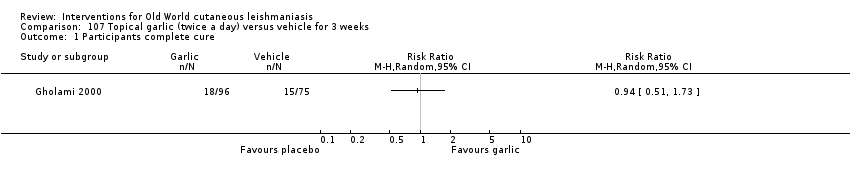
Comparison 107 Topical garlic (twice a day) versus vehicle for 3 weeks, Outcome 1 Participants complete cure.

Comparison 108 Topical herbal extract + placebo (5 d) versus IMMA (15‐20/mg/kg/d) + vehicle for 20 d, Outcome 1 Participants complete cure.
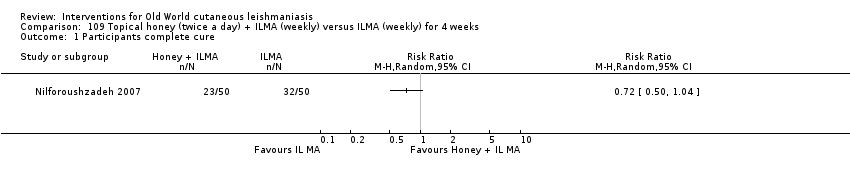
Comparison 109 Topical honey (twice a day) + ILMA (weekly) versus ILMA (weekly) for 4 weeks, Outcome 1 Participants complete cure.
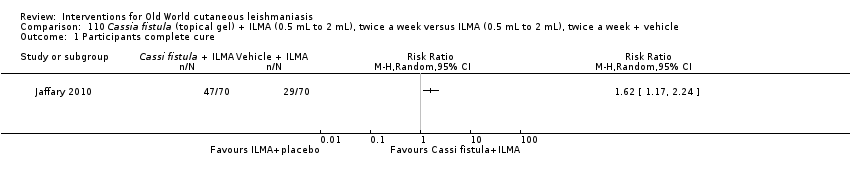
Comparison 110 Cassia fistula (topical gel) + ILMA (0.5 mL to 2 mL), twice a week versus ILMA (0.5 mL to 2 mL), twice a week + vehicle, Outcome 1 Participants complete cure.

Comparison 110 Cassia fistula (topical gel) + ILMA (0.5 mL to 2 mL), twice a week versus ILMA (0.5 mL to 2 mL), twice a week + vehicle, Outcome 2 Adverse effects.

Comparison 111 Cassia fistula boiled (topical) versus ILMA (0.5 mL to 2 mL), twice a week for 4 weeks, Outcome 1 Participants complete cure.

Comparison 111 Cassia fistula boiled (topical) versus ILMA (0.5 mL to 2 mL), twice a week for 4 weeks, Outcome 2 Speed of healing (weeks).

Comparison 111 Cassia fistula boiled (topical) versus ILMA (0.5 mL to 2 mL), twice a week for 4 weeks, Outcome 3 Adverse effects.
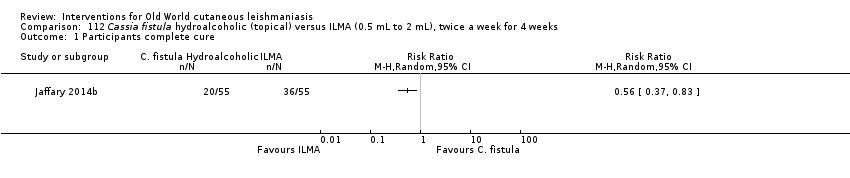
Comparison 112 Cassia fistula hydroalcoholic (topical) versus ILMA (0.5 mL to 2 mL), twice a week for 4 weeks, Outcome 1 Participants complete cure.

Comparison 112 Cassia fistula hydroalcoholic (topical) versus ILMA (0.5 mL to 2 mL), twice a week for 4 weeks, Outcome 2 Speed of healing (weeks).

Comparison 112 Cassia fistula hydroalcoholic (topical) versus ILMA (0.5 mL to 2 mL), twice a week for 4 weeks, Outcome 3 Adverse reaction.

Comparison 113 Cassia fistula boiled (topical) versusC fistula hydroalcoholic (topical) for 4 weeks, Outcome 1 Participants complete cure.
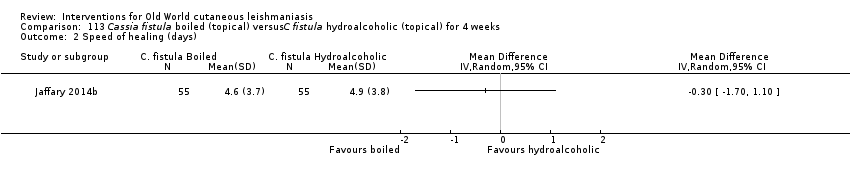
Comparison 113 Cassia fistula boiled (topical) versusC fistula hydroalcoholic (topical) for 4 weeks, Outcome 2 Speed of healing (days).

Comparison 113 Cassia fistula boiled (topical) versusC fistula hydroalcoholic (topical) for 4 weeks, Outcome 3 Adverse effects.
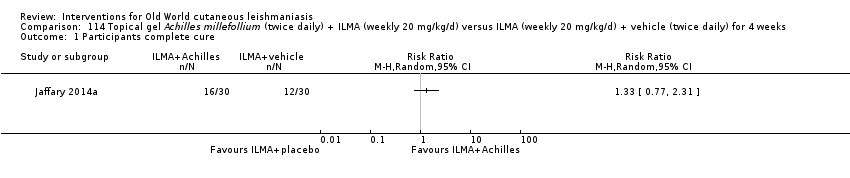
Comparison 114 Topical gel Achilles millefollium (twice daily) + ILMA (weekly 20 mg/kg/d) versus ILMA (weekly 20 mg/kg/d) + vehicle (twice daily) for 4 weeks, Outcome 1 Participants complete cure.

Comparison 114 Topical gel Achilles millefollium (twice daily) + ILMA (weekly 20 mg/kg/d) versus ILMA (weekly 20 mg/kg/d) + vehicle (twice daily) for 4 weeks, Outcome 2 Adverse effects.

Comparison 114 Topical gel Achilles millefollium (twice daily) + ILMA (weekly 20 mg/kg/d) versus ILMA (weekly 20 mg/kg/d) + vehicle (twice daily) for 4 weeks, Outcome 3 Microbiological cure of skin lesions.
| Itraconazole (200 mg for 6‐8 weeks) versus placebo for Old World cutaneous leishmaniasis | ||||||
| Patient or population: patients with Old World cutaneous leishmaniasis | ||||||
| Outcomes | Illustrative comparative risks* (95% CI) | Relative effect | No of participants | Certainty of the evidence | Comments | |
| Assumed risk | Corresponding risk | |||||
| Placebo | Itraconazole (200 mg for 6‐8 weeks) | |||||
| Percentage of lesions cured after the end of treatment | Not measured in this comparison | |||||
| Percentage of participants with complete cure | Study population | RR 3.70 | 244 | ⊕⊝⊝⊝ | — | |
| 454 per 1000 | 1000 per 1000 | |||||
| Moderate | ||||||
| 100 per 1000 | 370 per 1000 | |||||
| Adverse effects Mild abdominal pain and nausea Adverse effects Mild abnormal liver function | 40 per 1000 0 per 1000 | 95 per 1000 0 per 1000 | RR 2.36 RR 3.08 | 204 84 | ⊕⊝⊝⊝ ⊕⊝⊝⊝ | — |
| Speed of healing (time taken to be 'cured') | Neither of the studies reported speed of healing (time taken to be 'cured') in this comparison. | |||||
| Microbiological or histopathological cure of skin lesions | Not estimable | Not estimable | RR 17.00 | 20 | ⊕⊝⊝⊝ | There were zero events in the placebo group |
| *The basis for the assumed risk (e.g. the median control group risk across studies) is provided in footnotes. The corresponding risk (and its 95% confidence interval) is based on the assumed risk in the comparison group and the relative effect of the intervention (and its 95% CI). | ||||||
| GRADE Working Group grades of evidence | ||||||
| aDowngraded by 4 levels due to: risk of bias (2 RCTs have many uncertain items), inconsistency (there is considerable heterogeneity ‐ I² = 73%), and imprecision (2 levels due to wide 95% confidence intervals, crossing the line of no effect). | ||||||
| Paromomycin ointment versus matched vehicle for Old World cutaneous leishmaniasis | |||||
| Patient or population: patients with Old World cutaneous leishmaniasis | |||||
| Outcomes | Illustrative comparative risks* (95% CI) | Relative effect | No of participants | Certainty of the evidence | |
| Assumed risk | Corresponding risk | ||||
| Vehicle | Paromomycin ointment (15% + 10% urea) twice daily for 14 days | ||||
| Percentage of lesions cured after the end of treatment | Not measured in this comparison | ||||
| Percentage of participants with complete cure | Study population | RR 1.00 | 383 | ⊕⊝⊝⊝ | |
| 623 per 1000 | 623 per 1000 | ||||
| Moderate | |||||
| 619 per 1000 | 619 per 1000 | ||||
| Adverse effects Skin/local reactions | Study population | RR 1.42 | 713 | ⊕⊝⊝⊝ | |
| 96 per 1000 | 136 per 1000 | ||||
| Moderate | |||||
| 90 per 1000 | 128 per 1000 | ||||
| Speed of healing (time taken to be 'cured') | Not measured in this comparison | ||||
| Microbiological or histopathological cure of skin lesions | Study population | RR 1.03 | 383 | ⊕⊝⊝⊝ | |
| 859 per 1000 | 884 per 1000 | ||||
| Moderate | |||||
| 792 per 1000 | 816 per 1000 | ||||
| *The basis for the assumed risk (e.g. the median control group risk across studies) is provided in footnotes. The corresponding risk (and its 95% confidence interval) is based on the assumed risk in the comparison group and the relative effect of the intervention (and its 95% CI). | |||||
| GRADE Working Group grades of evidence | |||||
| aDowngraded by 4 levels due to risk of bias (1 RCT has many uncertain risks), indirectness (2 levels because one of the studies focused on young people), and imprecision (the confidence interval around the estimate risk ratio ranges from a 14% reduction to a 17% increase in the risk ratio for healing with paromomycin). | |||||
| Term | Definition |
| Antimonials | Pharmaceutical agents containing antimony. Antimony‐containing compounds (meglumine antimoniate and sodium stibogluconate) are the principal medications used to treat leishmaniases, an infection caused by a protozoan parasite. |
| Arthralgia | Pain in the joints. The causes of arthralgia are varied and range, from a joints perspective, from degenerative and destructive processes such as osteoarthritis and sports injuries to inflammation of tissues surrounding the joints, such as bursitis. |
| Cardiac arrhythmia | An arrhythmia is an abnormal heart rhythm. Many types of arrhythmia have no symptoms. When symptoms are present these may include palpitations or feeling a pause between heartbeats. More seriously there may be lightheadedness, passing out, shortness of breath, or chest pain. |
| Cutaneous necrosis | The death of living tissues in response to disease or injury. |
| Cytolysis | The degeneration or dissolution of cell caused by the disruption of cell membrane. |
| Exudate | A fluid with a high content of protein and cellular debris that has escaped from blood vessels and has been deposited in tissues or on tissue surfaces, usually as a result of inflammation. |
| Human monocytes | Monocytes are the biggest type of white blood cell in the immune system. Originally formed in the bone marrow, they are released into our blood and migrate into the connective tissue where they differentiate into macrophages. When certain germs enter the body, they quickly rush to the site of attack. |
| Hypotension | A systolic blood pressure reading (the top number) of 90 millimetres of mercury (mmHg) or less a diastolic blood pressure reading (the bottom number) of 60 mmHg or less is generally considered low blood pressure. The causes of low blood pressure can range from dehydration to serious medical or surgical disorders. |
| Immune response modifier | Any of a broad family of biomolecules that up‐ or down‐regulate, or restore immune responsiveness, which are generated after T cells recognise an antigen present on the surface of a self‐antigen‐presenting cell, which, once activated, produce multiple cytokines. |
| Immunolabeling | A biochemical process that enables the detection and localisation of an antigen to a particular site within a cell, tissue, or organ. Antigens are organic molecules, usually proteins, capable of binding to an antibody. These antigens can be visualised using a combination of antigen‐specific antibodies as well as a means of detection, called a tag, that is covalently linked to the antibody. If the immunolabeling process is meant to reveal information about a cell or its substructures, the process is called immunocytochemistry. Immunolabeling of larger structures is called immunohistochemistry. |
| In vitro | Biological processes or reactions made to occur outside the living organism in an artificial environment, such as a culture medium. |
| Intralesional meglumine antimoniate | Meglumine antimoniate (or Glucantime) is a medicine used for treating leishmaniasis. It belongs to a group of compounds known as the pentavalent antimonials. |
| Lymphadenopathies | Lymph nodes that have an abnormal in size, number or consistency; often used as a synonym for swollen or enlarged lymph nodes. Common causes of lymphadenopathy are infection, autoimmune disease, or malignancy. |
| Lymphatic channels | The vessels that transport lymph throughout the body. Lymph is a clear fluid that contains cells important for forming antibodies that fight infection. |
| Lymphokine | Any of various soluble protein mediators released by sensitised lymphocytes on contact with antigen, and believed to play a role in macrophage activation, lymphocyte transformation, and cell‐mediated immunity. They regulate immune responses through differentiation, amplification, and inhibition of cell functions. Lymphokines may also have a cytotoxic effector function. Used as biologic response modifiers in the treatment of cancer. |
| Macrophages | White blood cells (activated monocytes) that protect the body against infection and foreign substances by breaking them down into antigenic peptides recognised by circulating T cells. |
| Miltefosine | An oral alkyl phosphocholine analogue used to treat cutaneous and visceral leishmaniasis. Interacts with lipids and sterols in the Leishmania membrane resulting in inhibition of mitochondria and apoptotic cell death. |
| Mucous membranes | The mucous membranes (or mucosae or mucosas; singular mucosa) are linings of mostly endodermal origin, covered in epithelium, which are involved in absorption and secretion. They line cavities that are exposed to the external environment and internal organs. |
| Myalgia | Myalgia, or muscle pain, is a symptom of many diseases and disorders. The most common causes are the overuse or over‐stretching of a muscle or group of muscles. Myalgia without a traumatic history is often due to viral infections. Long‐term myalgias may be indicative of a metabolic myopathy, some nutritional deficiencies or chronic fatigue syndrome. |
| Nodular lymphangitis | Nodular lymphangitis is a distinct clinical entity, separate from lymphangitis. This disorder is characterised by inflammatory nodules along the lymphatics draining a primary skin infection |
| Papule | A solid, rounded growth that is elevated from the skin, usually inflammatory but nonsuppurative. A papule is usually less than 1 cm across. |
| Parenteral | Administration of a medicinal or therapeutic substance, other than through the gastrointestinal or respiratory tracts, e.g. by intravenous, intramuscular or subcuticular injection. |
| Pentamidine | Pentamidine (e.g. isethionate) is an antiprotozoal and antifungal agent of the class of aromatic diamidines, administered intravenously or intramuscularly in treatment of early African trypanosomiasis and leishmaniasis, and intravenously, intramuscularly, or by oral inhalation in treatment and prophylaxis of Pneumocystis carinii pneumonia. |
| Pentavalent antimony | Pentavalent antimonials are a group of compounds used for the treatment of leishmaniasis. The first pentavalent antimonial used was urea stibamine: first introduced in the 1930s, it fell out of favour in the 1950s due to higher toxicity compared to sodium stibogluconate. The compounds currently available for clinical use are: sodium stibogluconate (Pentostam; manufactured by GlaxoSmithKline; available in the USA and UK), which is administered by slow intravenous injection, intralesional or intramuscular injection, and meglumine antimoniate (Glucantime; manufactured by Aventis; available in Brazil, France and Italy), which is administered by intramuscular, intralesional, or intravenous injection. |
| Promastigotes | Term now generally used instead of 'leptomonad' or 'leptomonad stage' to avoid confusion with the flagellate genus Leptomonas. It denotes the flagellate stage of a trypanosomatid protozoan in which the flagellum arises from a kinetoplast in front of the nucleus and emerges from the anterior end of the organism; usually an extracellular phase, as in the insect intermediate host (or in culture) of Leishmania parasites. |
| Protozoan | Any of a group of single‐celled, usually microscopic, eukaryotic organisms, such as amoebas, ciliates, flagellates, and sporozoans. |
| ThermoMed device | The ThermoMed is a battery‐operated device that delivers precisely controlled localised current field radiofrequency heat to selectively destroy certain diseased tissue and is recommended by the World Health Organization as an alternative therapy for cutaneus leishmaniasis. |
| Thermotherapy | The treatment of disease by the application of heat. Thermotherapy may be administered as dry heat with heat lamps, diathermy machines, electric pads, or hot water bottles or as moist heat with warm compresses or immersion in warm water. Warm soaks or compresses may be used to treat local infections, relax muscles and relieve pain in patients with motor problems, and promote circulation in peripheral vascular disorders such as thrombophlebitis. |
| Drug | Doses |
| Systemic antimonials | |
| Sodium stibogluconate (Pentostam, Stibanate) Meglumine antimonate (Glucantime) Combined with pentoxifylline | 20 mgSb v+/kg/d intramuscularly or intravenously for 20‐30 days 400 mg orally 3 times a day for 10–20 days |
| Intralesional antimonials | |
| Sodium stibogluconate (Pentostam, Stibanate) Meglumine antimonate (Glucantime) | 1–5 mL per session every 3–7 days. Up to 10 sessions depending on the clinical response, but most patients require ≤ 5 sessions |
| Non‐antimonial systemic treatments | |
| Fluconazole | 200 mg orally daily for 6 weeks |
| Miltefosine | 50 mg orally three times daily for 28 days |
| Liposomal amphotericin B | 3 mg/kg/d IV on days 1‐5 and 10 (18 mg/kg total dose) |
| Non‐antimonial topical or intralesional therapies | |
| 15% paromomycin/12% methylbenzethonium chloride | Ointment twice daily for 10‐20 days |
| 15% paromomycin/0.5% gentamicin sulphate | Twice a day for 20 days |
| Physical therapies | |
| Cryotherapy with liquid nitrogen | Frozen for 10‐30 s and thaw applied locally 2‐3 times in each session, repeated every 1‐4 weeks to complete healing (usually 2‐4 sessions) |
| Local heat therapy | 50°‐55ºC for 30 s by: Infrared light Direct current electrical stimulation Ultrasound Laser Radiofrequency waves ThermoMed device |
| Study | Method of assessment | Timing | Interventions | Adverse effects |
| Quote: "Biochemical tests were done to detect any toxic effects of the drug." | Biochemical tests were done at the end of 1 week, 2 weeks and 4 weeks post‐ treatment. | I1: oral rifampicin 1200 mg/d I2: placebo | Intervention 23 participants evaluated for AEs. Quote: "The drug was well‐tolerated and no side‐effects were seen in any participant." Placebo 23 participants evaluated for AEs. Not reported | |
| Quote: "clinical examination, liver function tests, renal function tests" | Quote: "Before, during, and after completion of treatment" | I1: oral rifampicin 10 mg/kg/d I2: placebo | Intervention 46 participants evaluated for AEs. Elevation liver enzymes: 1 (2%) Placebo 16 participants evaluated for AEs. Not reported | |
| Haemoglobin, leukocyte count, and liver test | Biochemical tests were done at the end of 2 week, 4 weeks and 6 weeks post‐treatment | I1: oral rifampicin + omeprazole I2: placebo | Intervention 1 23 participants evaluated for AEs. Intervention 2 21 participants evaluated for AEs. Quote: "All participants tolerated the drug and placebo very well and no side effect was reported." | |
| Not described | Azythromycin group: monthly up to 4 months | I1: azithromycin 500 mg/d I2: IMMA 60 mg/kg/d | Intervention 1 22 participants evaluated for AEs (35 lesions). Nausea and vomiting: 2 (9%) Intervention 2 27 participants evaluated for AEs (58 lesions). Myalgia: 3 (11%); Erythema: 1 (3.7%). | |
| Quote: "Complete haemogram, including haemoglobin and liver and renal function tests Participants were questioned about expected adverse effects for 3 days (Days 5–7) following administration of the doses." | Haemogram: 1 and 2 months Clinical AEs: days 5‐7; 19‐21; 33‐35; 47‐19. | I1: artesunate I2: placebo | Intervention 1 20 participants evaluated for AEs. Placebo 21 participants evaluated for AEs. Skin rash with itching: 1 (4.7%) Quote: "There was no significant difference in biological tests (liver and renal function tests) in all the participants before and after treatment." | |
| Interview, physical examination, laboratory test, evaluation for pain, standardised questionnaire for the occurrence of systemic side effects (e.g. vertigo, tinnitus). Diminished hearing was verified with audiometer. Laboratory test. | Quote: "Investigators observed each participant each day that the topical creams were administered and at follow‐up study visits (days 50‐100‐180). Clinical and laboratory evidence of side effects was determined on D10 and D20." | I1: WR 279,396 I2: placebo | Intervention 50 participants evaluated for AEs. Erythema at the site of application: 15 (30%); mild pain within 30 minutes of application: 7 (14 %); mild increases and decreases in hearing acuity from baseline: 14 (28%); change hearing acuity: 14 (28%); vertigo: 0 (0%); Increase serum creatinine: 0 (0%); Death: 0 (0%) Placebo 42 participants evaluated for AEs. Erythema at the site of application: 10 (24%); mild pain within 30 minutes of application: 6 (14 %); mild increases and decreases in hearing acuity from baseline: 9 (21%); change hearing acuity: 9 (21%); vertigo: 0 (0%); increase serum creatinine: 0 (0%); death: 0 (0%) | |
| Quote: "Participants were interviewed and underwent laboratory tests three times" | Quote: "In Allopurinol group, the participants which were visited and received medication underwent laboratory tests three times (before, one month a2fter, and end of the treatment) | I1: azithromycin + allopurinol I2: IMMA | Intervention 1 36 participants evaluated for AEs. Gastrointestinal complaints and headache severe: 1 (2.7%); slight gastrointestinal complications (nausea, heartburn, and epigastric pain): 3 (8.3%) Intervention 2 35 participants evaluated for AEs. Myalgia: 2 (5.7%) | |
| AE: adverse effect; IMMA: intramuscular meglumine antimoniate. | ||||
| Study | Method of assessment | Timing | Interventions | Adverse effects |
| Clinical evaluation and laboratory tests | Days 15, 45 and 105 | I1: paromomycin I2: placebo | 126 participants evaluated for AEs. During treatment: oedema, local pain, vesiculation: 1 (0.7%) After treatment: redness, pain, vesiculation, and inflammation: 8 (6.3%) Quote: "There were no significant differences in four laboratory test results of safety (SGOT, BUN, Hb, and WBC) between the groups either before or after treatment." | |
| Clinical evaluation, physical examination, advice to participants, laboratory test: liver function, haemoglobin and white blood cell count | Days 15, 45 and 105 | I1: paromomycin I2: placebo | 57 participants evaluated for AEs. Quote: "A local reaction (inflammation, vesication, pain and/or red ness) was recorded for 12 participants, with no significant difference between the 2 groups." Laboratory test changes: 0 (0%) | |
| Not described | At the end of treatment (day 30) and 1 month post‐treatment | I1: paromomycin + MBCL I2: oral ketoconazole | 40 participants (62 lesions) evaluated for AEs Quote: "Treatment‐related adverse effects were only observed in the paromomycin group. The most common side‐effect was the development of irritant contact dermatitis. No subjects withdrew because of this adverse effect." | |
| Clinical evaluation | Days 15, 29, 45 and 105 | I1: paromomycin I2: placebo | 108 participants evaluated for AEs. Quote: "Treatment was well tolerated, and no adverse reactions to the ointment were observed or reported in either group." | |
| Not described | Quote "Clinical evaluation and follow‐up were performed fortnightly until 1 month post treatment and then monthly until 3 months post treatment, and finally every 3 months until 1 year post treatment" | I1: paromomycin + urea I2: ILMA weekly | Not described | |
| Not described | Week 1 and week 6 post‐treatment and at 6 months after treatment was completed | I1: paromomycin + urea I2: ILMA weekly | 30 participants evaluated for AEs. Cutaneous reactions (erythematosus, urticaria or lymphadenitis with pain): 1 (3%) Quote: "No systemic toxic reaction attributable to the drug was observed." | |
| Clinical evaluation | Days 7, 14, 21 and 30 | I1: paromomycin I2: placebo | 30 participants evaluated for AEs. Mild contact dermatitis: 3 (10%) | |
| Not described | Weekly during treatment and monthly for up 2 months | I1: photodynamic therapy I2: paromomycin I3: placebo | 19 participants (34 lesions) evaluated for AEs. Quote: "Adverse side‐effects seen in some participants in all groups were pruritus, burning, redness, discharge, oedema, and pain, but all were generally mild and tolerable." | |
| Quote: "Renal toxic effects and ototoxic effects from aminoglycoside exposure were ascertained by means of serum creatinine measurements at the end of therapy (at 20 days) and participants' daily reports of tinnitus and vertigo." | Quote: "Safety end points were assessed daily during therapy (20 days)." | I1:Paromomycin ‐Gentamicin I2: paromomycin Alone I3: vehicle Control | Intervention 1: 125 participants evaluated for AEs. Erythema: 6 (5%); local infection: 0 (0%); inflammation: 0 (0%); vesicles mild‐moderate: 31 (25%); mild oedema: 2 (2%); pain: 2 (2%); mild bronchitis: 5 (4%); paronychia: 2 (2%); superinfection: 3 (2%); upper respiratory tract infection: 0 (0%); oropharyngeal pain: 4 (3%); skin irritation: 3 (2%); tinnitus: 0 (0%); vertigo: 0 (0%); creatinine serum changes: 0 (0%) Intervention 2: 125 participants evaluated for AEs. Erythema: 7 (6%); local infection: 0 (0%); inflammation: 0 (0%); vesicles mild‐moderate: 32 (26%); mild‐moderate oedema: 3 (3%); pain: 2 (2%); bronchitis mild‐moderate: 3 (3%); paronychia: 0 (0%); superinfection: 0 (0%); upper respiratory tract infection: 2 (2%); oropharyngeal pain: 3 (2%); skin irritation: 9 (7%); tinnitus: 0 (0%); vertigo: 0 (0%); creatinine serum changes: 0 (0%) | |
| AE: adverse effect; BUN: blood urea nitrogen; Hb: haemoglobin; ILMA: intralesional meglumine antimoniate; SGOT: serum glutamic‐oxaloacetic transaminase; WBC: white blood cells. | ||||
| Study | Method of assessment | Timing | Interventions | Adverse effects |
| Not described | Quote: "Participants were seen at 10‐15 day intervals after injection, and at 6 weeks post treatment" | I1: IL 2% zinc sulphate I2: IL 7% sodium chloride I3: ILSSG 2‐5 mL per lesion | 19 participants evaluated for AEs. Quote: "Apart from pain at the time of injection, no appreciable side‐effect was noted." | |
| Not described | Not described | I1: IL zinc sulphate I2: ILMA weekly | 31 participants evaluated for AEs. Severe pain caused vasovagal shock: 2 (6.4%) | |
| Not described | Not described | I1: IL zinc sulphate I2: ILMA weekly | 36 participants evaluated for AEs. Pain: 13 (36.1%); burning at site injection: 3 (8.4%); itching: 3 (8.4%); inflammation: 7 (19.4%) | |
| Not described | 14, 28, 42, and 56 days after starting the treatment | I1: IL 2% zinc sulphate I2: ILMA weekly | 24 participants evaluated for AEs. Quote: "The side effects seen in both groups were pain after injection and hyperpigmentation." Burning after injection and necrosis of the lesions: 24 (100%); inflammation and swelling: 3 (12.5%) | |
| AE: adverse effect; IL: intralesional; ILMA: intralesional meglumine antimoniate; ILSSG: intralesional sodium stibogluconate. | ||||
| Study | Method of assessment | Timing | Interventions | Adverse effects |
| Not described | Quote: "Participants were seen at 10‐15 day intervals after injection, and at 6 week post treatment" | I1: IL 2% zinc sulphate I2: IL 7% HSCS I3: ILSSG 2‐5 mL per lesion | 17 participants evaluated for AEs. Quote: "No side‐effect other than pain at the time of injection was noted." | |
| Not described | Not described | I1: IL 5% HSCS I2: ILMA 0.5‐1 mL/week | 36 participants evaluated for AEs. Allergic reaction (erythema, oedema, and pruritus): 0 (0%); sporotrichoid dissemination: 3 (8.3%) | |
| Not described | Quote: "Participants were seen weekly for the first three injections; fortnightly for the fourth and fifth injections; then monthly until cure. Participants were followed‐up every 3 months after cure for 18 months to assess recurrences and evidence of visceralization." | I1: ILSSG I2: IL 7% HSCS | 67 participants evaluated for AEs. Leishmaniasis recidivans: 0 (0%) Quote: "There were no systemic side effects with SSG or HS. Pain during injection was the only local side effect noted with both therapies. After healing, scarring was minimal, but postinflammatory hyperpigmentation was observed in all participants for both treatments, which faded out over 6–8 months." | |
| AE: adverse effect; IL: intralesional; ILSSG: intralesional sodium stibogluconate; HSCS: hypertonic sodium chloride solution. | ||||
| Study | Method of assessment | Timing | Interventions | Adverse effects |
| Not described | 1, 3, 4, 8, 12 and 24 weeks after treatment | I1: CO₂ I2: IMMA 50 mg/kg/d | 123 participants evaluated for AEs. Quote: "Complications were seen in (4) 4.5% of participants and included hyperpigmentation, persistent redness." Hypertonic scars: 5 (4%) | |
| Quote: "Follow‐up was performed and any side‐effects were recorded." | Quote: "Follow‐up evaluation was performed by clinical assessment of treated lesions at weeks 2, 6, 12 and 16." | I1: CO₂ I2: cryotherapy + MA | 80 participants (95 lesions) evaluated for AEs. Hyperpigmentation + trivial scar: 20 (25%); atrophic scar: 7 (8.75%); hypertrophic scar: 1 (1.25%); sporotrichoid: 1 (1.25%); raised papular lesions: 1 (1.25%); persistent erythema: 3 (3.75%); hypopigmentation + trivial scar: 4 (5%) | |
| Not described | Quote: "Participants were followed in the first, third, and sixth months after treatment with the final evaluation in the sixth month." | I1: ablative CO₂ laser I2: fractional CO₂ laser | Intervention 1: 30 participants evaluated for AEs. Erythema: 2 (6.7%) Intervention 2: 30 participants evaluated for AEs. Erythema: 4 (13.3%) | |
| AE: adverse effect; IMMA: intramuscular meglumine antimoniate; MA: meglumine antimoniate. | ||||
| Study | Method of assessment | Timing | Interventions | Adverse effects |
| Not described | Fortnightly until 6 months post‐treatment and 2 weeks and 4 weeks post‐treatment | I1: cryotherapy + ILMA I2: cryotherapy alone I3: ILMA alone | Intervention 1: 100 participants evaluated for AEs. Postinflammatory hypopigmentation: 5 (5%) Intervention 2: 200 participants evaluated for AEs. Postinflammatory hypopigmentation: 10 (5%) | |
| Not described | Not described | I1: ILMA alone I2: cryotherapy alone I3: cryotherapy + ILMA | Intervention 2: 20 participants evaluated for AEs. Erythema and oedema of the lesions and perilesional area: (28%) Intervention 3: 20 participants evaluated for AEs. Erythema and oedema of the lesions and perilesional area: (33%) Quote: "There were no serious side‐effects in any of the treatment groups" | |
| Not described | Quote: "Weekly for up to six weeks of treatment and six months after." | I1: cryotherapy I2: ILMA | 36 participants evaluated for AEs. Hypopigmentation: 2 (5.5%); hyperpigmentation: 7 (19.4%). Quote: "the most common adverse reactions were erythema and oedema of the treated site, which appeared during the initial hours of treatment, and blistering of the treatment site, which became evident 1–2 days after treatment and responded well to local treatment." | |
| Quote: "Follow‐up was performed and any side‐effects were recorded." | Quote: "Follow‐up evaluation was performed by clinical assessment of treated lesions at weeks 2, 6, 12 and 16." | I1: CO₂ I2: cryotherapy + MA | 80 participants (95 lesions) evaluated for AEs. Hyperpigmentation + trivial scar: 15 (18.7%); atrophic scar: 6 (7.5%); hypertrophic scar: 0 (0%); sporotrichoid: 0 (0%); raised papular lesions: 0 (0%); persistent erythema: 0 (0%); hypopigmentation + trivial scar: 15 (18.8%) | |
| Quote: "During these visits the healing process of the ulcer, change of diameter and induration of lesions and complications were assessed." | Quote: "The participants were evaluated every 2 weeks up to 12 weeks." | I1: cryotherapy + 3% salicylic + 3% sodium nitrite I2: cryotherapy + 3% salicylic + placebo | Intervention 1: 36 participants evaluated for AEs. Erythema, a burning sensation and skin irritation: 7 (19.4%) Intervention 2: 27 participants evaluated for AEs. Erythema, a burning sensation and skin irritation: 1 (3.7%) | |
| AE: adverse effect; ILMA: intralesional meglumine antimoniate; MA: meglumine antimoniate. | ||||
| Study | Method of assessment | Timing | Interventions | Adverse effects |
| Quote: "The occurrence of adverse effects was evaluated blindly by means of participant interviews and physical examinations." | Quote: "The occurrence of adverse effects was evaluated … during follow‐up visits." | I1: ILSSG 2‐5 mL per lesion I2: IMSSG 20 mg/kg I3: thermotherapy | 138‐108 participants evaluated for AEs. Secondary infections: 8 (5.7%). Quote: "The original CL ulcer often increased in size immediately after and up to 2 weeks after treatment." | |
| Quote: "Appearance of lesions at subsequent follow‐up visits and occurrence of unwanted side‐effects were also recorded on the form." | Weekly 4 weeks and monthly up to 6 months | I1: thermotherapy I2: ILMA weekly | 57 participants (83 lesions) evaluated for AEs. Satellite lesions: 1 (1.7%) | |
| Quote: "Interview, physical examination, laboratory testing (complete blood count, creatine phosphokinase, amylase, lipase, complete metabolic profile), and electrocardiograms." | Quote: "Daily for the first 10 days and follow‐up at 2, 6, and 12–24 months post treatment" | I1: thermotherapy I2: ILSSG | 27 participants evaluated for AEs. Serious AE: 4 (15%); ECG changes: 10 (37%); abdominal discomfort: 1 (4%); wound infection: 5 (19%); musculoskeletal: 5 (19%); headache: 3 (11%); fatigue: 5 (19%); rash: 1 (4%); blister reaction: 25 (93%); erythema: 7 (26%); oozing: 21 (78%) | |
| Quote: "The occurrences of adverse effects were evaluated by means of participant interviews and physical examinations during follow‐up visits." | Quote: "During treatment, all participants were then followed for four visits at weekly intervals … After initial treatment, all participants were scheduled for four subsequent follow‐up visits: 10 days after baseline and 1‐month, 2 months and 6 months after treatment." | I1: thermotherapy I2: ILMA weekly | 189 participants evaluated for AEs Not reported | |
| Not described | Not described | I1: radiofrequency heat treatment I2: ILSSG | Quote: "RFHT was cosmetically acceptable because it was associated with less scarring and hyperpigmentation compared with intralesional SSG injections." | |
| Quote: "In case of clinical signs for a superinfection, a smear was taken, Gram stained and microscopically evaluated for the presence of bacteria and/or fungi." | Quote: "Adverse events such as bacterial or fungal superinfections of the wounds, the formation or scars and the rate of re‐ulcerations were monitored during the treatment and follow‐up period." | I1: electrocauterisation + DAC N‐055. I2: electrocauterisation + placebo. | Intervention 1: 38 participants evaluated for AEs. Bacterial and fungal superinfections: 3 (8.0%); Keloïd formation: 2 (5%) Intervention 2: 32 participants evaluated for AEs. Bacterial and fungal superinfections: 3 (9.0%); Keloïd formation: 2 (6%) | |
| AE: adverse effect; CL: cutaneous leishmaniasis; ILMA: intralesional meglumine antimoniate; ILSSG: intralesional sodium stibogluconate; IMSSG: intramuscular sodium stibogluconate. | ||||
| Outcome or subgroup title | No. of studies | No. of participants | Statistical method | Effect size |
| 1 Lesions cured Show forest plot | 1 | Risk Ratio (M‐H, Random, 95% CI) | Totals not selected | |
| Outcome or subgroup title | No. of studies | No. of participants | Statistical method | Effect size |
| 1 Lesions cured Show forest plot | 1 | Risk Ratio (M‐H, Random, 95% CI) | Totals not selected | |
| Outcome or subgroup title | No. of studies | No. of participants | Statistical method | Effect size |
| 1 Lesions cured Show forest plot | 1 | Risk Ratio (M‐H, Random, 95% CI) | Totals not selected | |
| Outcome or subgroup title | No. of studies | No. of participants | Statistical method | Effect size |
| 1 Lesions cured Show forest plot | 1 | Risk Ratio (M‐H, Random, 95% CI) | Totals not selected | |
| Outcome or subgroup title | No. of studies | No. of participants | Statistical method | Effect size |
| 1 Lesions cured Show forest plot | 1 | Risk Ratio (M‐H, Random, 95% CI) | Totals not selected | |
| Outcome or subgroup title | No. of studies | No. of participants | Statistical method | Effect size |
| 1 Participants complete cure Show forest plot | 2 | 148 | Risk Ratio (M‐H, Random, 95% CI) | 0.83 [0.71, 0.96] |
| 2 Adverse effects Show forest plot | 1 | Risk Ratio (M‐H, Random, 95% CI) | Totals not selected | |
| 2.1 Serious adverse effects | 1 | Risk Ratio (M‐H, Random, 95% CI) | 0.0 [0.0, 0.0] | |
| 2.2 Skin reaction | 1 | Risk Ratio (M‐H, Random, 95% CI) | 0.0 [0.0, 0.0] | |
| 2.3 Cardiac toxicity 'QT prolongation' | 1 | Risk Ratio (M‐H, Random, 95% CI) | 0.0 [0.0, 0.0] | |
| Outcome or subgroup title | No. of studies | No. of participants | Statistical method | Effect size |
| 1 Participants complete cure Show forest plot | 1 | Risk Ratio (M‐H, Random, 95% CI) | Totals not selected | |
| Outcome or subgroup title | No. of studies | No. of participants | Statistical method | Effect size |
| 1 Participants complete cure Show forest plot | 1 | Risk Ratio (M‐H, Random, 95% CI) | Totals not selected | |
| Outcome or subgroup title | No. of studies | No. of participants | Statistical method | Effect size |
| 1 Participants complete cure Show forest plot | 1 | Risk Ratio (M‐H, Random, 95% CI) | Totals not selected | |
| Outcome or subgroup title | No. of studies | No. of participants | Statistical method | Effect size |
| 1 Lesions cured Show forest plot | 1 | Risk Ratio (M‐H, Random, 95% CI) | Totals not selected | |
| 2 Adverse effects (itching and burning) Show forest plot | 1 | Risk Ratio (M‐H, Random, 95% CI) | Totals not selected | |
| 3 Adverse effects (oedema) Show forest plot | 1 | Risk Ratio (M‐H, Random, 95% CI) | Totals not selected | |
| Outcome or subgroup title | No. of studies | No. of participants | Statistical method | Effect size |
| 1 Participants complete cure Show forest plot | 1 | Risk Ratio (M‐H, Random, 95% CI) | Totals not selected | |
| Outcome or subgroup title | No. of studies | No. of participants | Statistical method | Effect size |
| 1 Lesions cured Show forest plot | 1 | Risk Ratio (M‐H, Random, 95% CI) | Totals not selected | |
| Outcome or subgroup title | No. of studies | No. of participants | Statistical method | Effect size |
| 1 Participants complete cure Show forest plot | 1 | Risk Ratio (M‐H, Random, 95% CI) | Totals not selected | |
| 2 Adverse effects (mild heart symptoms) Show forest plot | 1 | Risk Ratio (M‐H, Random, 95% CI) | Totals not selected | |
| Outcome or subgroup title | No. of studies | No. of participants | Statistical method | Effect size |
| 1 Participants complete cure Show forest plot | 1 | Risk Ratio (M‐H, Random, 95% CI) | Totals not selected | |
| 2 Adverse effects (nausea and vomiting) Show forest plot | 1 | Risk Ratio (M‐H, Random, 95% CI) | Totals not selected | |
| Outcome or subgroup title | No. of studies | No. of participants | Statistical method | Effect size |
| 1 Participants cured Show forest plot | 1 | Risk Ratio (M‐H, Random, 95% CI) | Totals not selected | |
| 2 Adverse effect (liver enzymes increase) Show forest plot | 1 | Risk Ratio (M‐H, Random, 95% CI) | Totals not selected | |
| Outcome or subgroup title | No. of studies | No. of participants | Statistical method | Effect size |
| 1 Lesions cured Show forest plot | 1 | Risk Ratio (M‐H, Random, 95% CI) | Totals not selected | |
| Outcome or subgroup title | No. of studies | No. of participants | Statistical method | Effect size |
| 1 Lesions cured Show forest plot | 1 | Risk Ratio (M‐H, Random, 95% CI) | Totals not selected | |
| Outcome or subgroup title | No. of studies | No. of participants | Statistical method | Effect size |
| 1 Participants complete cure Show forest plot | 1 | Risk Ratio (M‐H, Random, 99% CI) | Totals not selected | |
| Outcome or subgroup title | No. of studies | No. of participants | Statistical method | Effect size |
| 1 Participants complete cure Show forest plot | 1 | Risk Ratio (M‐H, Random, 99% CI) | Totals not selected | |
| Outcome or subgroup title | No. of studies | No. of participants | Statistical method | Effect size |
| 1 Participants complete cure Show forest plot | 3 | 244 | Risk Ratio (M‐H, Random, 99% CI) | 3.70 [0.35, 38.99] |
| 2 Adverse effects Show forest plot | 5 | Risk Ratio (M‐H, Random, 95% CI) | Subtotals only | |
| 2.1 Mild abdominal pain and nausea | 3 | 204 | Risk Ratio (M‐H, Random, 95% CI) | 2.36 [0.74, 7.47] |
| 2.2 Mild abnormal liver function | 3 | 84 | Risk Ratio (M‐H, Random, 95% CI) | 3.08 [0.53, 17.98] |
| 2.3 Headache and dizziness | 1 | 20 | Risk Ratio (M‐H, Random, 95% CI) | 2.63 [0.16, 43.63] |
| 3 Microbiological cure of skin lesions Show forest plot | 1 | Risk Ratio (M‐H, Random, 99% CI) | Totals not selected | |
| Outcome or subgroup title | No. of studies | No. of participants | Statistical method | Effect size |
| 1 Participants complete cure Show forest plot | 1 | Risk Ratio (M‐H, Random, 99% CI) | Totals not selected | |
| 2 Adverse effects (headache and dizziness) Show forest plot | 1 | Risk Ratio (M‐H, Random, 95% CI) | Totals not selected | |
| 3 Microbiological cure of skin lesions Show forest plot | 1 | Risk Ratio (M‐H, Random, 95% CI) | Totals not selected | |
| Outcome or subgroup title | No. of studies | No. of participants | Statistical method | Effect size |
| 1 Lesions cured Show forest plot | 1 | Risk Ratio (M‐H, Random, 95% CI) | Totals not selected | |
| 2 Participants complete cure Show forest plot | 1 | Risk Ratio (M‐H, Random, 95% CI) | Totals not selected | |
| Outcome or subgroup title | No. of studies | No. of participants | Statistical method | Effect size |
| 1 Participants complete cure Show forest plot | 1 | Risk Ratio (M‐H, Random, 95% CI) | Totals not selected | |
| 2 Adverse effects Show forest plot | 1 | Risk Ratio (M‐H, Random, 95% CI) | Totals not selected | |
| 2.1 Rise creatinine and liver enzymes | 1 | Risk Ratio (M‐H, Random, 95% CI) | 0.0 [0.0, 0.0] | |
| 2.2 Cheilitis | 1 | Risk Ratio (M‐H, Random, 95% CI) | 0.0 [0.0, 0.0] | |
| 2.3 Nausea | 1 | Risk Ratio (M‐H, Random, 95% CI) | 0.0 [0.0, 0.0] | |
| Outcome or subgroup title | No. of studies | No. of participants | Statistical method | Effect size |
| 1 Participants complete Cure Show forest plot | 2 | 160 | Risk Ratio (M‐H, Random, 95% CI) | 24.08 [1.44, 403.43] |
| 2 Adverse effects Show forest plot | 2 | Risk Ratio (M‐H, Random, 95% CI) | Subtotals only | |
| 2.1 Nausea | 2 | 160 | Risk Ratio (M‐H, Random, 95% CI) | 21.86 [3.04, 157.29] |
| Outcome or subgroup title | No. of studies | No. of participants | Statistical method | Effect size |
| 1 Lesions cured Show forest plot | 1 | 100 | Risk Ratio (M‐H, Random, 95% CI) | 3.83 [1.71, 8.60] |
| Outcome or subgroup title | No. of studies | No. of participants | Statistical method | Effect size |
| 1 Lesions cured Show forest plot | 1 | 100 | Risk Ratio (M‐H, Random, 95% CI) | 1.92 [1.08, 3.41] |
| Outcome or subgroup title | No. of studies | No. of participants | Statistical method | Effect size |
| 1 Lesions Cured Show forest plot | 1 | 100 | Risk Ratio (M‐H, Random, 95% CI) | 0.75 [0.35, 1.62] |
| Outcome or subgroup title | No. of studies | No. of participants | Statistical method | Effect size |
| 1 Lesions cured Show forest plot | 1 | Risk Ratio (M‐H, Random, 95% CI) | Totals not selected | |
| 2 Adverse effects Show forest plot | 1 | Risk Ratio (M‐H, Random, 95% CI) | Totals not selected | |
| 2.1 Mild abdominal pain | 1 | Risk Ratio (M‐H, Random, 95% CI) | 0.0 [0.0, 0.0] | |
| 2.2 Skin eruption | 1 | Risk Ratio (M‐H, Random, 95% CI) | 0.0 [0.0, 0.0] | |
| 2.3 Muscle pain and weakness | 1 | Risk Ratio (M‐H, Random, 95% CI) | 0.0 [0.0, 0.0] | |
| 3 Microbiological cure of skin lesions Show forest plot | 1 | 72 | Risk Ratio (M‐H, Random, 95% CI) | 1.11 [0.88, 1.41] |
| Outcome or subgroup title | No. of studies | No. of participants | Statistical method | Effect size |
| 1 Adverse effects Show forest plot | 1 | Risk Ratio (M‐H, Random, 95% CI) | Totals not selected | |
| 1.1 Secondary infection | 1 | Risk Ratio (M‐H, Random, 95% CI) | 0.0 [0.0, 0.0] | |
| 1.2 Myalgia | 1 | Risk Ratio (M‐H, Random, 95% CI) | 0.0 [0.0, 0.0] | |
| 1.3 ECG changes | 1 | Risk Ratio (M‐H, Random, 95% CI) | 0.0 [0.0, 0.0] | |
| 1.4 Chest pain | 1 | Risk Ratio (M‐H, Random, 95% CI) | 0.0 [0.0, 0.0] | |
| 1.5 Pain injection site | 1 | Risk Ratio (M‐H, Random, 95% CI) | 0.0 [0.0, 0.0] | |
| 1.6 Abscess | 1 | Risk Ratio (M‐H, Random, 95% CI) | 0.0 [0.0, 0.0] | |
| Outcome or subgroup title | No. of studies | No. of participants | Statistical method | Effect size |
| 1 Participants complete cured Show forest plot | 1 | Risk Ratio (M‐H, Random, 95% CI) | Totals not selected | |
| 2 Adverse effects Show forest plot | 1 | Risk Ratio (M‐H, Random, 95% CI) | Totals not selected | |
| 2.1 Abdominal symptoms | 1 | Risk Ratio (M‐H, Random, 95% CI) | 0.0 [0.0, 0.0] | |
| 2.2 Liver abnormalities | 1 | Risk Ratio (M‐H, Random, 95% CI) | 0.0 [0.0, 0.0] | |
| 2.3 Myalgia | 1 | Risk Ratio (M‐H, Random, 95% CI) | 0.0 [0.0, 0.0] | |
| 2.4 Rash | 1 | Risk Ratio (M‐H, Random, 95% CI) | 0.0 [0.0, 0.0] | |
| Outcome or subgroup title | No. of studies | No. of participants | Statistical method | Effect size |
| 1 Participants complete cure Show forest plot | 2 | Risk Ratio (M‐H, Random, 95% CI) | Totals not selected | |
| 1.1 Evaluated 3 months after treatment | 1 | Risk Ratio (M‐H, Random, 95% CI) | 0.0 [0.0, 0.0] | |
| 1.2 Evaluated after treatment | 1 | Risk Ratio (M‐H, Random, 95% CI) | 0.0 [0.0, 0.0] | |
| 2 Microbiological cure of skin lesions Show forest plot | 1 | Risk Ratio (M‐H, Random, 95% CI) | Totals not selected | |
| Outcome or subgroup title | No. of studies | No. of participants | Statistical method | Effect size |
| 1 Participants complete cure Show forest plot | 1 | Risk Ratio (M‐H, Random, 95% CI) | Totals not selected | |
| Outcome or subgroup title | No. of studies | No. of participants | Statistical method | Effect size |
| 1 Lesions cured Show forest plot | 1 | Risk Ratio (M‐H, Random, 95% CI) | Totals not selected | |
| 2 Adverse effects Show forest plot | 1 | Risk Ratio (M‐H, Random, 95% CI) | Totals not selected | |
| 2.1 Nausea and vomiting | 1 | Risk Ratio (M‐H, Random, 95% CI) | 0.0 [0.0, 0.0] | |
| Outcome or subgroup title | No. of studies | No. of participants | Statistical method | Effect size |
| 1 Participants complete cure Show forest plot | 1 | Risk Ratio (M‐H, Random, 95% CI) | Totals not selected | |
| 2 Adverse effects Show forest plot | 1 | Risk Ratio (M‐H, Random, 95% CI) | Totals not selected | |
| 2.1 Gastrointestinal complaints and headache | 1 | Risk Ratio (M‐H, Random, 95% CI) | 0.0 [0.0, 0.0] | |
| 2.2 Gastrointestinal complications | 1 | Risk Ratio (M‐H, Random, 95% CI) | 0.0 [0.0, 0.0] | |
| 2.3 Myalgia | 1 | Risk Ratio (M‐H, Random, 95% CI) | 0.0 [0.0, 0.0] | |
| Outcome or subgroup title | No. of studies | No. of participants | Statistical method | Effect size |
| 1 Participants complete cure Show forest plot | 1 | Risk Ratio (M‐H, Random, 95% CI) | Totals not selected | |
| 2 Adverse effects Show forest plot | 1 | Risk Ratio (M‐H, Random, 95% CI) | Totals not selected | |
| 2.1 Allergic macule‐papular | 1 | Risk Ratio (M‐H, Random, 95% CI) | 0.0 [0.0, 0.0] | |
| Outcome or subgroup title | No. of studies | No. of participants | Statistical method | Effect size |
| 1 Participants complete cure Show forest plot | 1 | Risk Ratio (M‐H, Random, 95% CI) | Totals not selected | |
| Outcome or subgroup title | No. of studies | No. of participants | Statistical method | Effect size |
| 1 Participants complete cure Show forest plot | 1 | Risk Ratio (M‐H, Random, 95% CI) | Totals not selected | |
| Outcome or subgroup title | No. of studies | No. of participants | Statistical method | Effect size |
| 1 Participants complete cure Show forest plot | 1 | Risk Ratio (M‐H, Random, 95% CI) | Totals not selected | |
| 2 Adverse effects Show forest plot | 1 | Risk Ratio (M‐H, Random, 95% CI) | Totals not selected | |
| 2.1 Nausea and vomiting | 1 | Risk Ratio (M‐H, Random, 95% CI) | 0.0 [0.0, 0.0] | |
| 2.2 Oedema | 1 | Risk Ratio (M‐H, Random, 95% CI) | 0.0 [0.0, 0.0] | |
| Outcome or subgroup title | No. of studies | No. of participants | Statistical method | Effect size |
| 1 Participants complete cure Show forest plot | 1 | Risk Ratio (M‐H, Random, 95% CI) | Totals not selected | |
| Outcome or subgroup title | No. of studies | No. of participants | Statistical method | Effect size |
| 1 Participants complete cure Show forest plot | 1 | Risk Ratio (M‐H, Random, 95% CI) | Totals not selected | |
| Outcome or subgroup title | No. of studies | No. of participants | Statistical method | Effect size |
| 1 Lesions cured Show forest plot | 1 | Risk Ratio (M‐H, Random, 95% CI) | Totals not selected | |
| Outcome or subgroup title | No. of studies | No. of participants | Statistical method | Effect size |
| 1 Participants complete cure Show forest plot | 1 | Risk Ratio (M‐H, Random, 95% CI) | Totals not selected | |
| Outcome or subgroup title | No. of studies | No. of participants | Statistical method | Effect size |
| 1 Participants complete cure (ITT) Show forest plot | 1 | Risk Ratio (M‐H, Random, 95% CI) | Totals not selected | |
| 2 Adverse effects Show forest plot | 1 | Risk Ratio (M‐H, Random, 95% CI) | Totals not selected | |
| 2.1 Hypersensitivity | 1 | Risk Ratio (M‐H, Random, 95% CI) | 0.0 [0.0, 0.0] | |
| 2.2 Mild pruritus | 1 | Risk Ratio (M‐H, Random, 95% CI) | 0.0 [0.0, 0.0] | |
| 2.3 Erithema and oedema | 1 | Risk Ratio (M‐H, Random, 95% CI) | 0.0 [0.0, 0.0] | |
| Outcome or subgroup title | No. of studies | No. of participants | Statistical method | Effect size |
| 1 Lesions cured Show forest plot | 1 | Risk Ratio (M‐H, Random, 95% CI) | Totals not selected | |
| 2 Scarring Show forest plot | 1 | Risk Ratio (M‐H, Random, 95% CI) | Totals not selected | |
| 3 Microbiological cure of skin lesions Show forest plot | 1 | Risk Ratio (M‐H, Random, 95% CI) | Totals not selected | |
| Outcome or subgroup title | No. of studies | No. of participants | Statistical method | Effect size |
| 1 Lesions cured Show forest plot | 1 | 80 | Risk Ratio (M‐H, Random, 95% CI) | 0.71 [0.25, 2.06] |
| Outcome or subgroup title | No. of studies | No. of participants | Statistical method | Effect size |
| 1 Participants complete cure Show forest plot | 2 | 383 | Risk Ratio (M‐H, Random, 95% CI) | 1.00 [0.86, 1.17] |
| 2 Adverse effects Show forest plot | 3 | Risk Ratio (M‐H, Random, 95% CI) | Subtotals only | |
| 2.1 Skin/local reaction | 3 | 463 | Risk Ratio (M‐H, Random, 95% CI) | 0.94 [0.45, 1.93] |
| 3 Microbiological cure of skin lesions Show forest plot | 2 | 383 | Risk Ratio (M‐H, Random, 95% CI) | 1.03 [0.88, 1.20] |
| Outcome or subgroup title | No. of studies | No. of participants | Statistical method | Effect size |
| 1 Participants complete cure Show forest plot | 1 | Risk Ratio (M‐H, Random, 95% CI) | Totals not selected | |
| Outcome or subgroup title | No. of studies | No. of participants | Statistical method | Effect size |
| 1 Participants complete cure Show forest plot | 1 | Risk Ratio (M‐H, Random, 95% CI) | Totals not selected | |
| Outcome or subgroup title | No. of studies | No. of participants | Statistical method | Effect size |
| 1 Participants complete cure Show forest plot | 1 | Risk Ratio (M‐H, Random, 95% CI) | Totals not selected | |
| Outcome or subgroup title | No. of studies | No. of participants | Statistical method | Effect size |
| 1 Participants complete cure Show forest plot | 1 | Risk Ratio (M‐H, Random, 95% CI) | Totals not selected | |
| 2 Recurrence Show forest plot | 1 | Risk Ratio (M‐H, Random, 95% CI) | Totals not selected | |
| 3 Scarring Show forest plot | 1 | Risk Ratio (M‐H, Random, 95% CI) | Totals not selected | |
| Outcome or subgroup title | No. of studies | No. of participants | Statistical method | Effect size |
| 1 Participants complete cure Show forest plot | 1 | Risk Ratio (M‐H, Random, 95% CI) | Totals not selected | |
| 2 Adverse effects Show forest plot | 1 | Risk Ratio (M‐H, Random, 95% CI) | Totals not selected | |
| 2.1 Cutaneous reaction | 1 | Risk Ratio (M‐H, Random, 95% CI) | 0.0 [0.0, 0.0] | |
| Outcome or subgroup title | No. of studies | No. of participants | Statistical method | Effect size |
| 1 Participants complete cure Show forest plot | 1 | Risk Ratio (M‐H, Random, 95% CI) | Totals not selected | |
| 2 Microbiological cure of skin lesions Show forest plot | 1 | Risk Ratio (M‐H, Random, 95% CI) | Totals not selected | |
| Outcome or subgroup title | No. of studies | No. of participants | Statistical method | Effect size |
| 1 Lesions cured Show forest plot | 1 | Risk Ratio (M‐H, Random, 95% CI) | Totals not selected | |
| 2 Scarring Show forest plot | 1 | Risk Ratio (M‐H, Random, 99% CI) | Totals not selected | |
| 3 Microbiological cure of skin lesions Show forest plot | 1 | Risk Ratio (M‐H, Random, 95% CI) | Totals not selected | |
| Outcome or subgroup title | No. of studies | No. of participants | Statistical method | Effect size |
| 1 Participants complete cure Show forest plot | 1 | Risk Ratio (M‐H, Random, 95% CI) | Totals not selected | |
| 2 Microbiological cure of skin lesions Show forest plot | 1 | Risk Ratio (M‐H, Random, 95% CI) | Totals not selected | |
| Outcome or subgroup title | No. of studies | No. of participants | Statistical method | Effect size |
| 1 Lesions cured Show forest plot | 1 | Risk Ratio (M‐H, Random, 95% CI) | Totals not selected | |
| Outcome or subgroup title | No. of studies | No. of participants | Statistical method | Effect size |
| 1 Lesions cured Show forest plot | 1 | Risk Ratio (M‐H, Random, 95% CI) | Totals not selected | |
| Outcome or subgroup title | No. of studies | No. of participants | Statistical method | Effect size |
| 1 Lesions cured Show forest plot | 1 | Risk Ratio (M‐H, Random, 95% CI) | Totals not selected | |
| Outcome or subgroup title | No. of studies | No. of participants | Statistical method | Effect size |
| 1 Lesions cured Show forest plot | 1 | Risk Ratio (M‐H, Random, 95% CI) | Totals not selected | |
| 2 Participants complete cured Show forest plot | 1 | Risk Ratio (M‐H, Random, 95% CI) | Totals not selected | |
| 3 Adverse effects Show forest plot | 2 | Risk Ratio (M‐H, Random, 95% CI) | Totals not selected | |
| 3.1 Pain | 1 | Risk Ratio (M‐H, Random, 95% CI) | 0.0 [0.0, 0.0] | |
| 3.2 Burning | 1 | Risk Ratio (M‐H, Random, 95% CI) | 0.0 [0.0, 0.0] | |
| 3.3 Itching | 1 | Risk Ratio (M‐H, Random, 95% CI) | 0.0 [0.0, 0.0] | |
| 3.4 Inflammation | 1 | Risk Ratio (M‐H, Random, 95% CI) | 0.0 [0.0, 0.0] | |
| 3.5 Pruritus and erythema | 1 | Risk Ratio (M‐H, Random, 95% CI) | 0.0 [0.0, 0.0] | |
| 3.6 Severe pain | 1 | Risk Ratio (M‐H, Random, 95% CI) | 0.0 [0.0, 0.0] | |
| Outcome or subgroup title | No. of studies | No. of participants | Statistical method | Effect size |
| 1 Lesions cured Show forest plot | 1 | Risk Ratio (M‐H, Random, 95% CI) | Totals not selected | |
| 2 Adverse effects Show forest plot | 1 | Risk Ratio (M‐H, Random, 95% CI) | Totals not selected | |
| 2.1 Inflammation | 1 | Risk Ratio (M‐H, Random, 95% CI) | 0.0 [0.0, 0.0] | |
| Outcome or subgroup title | No. of studies | No. of participants | Statistical method | Effect size |
| 1 Participants complete cure Show forest plot | 1 | Risk Ratio (M‐H, Random, 95% CI) | Totals not selected | |
| 2 Participants with treated lesions that recur Show forest plot | 1 | Risk Ratio (M‐H, Random, 95% CI) | Totals not selected | |
| 3 Adverse effects Show forest plot | 1 | Risk Ratio (M‐H, Random, 95% CI) | Totals not selected | |
| 3.1 Itch and burning | 1 | Risk Ratio (M‐H, Random, 95% CI) | 0.0 [0.0, 0.0] | |
| Outcome or subgroup title | No. of studies | No. of participants | Statistical method | Effect size |
| 1 Lesions cured Show forest plot | 1 | Risk Ratio (M‐H, Random, 95% CI) | Totals not selected | |
| Outcome or subgroup title | No. of studies | No. of participants | Statistical method | Effect size |
| 1 Lesions cured Show forest plot | 1 | Risk Ratio (M‐H, Random, 95% CI) | Totals not selected | |
| 2 Adverse effects Show forest plot | 1 | Risk Ratio (M‐H, Random, 95% CI) | Totals not selected | |
| 2.1 Sporotrichotic dissemination | 1 | Risk Ratio (M‐H, Random, 95% CI) | 0.0 [0.0, 0.0] | |
| 2.2 Allergic reaction | 1 | Risk Ratio (M‐H, Random, 95% CI) | 0.0 [0.0, 0.0] | |
| Outcome or subgroup title | No. of studies | No. of participants | Statistical method | Effect size |
| 1 Lesions cured Show forest plot | 1 | Risk Ratio (M‐H, Random, 95% CI) | Totals not selected | |
| Outcome or subgroup title | No. of studies | No. of participants | Statistical method | Effect size |
| 1 Lesions cured Show forest plot | 1 | Risk Ratio (M‐H, Random, 95% CI) | Totals not selected | |
| 2 Recurrence Show forest plot | 1 | Risk Ratio (M‐H, Random, 95% CI) | Totals not selected | |
| 3 Speed of healing (weeks) Show forest plot | 1 | Mean Difference (IV, Random, 95% CI) | Totals not selected | |
| 4 Adverse effects Show forest plot | 1 | Risk Ratio (M‐H, Random, 95% CI) | Totals not selected | |
| 4.1 Ulceration and necrosis | 1 | Risk Ratio (M‐H, Random, 95% CI) | 0.0 [0.0, 0.0] | |
| Outcome or subgroup title | No. of studies | No. of participants | Statistical method | Effect size |
| 1 Lesions cured Show forest plot | 1 | Risk Ratio (M‐H, Random, 95% CI) | Totals not selected | |
| 2 Recurrence Show forest plot | 1 | Risk Ratio (M‐H, Random, 99% CI) | Totals not selected | |
| 3 Speed of healing (weeks) Show forest plot | 1 | Mean Difference (IV, Random, 95% CI) | Totals not selected | |
| 4 Adverse effects Show forest plot | 1 | Risk Ratio (M‐H, Random, 95% CI) | Totals not selected | |
| 4.1 Ulceration and necrosis | 1 | Risk Ratio (M‐H, Random, 95% CI) | 0.0 [0.0, 0.0] | |
| Outcome or subgroup title | No. of studies | No. of participants | Statistical method | Effect size |
| 1 Lesions cured Show forest plot | 1 | Risk Ratio (M‐H, Random, 95% CI) | Totals not selected | |
| 2 Microbiological cure of skin lesions Show forest plot | 1 | Risk Ratio (M‐H, Random, 95% CI) | Totals not selected | |
| Outcome or subgroup title | No. of studies | No. of participants | Statistical method | Effect size |
| 1 Participants complete cure Show forest plot | 1 | Risk Ratio (M‐H, Random, 95% CI) | Totals not selected | |
| 2 Adverse effects Show forest plot | 1 | Risk Ratio (M‐H, Random, 95% CI) | Totals not selected | |
| 2.1 Erythema | 1 | Risk Ratio (M‐H, Random, 95% CI) | 0.0 [0.0, 0.0] | |
| 2.2 Mild pain | 1 | Risk Ratio (M‐H, Random, 95% CI) | 0.0 [0.0, 0.0] | |
| 2.3 Hearing acuity problems | 1 | Risk Ratio (M‐H, Random, 95% CI) | 0.0 [0.0, 0.0] | |
| Outcome or subgroup title | No. of studies | No. of participants | Statistical method | Effect size |
| 1 Participants complete cure Show forest plot | 1 | Risk Ratio (M‐H, Random, 95% CI) | Totals not selected | |
| 2 Adverse effects Show forest plot | 1 | Risk Ratio (M‐H, Random, 95% CI) | Totals not selected | |
| 2.1 Local inflammatory reactions | 1 | Risk Ratio (M‐H, Random, 95% CI) | 0.0 [0.0, 0.0] | |
| Outcome or subgroup title | No. of studies | No. of participants | Statistical method | Effect size |
| 1 Participants complete cure Show forest plot | 1 | Risk Ratio (M‐H, Random, 95% CI) | Totals not selected | |
| Outcome or subgroup title | No. of studies | No. of participants | Statistical method | Effect size |
| 1 Lesions cured Show forest plot | 1 | Risk Ratio (M‐H, Random, 95% CI) | Totals not selected | |
| Outcome or subgroup title | No. of studies | No. of participants | Statistical method | Effect size |
| 1 Participants complete cure Show forest plot | 1 | Risk Ratio (M‐H, Random, 95% CI) | Totals not selected | |
| 2 Adverse effects Show forest plot | 1 | Risk Ratio (M‐H, Random, 95% CI) | Totals not selected | |
| 2.1 Reulceration | 1 | Risk Ratio (M‐H, Random, 95% CI) | 0.0 [0.0, 0.0] | |
| 2.2 Keloïd scars | 1 | Risk Ratio (M‐H, Random, 95% CI) | 0.0 [0.0, 0.0] | |
| Outcome or subgroup title | No. of studies | No. of participants | Statistical method | Effect size |
| 1 Lesions cured Show forest plot | 1 | Risk Ratio (M‐H, Random, 95% CI) | Totals not selected | |
| 2 Recurrence Show forest plot | 1 | Risk Ratio (M‐H, Random, 95% CI) | Totals not selected | |
| 3 Adverse effects Show forest plot | 1 | Risk Ratio (M‐H, Random, 95% CI) | Totals not selected | |
| 3.1 Dizziness and nausea | 1 | Risk Ratio (M‐H, Random, 95% CI) | 0.0 [0.0, 0.0] | |
| 3.2 Hypersensitive reaction | 1 | Risk Ratio (M‐H, Random, 95% CI) | 0.0 [0.0, 0.0] | |
| Outcome or subgroup title | No. of studies | No. of participants | Statistical method | Effect size |
| 1 Lesions cured Show forest plot | 1 | 433 | Risk Ratio (M‐H, Random, 95% CI) | 0.91 [0.53, 1.55] |
| 2 Adverse effects Show forest plot | 1 | Risk Ratio (M‐H, Random, 95% CI) | Totals not selected | |
| 2.1 Hyperpigmentation and redness | 1 | Risk Ratio (M‐H, Random, 95% CI) | 0.0 [0.0, 0.0] | |
| 2.2 Hypertrophic scarring | 1 | Risk Ratio (M‐H, Random, 95% CI) | 0.0 [0.0, 0.0] | |
| 2.3 Systemic symptoms | 1 | Risk Ratio (M‐H, Random, 95% CI) | 0.0 [0.0, 0.0] | |
| Outcome or subgroup title | No. of studies | No. of participants | Statistical method | Effect size |
| 1 Lesions cured Show forest plot | 1 | Risk Ratio (M‐H, Random, 95% CI) | Totals not selected | |
| 2 Adverse effects Show forest plot | 1 | Risk Ratio (M‐H, Random, 95% CI) | Totals not selected | |
| 2.1 Hyperpigmentation | 1 | Risk Ratio (M‐H, Random, 95% CI) | 0.0 [0.0, 0.0] | |
| 2.2 Atrophic scar | 1 | Risk Ratio (M‐H, Random, 95% CI) | 0.0 [0.0, 0.0] | |
| 2.3 Hypopigmentation | 1 | Risk Ratio (M‐H, Random, 95% CI) | 0.0 [0.0, 0.0] | |
| Outcome or subgroup title | No. of studies | No. of participants | Statistical method | Effect size |
| 1 Partcipants complete cure Show forest plot | 1 | Risk Ratio (M‐H, Random, 95% CI) | Totals not selected | |
| 2 Adverse effects Show forest plot | 1 | Risk Ratio (M‐H, Random, 95% CI) | Totals not selected | |
| 2.1 Erythema | 1 | Risk Ratio (M‐H, Random, 95% CI) | 0.0 [0.0, 0.0] | |
| Outcome or subgroup title | No. of studies | No. of participants | Statistical method | Effect size |
| 1 Participants complete cure Show forest plot | 1 | Risk Ratio (M‐H, Random, 95% CI) | Totals not selected | |
| 2 Recurrence Show forest plot | 1 | Risk Ratio (M‐H, Random, 95% CI) | Totals not selected | |
| 3 Adverse effects Show forest plot | 1 | Risk Ratio (M‐H, Random, 95% CI) | Totals not selected | |
| 3.1 Mild erythema and itch | 1 | Risk Ratio (M‐H, Random, 95% CI) | 0.0 [0.0, 0.0] | |
| 4 Microbiological cure of skin lesions Show forest plot | 1 | 80 | Risk Ratio (M‐H, Random, 95% CI) | 0.97 [0.74, 1.26] |
| Outcome or subgroup title | No. of studies | No. of participants | Statistical method | Effect size |
| 1 Participants complete cure Show forest plot | 1 | Risk Ratio (M‐H, Random, 95% CI) | Totals not selected | |
| 2 Lesions cured Show forest plot | 1 | Risk Ratio (M‐H, Random, 99% CI) | Totals not selected | |
| 2.1 Males | 1 | Risk Ratio (M‐H, Random, 99% CI) | 0.0 [0.0, 0.0] | |
| 2.2 Females | 1 | Risk Ratio (M‐H, Random, 99% CI) | 0.0 [0.0, 0.0] | |
| Outcome or subgroup title | No. of studies | No. of participants | Statistical method | Effect size |
| 1 Participants complete cure Show forest plot | 1 | Risk Ratio (M‐H, Random, 95% CI) | Totals not selected | |
| 2 Speed of healing (weeks) Show forest plot | 1 | Mean Difference (IV, Random, 95% CI) | Totals not selected | |
| Outcome or subgroup title | No. of studies | No. of participants | Statistical method | Effect size |
| 1 Participants complete cure Show forest plot | 1 | Risk Ratio (M‐H, Random, 95% CI) | Totals not selected | |
| Outcome or subgroup title | No. of studies | No. of participants | Statistical method | Effect size |
| 1 Participants complete cure Show forest plot | 1 | Risk Ratio (M‐H, Random, 95% CI) | Totals not selected | |
| 2 Adverse effects Show forest plot | 1 | Risk Ratio (M‐H, Random, 95% CI) | Totals not selected | |
| 2.1 Erythema and oedema | 1 | Risk Ratio (M‐H, Random, 95% CI) | 0.0 [0.0, 0.0] | |
| Outcome or subgroup title | No. of studies | No. of participants | Statistical method | Effect size |
| 1 Participants complete cure Show forest plot | 1 | Risk Ratio (M‐H, Random, 95% CI) | Totals not selected | |
| Outcome or subgroup title | No. of studies | No. of participants | Statistical method | Effect size |
| 1 Lesions cured Show forest plot | 1 | Risk Ratio (M‐H, Random, 95% CI) | Totals not selected | |
| 2 Adverse effects Show forest plot | 1 | Risk Ratio (M‐H, Random, 95% CI) | Totals not selected | |
| 2.1 Hypopigmentation | 1 | Risk Ratio (M‐H, Random, 95% CI) | 0.0 [0.0, 0.0] | |
| Outcome or subgroup title | No. of studies | No. of participants | Statistical method | Effect size |
| 1 Lesions cured Show forest plot | 1 | Risk Ratio (M‐H, Random, 95% CI) | Totals not selected | |
| 2 Adverse effects Show forest plot | 1 | 390 | Risk Ratio (M‐H, Random, 95% CI) | 14.64 [0.86, 247.99] |
| 2.1 Hypopigmentation | 1 | 390 | Risk Ratio (M‐H, Random, 95% CI) | 14.64 [0.86, 247.99] |
| Outcome or subgroup title | No. of studies | No. of participants | Statistical method | Effect size |
| 1 Participants complete cure Show forest plot | 1 | Risk Ratio (M‐H, Random, 95% CI) | Totals not selected | |
| Outcome or subgroup title | No. of studies | No. of participants | Statistical method | Effect size |
| 1 Lesions cured Show forest plot | 1 | Risk Ratio (M‐H, Random, 95% CI) | Totals not selected | |
| 2 Adverse effects Show forest plot | 1 | Risk Ratio (M‐H, Random, 95% CI) | Totals not selected | |
| 2.1 Mild skin symptoms | 1 | Risk Ratio (M‐H, Random, 95% CI) | 0.0 [0.0, 0.0] | |
| Outcome or subgroup title | No. of studies | No. of participants | Statistical method | Effect size |
| 1 Lesions cured Show forest plot | 1 | Risk Ratio (M‐H, Random, 95% CI) | Totals not selected | |
| 2 Participants complete cure Show forest plot | 2 | 499 | Risk Ratio (M‐H, Random, 95% CI) | 1.23 [0.97, 1.55] |
| 3 Adverse effects Show forest plot | 1 | Risk Ratio (M‐H, Random, 95% CI) | Totals not selected | |
| 3.1 Allergic reaction | 1 | Risk Ratio (M‐H, Random, 95% CI) | 0.0 [0.0, 0.0] | |
| Outcome or subgroup title | No. of studies | No. of participants | Statistical method | Effect size |
| 1 Lesions cured Show forest plot | 1 | Risk Ratio (M‐H, Random, 95% CI) | Totals not selected | |
| 2 Adverse effects (serious) Show forest plot | 1 | Risk Ratio (M‐H, Random, 95% CI) | Totals not selected | |
| Outcome or subgroup title | No. of studies | No. of participants | Statistical method | Effect size |
| 1 Participants complete cure Show forest plot | 1 | Risk Ratio (M‐H, Random, 95% CI) | Totals not selected | |
| 2 Adverse event (secondary infection) Show forest plot | 1 | Risk Ratio (M‐H, Random, 99% CI) | Totals not selected | |
| Outcome or subgroup title | No. of studies | No. of participants | Statistical method | Effect size |
| 1 Participants complete cure Show forest plot | 1 | Risk Ratio (M‐H, Random, 95% CI) | Totals not selected | |
| Outcome or subgroup title | No. of studies | No. of participants | Statistical method | Effect size |
| 1 Adverse effects Show forest plot | 1 | Risk Ratio (M‐H, Random, 95% CI) | Totals not selected | |
| 1.1 Superinfection | 1 | Risk Ratio (M‐H, Random, 95% CI) | 0.0 [0.0, 0.0] | |
| 1.2 Keloid formation | 1 | Risk Ratio (M‐H, Random, 95% CI) | 0.0 [0.0, 0.0] | |
| Outcome or subgroup title | No. of studies | No. of participants | Statistical method | Effect size |
| 1 Lesions cured Show forest plot | 1 | Risk Ratio (M‐H, Random, 95% CI) | Totals not selected | |
| 2 Scarring Show forest plot | 1 | Risk Ratio (M‐H, Random, 95% CI) | Totals not selected | |
| 3 Microbiological cure of skin lesions Show forest plot | 1 | Risk Ratio (M‐H, Random, 95% CI) | Totals not selected | |
| Outcome or subgroup title | No. of studies | No. of participants | Statistical method | Effect size |
| 1 Participants complete cure Show forest plot | 1 | Risk Ratio (M‐H, Random, 95% CI) | Totals not selected | |
| 2 Adverse effects Show forest plot | 1 | Risk Ratio (M‐H, Random, 95% CI) | Totals not selected | |
| 2.1 Allergic reaction | 1 | Risk Ratio (M‐H, Random, 95% CI) | 0.0 [0.0, 0.0] | |
| 3 Development of cell‐mediated immunity Show forest plot | 1 | Risk Ratio (M‐H, Random, 95% CI) | Totals not selected | |
| Outcome or subgroup title | No. of studies | No. of participants | Statistical method | Effect size |
| 1 Participants complete cure Show forest plot | 1 | Risk Ratio (M‐H, Random, 95% CI) | Totals not selected | |
| Outcome or subgroup title | No. of studies | No. of participants | Statistical method | Effect size |
| 1 Participants complete cure Show forest plot | 1 | Risk Ratio (M‐H, Random, 95% CI) | Totals not selected | |
| Outcome or subgroup title | No. of studies | No. of participants | Statistical method | Effect size |
| 1 Participants complete cure Show forest plot | 1 | Risk Ratio (M‐H, Random, 95% CI) | Totals not selected | |
| Outcome or subgroup title | No. of studies | No. of participants | Statistical method | Effect size |
| 1 Participants complete cure Show forest plot | 1 | Risk Ratio (M‐H, Random, 95% CI) | Totals not selected | |
| Outcome or subgroup title | No. of studies | No. of participants | Statistical method | Effect size |
| 1 Participants complete cure Show forest plot | 1 | Risk Ratio (M‐H, Random, 95% CI) | Totals not selected | |
| 2 Adverse effects Show forest plot | 1 | Risk Ratio (M‐H, Random, 95% CI) | Totals not selected | |
| 2.1 Itching | 1 | Risk Ratio (M‐H, Random, 95% CI) | 0.0 [0.0, 0.0] | |
| Outcome or subgroup title | No. of studies | No. of participants | Statistical method | Effect size |
| 1 Participants complete cure Show forest plot | 1 | Risk Ratio (M‐H, Random, 95% CI) | Totals not selected | |
| 2 Speed of healing (weeks) Show forest plot | 1 | Mean Difference (IV, Random, 95% CI) | Totals not selected | |
| 3 Adverse effects Show forest plot | 1 | Risk Ratio (M‐H, Random, 95% CI) | Totals not selected | |
| 3.1 Allergic reaction | 1 | Risk Ratio (M‐H, Random, 95% CI) | 0.0 [0.0, 0.0] | |
| Outcome or subgroup title | No. of studies | No. of participants | Statistical method | Effect size |
| 1 Participants complete cure Show forest plot | 1 | Risk Ratio (M‐H, Random, 95% CI) | Totals not selected | |
| 2 Speed of healing (weeks) Show forest plot | 1 | Mean Difference (IV, Random, 95% CI) | Totals not selected | |
| 3 Adverse reaction Show forest plot | 1 | Risk Ratio (M‐H, Random, 95% CI) | Totals not selected | |
| 3.1 Allergic reaction | 1 | Risk Ratio (M‐H, Random, 95% CI) | 0.0 [0.0, 0.0] | |
| Outcome or subgroup title | No. of studies | No. of participants | Statistical method | Effect size |
| 1 Participants complete cure Show forest plot | 1 | Risk Ratio (M‐H, Random, 95% CI) | Totals not selected | |
| 2 Speed of healing (days) Show forest plot | 1 | Mean Difference (IV, Random, 95% CI) | Totals not selected | |
| 3 Adverse effects Show forest plot | 1 | Risk Ratio (M‐H, Random, 95% CI) | Totals not selected | |
| 3.1 Allergic reaction | 1 | Risk Ratio (M‐H, Random, 95% CI) | 0.0 [0.0, 0.0] | |
| Outcome or subgroup title | No. of studies | No. of participants | Statistical method | Effect size |
| 1 Participants complete cure Show forest plot | 1 | Risk Ratio (M‐H, Random, 95% CI) | Totals not selected | |
| 2 Adverse effects Show forest plot | 1 | Risk Ratio (M‐H, Random, 95% CI) | Totals not selected | |
| 2.1 Itching | 1 | Risk Ratio (M‐H, Random, 95% CI) | 0.0 [0.0, 0.0] | |
| 3 Microbiological cure of skin lesions Show forest plot | 1 | Risk Ratio (M‐H, Random, 95% CI) | Totals not selected | |