| Term | Definition |
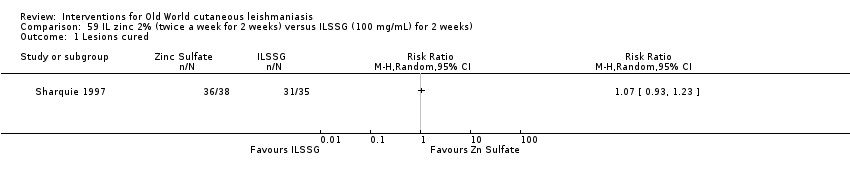
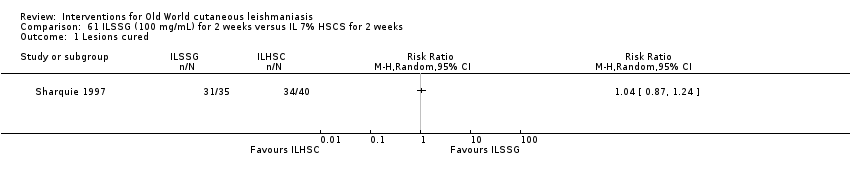
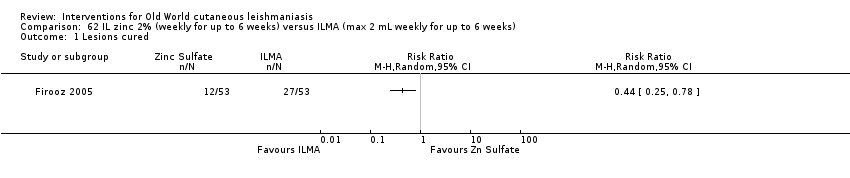
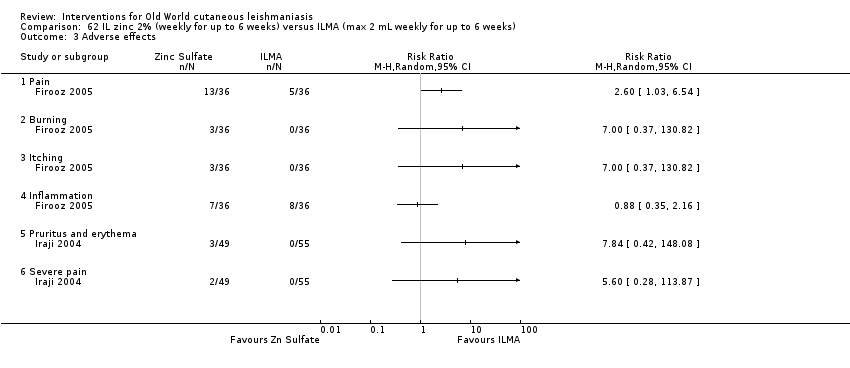
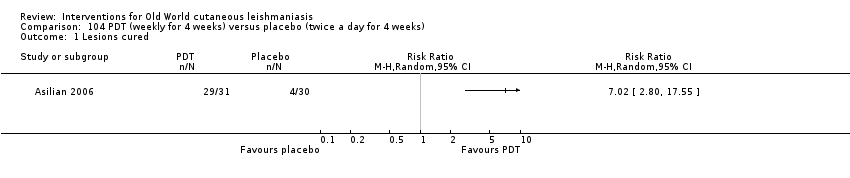
| Antimonials | Pharmaceutical agents containing antimony. Antimony‐containing compounds (meglumine antimoniate and sodium stibogluconate) are the principal medications used to treat leishmaniases, an infection caused by a protozoan parasite. |
| Arthralgia | Pain in the joints. The causes of arthralgia are varied and range, from a joints perspective, from degenerative and destructive processes such as osteoarthritis and sports injuries to inflammation of tissues surrounding the joints, such as bursitis. |
| Cardiac arrhythmia | An arrhythmia is an abnormal heart rhythm. Many types of arrhythmia have no symptoms. When symptoms are present these may include palpitations or feeling a pause between heartbeats. More seriously there may be lightheadedness, passing out, shortness of breath, or chest pain. |
| Cutaneous necrosis | The death of living tissues in response to disease or injury. |
| Cytolysis | The degeneration or dissolution of cell caused by the disruption of cell membrane. |
| Exudate | A fluid with a high content of protein and cellular debris that has escaped from blood vessels and has been deposited in tissues or on tissue surfaces, usually as a result of inflammation. |
| Human monocytes | Monocytes are the biggest type of white blood cell in the immune system. Originally formed in the bone marrow, they are released into our blood and migrate into the connective tissue where they differentiate into macrophages. When certain germs enter the body, they quickly rush to the site of attack. |
| Hypotension | A systolic blood pressure reading (the top number) of 90 millimetres of mercury (mmHg) or less a diastolic blood pressure reading (the bottom number) of 60 mmHg or less is generally considered low blood pressure. The causes of low blood pressure can range from dehydration to serious medical or surgical disorders. |
| Immune response modifier | Any of a broad family of biomolecules that up‐ or down‐regulate, or restore immune responsiveness, which are generated after T cells recognise an antigen present on the surface of a self‐antigen‐presenting cell, which, once activated, produce multiple cytokines. |
| Immunolabeling | A biochemical process that enables the detection and localisation of an antigen to a particular site within a cell, tissue, or organ. Antigens are organic molecules, usually proteins, capable of binding to an antibody. These antigens can be visualised using a combination of antigen‐specific antibodies as well as a means of detection, called a tag, that is covalently linked to the antibody. If the immunolabeling process is meant to reveal information about a cell or its substructures, the process is called immunocytochemistry. Immunolabeling of larger structures is called immunohistochemistry. |
| In vitro | Biological processes or reactions made to occur outside the living organism in an artificial environment, such as a culture medium. |
| Intralesional meglumine antimoniate | Meglumine antimoniate (or Glucantime) is a medicine used for treating leishmaniasis. It belongs to a group of compounds known as the pentavalent antimonials. |
| Lymphadenopathies | Lymph nodes that have an abnormal in size, number or consistency; often used as a synonym for swollen or enlarged lymph nodes. Common causes of lymphadenopathy are infection, autoimmune disease, or malignancy. |
| Lymphatic channels | The vessels that transport lymph throughout the body. Lymph is a clear fluid that contains cells important for forming antibodies that fight infection. |
| Lymphokine | Any of various soluble protein mediators released by sensitised lymphocytes on contact with antigen, and believed to play a role in macrophage activation, lymphocyte transformation, and cell‐mediated immunity. They regulate immune responses through differentiation, amplification, and inhibition of cell functions. Lymphokines may also have a cytotoxic effector function. Used as biologic response modifiers in the treatment of cancer. |
| Macrophages | White blood cells (activated monocytes) that protect the body against infection and foreign substances by breaking them down into antigenic peptides recognised by circulating T cells. |
| Miltefosine | An oral alkyl phosphocholine analogue used to treat cutaneous and visceral leishmaniasis. Interacts with lipids and sterols in the Leishmania membrane resulting in inhibition of mitochondria and apoptotic cell death. |
| Mucous membranes | The mucous membranes (or mucosae or mucosas; singular mucosa) are linings of mostly endodermal origin, covered in epithelium, which are involved in absorption and secretion. They line cavities that are exposed to the external environment and internal organs. |
| Myalgia | Myalgia, or muscle pain, is a symptom of many diseases and disorders. The most common causes are the overuse or over‐stretching of a muscle or group of muscles. Myalgia without a traumatic history is often due to viral infections. Long‐term myalgias may be indicative of a metabolic myopathy, some nutritional deficiencies or chronic fatigue syndrome. |
| Nodular lymphangitis | Nodular lymphangitis is a distinct clinical entity, separate from lymphangitis. This disorder is characterised by inflammatory nodules along the lymphatics draining a primary skin infection |
| Papule | A solid, rounded growth that is elevated from the skin, usually inflammatory but nonsuppurative. A papule is usually less than 1 cm across. |
| Parenteral | Administration of a medicinal or therapeutic substance, other than through the gastrointestinal or respiratory tracts, e.g. by intravenous, intramuscular or subcuticular injection. |
| Pentamidine | Pentamidine (e.g. isethionate) is an antiprotozoal and antifungal agent of the class of aromatic diamidines, administered intravenously or intramuscularly in treatment of early African trypanosomiasis and leishmaniasis, and intravenously, intramuscularly, or by oral inhalation in treatment and prophylaxis of Pneumocystis carinii pneumonia. |
| Pentavalent antimony | Pentavalent antimonials are a group of compounds used for the treatment of leishmaniasis. The first pentavalent antimonial used was urea stibamine: first introduced in the 1930s, it fell out of favour in the 1950s due to higher toxicity compared to sodium stibogluconate. The compounds currently available for clinical use are: sodium stibogluconate (Pentostam; manufactured by GlaxoSmithKline; available in the USA and UK), which is administered by slow intravenous injection, intralesional or intramuscular injection, and meglumine antimoniate (Glucantime; manufactured by Aventis; available in Brazil, France and Italy), which is administered by intramuscular, intralesional, or intravenous injection. |
| Promastigotes | Term now generally used instead of 'leptomonad' or 'leptomonad stage' to avoid confusion with the flagellate genus Leptomonas. It denotes the flagellate stage of a trypanosomatid protozoan in which the flagellum arises from a kinetoplast in front of the nucleus and emerges from the anterior end of the organism; usually an extracellular phase, as in the insect intermediate host (or in culture) of Leishmania parasites. |
| Protozoan | Any of a group of single‐celled, usually microscopic, eukaryotic organisms, such as amoebas, ciliates, flagellates, and sporozoans. |
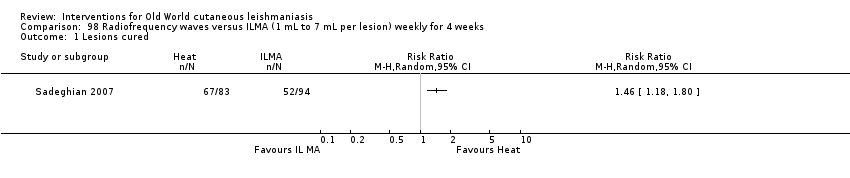
| ThermoMed device | The ThermoMed is a battery‐operated device that delivers precisely controlled localised current field radiofrequency heat to selectively destroy certain diseased tissue and is recommended by the World Health Organization as an alternative therapy for cutaneus leishmaniasis. |
| Thermotherapy | The treatment of disease by the application of heat. Thermotherapy may be administered as dry heat with heat lamps, diathermy machines, electric pads, or hot water bottles or as moist heat with warm compresses or immersion in warm water. Warm soaks or compresses may be used to treat local infections, relax muscles and relieve pain in patients with motor problems, and promote circulation in peripheral vascular disorders such as thrombophlebitis. |