Intervenciones para la leishmaniasis cutánea del viejo mundo
Información
- DOI:
- https://doi.org/10.1002/14651858.CD005067.pub5Copiar DOI

- Base de datos:
-
- Cochrane Database of Systematic Reviews
- Versión publicada:
-
- 01 diciembre 2017see what's new
- Tipo:
-
- Intervention
- Etapa:
-
- Review
- Grupo Editorial Cochrane:
-
Grupo Cochrane de Piel
- Copyright:
-
- Copyright © 2017 The Cochrane Collaboration. Published by John Wiley & Sons, Ltd.
Cifras del artículo
Altmetric:
Citado por:
Autores
Contributions of authors
JHM was the contact person with the editorial base; he coordinated contributions from the co‐authors and wrote the final draft of the review.
PLP, EGC, BMM, and JHM screened papers against eligibility criteria.
PLP obtained data on ongoing and unpublished studies.
MP, LR, JHM, and PLP appraised the quality of papers.
MP, LR, PLP, EGC, PC, and JHM extracted data for the review and sought additional information about papers.
JHM, PLP, EGC, BMM, MP, LR, RLV, and PC entered data into RevMan.
AR, JHM, BMM, and RLV analysed and interpreted data.
AR and JHM worked on the Methods sections.
BMM and RLV drafted the clinical sections of the Background and responded to the clinical comments of the referees.
AR and JHM responded to the methodology and statistics comments of the referees.
IMR was the consumer co‐author and checked the review for readability and clarity, as well as ensuring outcomes were relevant to consumers.
JHM Is the guarantor of the update.
Disclaimer
This project was supported by the National Institute for Health Research, via Cochrane Infrastructure funding to the Cochrane Skin Group. The views and opinions expressed therein are those of the authors and do not necessarily reflect those of the Systematic Reviews Programme, NIHR, NHS or the Department of Health.
Sources of support
Internal sources
-
Cochrane Madrid. Hospital Universitario Ramón y Cajal. Carretera de Colmenar Km 3.1 Madrid 28034, Spain.
Methodology support
External sources
-
Office of Control of Neglected Tropical Diseases (WHO/CDS/NTD/IDM), Communicable Disease Cluster, World Health Organization, Switzerland.
-
The National Institute for Health Research (NIHR), UK.
The NIHR, UK, is the largest single funder of the Cochrane Skin Group.
Declarations of interest
Julio Heras‐Mosteiro: none known.
Begoña Monge‐Maillo: none known.
Mariona Pinart: none known.
Patricia Lopez Pereira: none known.
Ludovic Reveiz: none known. Ludovic Reveiz has contributed to this review in a personal capacity and during his spare time. The views and opinions expressed herein are those of the review authors and do not necessarily reflect those of the organisation where he works.
Emely Garcia‐Carrasco: none known.
Pedro Campuzano Cuadrado: none known.
Ana Royuela: none known.
Irene Mendez Roman: none known.
Rogelio López‐Vélez: none known.
Iraj Sharifi, one of the clinical referees, was a co‐author on the included studies Khatami 2012 and Daie Parizi 2015.
Acknowledgements
The authors wish to acknowledge: Alireza Firooz for translating and extracting data from Iranian papers and Nieves Plana for her help in developing this review.
The Cochrane Skin editorial base wishes to thank Sam Gibbs, Cochrane Dermatology Editor for this review; Matthew Grainge, Statistical Editor; Ching‐Chi Chi, Methods Editor; the clinical referees, Sabha Mushtaq and Iraj Sharifi; and Meggan Harris, who copy‐edited the review.
Version history
| Published | Title | Stage | Authors | Version |
| 2017 Dec 01 | Interventions for Old World cutaneous leishmaniasis | Review | Julio Heras‐Mosteiro, Begoña Monge‐Maillo, Mariona Pinart, Patricia Lopez Pereira, Ludovic Reveiz, Emely Garcia‐Carrasco, Pedro Campuzano Cuadrado, Ana Royuela, Irene Mendez Roman, Rogelio López‐Vélez | |
| 2017 Nov 17 | Interventions for Old World cutaneous leishmaniasis | Review | Julio Heras‐Mosteiro, Begoña Monge‐Maillo, Mariona Pinart, Patricia Lopez Pereira, Emely Garcia‐Carrasco, Pedro Campuzano Cuadrado, Ana Royuela, Irene Mendez Roman, Rogelio López‐Vélez | |
| 2008 Oct 08 | Interventions for Old World cutaneous leishmaniasis | Review | Urbà González, Mariona Pinart, Ludovic Reveiz, Jorge Alvar | |
| 2005 Jan 24 | Interventions for solitary or limited cutaneous leishmaniasis | Protocol | Urbà González, Ludovic Reveiz, Monica Chan, W Faber, Neill Hepburn, Carmen Chica | |
| 2004 Jul 19 | Interventions for solitary or limited cutaneous leishmaniasis | Protocol | U González, L Reveiz, M Chan, W Faber, N Hepburn, C Chica | |
Differences between protocol and review
Differences between the protocol and the current update
For differences between other published versions, please see the 'Differences between protocol and review' section within the original publications.
The protocol of this review was first entitled 'Interventions for solitary or limited cutaneous leishmaniasis'. However, the clinical subject was split into two reviews. The title of this review was amended to 'Interventions for Old World cutaneous leishmaniasis' (Gonzalez 2008). A Cochrane Review entitled 'Interventions for American cutaneous and mucocutaneous leishmaniasis' was also published (González 2009). This decision stemmed from the fact that the Leishmania species in the geographical areas involving the Old World differ from the ones affecting the New World. Due to the title change and also in response to referee comments, we modified the Background considerably. Also, our Objectives are now focused on the localised form of cutaneous leishmaniasis (CL) in the Old World rather than the solitary or limited form of CL.
Compared with the published protocol, there were some alterations in the tasks completed by review authors: JHM, PC, PLP, BMM, or EGM checked the titles and abstracts identified from the searches rather than UG and LR; BMM and EGM obtained the full text study for independent assessment when it was unclear if a study was relevant rather than NH and WF. Any disagreements were discussed with AR rather than UG, and MP, LR, JHM, or PLP carried out data extraction rather than MC, NH, or UG. This is because they are no longer authors of the updated version of the systematic review.
Types of participants: we modified this to 'immunocompetent people who have localised OWCL' in accordance with the aforementioned changes.
Types of interventions: we added a list of interventions in response to past referees' comments and to ease readability. We also changed the scope of the interventions from 'all doses and regimens of therapeutic interventions (including topical, systemic, and non‐pharmacological treatments) for solitary or localised cutaneous leishmaniasis' to interventions for Old World cutaneous leishmaniasis, in accordance with the aforementioned changes. We also replaced placebo as a comparison with vehicle because a topical comparison in an RCT should correctly be termed a vehicle rather than a placebo, as the vehicle in a dermatologic drug product enhances delivery and efficacy of the active compound.
Types of outcome measures: also following advice from past referees, we clarified the primary outcomes, and we added a phrase to define emergence of resistance to the tertiary outcomes. We also added a second primary outcome following advice from past referees: 'Percentage of participants with a complete cure after the end of treatment'. We omitted the term "around 3 months" in our primary outcome because it was not precise. We decided not to limit both primary outcomes by length of follow‐up since the studies reporting these outcomes prior to 3 months of follow‐up may report interesting clinical information.
Electronic searches: for the update of this review, we did not search the CINAHL database. This database focuses on nursing and allied health literature, content not particularly relevant to our review topic. We did not search the Cochrane Database of Abstracts of Reviews of Effectiveness (DARE) or MedCarib. DARE contains information on systematic reviews, and the MedCarib database is focused on the Caribbean region. We did not update our search of the American College of Physicians (ACP) journal club. We considered these databases unlikely to yield further references to relevant trials, based on our search results from the previous edition of this review. For the update of this review, we searched the following databases, which we considered relevant for the identification of ongoing trials.
-
The US National Institutes of Health Ongoing Trials Register (www.clinicaltrials.gov).
-
The Australian New Zealand Clinical Trials Registry (www.anzctr.org.au).
-
The World Health Organization International Clinical Trials Registry platform (www.who.int/trialsearch).
-
The EU Clinical Trials Register (www.clinicaltrialsregister.eu/).
Searching other resources > Unpublished literature: although planned in the protocol, we did not contact Centro Dermatológico Federico Lleras Acosta, Colombia, because the Leishmania species in Colombia differ from the ones affecting the Old World. Instead we wrote to National Programme Managers, General Coordinators, Directors, Clinicians, and WHO‐EMRO Regional Officers of endemic countries in order to find relevant studies. Although planned in the protocol, we did not update our search of the conference proceedings. Conference proceedings were considered unlikely to yield further references to relevant trials, based on our search results from the previous edition of this review.
Searching other resources >Adverse effects: although planned in the protocol, we did not contact adverse reaction‐reporting bodies. The review team considered it preferable and more efficient to search MEDLINE for adverse or side effects using the search strategy in Appendix 6.
Data collection and analysis: we updated some of the methods from what we had planned in the protocol, which was published many years ago.
Measures of treatment effect: we planned in the protocol to express results as number needed to treat where appropriate, for a range of plausible control event rates. We did not do this because the great variety found among different participant populations made it impossible to obtain a range of plausible control event rates. As the Cochrane Handbook for Systematic Reviews of Interventions says, "Risk ratios and relative risk reductions remain crucial because relative effect tends to be substantially more stable across risk groups than does absolute benefit" (Higgins 2011). We decided to describe hazard ratios (HR) for time‐to‐event outcomes data when the studies did. We have followed the recommendation, "Conducting a meta‐analysis using summary information from published papers or trial reports is often problematic as the most appropriate summary statistics are typically not presented", and we have not calculated them because we did not have enough information from studies (Higgins 2011).
Assessment of heterogeneity: In the protocol, we had not planned how to assess clinical heterogeneity, but we recorded this in the update. Also, we had planned to explore reasons for heterogeneity using sensitivity and/or subgroup analyses, but we did not do this because there were too few studies to perform a sensitivity and/or subgroup analyses.
Data synthesis: Although not planned in the protocol, we decided to only undertake data synthesis if we were able to identify two or more studies investigating similar treatments and reporting data that could be pooled. We did this because the previous systematic review chose this approach, and we consider that defining a minimum number of studies is necessary to be informative in the data synthesis phase. Where it was not possible to perform a meta‐analysis, we summarised the data for each trial.
We decided not to meta‐analyse studies when I² was above 75% and effect estimates crossed the no‐effect line. However, we did meta‐analyse studies with a high I² if none of the confidence intervals crossed the line of no effect, and we discuss the reasons for such significant heterogeneity.
Although not planned in the protocol, where an ITT was not stated, we used the numbers originally randomised to the groups in order to calculate effect estimates. We did this to avoid overestimating the effect of the intervention (to reduce attrition bias). Concerning the losses to follow‐up, it was not always possible to determine within which arm the losses occurred, and therefore perform ITT analyses.
In the protocol, we had planned that for each trial, we would report other commonly reported outcomes in a table with the cure rates at follow‐up, based on the reported clinical, microbiological, histopathological, or polymerase chain reaction (PCR) results. We did not do this because there were few studies assessing all outcomes. In our manuscript we stated that: "Two RCTs reported results where Leishmania was detected by parasitological diagnostic methods (e.g. PCR or culture, positive smears) (Jaffary 2014A; Jebran 2014). No studies reported emergence of resistance.."
Unit of analysis issues: in the protocol we planned to list quasi‐randomised and non‐randomised controlled studies but not discuss them further; however, in the review, we decided to focus only on RCTs, as in our inclusion criteria.
Dealing with missing data: in the protocol, we did not specify how to deal with missing data; therefore, in this review, we specified that we would treat missing data as treatment failures.
Reporting bias: in the protocol we did not specify if we would investigate reporting bias. In the review we planned to investigate it but was unable to due to low number of studies included in the meta‐analyses.
Keywords
MeSH
Medical Subject Headings (MeSH) Keywords
- Anti‐Infective Agents [therapeutic use];
- Antiprotozoal Agents [administration & dosage, *therapeutic use];
- Asia, Eastern;
- Complementary Therapies [methods];
- Cryotherapy [methods];
- Hot Temperature [therapeutic use];
- Itraconazole [administration & dosage, *therapeutic use];
- Laser Therapy;
- Leishmania major;
- Leishmania tropica;
- Leishmaniasis, Cutaneous [*therapy];
- Middle East;
- Ointment Bases [administration & dosage];
- Paromomycin [administration & dosage, *therapeutic use];
- Photochemotherapy;
- Randomized Controlled Trials as Topic;
Medical Subject Headings Check Words
Adult; Animals; Female; Humans; Male; Middle Aged;
PICO

Study flow diagram.

Risk of bias summary: review authors' judgments about each risk of bias item for each included study.

Risk of bias graph: review authors' judgments about each risk of bias item presented as percentages across all included studies.
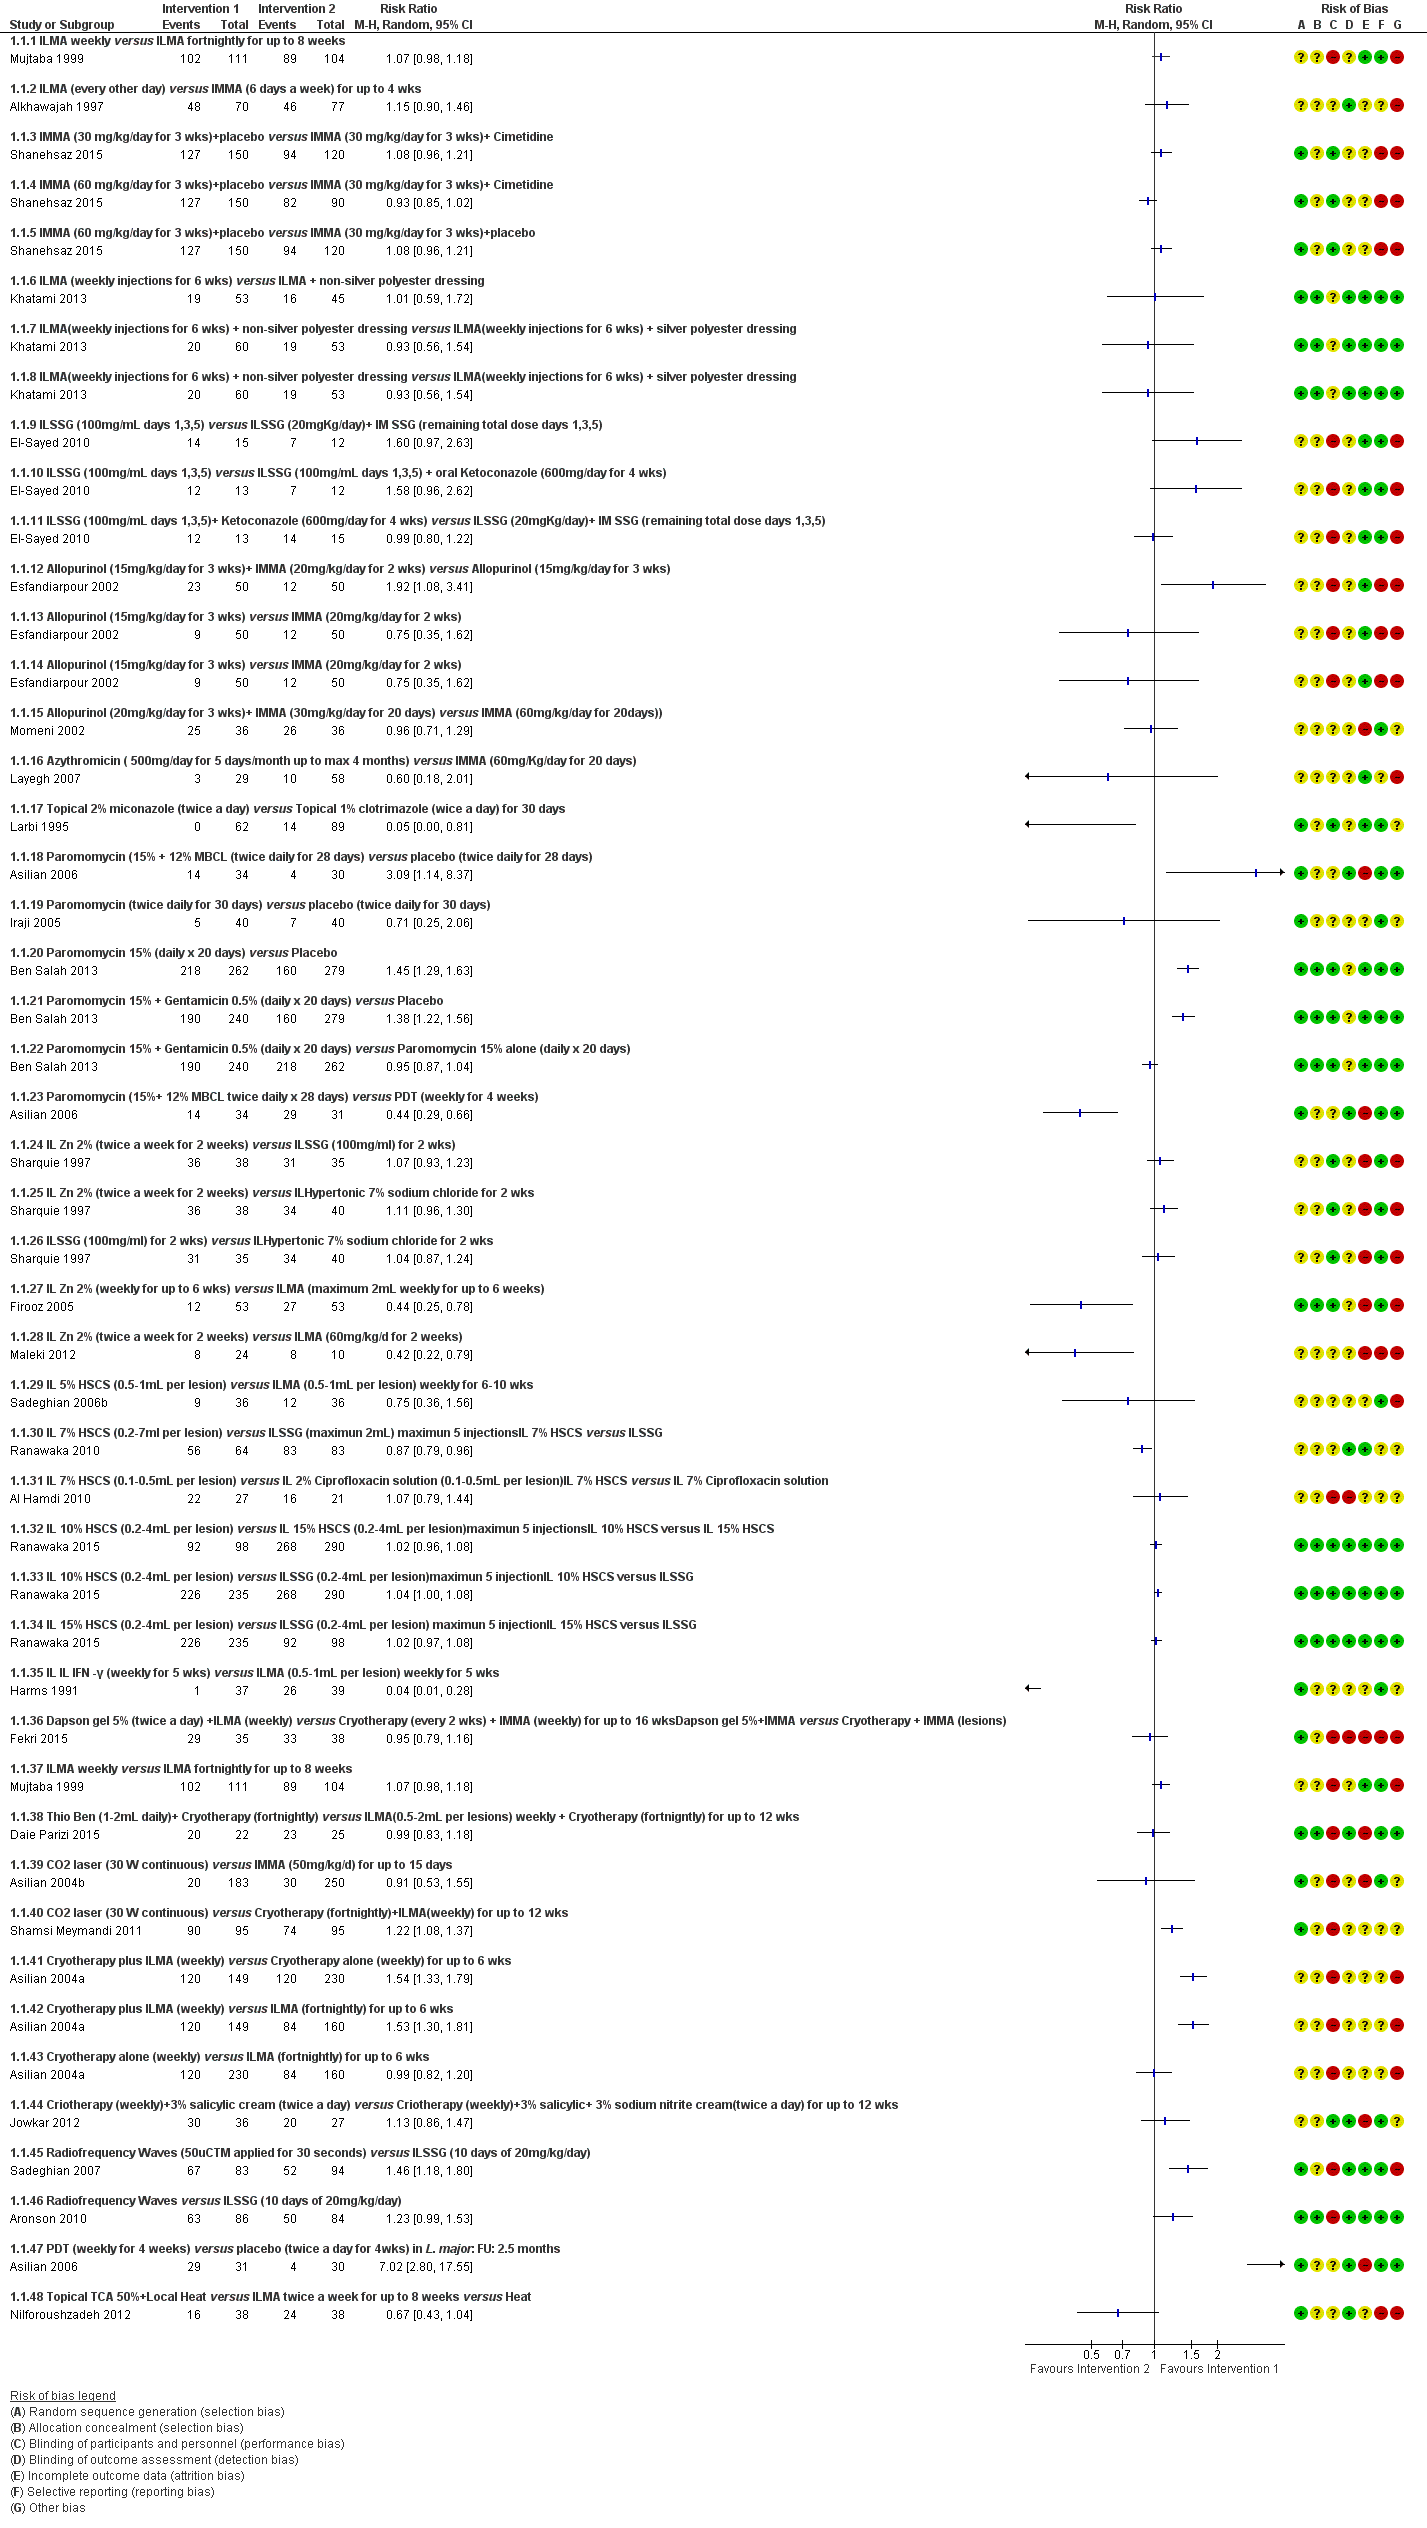
Forest Plot of Primary Outcome: Lesions Cured (Various comparisons)
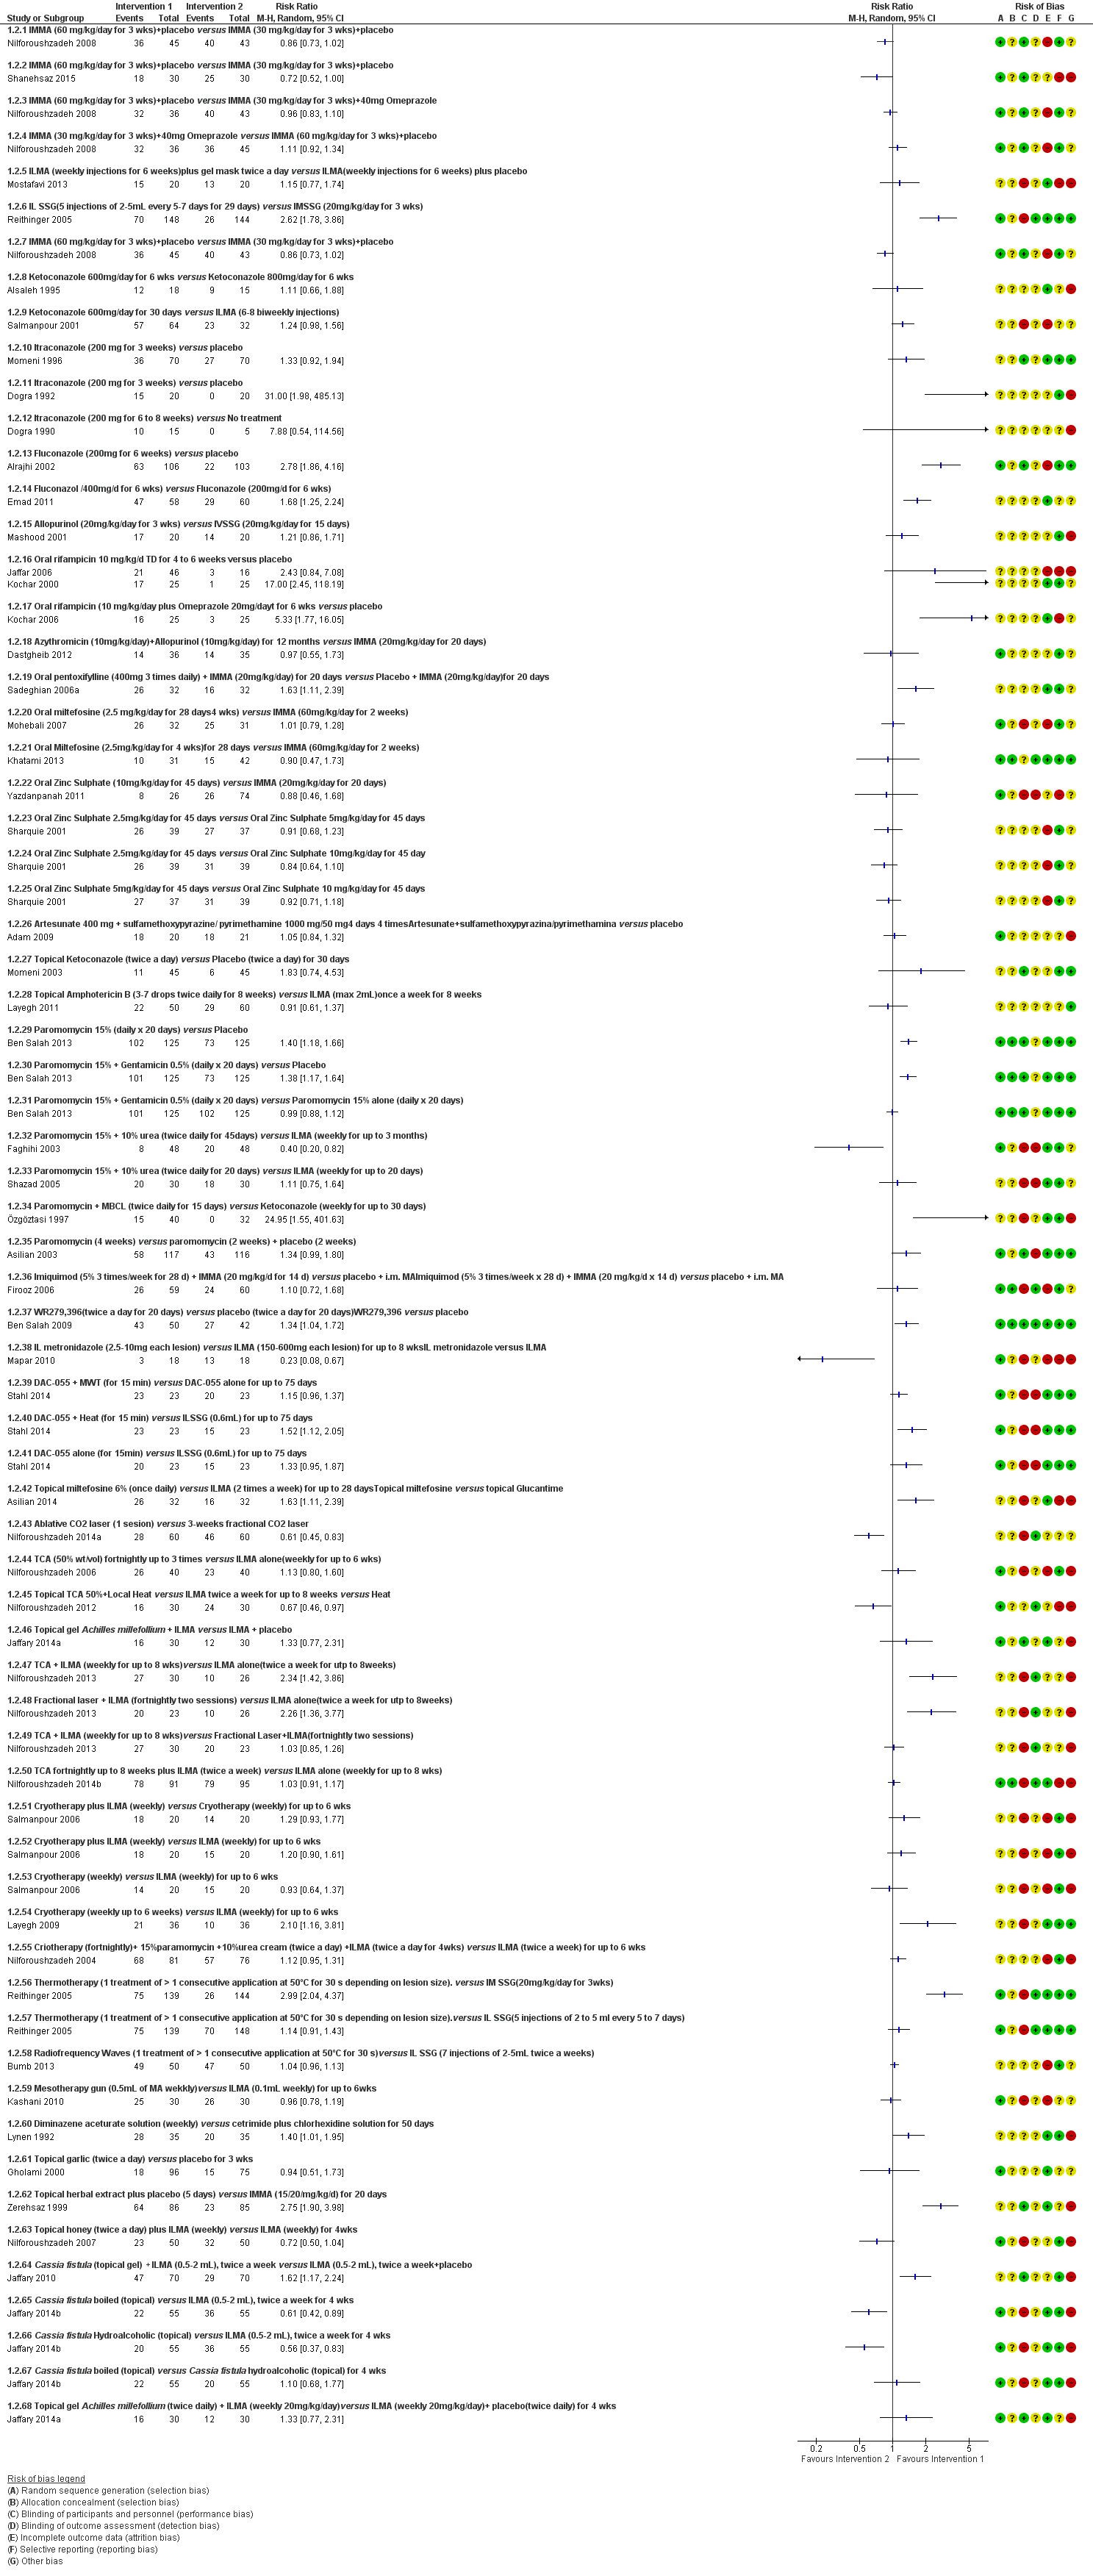
Forest plot of primary outcome: 1.2 Participants cured (Various comparisons)

Comparison 1 ILMA weekly versus ILMA fortnightly for up to 8 weeks, Outcome 1 Lesions cured.
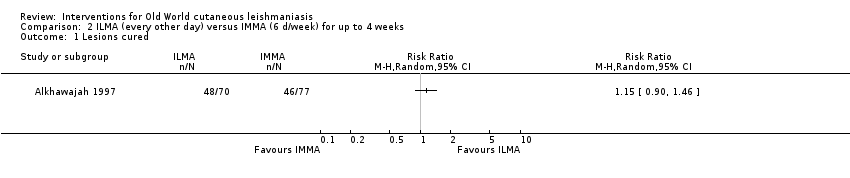
Comparison 2 ILMA (every other day) versus IMMA (6 d/week) for up to 4 weeks, Outcome 1 Lesions cured.
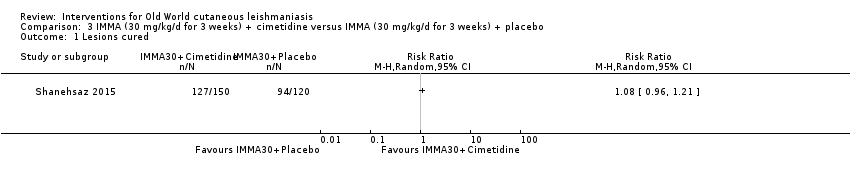
Comparison 3 IMMA (30 mg/kg/d for 3 weeks) + cimetidine versus IMMA (30 mg/kg/d for 3 weeks) + placebo, Outcome 1 Lesions cured.
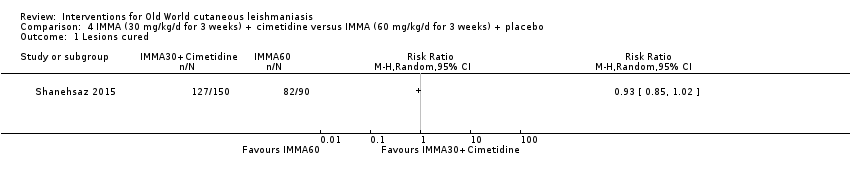
Comparison 4 IMMA (30 mg/kg/d for 3 weeks) + cimetidine versus IMMA (60 mg/kg/d for 3 weeks) + placebo, Outcome 1 Lesions cured.

Comparison 5 IMMA (60 mg/kg/d for 3 weeks) + placebo versus IMMA (30 mg/kg/d for 3 weeks) + placebo, Outcome 1 Lesions cured.
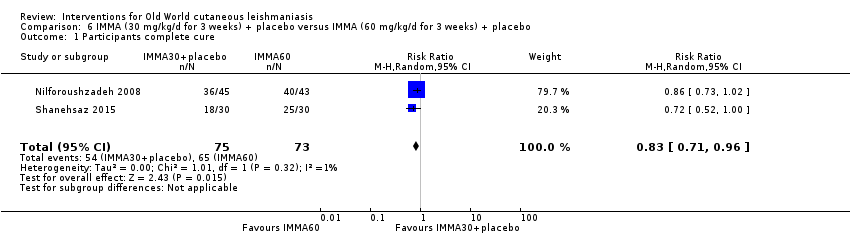
Comparison 6 IMMA (30 mg/kg/d for 3 weeks) + placebo versus IMMA (60 mg/kg/d for 3 weeks) + placebo, Outcome 1 Participants complete cure.
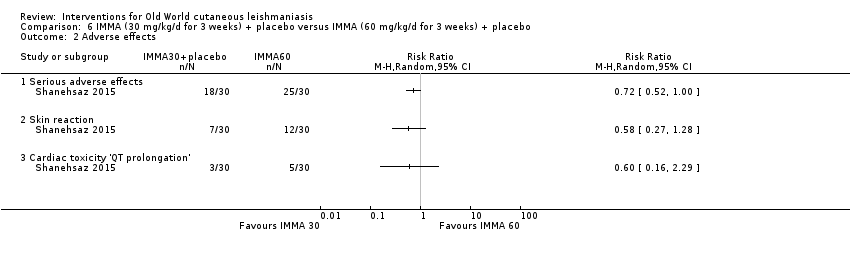
Comparison 6 IMMA (30 mg/kg/d for 3 weeks) + placebo versus IMMA (60 mg/kg/d for 3 weeks) + placebo, Outcome 2 Adverse effects.
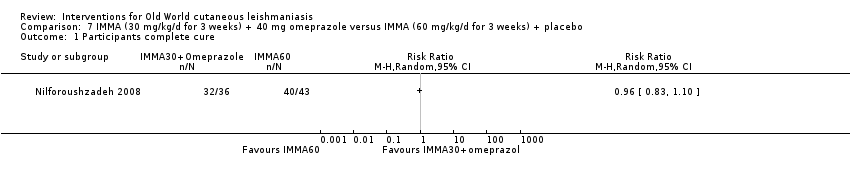
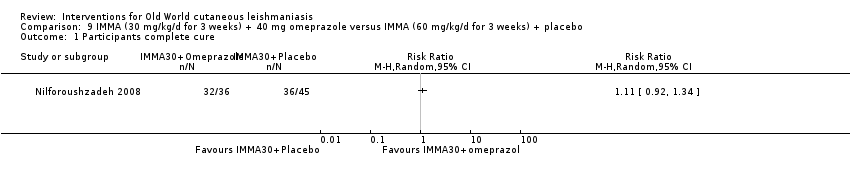
Comparison 7 IMMA (30 mg/kg/d for 3 weeks) + 40 mg omeprazole versus IMMA (60 mg/kg/d for 3 weeks) + placebo, Outcome 1 Participants complete cure.

Comparison 8 IMMA (30 mg/kg/d for 3 weeks) + placebo versus IMMA (60 mg/kg/d for 3 weeks) + placebo, Outcome 1 Participants complete cure.
Comparison 9 IMMA (30 mg/kg/d for 3 weeks) + 40 mg omeprazole versus IMMA (60 mg/kg/d for 3 weeks) + placebo, Outcome 1 Participants complete cure.

Comparison 10 ILMA + non‐silver polyester dressing versus ILMA (weekly injections for 6 weeks), Outcome 1 Lesions cured.
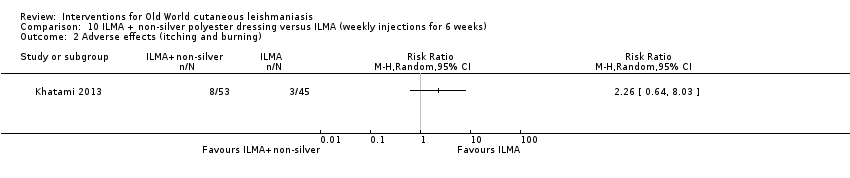
Comparison 10 ILMA + non‐silver polyester dressing versus ILMA (weekly injections for 6 weeks), Outcome 2 Adverse effects (itching and burning).

Comparison 10 ILMA + non‐silver polyester dressing versus ILMA (weekly injections for 6 weeks), Outcome 3 Adverse effects (oedema).

Comparison 11 ILMA (weekly injections for 6 weeks) + silver polyester dressing versus ILMA (weekly injections for 6 weeks), Outcome 1 Lesions cured.

Comparison 11 ILMA (weekly injections for 6 weeks) + silver polyester dressing versus ILMA (weekly injections for 6 weeks), Outcome 2 Adverse effects (itching and burning).
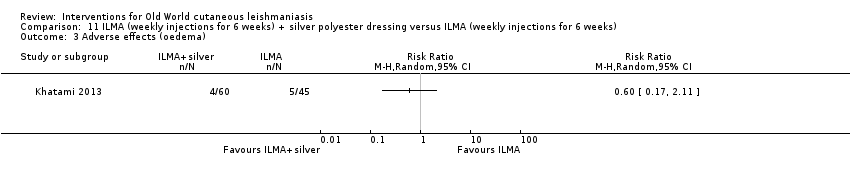
Comparison 11 ILMA (weekly injections for 6 weeks) + silver polyester dressing versus ILMA (weekly injections for 6 weeks), Outcome 3 Adverse effects (oedema).

Comparison 12 ILMA (weekly injections for 6 weeks) + silver polyester dressing versus ILMA (weekly injections for 6 weeks) + non‐silver polyester dressing, Outcome 1 Lesions cured.
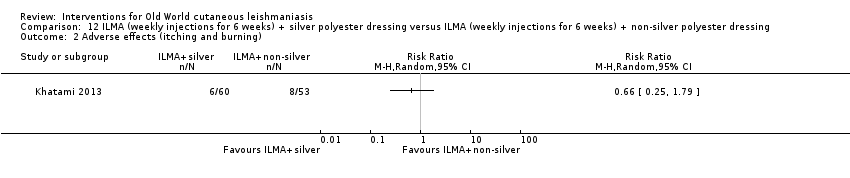
Comparison 12 ILMA (weekly injections for 6 weeks) + silver polyester dressing versus ILMA (weekly injections for 6 weeks) + non‐silver polyester dressing, Outcome 2 Adverse effects (itching and burning).

Comparison 12 ILMA (weekly injections for 6 weeks) + silver polyester dressing versus ILMA (weekly injections for 6 weeks) + non‐silver polyester dressing, Outcome 3 Adverse effects (oedema).
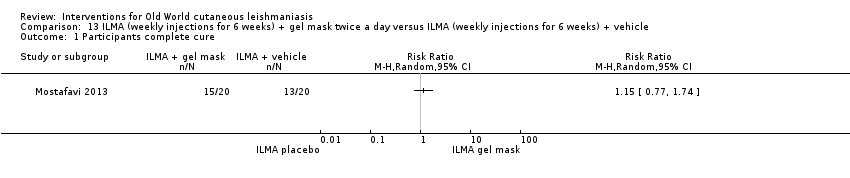
Comparison 13 ILMA (weekly injections for 6 weeks) + gel mask twice a day versus ILMA (weekly injections for 6 weeks) + vehicle, Outcome 1 Participants complete cure.

Comparison 14 ILSSG (20 mg/kg/d) + IMSSG (remaining total dose days 1, 3, 5) versus ILSSG (1000 mg/mL days 1, 3, 5), Outcome 1 Lesions cured.
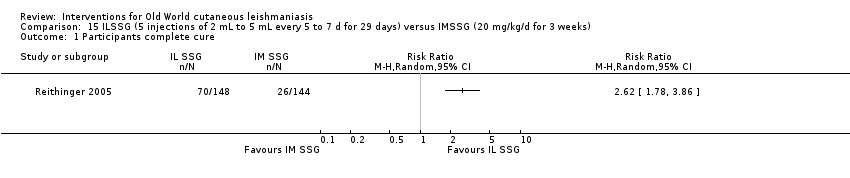
Comparison 15 ILSSG (5 injections of 2 mL to 5 mL every 5 to 7 d for 29 days) versus IMSSG (20 mg/kg/d for 3 weeks), Outcome 1 Participants complete cure.
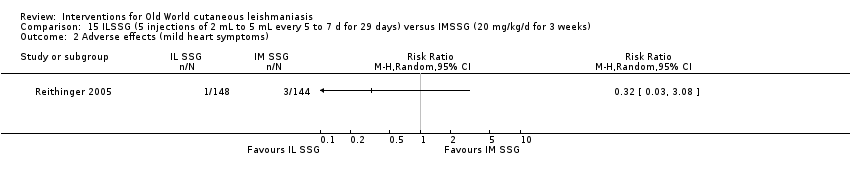
Comparison 15 ILSSG (5 injections of 2 mL to 5 mL every 5 to 7 d for 29 days) versus IMSSG (20 mg/kg/d for 3 weeks), Outcome 2 Adverse effects (mild heart symptoms).

Comparison 16 Ketoconazole 600 mg/d for 6 weeks versus ketoconazole 800 mg/d for 6 weeks, Outcome 1 Participants complete cure.
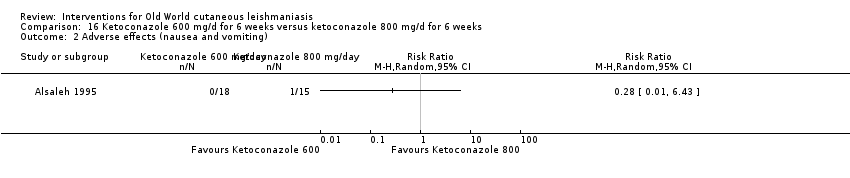
Comparison 16 Ketoconazole 600 mg/d for 6 weeks versus ketoconazole 800 mg/d for 6 weeks, Outcome 2 Adverse effects (nausea and vomiting).
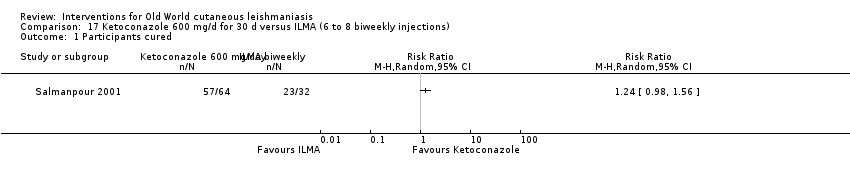
Comparison 17 Ketoconazole 600 mg/d for 30 d versus ILMA (6 to 8 biweekly injections), Outcome 1 Participants cured.

Comparison 17 Ketoconazole 600 mg/d for 30 d versus ILMA (6 to 8 biweekly injections), Outcome 2 Adverse effect (liver enzymes increase).

Comparison 18 ILSSG (100 mg/mL days 1, 3, 5) + oral ketoconazole (600 mg/d for 4 weeks) versus ILSSG (100 mg/mL days 1, 3, 5), Outcome 1 Lesions cured.
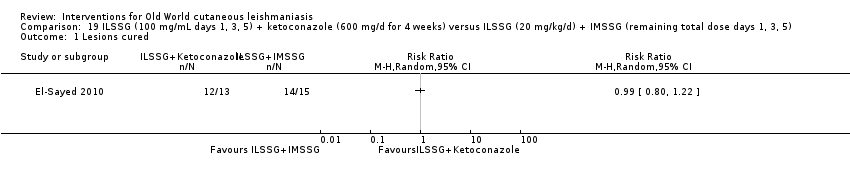
Comparison 19 ILSSG (100 mg/mL days 1, 3, 5) + ketoconazole (600 mg/d for 4 weeks) versus ILSSG (20 mg/kg/d) + IMSSG (remaining total dose days 1, 3, 5), Outcome 1 Lesions cured.

Comparison 20 Itraconazole (200 mg for 6 weeks) versus placebo, Outcome 1 Participants complete cure.

Comparison 21 Itraconazole (200 mg for 3 weeks) versus placebo, Outcome 1 Participants complete cure.
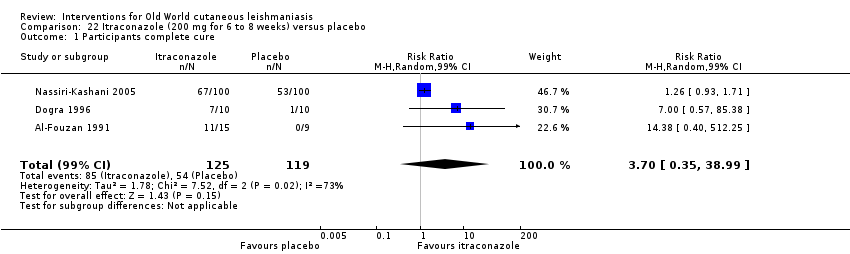
Comparison 22 Itraconazole (200 mg for 6 to 8 weeks) versus placebo, Outcome 1 Participants complete cure.
Comparison 22 Itraconazole (200 mg for 6 to 8 weeks) versus placebo, Outcome 2 Adverse effects.
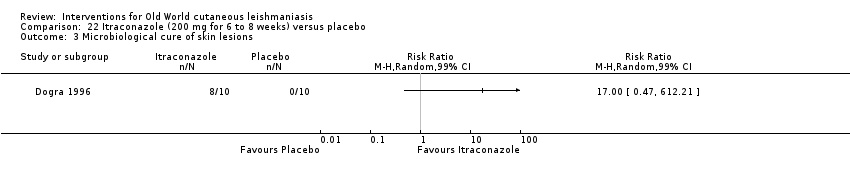
Comparison 22 Itraconazole (200 mg for 6 to 8 weeks) versus placebo, Outcome 3 Microbiological cure of skin lesions.
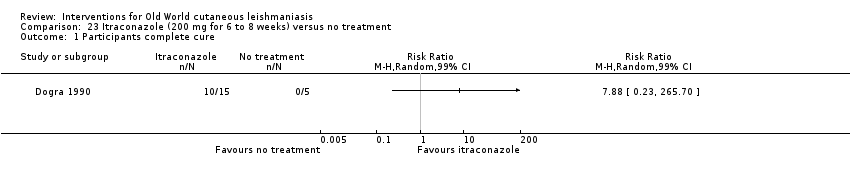
Comparison 23 Itraconazole (200 mg for 6 to 8 weeks) versus no treatment, Outcome 1 Participants complete cure.
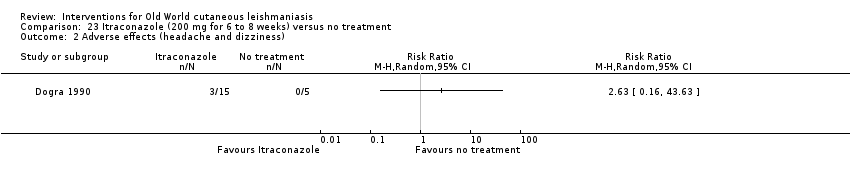
Comparison 23 Itraconazole (200 mg for 6 to 8 weeks) versus no treatment, Outcome 2 Adverse effects (headache and dizziness).
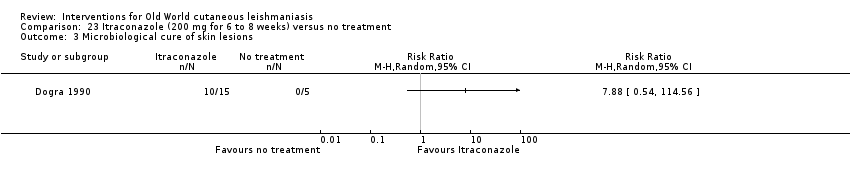
Comparison 23 Itraconazole (200 mg for 6 to 8 weeks) versus no treatment, Outcome 3 Microbiological cure of skin lesions.
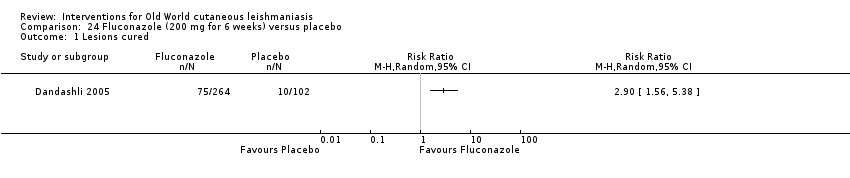
Comparison 24 Fluconazole (200 mg for 6 weeks) versus placebo, Outcome 1 Lesions cured.

Comparison 24 Fluconazole (200 mg for 6 weeks) versus placebo, Outcome 2 Participants complete cure.

Comparison 25 Fluconazole (400 mg/d for 6 weeks) versus fluconazole (200 mg/d for 6 weeks), Outcome 1 Participants complete cure.

Comparison 25 Fluconazole (400 mg/d for 6 weeks) versus fluconazole (200 mg/d for 6 weeks), Outcome 2 Adverse effects.
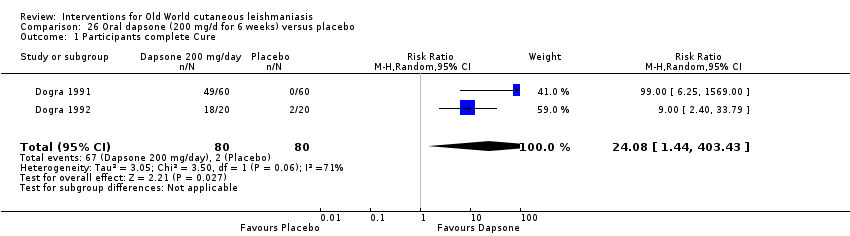
Comparison 26 Oral dapsone (200 mg/d for 6 weeks) versus placebo, Outcome 1 Participants complete Cure.

Comparison 26 Oral dapsone (200 mg/d for 6 weeks) versus placebo, Outcome 2 Adverse effects.

Comparison 27 Allopurinol (15 mg/kg/d for 3 weeks) + IMMA (20 mg/kg/d for 2 weeks) versus allopurinol (15 mg/kg/d for 3 weeks), Outcome 1 Lesions cured.

Comparison 28 Allopurinol (15mg/kg/d for 3 weeks)+ IMMA (20 mg/kg/d for 2 weeks) versus IMMA (20 mg/kg/d for 2 weeks), Outcome 1 Lesions cured.

Comparison 29 Allopurinol (15 mg/kg/d for 3 weeks) versus IMMA (20 mg/kg/d for 2 weeks), Outcome 1 Lesions Cured.

Comparison 30 Allopurinol (20 mg/kg/d for 3 weeks) + IMMA (30 mg/kg/d for 20 days) versus IMMA (60 mg/kg/d for 20 d), Outcome 1 Lesions cured.

Comparison 30 Allopurinol (20 mg/kg/d for 3 weeks) + IMMA (30 mg/kg/d for 20 days) versus IMMA (60 mg/kg/d for 20 d), Outcome 2 Adverse effects.

Comparison 30 Allopurinol (20 mg/kg/d for 3 weeks) + IMMA (30 mg/kg/d for 20 days) versus IMMA (60 mg/kg/d for 20 d), Outcome 3 Microbiological cure of skin lesions.

Comparison 31 Allopurinol (20 mg/kg/d for 3 weeks)+ IMMA (10 mg/kg/d for 20 d) versus IMMA (20 mg/kg/d for 28 d), Outcome 1 Adverse effects.

Comparison 32 Allopurinol (20 mg/kg/d for 3 weeks) versus IVSSG (20 mg/kg/d for 15 d), Outcome 1 Participants complete cured.
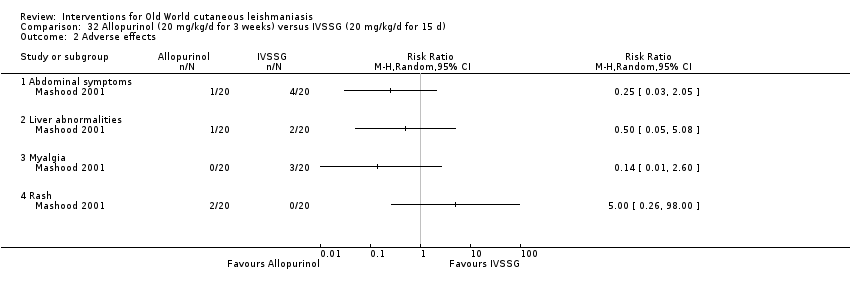
Comparison 32 Allopurinol (20 mg/kg/d for 3 weeks) versus IVSSG (20 mg/kg/d for 15 d), Outcome 2 Adverse effects.

Comparison 33 Oral rifampicin (10 mg/kg/d for 4 to 6 weeks) versus placebo, Outcome 1 Participants complete cure.

Comparison 33 Oral rifampicin (10 mg/kg/d for 4 to 6 weeks) versus placebo, Outcome 2 Microbiological cure of skin lesions.

Comparison 34 Oral rifampicin (10 mg/kg/d) + omeprazole (20 mg/d) for 6 weeks versus placebo, Outcome 1 Participants complete cure.

Comparison 35 Azythromicin (500 mg/d for 5 d/month up to 4 months) versus IMMA (60 mg/kg/d for 20 d), Outcome 1 Lesions cured.

Comparison 35 Azythromicin (500 mg/d for 5 d/month up to 4 months) versus IMMA (60 mg/kg/d for 20 d), Outcome 2 Adverse effects.
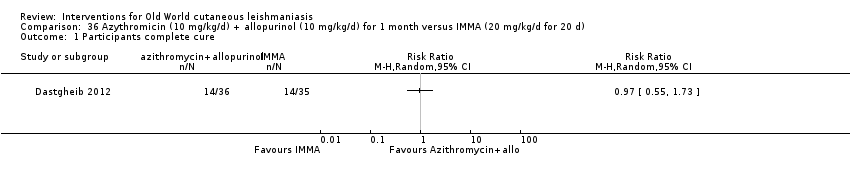
Comparison 36 Azythromicin (10 mg/kg/d) + allopurinol (10 mg/kg/d) for 1 month versus IMMA (20 mg/kg/d for 20 d), Outcome 1 Participants complete cure.
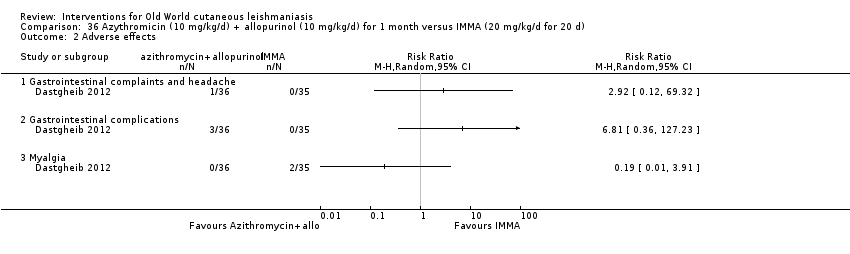
Comparison 36 Azythromicin (10 mg/kg/d) + allopurinol (10 mg/kg/d) for 1 month versus IMMA (20 mg/kg/d for 20 d), Outcome 2 Adverse effects.

Comparison 37 Oral pentoxifylline (400 mg 3 times daily) + IMMA (20 mg/kg/d) for 20 d versus placebo + IMMA (20 mg/kg/d) for 20 d, Outcome 1 Participants complete cure.

Comparison 37 Oral pentoxifylline (400 mg 3 times daily) + IMMA (20 mg/kg/d) for 20 d versus placebo + IMMA (20 mg/kg/d) for 20 d, Outcome 2 Adverse effects.

Comparison 38 Oral miltefosine (2.5 mg/kg/d for 4 weeks) versus IMMA (60 mg/kg/d for 2 weeks), Outcome 1 Participants complete cure.
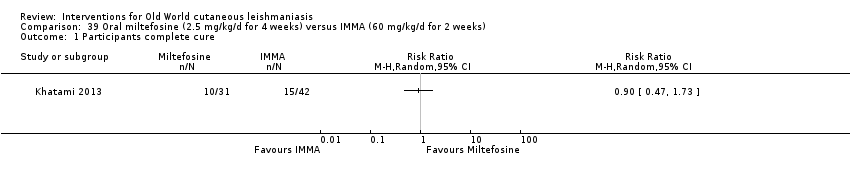
Comparison 39 Oral miltefosine (2.5 mg/kg/d for 4 weeks) versus IMMA (60 mg/kg/d for 2 weeks), Outcome 1 Participants complete cure.

Comparison 40 Oral zinc sulphate 2.5 mg/kg/d for 45 days versus oral zinc sulphate 5 mg/kg/d for 45 d, Outcome 1 Participants complete cure.
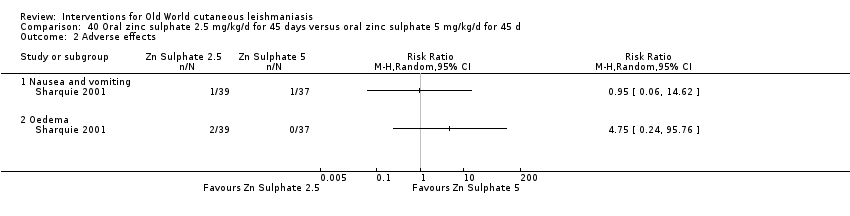
Comparison 40 Oral zinc sulphate 2.5 mg/kg/d for 45 days versus oral zinc sulphate 5 mg/kg/d for 45 d, Outcome 2 Adverse effects.

Comparison 41 Oral zinc sulphate 2.5 mg/kg/d for 45 d versus oral zinc sulphate 10 mg/kg/d for 45 d, Outcome 1 Participants complete cure.
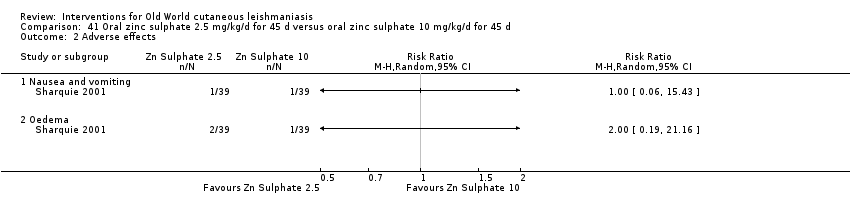
Comparison 41 Oral zinc sulphate 2.5 mg/kg/d for 45 d versus oral zinc sulphate 10 mg/kg/d for 45 d, Outcome 2 Adverse effects.
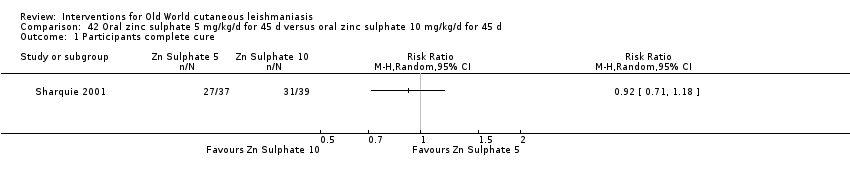
Comparison 42 Oral zinc sulphate 5 mg/kg/d for 45 d versus oral zinc sulphate 10 mg/kg/d for 45 d, Outcome 1 Participants complete cure.
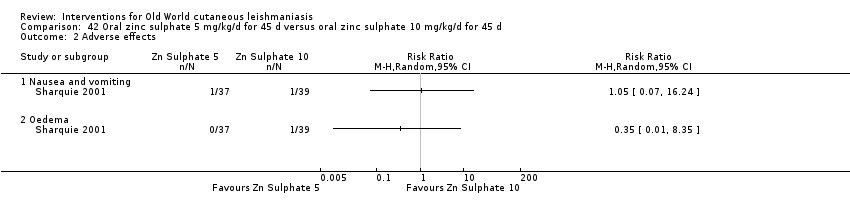
Comparison 42 Oral zinc sulphate 5 mg/kg/d for 45 d versus oral zinc sulphate 10 mg/kg/d for 45 d, Outcome 2 Adverse effects.
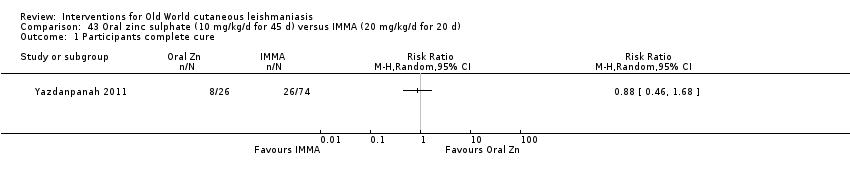
Comparison 43 Oral zinc sulphate (10 mg/kg/d for 45 d) versus IMMA (20 mg/kg/d for 20 d), Outcome 1 Participants complete cure.
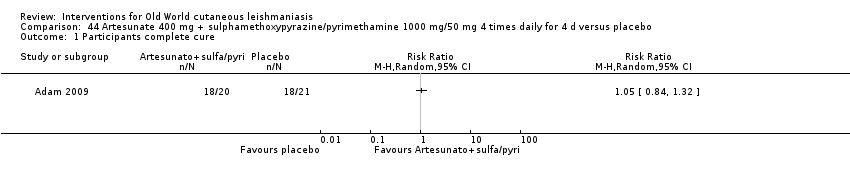
Comparison 44 Artesunate 400 mg + sulphamethoxypyrazine/pyrimethamine 1000 mg/50 mg 4 times daily for 4 d versus placebo, Outcome 1 Participants complete cure.
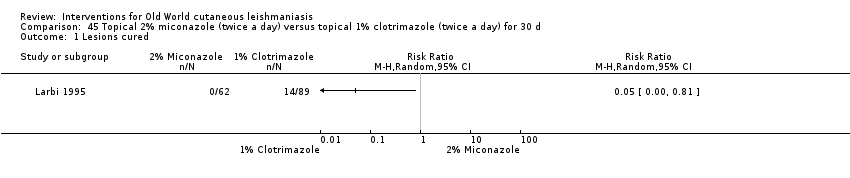
Comparison 45 Topical 2% miconazole (twice a day) versus topical 1% clotrimazole (twice a day) for 30 d, Outcome 1 Lesions cured.
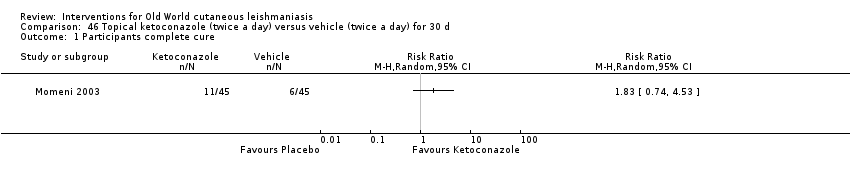
Comparison 46 Topical ketoconazole (twice a day) versus vehicle (twice a day) for 30 d, Outcome 1 Participants complete cure.

Comparison 47 Topical amphotericin B (3 to 7 drops twice daily for 8 weeks) versus ILMA (max 2 mL) once a week for 8 weeks, Outcome 1 Participants complete cure (ITT).

Comparison 47 Topical amphotericin B (3 to 7 drops twice daily for 8 weeks) versus ILMA (max 2 mL) once a week for 8 weeks, Outcome 2 Adverse effects.

Comparison 48 Paromomycin 15% + 12% MBCL (twice daily for 28 d) versus vehicle (twice daily for 28 d), Outcome 1 Lesions cured.

Comparison 48 Paromomycin 15% + 12% MBCL (twice daily for 28 d) versus vehicle (twice daily for 28 d), Outcome 2 Scarring.

Comparison 48 Paromomycin 15% + 12% MBCL (twice daily for 28 d) versus vehicle (twice daily for 28 d), Outcome 3 Microbiological cure of skin lesions.
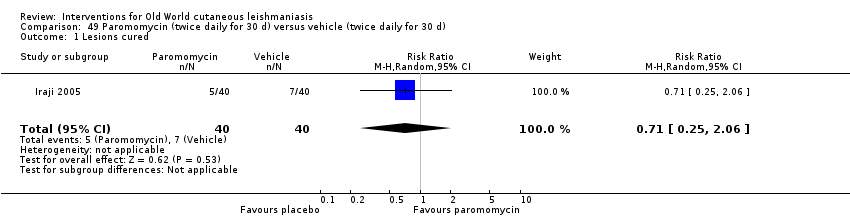
Comparison 49 Paromomycin (twice daily for 30 d) versus vehicle (twice daily for 30 d), Outcome 1 Lesions cured.
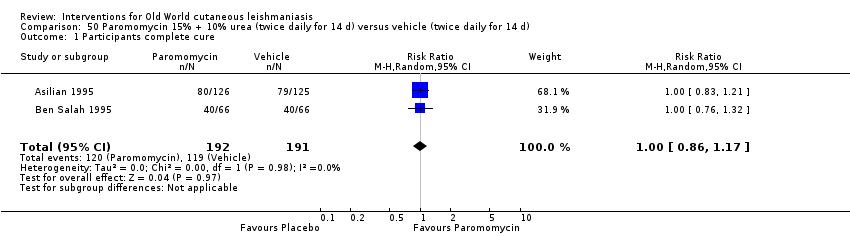
Comparison 50 Paromomycin 15% + 10% urea (twice daily for 14 d) versus vehicle (twice daily for 14 d), Outcome 1 Participants complete cure.
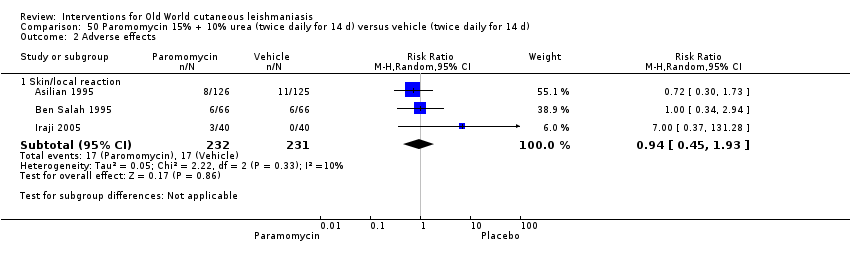
Comparison 50 Paromomycin 15% + 10% urea (twice daily for 14 d) versus vehicle (twice daily for 14 d), Outcome 2 Adverse effects.
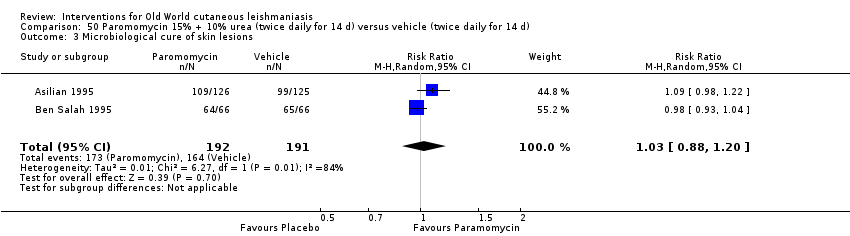
Comparison 50 Paromomycin 15% + 10% urea (twice daily for 14 d) versus vehicle (twice daily for 14 d), Outcome 3 Microbiological cure of skin lesions.
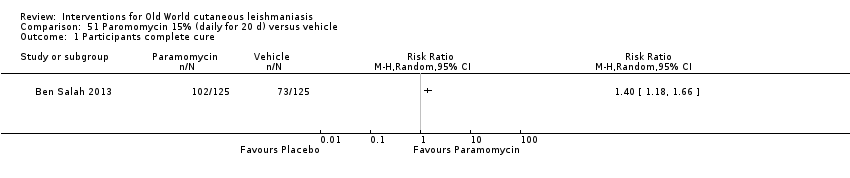
Comparison 51 Paromomycin 15% (daily for 20 d) versus vehicle, Outcome 1 Participants complete cure.

Comparison 52 Paromomycin 15% + gentamicin 0.5% (daily for 20 d) versus vehicle, Outcome 1 Participants complete cure.

Comparison 53 Paromomycin 15% + gentamicin 0.5% (daily for 20 d) versus paromomycin 15% alone (daily for 20 d), Outcome 1 Participants complete cure.

Comparison 54 Paromomycin 15% + 10% urea (twice daily for 45 d) versus ILMA (weekly for up to 3 months), Outcome 1 Participants complete cure.

Comparison 54 Paromomycin 15% + 10% urea (twice daily for 45 d) versus ILMA (weekly for up to 3 months), Outcome 2 Recurrence.
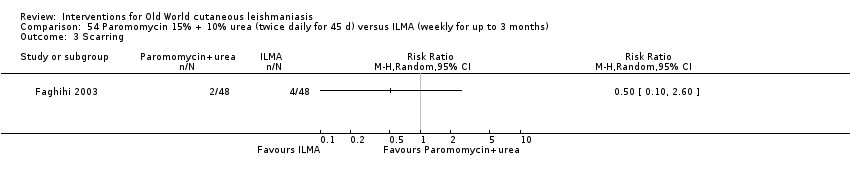
Comparison 54 Paromomycin 15% + 10% urea (twice daily for 45 d) versus ILMA (weekly for up to 3 months), Outcome 3 Scarring.
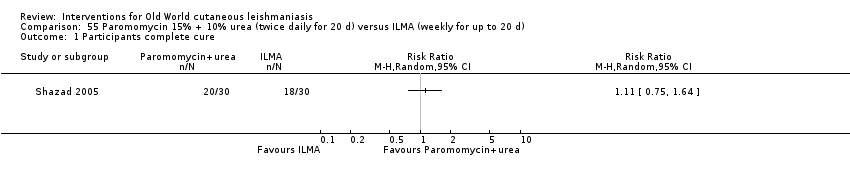
Comparison 55 Paromomycin 15% + 10% urea (twice daily for 20 d) versus ILMA (weekly for up to 20 d), Outcome 1 Participants complete cure.

Comparison 55 Paromomycin 15% + 10% urea (twice daily for 20 d) versus ILMA (weekly for up to 20 d), Outcome 2 Adverse effects.
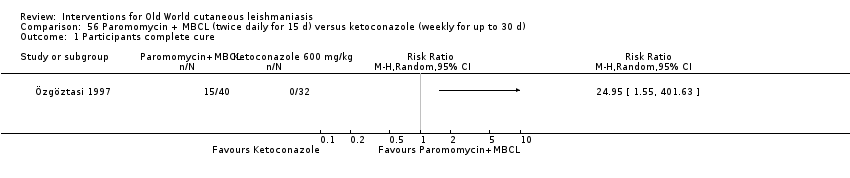
Comparison 56 Paromomycin + MBCL (twice daily for 15 d) versus ketoconazole (weekly for up to 30 d), Outcome 1 Participants complete cure.

Comparison 56 Paromomycin + MBCL (twice daily for 15 d) versus ketoconazole (weekly for up to 30 d), Outcome 2 Microbiological cure of skin lesions.
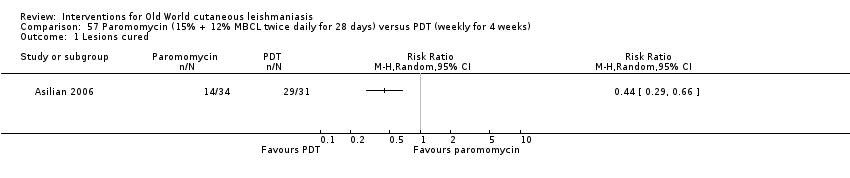
Comparison 57 Paromomycin (15% + 12% MBCL twice daily for 28 days) versus PDT (weekly for 4 weeks), Outcome 1 Lesions cured.
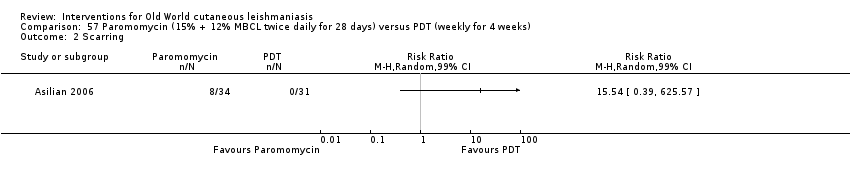
Comparison 57 Paromomycin (15% + 12% MBCL twice daily for 28 days) versus PDT (weekly for 4 weeks), Outcome 2 Scarring.

Comparison 57 Paromomycin (15% + 12% MBCL twice daily for 28 days) versus PDT (weekly for 4 weeks), Outcome 3 Microbiological cure of skin lesions.

Comparison 58 Paromomycin (4 weeks) versus paromomycin (2 weeks) + vehicle (2 weeks), Outcome 1 Participants complete cure.

Comparison 58 Paromomycin (4 weeks) versus paromomycin (2 weeks) + vehicle (2 weeks), Outcome 2 Microbiological cure of skin lesions.
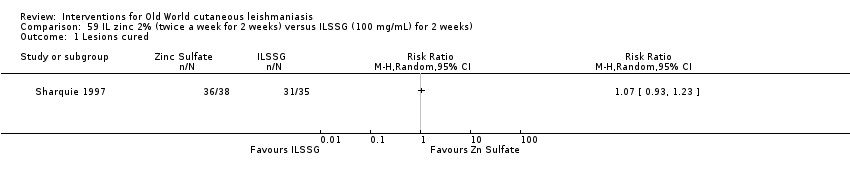
Comparison 59 IL zinc 2% (twice a week for 2 weeks) versus ILSSG (100 mg/mL) for 2 weeks), Outcome 1 Lesions cured.

Comparison 60 IL zinc 2% (twice a week for 2 weeks) versus IL 7% HSCS for 2 weeks, Outcome 1 Lesions cured.
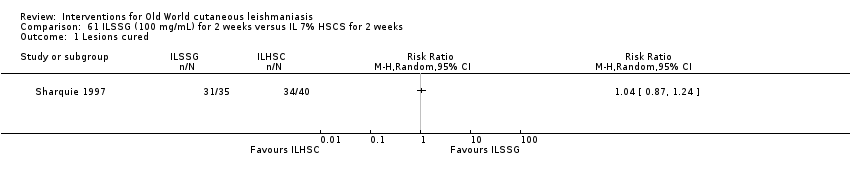
Comparison 61 ILSSG (100 mg/mL) for 2 weeks versus IL 7% HSCS for 2 weeks, Outcome 1 Lesions cured.
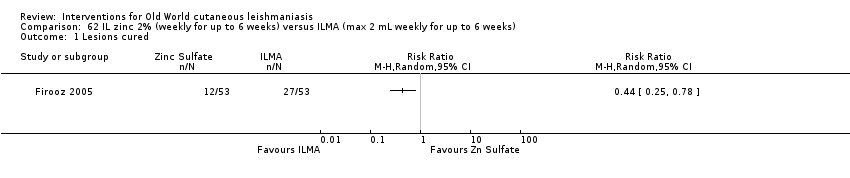
Comparison 62 IL zinc 2% (weekly for up to 6 weeks) versus ILMA (max 2 mL weekly for up to 6 weeks), Outcome 1 Lesions cured.

Comparison 62 IL zinc 2% (weekly for up to 6 weeks) versus ILMA (max 2 mL weekly for up to 6 weeks), Outcome 2 Participants complete cured.
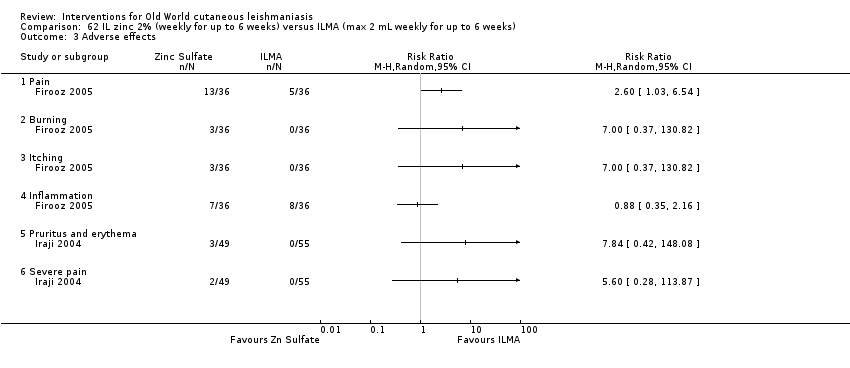
Comparison 62 IL zinc 2% (weekly for up to 6 weeks) versus ILMA (max 2 mL weekly for up to 6 weeks), Outcome 3 Adverse effects.
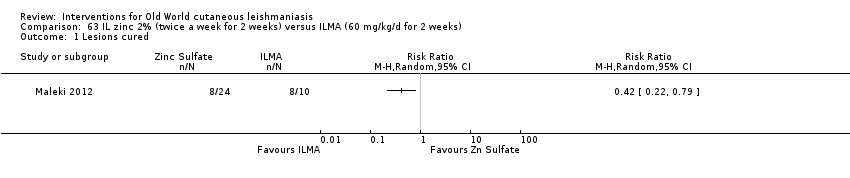
Comparison 63 IL zinc 2% (twice a week for 2 weeks) versus ILMA (60 mg/kg/d for 2 weeks), Outcome 1 Lesions cured.

Comparison 63 IL zinc 2% (twice a week for 2 weeks) versus ILMA (60 mg/kg/d for 2 weeks), Outcome 2 Adverse effects.
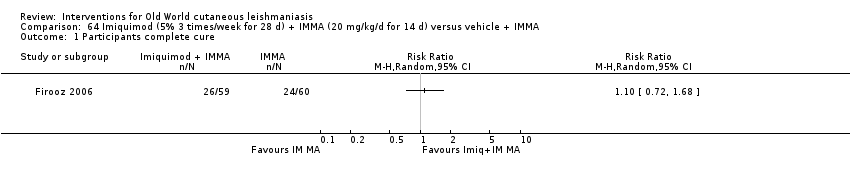
Comparison 64 Imiquimod (5% 3 times/week for 28 d) + IMMA (20 mg/kg/d for 14 d) versus vehicle + IMMA, Outcome 1 Participants complete cure.

Comparison 64 Imiquimod (5% 3 times/week for 28 d) + IMMA (20 mg/kg/d for 14 d) versus vehicle + IMMA, Outcome 2 Participants with treated lesions that recur.

Comparison 64 Imiquimod (5% 3 times/week for 28 d) + IMMA (20 mg/kg/d for 14 d) versus vehicle + IMMA, Outcome 3 Adverse effects.
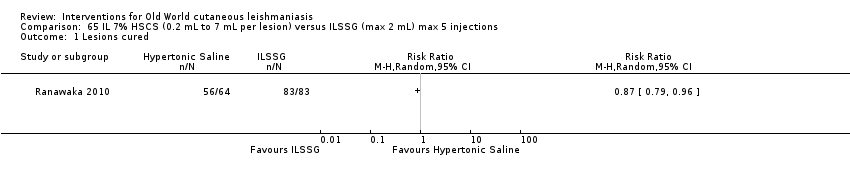
Comparison 65 IL 7% HSCS (0.2 mL to 7 mL per lesion) versus ILSSG (max 2 mL) max 5 injections, Outcome 1 Lesions cured.

Comparison 66 IL 5% HSCS (0.5 mL to 1 mL per lesion) versus ILMA (0.5 mL to 1 mL per lesion) weekly for 6 to 10 weeks, Outcome 1 Lesions cured.

Comparison 66 IL 5% HSCS (0.5 mL to 1 mL per lesion) versus ILMA (0.5 mL to 1 mL per lesion) weekly for 6 to 10 weeks, Outcome 2 Adverse effects.

Comparison 67 IL 7% HSCS (0.1 mL to 0.5 mL per lesion) versus IL 2% ciprofloxacin solution (0.1 mL to 0.5 mL per lesion), Outcome 1 Lesions cured.

Comparison 68 IL 15% HSCS (0.2 mL to 4 mL per lesion) maximum 5 injections versus IL 10% HSCS (0.2 mL to 4 mL per lesion), Outcome 1 Lesions cured.
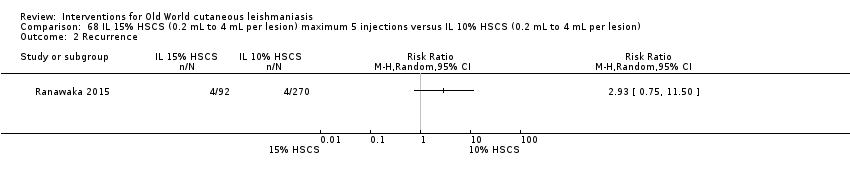
Comparison 68 IL 15% HSCS (0.2 mL to 4 mL per lesion) maximum 5 injections versus IL 10% HSCS (0.2 mL to 4 mL per lesion), Outcome 2 Recurrence.

Comparison 68 IL 15% HSCS (0.2 mL to 4 mL per lesion) maximum 5 injections versus IL 10% HSCS (0.2 mL to 4 mL per lesion), Outcome 3 Speed of healing (weeks).
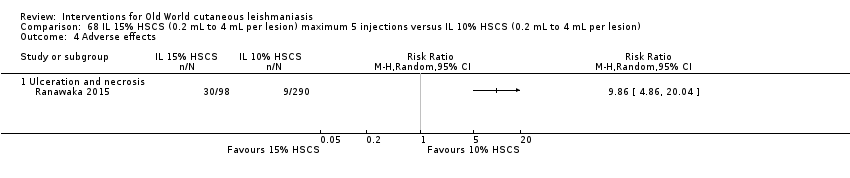
Comparison 68 IL 15% HSCS (0.2 mL to 4 mL per lesion) maximum 5 injections versus IL 10% HSCS (0.2 mL to 4 mL per lesion), Outcome 4 Adverse effects.
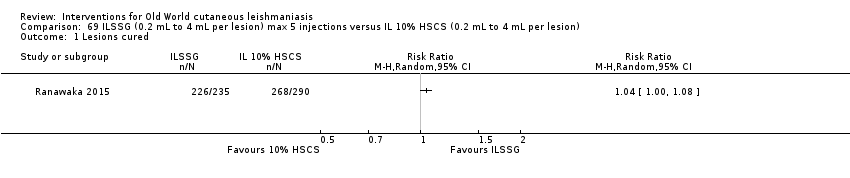
Comparison 69 ILSSG (0.2 mL to 4 mL per lesion) max 5 injections versus IL 10% HSCS (0.2 mL to 4 mL per lesion), Outcome 1 Lesions cured.

Comparison 69 ILSSG (0.2 mL to 4 mL per lesion) max 5 injections versus IL 10% HSCS (0.2 mL to 4 mL per lesion), Outcome 2 Recurrence.

Comparison 69 ILSSG (0.2 mL to 4 mL per lesion) max 5 injections versus IL 10% HSCS (0.2 mL to 4 mL per lesion), Outcome 3 Speed of healing (weeks).

Comparison 69 ILSSG (0.2 mL to 4 mL per lesion) max 5 injections versus IL 10% HSCS (0.2 mL to 4 mL per lesion), Outcome 4 Adverse effects.
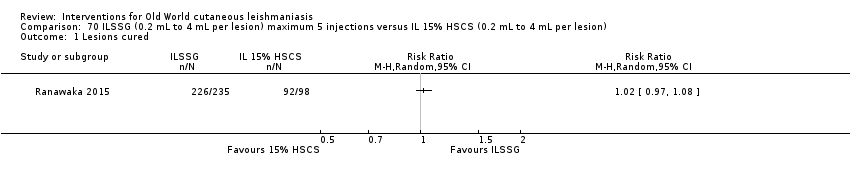
Comparison 70 ILSSG (0.2 mL to 4 mL per lesion) maximum 5 injections versus IL 15% HSCS (0.2 mL to 4 mL per lesion), Outcome 1 Lesions cured.

Comparison 70 ILSSG (0.2 mL to 4 mL per lesion) maximum 5 injections versus IL 15% HSCS (0.2 mL to 4 mL per lesion), Outcome 2 Recurrence.
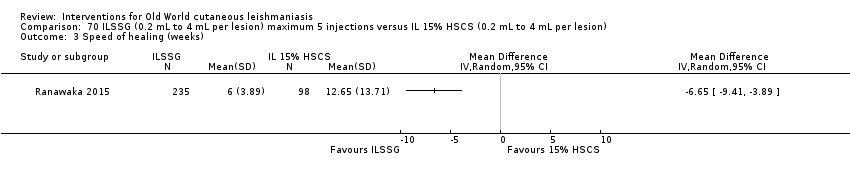
Comparison 70 ILSSG (0.2 mL to 4 mL per lesion) maximum 5 injections versus IL 15% HSCS (0.2 mL to 4 mL per lesion), Outcome 3 Speed of healing (weeks).

Comparison 70 ILSSG (0.2 mL to 4 mL per lesion) maximum 5 injections versus IL 15% HSCS (0.2 mL to 4 mL per lesion), Outcome 4 Adverse effects.

Comparison 71 IL IFN‐γ (weekly for 5 weeks) versus ILMA (0.5 mL to 1 mL per lesion) weekly for 5 weeks, Outcome 1 Lesions cured.
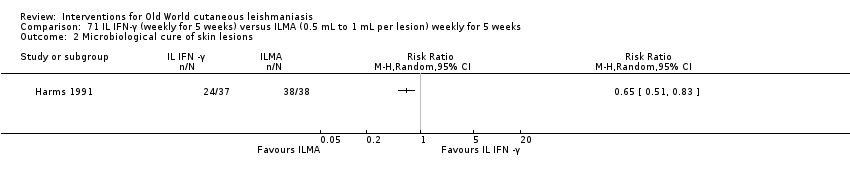
Comparison 71 IL IFN‐γ (weekly for 5 weeks) versus ILMA (0.5 mL to 1 mL per lesion) weekly for 5 weeks, Outcome 2 Microbiological cure of skin lesions.

Comparison 72 WR279,396 (twice a day for 20 d) versus vehicle (twice a day for 20 d), Outcome 1 Participants complete cure.

Comparison 72 WR279,396 (twice a day for 20 d) versus vehicle (twice a day for 20 d), Outcome 2 Adverse effects.

Comparison 73 IL metronidazole (2.5 mg to 10 mg each lesion) versus ILMA (150 mg to 600 mg each lesion) for up to 8 weeks, Outcome 1 Participants complete cure.
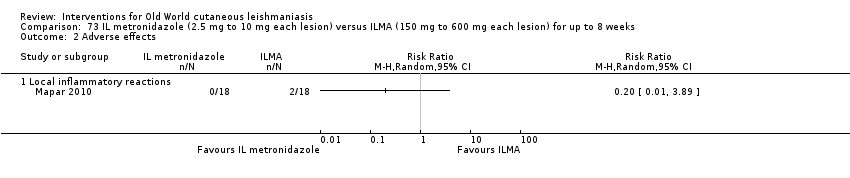
Comparison 73 IL metronidazole (2.5 mg to 10 mg each lesion) versus ILMA (150 mg to 600 mg each lesion) for up to 8 weeks, Outcome 2 Adverse effects.

Comparison 74 Topical miltefosine 6% (once daily) versus ILMA (twice a week) for up to 28 d, Outcome 1 Participants complete cure.

Comparison 75 Dapsone gel 5% (twice a day) + ILMA (weekly) versus cryotherapy (every 2 weeks) + IMMA (weekly) for up to 16 weeks, Outcome 1 Lesions cured.
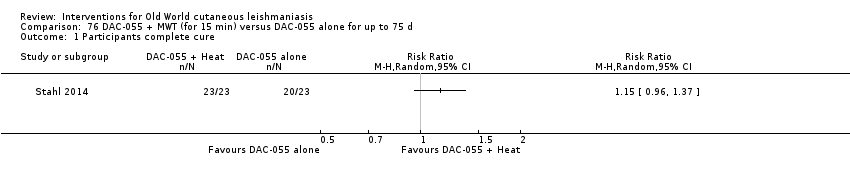
Comparison 76 DAC‐055 + MWT (for 15 min) versus DAC‐055 alone for up to 75 d, Outcome 1 Participants complete cure.
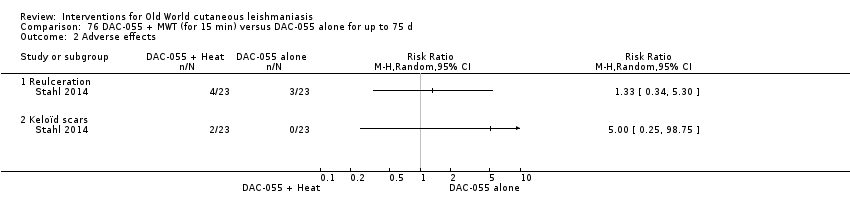
Comparison 76 DAC‐055 + MWT (for 15 min) versus DAC‐055 alone for up to 75 d, Outcome 2 Adverse effects.

Comparison 77 DAC‐055 + heat (for 15 min) versus ILSSG (0.6 mL) for up to 75 d, Outcome 1 Participants complete cure.
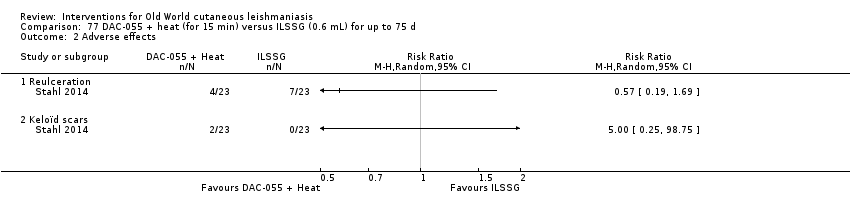
Comparison 77 DAC‐055 + heat (for 15 min) versus ILSSG (0.6 mL) for up to 75 d, Outcome 2 Adverse effects.

Comparison 78 DAC‐055 alone (for 15 min) versus ILSSG (0.6 mL) for up to 75 d, Outcome 1 Participants complete cure.

Comparison 78 DAC‐055 alone (for 15 min) versus ILSSG (0.6 mL) for up to 75 d, Outcome 2 Adverse effects.

Comparison 79 Thio‐Ben (1 mL to 2 mL daily) + cryotherapy (fortnightly) versus ILMA (0.5 mL to 2 mL per lesions) weekly + cryotherapy (fortnightly) for up to 12 weeks, Outcome 1 Lesions cured.
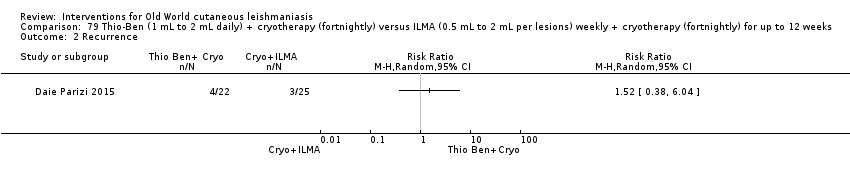
Comparison 79 Thio‐Ben (1 mL to 2 mL daily) + cryotherapy (fortnightly) versus ILMA (0.5 mL to 2 mL per lesions) weekly + cryotherapy (fortnightly) for up to 12 weeks, Outcome 2 Recurrence.
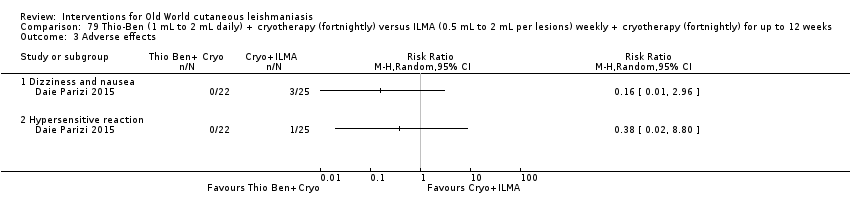
Comparison 79 Thio‐Ben (1 mL to 2 mL daily) + cryotherapy (fortnightly) versus ILMA (0.5 mL to 2 mL per lesions) weekly + cryotherapy (fortnightly) for up to 12 weeks, Outcome 3 Adverse effects.

Comparison 80 CO₂ laser (30 W continuous) versus IMMA (50 mg/kg/d) for up to 15 d, Outcome 1 Lesions cured.

Comparison 80 CO₂ laser (30 W continuous) versus IMMA (50 mg/kg/d) for up to 15 d, Outcome 2 Adverse effects.

Comparison 81 CO₂ laser (30 W continuous) versus cryotherapy (fortnightly) + ILMA (weekly) for up to 12 weeks, Outcome 1 Lesions cured.
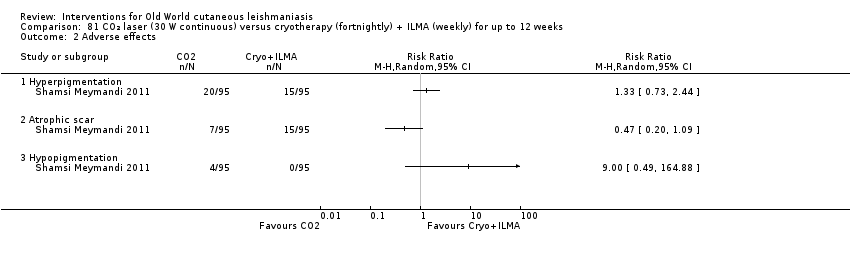
Comparison 81 CO₂ laser (30 W continuous) versus cryotherapy (fortnightly) + ILMA (weekly) for up to 12 weeks, Outcome 2 Adverse effects.

Comparison 82 Ablative CO₂ laser (25 kW for 1 session) versus 3 weeks fractional CO₂ laser, Outcome 1 Partcipants complete cure.
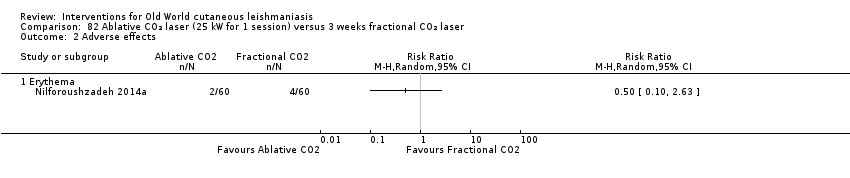
Comparison 82 Ablative CO₂ laser (25 kW for 1 session) versus 3 weeks fractional CO₂ laser, Outcome 2 Adverse effects.

Comparison 83 TCA (50% wt/vol) fortnightly up to 3 times versus ILMA alone (weekly for up to 6 weeks), Outcome 1 Participants complete cure.
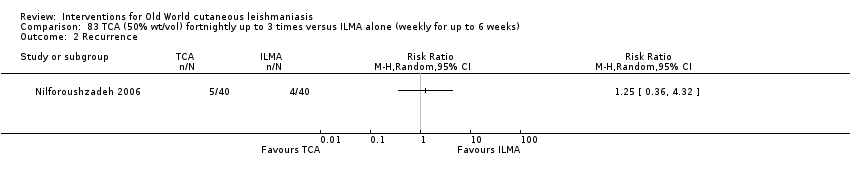
Comparison 83 TCA (50% wt/vol) fortnightly up to 3 times versus ILMA alone (weekly for up to 6 weeks), Outcome 2 Recurrence.

Comparison 83 TCA (50% wt/vol) fortnightly up to 3 times versus ILMA alone (weekly for up to 6 weeks), Outcome 3 Adverse effects.

Comparison 83 TCA (50% wt/vol) fortnightly up to 3 times versus ILMA alone (weekly for up to 6 weeks), Outcome 4 Microbiological cure of skin lesions.
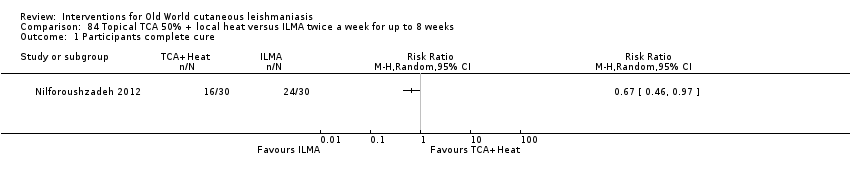
Comparison 84 Topical TCA 50% + local heat versus ILMA twice a week for up to 8 weeks, Outcome 1 Participants complete cure.
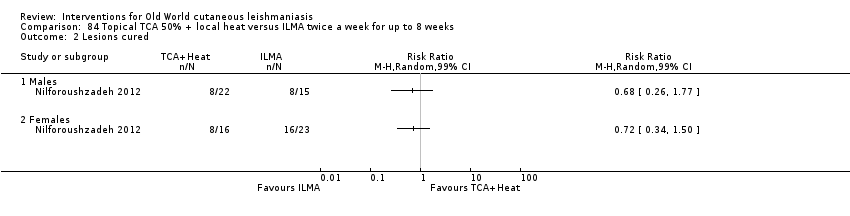
Comparison 84 Topical TCA 50% + local heat versus ILMA twice a week for up to 8 weeks, Outcome 2 Lesions cured.

Comparison 85 TCA + ILMA (weekly for up to 8 weeks) versus ILMA alone (twice a week for up to 8 weeks), Outcome 1 Participants complete cure.

Comparison 85 TCA + ILMA (weekly for up to 8 weeks) versus ILMA alone (twice a week for up to 8 weeks), Outcome 2 Speed of healing (weeks).
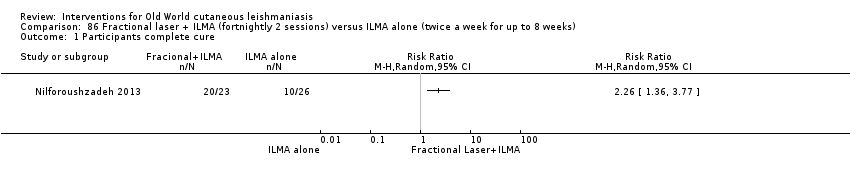
Comparison 86 Fractional laser + ILMA (fortnightly 2 sessions) versus ILMA alone (twice a week for up to 8 weeks), Outcome 1 Participants complete cure.

Comparison 87 TCA + ILMA (weekly for up to 8 weeks) versus fractional laser + ILMA (fortnightly 2 sessions), Outcome 1 Participants complete cure.

Comparison 87 TCA + ILMA (weekly for up to 8 weeks) versus fractional laser + ILMA (fortnightly 2 sessions), Outcome 2 Speed of healing (weeks).

Comparison 88 TCA fortnightly up to 8 weeks + ILMA (twice a week) versus ILMA alone (weekly for up to 8 weeks), Outcome 1 Participants complete cure.
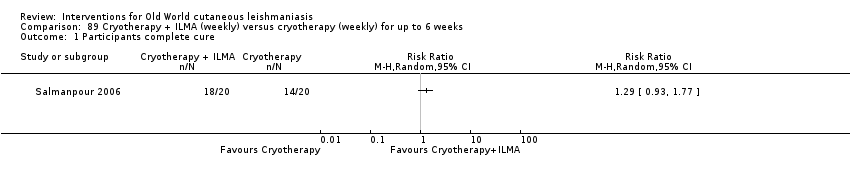
Comparison 89 Cryotherapy + ILMA (weekly) versus cryotherapy (weekly) for up to 6 weeks, Outcome 1 Participants complete cure.

Comparison 89 Cryotherapy + ILMA (weekly) versus cryotherapy (weekly) for up to 6 weeks, Outcome 2 Adverse effects.
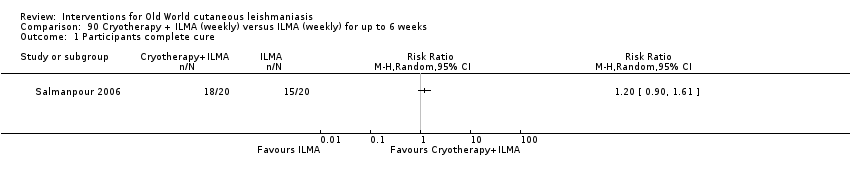
Comparison 90 Cryotherapy + ILMA (weekly) versus ILMA (weekly) for up to 6 weeks, Outcome 1 Participants complete cure.

Comparison 90 Cryotherapy + ILMA (weekly) versus ILMA (weekly) for up to 6 weeks, Outcome 2 Adverse effects.

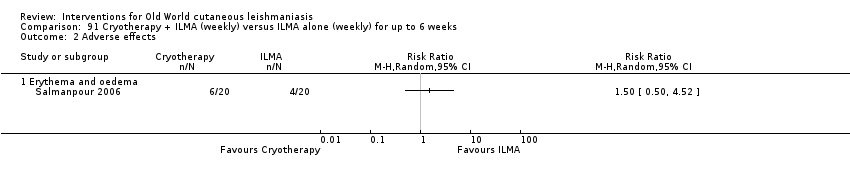
Comparison 91 Cryotherapy + ILMA (weekly) versus ILMA alone (weekly) for up to 6 weeks, Outcome 1 Participants complete cure.
Comparison 91 Cryotherapy + ILMA (weekly) versus ILMA alone (weekly) for up to 6 weeks, Outcome 2 Adverse effects.

Comparison 92 Cryotherapy (weekly) versus ILMA (weekly) for up to 6 weeks, Outcome 1 Participants complete cure.
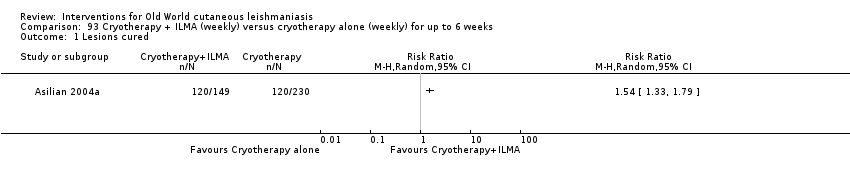
Comparison 93 Cryotherapy + ILMA (weekly) versus cryotherapy alone (weekly) for up to 6 weeks, Outcome 1 Lesions cured.

Comparison 93 Cryotherapy + ILMA (weekly) versus cryotherapy alone (weekly) for up to 6 weeks, Outcome 2 Adverse effects.

Comparison 94 Cryotherapy + ILMA (weekly) versus ILMA (fortnightly) for up to 6 weeks, Outcome 1 Lesions cured.

Comparison 94 Cryotherapy + ILMA (weekly) versus ILMA (fortnightly) for up to 6 weeks, Outcome 2 Adverse effects.
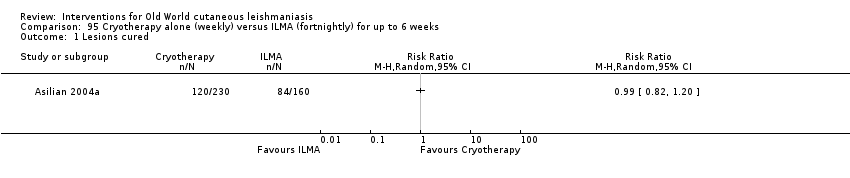
Comparison 95 Cryotherapy alone (weekly) versus ILMA (fortnightly) for up to 6 weeks, Outcome 1 Lesions cured.

Comparison 95 Cryotherapy alone (weekly) versus ILMA (fortnightly) for up to 6 weeks, Outcome 2 Adverse effects.

Comparison 96 Cryotherapy (fortnightly) + 15% paromomycin + 10% urea cream (twice a day) + ILMA (twice a day for 4 weeks) versus ILMA (twice a week) for up to 6 weeks, Outcome 1 Participants complete cure.

Comparison 97 Cryotherapy (weekly) + 3% salicylic + 3% sodium nitrite cream (twice a day) for up to 12 weeks versus cryotherapy (weekly) + 3% salicylic cream (twice a day), Outcome 1 Lesions cured.
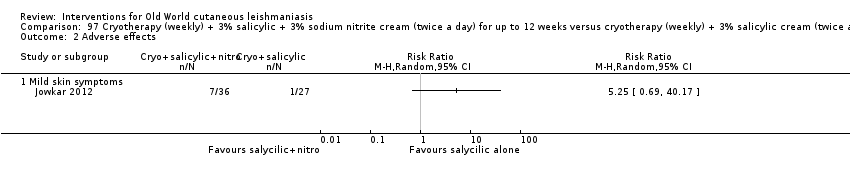
Comparison 97 Cryotherapy (weekly) + 3% salicylic + 3% sodium nitrite cream (twice a day) for up to 12 weeks versus cryotherapy (weekly) + 3% salicylic cream (twice a day), Outcome 2 Adverse effects.
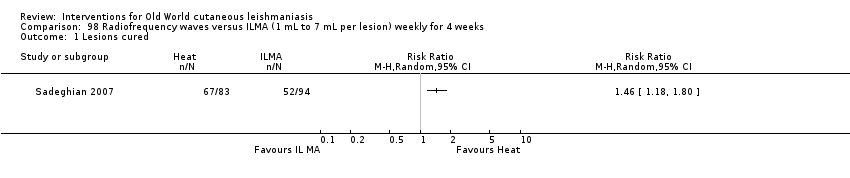
Comparison 98 Radiofrequency waves versus ILMA (1 mL to 7 mL per lesion) weekly for 4 weeks, Outcome 1 Lesions cured.
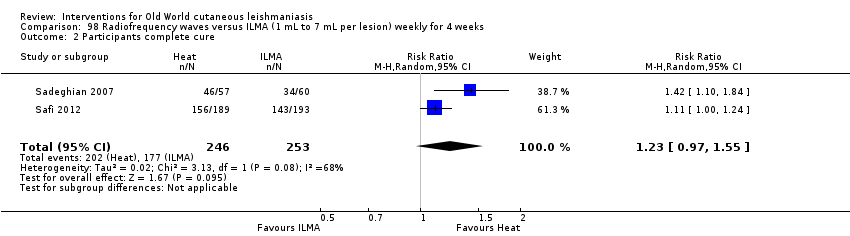
Comparison 98 Radiofrequency waves versus ILMA (1 mL to 7 mL per lesion) weekly for 4 weeks, Outcome 2 Participants complete cure.
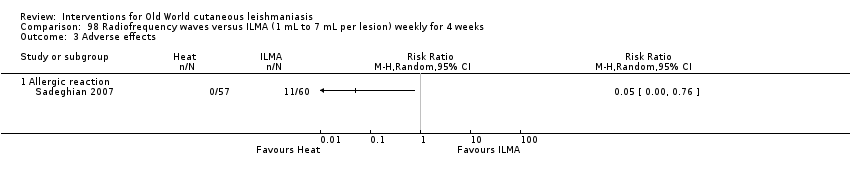
Comparison 98 Radiofrequency waves versus ILMA (1 mL to 7 mL per lesion) weekly for 4 weeks, Outcome 3 Adverse effects.

Comparison 99 Radiofrequency waves (50 uCTM applied for 30 s) versus ILSSG (10 days of 20 mg/kg/d), Outcome 1 Lesions cured.

Comparison 99 Radiofrequency waves (50 uCTM applied for 30 s) versus ILSSG (10 days of 20 mg/kg/d), Outcome 2 Adverse effects (serious).

Comparison 100 Radiofrequency waves (1 treatment of > 1 consecutive application at 50ºC for 30 s) versus IMSSG (20 mg/kg/d for 3 weeks), Outcome 1 Participants complete cure.

Comparison 100 Radiofrequency waves (1 treatment of > 1 consecutive application at 50ºC for 30 s) versus IMSSG (20 mg/kg/d for 3 weeks), Outcome 2 Adverse event (secondary infection).
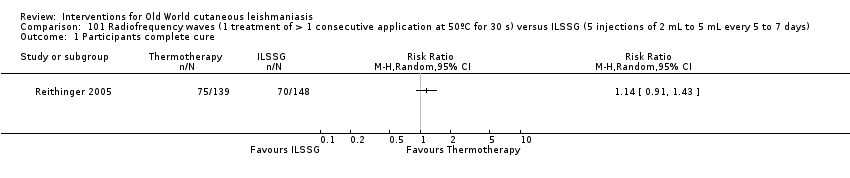
Comparison 101 Radiofrequency waves (1 treatment of > 1 consecutive application at 50ºC for 30 s) versus ILSSG (5 injections of 2 mL to 5 mL every 5 to 7 days), Outcome 1 Participants complete cure.

Comparison 101 Radiofrequency waves (1 treatment of > 1 consecutive application at 50ºC for 30 s) versus ILSSG (5 injections of 2 mL to 5 mL every 5 to 7 days), Outcome 2 Adverse event (secondary infection).

Comparison 102 Radiofrequency waves versus ILSSG, Outcome 1 Participants complete cure.
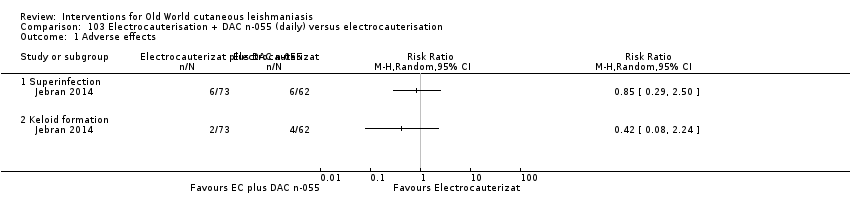
Comparison 103 Electrocauterisation + DAC n‐055 (daily) versus electrocauterisation, Outcome 1 Adverse effects.
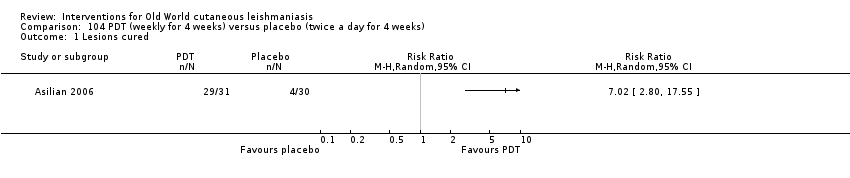
Comparison 104 PDT (weekly for 4 weeks) versus placebo (twice a day for 4 weeks), Outcome 1 Lesions cured.

Comparison 104 PDT (weekly for 4 weeks) versus placebo (twice a day for 4 weeks), Outcome 2 Scarring.

Comparison 104 PDT (weekly for 4 weeks) versus placebo (twice a day for 4 weeks), Outcome 3 Microbiological cure of skin lesions.

Comparison 105 Mesotherapy gun (0.5 mL of MA weekly) versus ILMA (0.1 mL weekly) for up to 6 weeks, Outcome 1 Participants complete cure.
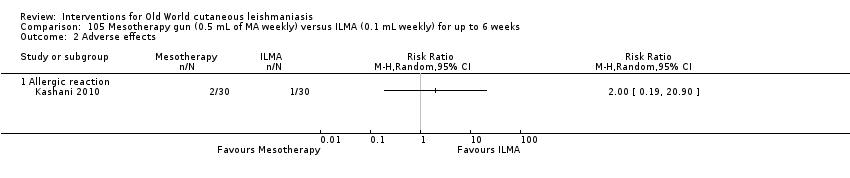
Comparison 105 Mesotherapy gun (0.5 mL of MA weekly) versus ILMA (0.1 mL weekly) for up to 6 weeks, Outcome 2 Adverse effects.

Comparison 105 Mesotherapy gun (0.5 mL of MA weekly) versus ILMA (0.1 mL weekly) for up to 6 weeks, Outcome 3 Development of cell‐mediated immunity.

Comparison 106 Diminazene aceturate solution (weekly) versus cetrimide + chlorhexidine solution for 50 d, Outcome 1 Participants complete cure.
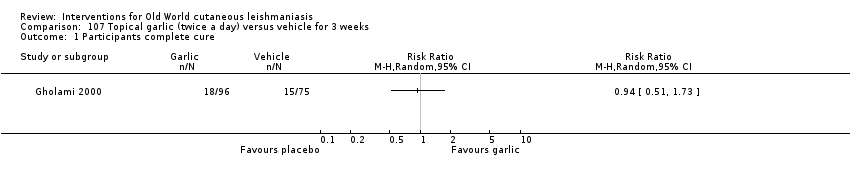
Comparison 107 Topical garlic (twice a day) versus vehicle for 3 weeks, Outcome 1 Participants complete cure.

Comparison 108 Topical herbal extract + placebo (5 d) versus IMMA (15‐20/mg/kg/d) + vehicle for 20 d, Outcome 1 Participants complete cure.
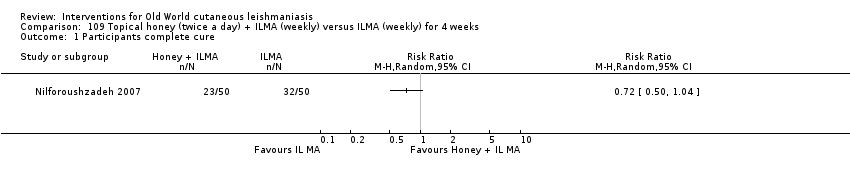
Comparison 109 Topical honey (twice a day) + ILMA (weekly) versus ILMA (weekly) for 4 weeks, Outcome 1 Participants complete cure.
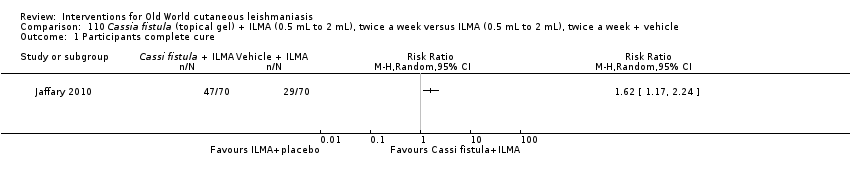
Comparison 110 Cassia fistula (topical gel) + ILMA (0.5 mL to 2 mL), twice a week versus ILMA (0.5 mL to 2 mL), twice a week + vehicle, Outcome 1 Participants complete cure.

Comparison 110 Cassia fistula (topical gel) + ILMA (0.5 mL to 2 mL), twice a week versus ILMA (0.5 mL to 2 mL), twice a week + vehicle, Outcome 2 Adverse effects.

Comparison 111 Cassia fistula boiled (topical) versus ILMA (0.5 mL to 2 mL), twice a week for 4 weeks, Outcome 1 Participants complete cure.

Comparison 111 Cassia fistula boiled (topical) versus ILMA (0.5 mL to 2 mL), twice a week for 4 weeks, Outcome 2 Speed of healing (weeks).

Comparison 111 Cassia fistula boiled (topical) versus ILMA (0.5 mL to 2 mL), twice a week for 4 weeks, Outcome 3 Adverse effects.
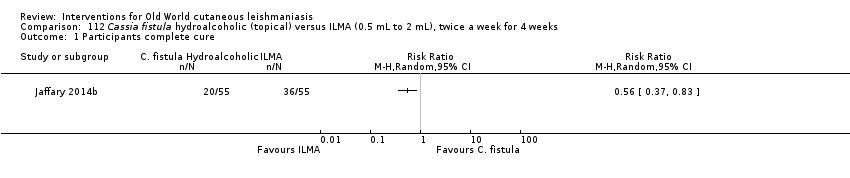
Comparison 112 Cassia fistula hydroalcoholic (topical) versus ILMA (0.5 mL to 2 mL), twice a week for 4 weeks, Outcome 1 Participants complete cure.

Comparison 112 Cassia fistula hydroalcoholic (topical) versus ILMA (0.5 mL to 2 mL), twice a week for 4 weeks, Outcome 2 Speed of healing (weeks).

Comparison 112 Cassia fistula hydroalcoholic (topical) versus ILMA (0.5 mL to 2 mL), twice a week for 4 weeks, Outcome 3 Adverse reaction.

Comparison 113 Cassia fistula boiled (topical) versusC fistula hydroalcoholic (topical) for 4 weeks, Outcome 1 Participants complete cure.
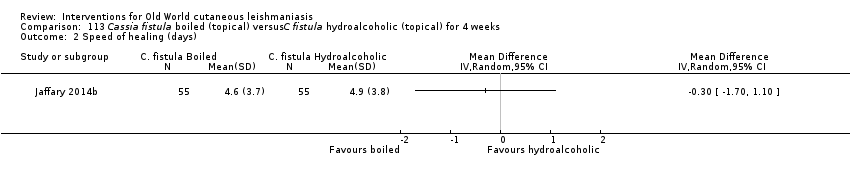
Comparison 113 Cassia fistula boiled (topical) versusC fistula hydroalcoholic (topical) for 4 weeks, Outcome 2 Speed of healing (days).

Comparison 113 Cassia fistula boiled (topical) versusC fistula hydroalcoholic (topical) for 4 weeks, Outcome 3 Adverse effects.
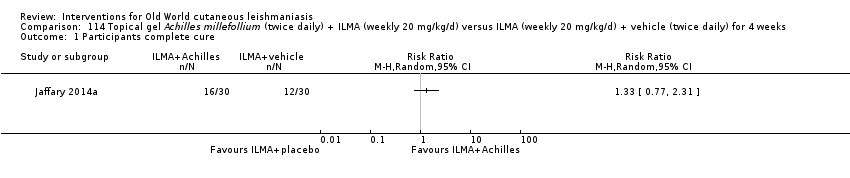
Comparison 114 Topical gel Achilles millefollium (twice daily) + ILMA (weekly 20 mg/kg/d) versus ILMA (weekly 20 mg/kg/d) + vehicle (twice daily) for 4 weeks, Outcome 1 Participants complete cure.

Comparison 114 Topical gel Achilles millefollium (twice daily) + ILMA (weekly 20 mg/kg/d) versus ILMA (weekly 20 mg/kg/d) + vehicle (twice daily) for 4 weeks, Outcome 2 Adverse effects.

Comparison 114 Topical gel Achilles millefollium (twice daily) + ILMA (weekly 20 mg/kg/d) versus ILMA (weekly 20 mg/kg/d) + vehicle (twice daily) for 4 weeks, Outcome 3 Microbiological cure of skin lesions.
| Itraconazole (200 mg for 6‐8 weeks) versus placebo for Old World cutaneous leishmaniasis | ||||||
| Patient or population: patients with Old World cutaneous leishmaniasis | ||||||
| Outcomes | Illustrative comparative risks* (95% CI) | Relative effect | No of participants | Certainty of the evidence | Comments | |
| Assumed risk | Corresponding risk | |||||
| Placebo | Itraconazole (200 mg for 6‐8 weeks) | |||||
| Percentage of lesions cured after the end of treatment | Not measured in this comparison | |||||
| Percentage of participants with complete cure | Study population | RR 3.70 | 244 | ⊕⊝⊝⊝ | — | |
| 454 per 1000 | 1000 per 1000 | |||||
| Moderate | ||||||
| 100 per 1000 | 370 per 1000 | |||||
| Adverse effects Mild abdominal pain and nausea Adverse effects Mild abnormal liver function | 40 per 1000 0 per 1000 | 95 per 1000 0 per 1000 | RR 2.36 RR 3.08 | 204 84 | ⊕⊝⊝⊝ ⊕⊝⊝⊝ | — |
| Speed of healing (time taken to be 'cured') | Neither of the studies reported speed of healing (time taken to be 'cured') in this comparison. | |||||
| Microbiological or histopathological cure of skin lesions | Not estimable | Not estimable | RR 17.00 | 20 | ⊕⊝⊝⊝ | There were zero events in the placebo group |
| *The basis for the assumed risk (e.g. the median control group risk across studies) is provided in footnotes. The corresponding risk (and its 95% confidence interval) is based on the assumed risk in the comparison group and the relative effect of the intervention (and its 95% CI). | ||||||
| GRADE Working Group grades of evidence | ||||||
| aDowngraded by 4 levels due to: risk of bias (2 RCTs have many uncertain items), inconsistency (there is considerable heterogeneity ‐ I² = 73%), and imprecision (2 levels due to wide 95% confidence intervals, crossing the line of no effect). | ||||||
| Paromomycin ointment versus matched vehicle for Old World cutaneous leishmaniasis | |||||
| Patient or population: patients with Old World cutaneous leishmaniasis | |||||
| Outcomes | Illustrative comparative risks* (95% CI) | Relative effect | No of participants | Certainty of the evidence | |
| Assumed risk | Corresponding risk | ||||
| Vehicle | Paromomycin ointment (15% + 10% urea) twice daily for 14 days | ||||
| Percentage of lesions cured after the end of treatment | Not measured in this comparison | ||||
| Percentage of participants with complete cure | Study population | RR 1.00 | 383 | ⊕⊝⊝⊝ | |
| 623 per 1000 | 623 per 1000 | ||||
| Moderate | |||||
| 619 per 1000 | 619 per 1000 | ||||
| Adverse effects Skin/local reactions | Study population | RR 1.42 | 713 | ⊕⊝⊝⊝ | |
| 96 per 1000 | 136 per 1000 | ||||
| Moderate | |||||
| 90 per 1000 | 128 per 1000 | ||||
| Speed of healing (time taken to be 'cured') | Not measured in this comparison | ||||
| Microbiological or histopathological cure of skin lesions | Study population | RR 1.03 | 383 | ⊕⊝⊝⊝ | |
| 859 per 1000 | 884 per 1000 | ||||
| Moderate | |||||
| 792 per 1000 | 816 per 1000 | ||||
| *The basis for the assumed risk (e.g. the median control group risk across studies) is provided in footnotes. The corresponding risk (and its 95% confidence interval) is based on the assumed risk in the comparison group and the relative effect of the intervention (and its 95% CI). | |||||
| GRADE Working Group grades of evidence | |||||
| aDowngraded by 4 levels due to risk of bias (1 RCT has many uncertain risks), indirectness (2 levels because one of the studies focused on young people), and imprecision (the confidence interval around the estimate risk ratio ranges from a 14% reduction to a 17% increase in the risk ratio for healing with paromomycin). | |||||
| Term | Definition |
| Antimonials | Pharmaceutical agents containing antimony. Antimony‐containing compounds (meglumine antimoniate and sodium stibogluconate) are the principal medications used to treat leishmaniases, an infection caused by a protozoan parasite. |
| Arthralgia | Pain in the joints. The causes of arthralgia are varied and range, from a joints perspective, from degenerative and destructive processes such as osteoarthritis and sports injuries to inflammation of tissues surrounding the joints, such as bursitis. |
| Cardiac arrhythmia | An arrhythmia is an abnormal heart rhythm. Many types of arrhythmia have no symptoms. When symptoms are present these may include palpitations or feeling a pause between heartbeats. More seriously there may be lightheadedness, passing out, shortness of breath, or chest pain. |
| Cutaneous necrosis | The death of living tissues in response to disease or injury. |
| Cytolysis | The degeneration or dissolution of cell caused by the disruption of cell membrane. |
| Exudate | A fluid with a high content of protein and cellular debris that has escaped from blood vessels and has been deposited in tissues or on tissue surfaces, usually as a result of inflammation. |
| Human monocytes | Monocytes are the biggest type of white blood cell in the immune system. Originally formed in the bone marrow, they are released into our blood and migrate into the connective tissue where they differentiate into macrophages. When certain germs enter the body, they quickly rush to the site of attack. |
| Hypotension | A systolic blood pressure reading (the top number) of 90 millimetres of mercury (mmHg) or less a diastolic blood pressure reading (the bottom number) of 60 mmHg or less is generally considered low blood pressure. The causes of low blood pressure can range from dehydration to serious medical or surgical disorders. |
| Immune response modifier | Any of a broad family of biomolecules that up‐ or down‐regulate, or restore immune responsiveness, which are generated after T cells recognise an antigen present on the surface of a self‐antigen‐presenting cell, which, once activated, produce multiple cytokines. |
| Immunolabeling | A biochemical process that enables the detection and localisation of an antigen to a particular site within a cell, tissue, or organ. Antigens are organic molecules, usually proteins, capable of binding to an antibody. These antigens can be visualised using a combination of antigen‐specific antibodies as well as a means of detection, called a tag, that is covalently linked to the antibody. If the immunolabeling process is meant to reveal information about a cell or its substructures, the process is called immunocytochemistry. Immunolabeling of larger structures is called immunohistochemistry. |
| In vitro | Biological processes or reactions made to occur outside the living organism in an artificial environment, such as a culture medium. |
| Intralesional meglumine antimoniate | Meglumine antimoniate (or Glucantime) is a medicine used for treating leishmaniasis. It belongs to a group of compounds known as the pentavalent antimonials. |
| Lymphadenopathies | Lymph nodes that have an abnormal in size, number or consistency; often used as a synonym for swollen or enlarged lymph nodes. Common causes of lymphadenopathy are infection, autoimmune disease, or malignancy. |
| Lymphatic channels | The vessels that transport lymph throughout the body. Lymph is a clear fluid that contains cells important for forming antibodies that fight infection. |
| Lymphokine | Any of various soluble protein mediators released by sensitised lymphocytes on contact with antigen, and believed to play a role in macrophage activation, lymphocyte transformation, and cell‐mediated immunity. They regulate immune responses through differentiation, amplification, and inhibition of cell functions. Lymphokines may also have a cytotoxic effector function. Used as biologic response modifiers in the treatment of cancer. |
| Macrophages | White blood cells (activated monocytes) that protect the body against infection and foreign substances by breaking them down into antigenic peptides recognised by circulating T cells. |
| Miltefosine | An oral alkyl phosphocholine analogue used to treat cutaneous and visceral leishmaniasis. Interacts with lipids and sterols in the Leishmania membrane resulting in inhibition of mitochondria and apoptotic cell death. |
| Mucous membranes | The mucous membranes (or mucosae or mucosas; singular mucosa) are linings of mostly endodermal origin, covered in epithelium, which are involved in absorption and secretion. They line cavities that are exposed to the external environment and internal organs. |
| Myalgia | Myalgia, or muscle pain, is a symptom of many diseases and disorders. The most common causes are the overuse or over‐stretching of a muscle or group of muscles. Myalgia without a traumatic history is often due to viral infections. Long‐term myalgias may be indicative of a metabolic myopathy, some nutritional deficiencies or chronic fatigue syndrome. |
| Nodular lymphangitis | Nodular lymphangitis is a distinct clinical entity, separate from lymphangitis. This disorder is characterised by inflammatory nodules along the lymphatics draining a primary skin infection |
| Papule | A solid, rounded growth that is elevated from the skin, usually inflammatory but nonsuppurative. A papule is usually less than 1 cm across. |
| Parenteral | Administration of a medicinal or therapeutic substance, other than through the gastrointestinal or respiratory tracts, e.g. by intravenous, intramuscular or subcuticular injection. |
| Pentamidine | Pentamidine (e.g. isethionate) is an antiprotozoal and antifungal agent of the class of aromatic diamidines, administered intravenously or intramuscularly in treatment of early African trypanosomiasis and leishmaniasis, and intravenously, intramuscularly, or by oral inhalation in treatment and prophylaxis of Pneumocystis carinii pneumonia. |
| Pentavalent antimony | Pentavalent antimonials are a group of compounds used for the treatment of leishmaniasis. The first pentavalent antimonial used was urea stibamine: first introduced in the 1930s, it fell out of favour in the 1950s due to higher toxicity compared to sodium stibogluconate. The compounds currently available for clinical use are: sodium stibogluconate (Pentostam; manufactured by GlaxoSmithKline; available in the USA and UK), which is administered by slow intravenous injection, intralesional or intramuscular injection, and meglumine antimoniate (Glucantime; manufactured by Aventis; available in Brazil, France and Italy), which is administered by intramuscular, intralesional, or intravenous injection. |
| Promastigotes | Term now generally used instead of 'leptomonad' or 'leptomonad stage' to avoid confusion with the flagellate genus Leptomonas. It denotes the flagellate stage of a trypanosomatid protozoan in which the flagellum arises from a kinetoplast in front of the nucleus and emerges from the anterior end of the organism; usually an extracellular phase, as in the insect intermediate host (or in culture) of Leishmania parasites. |
| Protozoan | Any of a group of single‐celled, usually microscopic, eukaryotic organisms, such as amoebas, ciliates, flagellates, and sporozoans. |
| ThermoMed device | The ThermoMed is a battery‐operated device that delivers precisely controlled localised current field radiofrequency heat to selectively destroy certain diseased tissue and is recommended by the World Health Organization as an alternative therapy for cutaneus leishmaniasis. |
| Thermotherapy | The treatment of disease by the application of heat. Thermotherapy may be administered as dry heat with heat lamps, diathermy machines, electric pads, or hot water bottles or as moist heat with warm compresses or immersion in warm water. Warm soaks or compresses may be used to treat local infections, relax muscles and relieve pain in patients with motor problems, and promote circulation in peripheral vascular disorders such as thrombophlebitis. |
| Drug | Doses |
| Systemic antimonials | |
| Sodium stibogluconate (Pentostam, Stibanate) Meglumine antimonate (Glucantime) Combined with pentoxifylline | 20 mgSb v+/kg/d intramuscularly or intravenously for 20‐30 days 400 mg orally 3 times a day for 10–20 days |
| Intralesional antimonials | |
| Sodium stibogluconate (Pentostam, Stibanate) Meglumine antimonate (Glucantime) | 1–5 mL per session every 3–7 days. Up to 10 sessions depending on the clinical response, but most patients require ≤ 5 sessions |
| Non‐antimonial systemic treatments | |
| Fluconazole | 200 mg orally daily for 6 weeks |
| Miltefosine | 50 mg orally three times daily for 28 days |
| Liposomal amphotericin B | 3 mg/kg/d IV on days 1‐5 and 10 (18 mg/kg total dose) |
| Non‐antimonial topical or intralesional therapies | |
| 15% paromomycin/12% methylbenzethonium chloride | Ointment twice daily for 10‐20 days |
| 15% paromomycin/0.5% gentamicin sulphate | Twice a day for 20 days |
| Physical therapies | |
| Cryotherapy with liquid nitrogen | Frozen for 10‐30 s and thaw applied locally 2‐3 times in each session, repeated every 1‐4 weeks to complete healing (usually 2‐4 sessions) |
| Local heat therapy | 50°‐55ºC for 30 s by: Infrared light Direct current electrical stimulation Ultrasound Laser Radiofrequency waves ThermoMed device |
| Study | Method of assessment | Timing | Interventions | Adverse effects |
| Quote: "Biochemical tests were done to detect any toxic effects of the drug." | Biochemical tests were done at the end of 1 week, 2 weeks and 4 weeks post‐ treatment. | I1: oral rifampicin 1200 mg/d I2: placebo | Intervention 23 participants evaluated for AEs. Quote: "The drug was well‐tolerated and no side‐effects were seen in any participant." Placebo 23 participants evaluated for AEs. Not reported | |
| Quote: "clinical examination, liver function tests, renal function tests" | Quote: "Before, during, and after completion of treatment" | I1: oral rifampicin 10 mg/kg/d I2: placebo | Intervention 46 participants evaluated for AEs. Elevation liver enzymes: 1 (2%) Placebo 16 participants evaluated for AEs. Not reported | |
| Haemoglobin, leukocyte count, and liver test | Biochemical tests were done at the end of 2 week, 4 weeks and 6 weeks post‐treatment | I1: oral rifampicin + omeprazole I2: placebo | Intervention 1 23 participants evaluated for AEs. Intervention 2 21 participants evaluated for AEs. Quote: "All participants tolerated the drug and placebo very well and no side effect was reported." | |
| Not described | Azythromycin group: monthly up to 4 months | I1: azithromycin 500 mg/d I2: IMMA 60 mg/kg/d | Intervention 1 22 participants evaluated for AEs (35 lesions). Nausea and vomiting: 2 (9%) Intervention 2 27 participants evaluated for AEs (58 lesions). Myalgia: 3 (11%); Erythema: 1 (3.7%). | |
| Quote: "Complete haemogram, including haemoglobin and liver and renal function tests Participants were questioned about expected adverse effects for 3 days (Days 5–7) following administration of the doses." | Haemogram: 1 and 2 months Clinical AEs: days 5‐7; 19‐21; 33‐35; 47‐19. | I1: artesunate I2: placebo | Intervention 1 20 participants evaluated for AEs. Placebo 21 participants evaluated for AEs. Skin rash with itching: 1 (4.7%) Quote: "There was no significant difference in biological tests (liver and renal function tests) in all the participants before and after treatment." | |
| Interview, physical examination, laboratory test, evaluation for pain, standardised questionnaire for the occurrence of systemic side effects (e.g. vertigo, tinnitus). Diminished hearing was verified with audiometer. Laboratory test. | Quote: "Investigators observed each participant each day that the topical creams were administered and at follow‐up study visits (days 50‐100‐180). Clinical and laboratory evidence of side effects was determined on D10 and D20." | I1: WR 279,396 I2: placebo | Intervention 50 participants evaluated for AEs. Erythema at the site of application: 15 (30%); mild pain within 30 minutes of application: 7 (14 %); mild increases and decreases in hearing acuity from baseline: 14 (28%); change hearing acuity: 14 (28%); vertigo: 0 (0%); Increase serum creatinine: 0 (0%); Death: 0 (0%) Placebo 42 participants evaluated for AEs. Erythema at the site of application: 10 (24%); mild pain within 30 minutes of application: 6 (14 %); mild increases and decreases in hearing acuity from baseline: 9 (21%); change hearing acuity: 9 (21%); vertigo: 0 (0%); increase serum creatinine: 0 (0%); death: 0 (0%) | |
| Quote: "Participants were interviewed and underwent laboratory tests three times" | Quote: "In Allopurinol group, the participants which were visited and received medication underwent laboratory tests three times (before, one month a2fter, and end of the treatment) | I1: azithromycin + allopurinol I2: IMMA | Intervention 1 36 participants evaluated for AEs. Gastrointestinal complaints and headache severe: 1 (2.7%); slight gastrointestinal complications (nausea, heartburn, and epigastric pain): 3 (8.3%) Intervention 2 35 participants evaluated for AEs. Myalgia: 2 (5.7%) | |
| AE: adverse effect; IMMA: intramuscular meglumine antimoniate. | ||||
| Study | Method of assessment | Timing | Interventions | Adverse effects |
| Clinical evaluation and laboratory tests | Days 15, 45 and 105 | I1: paromomycin I2: placebo | 126 participants evaluated for AEs. During treatment: oedema, local pain, vesiculation: 1 (0.7%) After treatment: redness, pain, vesiculation, and inflammation: 8 (6.3%) Quote: "There were no significant differences in four laboratory test results of safety (SGOT, BUN, Hb, and WBC) between the groups either before or after treatment." | |
| Clinical evaluation, physical examination, advice to participants, laboratory test: liver function, haemoglobin and white blood cell count | Days 15, 45 and 105 | I1: paromomycin I2: placebo | 57 participants evaluated for AEs. Quote: "A local reaction (inflammation, vesication, pain and/or red ness) was recorded for 12 participants, with no significant difference between the 2 groups." Laboratory test changes: 0 (0%) | |
| Not described | At the end of treatment (day 30) and 1 month post‐treatment | I1: paromomycin + MBCL I2: oral ketoconazole | 40 participants (62 lesions) evaluated for AEs Quote: "Treatment‐related adverse effects were only observed in the paromomycin group. The most common side‐effect was the development of irritant contact dermatitis. No subjects withdrew because of this adverse effect." | |
| Clinical evaluation | Days 15, 29, 45 and 105 | I1: paromomycin I2: placebo | 108 participants evaluated for AEs. Quote: "Treatment was well tolerated, and no adverse reactions to the ointment were observed or reported in either group." | |
| Not described | Quote "Clinical evaluation and follow‐up were performed fortnightly until 1 month post treatment and then monthly until 3 months post treatment, and finally every 3 months until 1 year post treatment" | I1: paromomycin + urea I2: ILMA weekly | Not described | |
| Not described | Week 1 and week 6 post‐treatment and at 6 months after treatment was completed | I1: paromomycin + urea I2: ILMA weekly | 30 participants evaluated for AEs. Cutaneous reactions (erythematosus, urticaria or lymphadenitis with pain): 1 (3%) Quote: "No systemic toxic reaction attributable to the drug was observed." | |
| Clinical evaluation | Days 7, 14, 21 and 30 | I1: paromomycin I2: placebo | 30 participants evaluated for AEs. Mild contact dermatitis: 3 (10%) | |
| Not described | Weekly during treatment and monthly for up 2 months | I1: photodynamic therapy I2: paromomycin I3: placebo | 19 participants (34 lesions) evaluated for AEs. Quote: "Adverse side‐effects seen in some participants in all groups were pruritus, burning, redness, discharge, oedema, and pain, but all were generally mild and tolerable." | |
| Quote: "Renal toxic effects and ototoxic effects from aminoglycoside exposure were ascertained by means of serum creatinine measurements at the end of therapy (at 20 days) and participants' daily reports of tinnitus and vertigo." | Quote: "Safety end points were assessed daily during therapy (20 days)." | I1:Paromomycin ‐Gentamicin I2: paromomycin Alone I3: vehicle Control | Intervention 1: 125 participants evaluated for AEs. Erythema: 6 (5%); local infection: 0 (0%); inflammation: 0 (0%); vesicles mild‐moderate: 31 (25%); mild oedema: 2 (2%); pain: 2 (2%); mild bronchitis: 5 (4%); paronychia: 2 (2%); superinfection: 3 (2%); upper respiratory tract infection: 0 (0%); oropharyngeal pain: 4 (3%); skin irritation: 3 (2%); tinnitus: 0 (0%); vertigo: 0 (0%); creatinine serum changes: 0 (0%) Intervention 2: 125 participants evaluated for AEs. Erythema: 7 (6%); local infection: 0 (0%); inflammation: 0 (0%); vesicles mild‐moderate: 32 (26%); mild‐moderate oedema: 3 (3%); pain: 2 (2%); bronchitis mild‐moderate: 3 (3%); paronychia: 0 (0%); superinfection: 0 (0%); upper respiratory tract infection: 2 (2%); oropharyngeal pain: 3 (2%); skin irritation: 9 (7%); tinnitus: 0 (0%); vertigo: 0 (0%); creatinine serum changes: 0 (0%) | |
| AE: adverse effect; BUN: blood urea nitrogen; Hb: haemoglobin; ILMA: intralesional meglumine antimoniate; SGOT: serum glutamic‐oxaloacetic transaminase; WBC: white blood cells. | ||||
| Study | Method of assessment | Timing | Interventions | Adverse effects |
| Not described | Quote: "Participants were seen at 10‐15 day intervals after injection, and at 6 weeks post treatment" | I1: IL 2% zinc sulphate I2: IL 7% sodium chloride I3: ILSSG 2‐5 mL per lesion | 19 participants evaluated for AEs. Quote: "Apart from pain at the time of injection, no appreciable side‐effect was noted." | |
| Not described | Not described | I1: IL zinc sulphate I2: ILMA weekly | 31 participants evaluated for AEs. Severe pain caused vasovagal shock: 2 (6.4%) | |
| Not described | Not described | I1: IL zinc sulphate I2: ILMA weekly | 36 participants evaluated for AEs. Pain: 13 (36.1%); burning at site injection: 3 (8.4%); itching: 3 (8.4%); inflammation: 7 (19.4%) | |
| Not described | 14, 28, 42, and 56 days after starting the treatment | I1: IL 2% zinc sulphate I2: ILMA weekly | 24 participants evaluated for AEs. Quote: "The side effects seen in both groups were pain after injection and hyperpigmentation." Burning after injection and necrosis of the lesions: 24 (100%); inflammation and swelling: 3 (12.5%) | |
| AE: adverse effect; IL: intralesional; ILMA: intralesional meglumine antimoniate; ILSSG: intralesional sodium stibogluconate. | ||||
| Study | Method of assessment | Timing | Interventions | Adverse effects |
| Not described | Quote: "Participants were seen at 10‐15 day intervals after injection, and at 6 week post treatment" | I1: IL 2% zinc sulphate I2: IL 7% HSCS I3: ILSSG 2‐5 mL per lesion | 17 participants evaluated for AEs. Quote: "No side‐effect other than pain at the time of injection was noted." | |
| Not described | Not described | I1: IL 5% HSCS I2: ILMA 0.5‐1 mL/week | 36 participants evaluated for AEs. Allergic reaction (erythema, oedema, and pruritus): 0 (0%); sporotrichoid dissemination: 3 (8.3%) | |
| Not described | Quote: "Participants were seen weekly for the first three injections; fortnightly for the fourth and fifth injections; then monthly until cure. Participants were followed‐up every 3 months after cure for 18 months to assess recurrences and evidence of visceralization." | I1: ILSSG I2: IL 7% HSCS | 67 participants evaluated for AEs. Leishmaniasis recidivans: 0 (0%) Quote: "There were no systemic side effects with SSG or HS. Pain during injection was the only local side effect noted with both therapies. After healing, scarring was minimal, but postinflammatory hyperpigmentation was observed in all participants for both treatments, which faded out over 6–8 months." | |
| AE: adverse effect; IL: intralesional; ILSSG: intralesional sodium stibogluconate; HSCS: hypertonic sodium chloride solution. | ||||
| Study | Method of assessment | Timing | Interventions | Adverse effects |
| Not described | 1, 3, 4, 8, 12 and 24 weeks after treatment | I1: CO₂ I2: IMMA 50 mg/kg/d | 123 participants evaluated for AEs. Quote: "Complications were seen in (4) 4.5% of participants and included hyperpigmentation, persistent redness." Hypertonic scars: 5 (4%) | |
| Quote: "Follow‐up was performed and any side‐effects were recorded." | Quote: "Follow‐up evaluation was performed by clinical assessment of treated lesions at weeks 2, 6, 12 and 16." | I1: CO₂ I2: cryotherapy + MA | 80 participants (95 lesions) evaluated for AEs. Hyperpigmentation + trivial scar: 20 (25%); atrophic scar: 7 (8.75%); hypertrophic scar: 1 (1.25%); sporotrichoid: 1 (1.25%); raised papular lesions: 1 (1.25%); persistent erythema: 3 (3.75%); hypopigmentation + trivial scar: 4 (5%) | |
| Not described | Quote: "Participants were followed in the first, third, and sixth months after treatment with the final evaluation in the sixth month." | I1: ablative CO₂ laser I2: fractional CO₂ laser | Intervention 1: 30 participants evaluated for AEs. Erythema: 2 (6.7%) Intervention 2: 30 participants evaluated for AEs. Erythema: 4 (13.3%) | |
| AE: adverse effect; IMMA: intramuscular meglumine antimoniate; MA: meglumine antimoniate. | ||||
| Study | Method of assessment | Timing | Interventions | Adverse effects |
| Not described | Fortnightly until 6 months post‐treatment and 2 weeks and 4 weeks post‐treatment | I1: cryotherapy + ILMA I2: cryotherapy alone I3: ILMA alone | Intervention 1: 100 participants evaluated for AEs. Postinflammatory hypopigmentation: 5 (5%) Intervention 2: 200 participants evaluated for AEs. Postinflammatory hypopigmentation: 10 (5%) | |
| Not described | Not described | I1: ILMA alone I2: cryotherapy alone I3: cryotherapy + ILMA | Intervention 2: 20 participants evaluated for AEs. Erythema and oedema of the lesions and perilesional area: (28%) Intervention 3: 20 participants evaluated for AEs. Erythema and oedema of the lesions and perilesional area: (33%) Quote: "There were no serious side‐effects in any of the treatment groups" | |
| Not described | Quote: "Weekly for up to six weeks of treatment and six months after." | I1: cryotherapy I2: ILMA | 36 participants evaluated for AEs. Hypopigmentation: 2 (5.5%); hyperpigmentation: 7 (19.4%). Quote: "the most common adverse reactions were erythema and oedema of the treated site, which appeared during the initial hours of treatment, and blistering of the treatment site, which became evident 1–2 days after treatment and responded well to local treatment." | |
| Quote: "Follow‐up was performed and any side‐effects were recorded." | Quote: "Follow‐up evaluation was performed by clinical assessment of treated lesions at weeks 2, 6, 12 and 16." | I1: CO₂ I2: cryotherapy + MA | 80 participants (95 lesions) evaluated for AEs. Hyperpigmentation + trivial scar: 15 (18.7%); atrophic scar: 6 (7.5%); hypertrophic scar: 0 (0%); sporotrichoid: 0 (0%); raised papular lesions: 0 (0%); persistent erythema: 0 (0%); hypopigmentation + trivial scar: 15 (18.8%) | |
| Quote: "During these visits the healing process of the ulcer, change of diameter and induration of lesions and complications were assessed." | Quote: "The participants were evaluated every 2 weeks up to 12 weeks." | I1: cryotherapy + 3% salicylic + 3% sodium nitrite I2: cryotherapy + 3% salicylic + placebo | Intervention 1: 36 participants evaluated for AEs. Erythema, a burning sensation and skin irritation: 7 (19.4%) Intervention 2: 27 participants evaluated for AEs. Erythema, a burning sensation and skin irritation: 1 (3.7%) | |
| AE: adverse effect; ILMA: intralesional meglumine antimoniate; MA: meglumine antimoniate. | ||||
| Study | Method of assessment | Timing | Interventions | Adverse effects |
| Quote: "The occurrence of adverse effects was evaluated blindly by means of participant interviews and physical examinations." | Quote: "The occurrence of adverse effects was evaluated … during follow‐up visits." | I1: ILSSG 2‐5 mL per lesion I2: IMSSG 20 mg/kg I3: thermotherapy | 138‐108 participants evaluated for AEs. Secondary infections: 8 (5.7%). Quote: "The original CL ulcer often increased in size immediately after and up to 2 weeks after treatment." | |
| Quote: "Appearance of lesions at subsequent follow‐up visits and occurrence of unwanted side‐effects were also recorded on the form." | Weekly 4 weeks and monthly up to 6 months | I1: thermotherapy I2: ILMA weekly | 57 participants (83 lesions) evaluated for AEs. Satellite lesions: 1 (1.7%) | |
| Quote: "Interview, physical examination, laboratory testing (complete blood count, creatine phosphokinase, amylase, lipase, complete metabolic profile), and electrocardiograms." | Quote: "Daily for the first 10 days and follow‐up at 2, 6, and 12–24 months post treatment" | I1: thermotherapy I2: ILSSG | 27 participants evaluated for AEs. Serious AE: 4 (15%); ECG changes: 10 (37%); abdominal discomfort: 1 (4%); wound infection: 5 (19%); musculoskeletal: 5 (19%); headache: 3 (11%); fatigue: 5 (19%); rash: 1 (4%); blister reaction: 25 (93%); erythema: 7 (26%); oozing: 21 (78%) | |
| Quote: "The occurrences of adverse effects were evaluated by means of participant interviews and physical examinations during follow‐up visits." | Quote: "During treatment, all participants were then followed for four visits at weekly intervals … After initial treatment, all participants were scheduled for four subsequent follow‐up visits: 10 days after baseline and 1‐month, 2 months and 6 months after treatment." | I1: thermotherapy I2: ILMA weekly | 189 participants evaluated for AEs Not reported | |
| Not described | Not described | I1: radiofrequency heat treatment I2: ILSSG | Quote: "RFHT was cosmetically acceptable because it was associated with less scarring and hyperpigmentation compared with intralesional SSG injections." | |
| Quote: "In case of clinical signs for a superinfection, a smear was taken, Gram stained and microscopically evaluated for the presence of bacteria and/or fungi." | Quote: "Adverse events such as bacterial or fungal superinfections of the wounds, the formation or scars and the rate of re‐ulcerations were monitored during the treatment and follow‐up period." | I1: electrocauterisation + DAC N‐055. I2: electrocauterisation + placebo. | Intervention 1: 38 participants evaluated for AEs. Bacterial and fungal superinfections: 3 (8.0%); Keloïd formation: 2 (5%) Intervention 2: 32 participants evaluated for AEs. Bacterial and fungal superinfections: 3 (9.0%); Keloïd formation: 2 (6%) | |
| AE: adverse effect; CL: cutaneous leishmaniasis; ILMA: intralesional meglumine antimoniate; ILSSG: intralesional sodium stibogluconate; IMSSG: intramuscular sodium stibogluconate. | ||||
| Outcome or subgroup title | No. of studies | No. of participants | Statistical method | Effect size |
| 1 Lesions cured Show forest plot | 1 | Risk Ratio (M‐H, Random, 95% CI) | Totals not selected | |
| Outcome or subgroup title | No. of studies | No. of participants | Statistical method | Effect size |
| 1 Lesions cured Show forest plot | 1 | Risk Ratio (M‐H, Random, 95% CI) | Totals not selected | |
| Outcome or subgroup title | No. of studies | No. of participants | Statistical method | Effect size |
| 1 Lesions cured Show forest plot | 1 | Risk Ratio (M‐H, Random, 95% CI) | Totals not selected | |
| Outcome or subgroup title | No. of studies | No. of participants | Statistical method | Effect size |
| 1 Lesions cured Show forest plot | 1 | Risk Ratio (M‐H, Random, 95% CI) | Totals not selected | |
| Outcome or subgroup title | No. of studies | No. of participants | Statistical method | Effect size |
| 1 Lesions cured Show forest plot | 1 | Risk Ratio (M‐H, Random, 95% CI) | Totals not selected | |
| Outcome or subgroup title | No. of studies | No. of participants | Statistical method | Effect size |
| 1 Participants complete cure Show forest plot | 2 | 148 | Risk Ratio (M‐H, Random, 95% CI) | 0.83 [0.71, 0.96] |
| 2 Adverse effects Show forest plot | 1 | Risk Ratio (M‐H, Random, 95% CI) | Totals not selected | |
| 2.1 Serious adverse effects | 1 | Risk Ratio (M‐H, Random, 95% CI) | 0.0 [0.0, 0.0] | |
| 2.2 Skin reaction | 1 | Risk Ratio (M‐H, Random, 95% CI) | 0.0 [0.0, 0.0] | |
| 2.3 Cardiac toxicity 'QT prolongation' | 1 | Risk Ratio (M‐H, Random, 95% CI) | 0.0 [0.0, 0.0] | |
| Outcome or subgroup title | No. of studies | No. of participants | Statistical method | Effect size |
| 1 Participants complete cure Show forest plot | 1 | Risk Ratio (M‐H, Random, 95% CI) | Totals not selected | |
| Outcome or subgroup title | No. of studies | No. of participants | Statistical method | Effect size |
| 1 Participants complete cure Show forest plot | 1 | Risk Ratio (M‐H, Random, 95% CI) | Totals not selected | |
| Outcome or subgroup title | No. of studies | No. of participants | Statistical method | Effect size |
| 1 Participants complete cure Show forest plot | 1 | Risk Ratio (M‐H, Random, 95% CI) | Totals not selected | |
| Outcome or subgroup title | No. of studies | No. of participants | Statistical method | Effect size |
| 1 Lesions cured Show forest plot | 1 | Risk Ratio (M‐H, Random, 95% CI) | Totals not selected | |
| 2 Adverse effects (itching and burning) Show forest plot | 1 | Risk Ratio (M‐H, Random, 95% CI) | Totals not selected | |
| 3 Adverse effects (oedema) Show forest plot | 1 | Risk Ratio (M‐H, Random, 95% CI) | Totals not selected | |
| Outcome or subgroup title | No. of studies | No. of participants | Statistical method | Effect size |
| 1 Participants complete cure Show forest plot | 1 | Risk Ratio (M‐H, Random, 95% CI) | Totals not selected | |
| Outcome or subgroup title | No. of studies | No. of participants | Statistical method | Effect size |
| 1 Lesions cured Show forest plot | 1 | Risk Ratio (M‐H, Random, 95% CI) | Totals not selected | |
| Outcome or subgroup title | No. of studies | No. of participants | Statistical method | Effect size |
| 1 Participants complete cure Show forest plot | 1 | Risk Ratio (M‐H, Random, 95% CI) | Totals not selected | |
| 2 Adverse effects (mild heart symptoms) Show forest plot | 1 | Risk Ratio (M‐H, Random, 95% CI) | Totals not selected | |
| Outcome or subgroup title | No. of studies | No. of participants | Statistical method | Effect size |
| 1 Participants complete cure Show forest plot | 1 | Risk Ratio (M‐H, Random, 95% CI) | Totals not selected | |
| 2 Adverse effects (nausea and vomiting) Show forest plot | 1 | Risk Ratio (M‐H, Random, 95% CI) | Totals not selected | |
| Outcome or subgroup title | No. of studies | No. of participants | Statistical method | Effect size |
| 1 Participants cured Show forest plot | 1 | Risk Ratio (M‐H, Random, 95% CI) | Totals not selected | |
| 2 Adverse effect (liver enzymes increase) Show forest plot | 1 | Risk Ratio (M‐H, Random, 95% CI) | Totals not selected | |
| Outcome or subgroup title | No. of studies | No. of participants | Statistical method | Effect size |
| 1 Lesions cured Show forest plot | 1 | Risk Ratio (M‐H, Random, 95% CI) | Totals not selected | |
| Outcome or subgroup title | No. of studies | No. of participants | Statistical method | Effect size |
| 1 Lesions cured Show forest plot | 1 | Risk Ratio (M‐H, Random, 95% CI) | Totals not selected | |
| Outcome or subgroup title | No. of studies | No. of participants | Statistical method | Effect size |
| 1 Participants complete cure Show forest plot | 1 | Risk Ratio (M‐H, Random, 99% CI) | Totals not selected | |
| Outcome or subgroup title | No. of studies | No. of participants | Statistical method | Effect size |
| 1 Participants complete cure Show forest plot | 1 | Risk Ratio (M‐H, Random, 99% CI) | Totals not selected | |
| Outcome or subgroup title | No. of studies | No. of participants | Statistical method | Effect size |
| 1 Participants complete cure Show forest plot | 3 | 244 | Risk Ratio (M‐H, Random, 99% CI) | 3.70 [0.35, 38.99] |
| 2 Adverse effects Show forest plot | 5 | Risk Ratio (M‐H, Random, 95% CI) | Subtotals only | |
| 2.1 Mild abdominal pain and nausea | 3 | 204 | Risk Ratio (M‐H, Random, 95% CI) | 2.36 [0.74, 7.47] |
| 2.2 Mild abnormal liver function | 3 | 84 | Risk Ratio (M‐H, Random, 95% CI) | 3.08 [0.53, 17.98] |
| 2.3 Headache and dizziness | 1 | 20 | Risk Ratio (M‐H, Random, 95% CI) | 2.63 [0.16, 43.63] |
| 3 Microbiological cure of skin lesions Show forest plot | 1 | Risk Ratio (M‐H, Random, 99% CI) | Totals not selected | |
| Outcome or subgroup title | No. of studies | No. of participants | Statistical method | Effect size |
| 1 Participants complete cure Show forest plot | 1 | Risk Ratio (M‐H, Random, 99% CI) | Totals not selected | |
| 2 Adverse effects (headache and dizziness) Show forest plot | 1 | Risk Ratio (M‐H, Random, 95% CI) | Totals not selected | |
| 3 Microbiological cure of skin lesions Show forest plot | 1 | Risk Ratio (M‐H, Random, 95% CI) | Totals not selected | |
| Outcome or subgroup title | No. of studies | No. of participants | Statistical method | Effect size |
| 1 Lesions cured Show forest plot | 1 | Risk Ratio (M‐H, Random, 95% CI) | Totals not selected | |
| 2 Participants complete cure Show forest plot | 1 | Risk Ratio (M‐H, Random, 95% CI) | Totals not selected | |
| Outcome or subgroup title | No. of studies | No. of participants | Statistical method | Effect size |
| 1 Participants complete cure Show forest plot | 1 | Risk Ratio (M‐H, Random, 95% CI) | Totals not selected | |
| 2 Adverse effects Show forest plot | 1 | Risk Ratio (M‐H, Random, 95% CI) | Totals not selected | |
| 2.1 Rise creatinine and liver enzymes | 1 | Risk Ratio (M‐H, Random, 95% CI) | 0.0 [0.0, 0.0] | |
| 2.2 Cheilitis | 1 | Risk Ratio (M‐H, Random, 95% CI) | 0.0 [0.0, 0.0] | |
| 2.3 Nausea | 1 | Risk Ratio (M‐H, Random, 95% CI) | 0.0 [0.0, 0.0] | |
| Outcome or subgroup title | No. of studies | No. of participants | Statistical method | Effect size |
| 1 Participants complete Cure Show forest plot | 2 | 160 | Risk Ratio (M‐H, Random, 95% CI) | 24.08 [1.44, 403.43] |
| 2 Adverse effects Show forest plot | 2 | Risk Ratio (M‐H, Random, 95% CI) | Subtotals only | |
| 2.1 Nausea | 2 | 160 | Risk Ratio (M‐H, Random, 95% CI) | 21.86 [3.04, 157.29] |
| Outcome or subgroup title | No. of studies | No. of participants | Statistical method | Effect size |
| 1 Lesions cured Show forest plot | 1 | 100 | Risk Ratio (M‐H, Random, 95% CI) | 3.83 [1.71, 8.60] |
| Outcome or subgroup title | No. of studies | No. of participants | Statistical method | Effect size |
| 1 Lesions cured Show forest plot | 1 | 100 | Risk Ratio (M‐H, Random, 95% CI) | 1.92 [1.08, 3.41] |
| Outcome or subgroup title | No. of studies | No. of participants | Statistical method | Effect size |
| 1 Lesions Cured Show forest plot | 1 | 100 | Risk Ratio (M‐H, Random, 95% CI) | 0.75 [0.35, 1.62] |
| Outcome or subgroup title | No. of studies | No. of participants | Statistical method | Effect size |
| 1 Lesions cured Show forest plot | 1 | Risk Ratio (M‐H, Random, 95% CI) | Totals not selected | |
| 2 Adverse effects Show forest plot | 1 | Risk Ratio (M‐H, Random, 95% CI) | Totals not selected | |
| 2.1 Mild abdominal pain | 1 | Risk Ratio (M‐H, Random, 95% CI) | 0.0 [0.0, 0.0] | |
| 2.2 Skin eruption | 1 | Risk Ratio (M‐H, Random, 95% CI) | 0.0 [0.0, 0.0] | |
| 2.3 Muscle pain and weakness | 1 | Risk Ratio (M‐H, Random, 95% CI) | 0.0 [0.0, 0.0] | |
| 3 Microbiological cure of skin lesions Show forest plot | 1 | 72 | Risk Ratio (M‐H, Random, 95% CI) | 1.11 [0.88, 1.41] |
| Outcome or subgroup title | No. of studies | No. of participants | Statistical method | Effect size |
| 1 Adverse effects Show forest plot | 1 | Risk Ratio (M‐H, Random, 95% CI) | Totals not selected | |
| 1.1 Secondary infection | 1 | Risk Ratio (M‐H, Random, 95% CI) | 0.0 [0.0, 0.0] | |
| 1.2 Myalgia | 1 | Risk Ratio (M‐H, Random, 95% CI) | 0.0 [0.0, 0.0] | |
| 1.3 ECG changes | 1 | Risk Ratio (M‐H, Random, 95% CI) | 0.0 [0.0, 0.0] | |
| 1.4 Chest pain | 1 | Risk Ratio (M‐H, Random, 95% CI) | 0.0 [0.0, 0.0] | |
| 1.5 Pain injection site | 1 | Risk Ratio (M‐H, Random, 95% CI) | 0.0 [0.0, 0.0] | |
| 1.6 Abscess | 1 | Risk Ratio (M‐H, Random, 95% CI) | 0.0 [0.0, 0.0] | |
| Outcome or subgroup title | No. of studies | No. of participants | Statistical method | Effect size |
| 1 Participants complete cured Show forest plot | 1 | Risk Ratio (M‐H, Random, 95% CI) | Totals not selected | |
| 2 Adverse effects Show forest plot | 1 | Risk Ratio (M‐H, Random, 95% CI) | Totals not selected | |
| 2.1 Abdominal symptoms | 1 | Risk Ratio (M‐H, Random, 95% CI) | 0.0 [0.0, 0.0] | |
| 2.2 Liver abnormalities | 1 | Risk Ratio (M‐H, Random, 95% CI) | 0.0 [0.0, 0.0] | |
| 2.3 Myalgia | 1 | Risk Ratio (M‐H, Random, 95% CI) | 0.0 [0.0, 0.0] | |
| 2.4 Rash | 1 | Risk Ratio (M‐H, Random, 95% CI) | 0.0 [0.0, 0.0] | |
| Outcome or subgroup title | No. of studies | No. of participants | Statistical method | Effect size |
| 1 Participants complete cure Show forest plot | 2 | Risk Ratio (M‐H, Random, 95% CI) | Totals not selected | |
| 1.1 Evaluated 3 months after treatment | 1 | Risk Ratio (M‐H, Random, 95% CI) | 0.0 [0.0, 0.0] | |
| 1.2 Evaluated after treatment | 1 | Risk Ratio (M‐H, Random, 95% CI) | 0.0 [0.0, 0.0] | |
| 2 Microbiological cure of skin lesions Show forest plot | 1 | Risk Ratio (M‐H, Random, 95% CI) | Totals not selected | |
| Outcome or subgroup title | No. of studies | No. of participants | Statistical method | Effect size |
| 1 Participants complete cure Show forest plot | 1 | Risk Ratio (M‐H, Random, 95% CI) | Totals not selected | |
| Outcome or subgroup title | No. of studies | No. of participants | Statistical method | Effect size |
| 1 Lesions cured Show forest plot | 1 | Risk Ratio (M‐H, Random, 95% CI) | Totals not selected | |
| 2 Adverse effects Show forest plot | 1 | Risk Ratio (M‐H, Random, 95% CI) | Totals not selected | |
| 2.1 Nausea and vomiting | 1 | Risk Ratio (M‐H, Random, 95% CI) | 0.0 [0.0, 0.0] | |
| Outcome or subgroup title | No. of studies | No. of participants | Statistical method | Effect size |
| 1 Participants complete cure Show forest plot | 1 | Risk Ratio (M‐H, Random, 95% CI) | Totals not selected | |
| 2 Adverse effects Show forest plot | 1 | Risk Ratio (M‐H, Random, 95% CI) | Totals not selected | |
| 2.1 Gastrointestinal complaints and headache | 1 | Risk Ratio (M‐H, Random, 95% CI) | 0.0 [0.0, 0.0] | |
| 2.2 Gastrointestinal complications | 1 | Risk Ratio (M‐H, Random, 95% CI) | 0.0 [0.0, 0.0] | |
| 2.3 Myalgia | 1 | Risk Ratio (M‐H, Random, 95% CI) | 0.0 [0.0, 0.0] | |
| Outcome or subgroup title | No. of studies | No. of participants | Statistical method | Effect size |
| 1 Participants complete cure Show forest plot | 1 | Risk Ratio (M‐H, Random, 95% CI) | Totals not selected | |
| 2 Adverse effects Show forest plot | 1 | Risk Ratio (M‐H, Random, 95% CI) | Totals not selected | |
| 2.1 Allergic macule‐papular | 1 | Risk Ratio (M‐H, Random, 95% CI) | 0.0 [0.0, 0.0] | |
| Outcome or subgroup title | No. of studies | No. of participants | Statistical method | Effect size |
| 1 Participants complete cure Show forest plot | 1 | Risk Ratio (M‐H, Random, 95% CI) | Totals not selected | |
| Outcome or subgroup title | No. of studies | No. of participants | Statistical method | Effect size |
| 1 Participants complete cure Show forest plot | 1 | Risk Ratio (M‐H, Random, 95% CI) | Totals not selected | |
| Outcome or subgroup title | No. of studies | No. of participants | Statistical method | Effect size |
| 1 Participants complete cure Show forest plot | 1 | Risk Ratio (M‐H, Random, 95% CI) | Totals not selected | |
| 2 Adverse effects Show forest plot | 1 | Risk Ratio (M‐H, Random, 95% CI) | Totals not selected | |
| 2.1 Nausea and vomiting | 1 | Risk Ratio (M‐H, Random, 95% CI) | 0.0 [0.0, 0.0] | |
| 2.2 Oedema | 1 | Risk Ratio (M‐H, Random, 95% CI) | 0.0 [0.0, 0.0] | |
| Outcome or subgroup title | No. of studies | No. of participants | Statistical method | Effect size |
| 1 Participants complete cure Show forest plot | 1 | Risk Ratio (M‐H, Random, 95% CI) | Totals not selected | |
| Outcome or subgroup title | No. of studies | No. of participants | Statistical method | Effect size |
| 1 Participants complete cure Show forest plot | 1 | Risk Ratio (M‐H, Random, 95% CI) | Totals not selected | |
| Outcome or subgroup title | No. of studies | No. of participants | Statistical method | Effect size |
| 1 Lesions cured Show forest plot | 1 | Risk Ratio (M‐H, Random, 95% CI) | Totals not selected | |
| Outcome or subgroup title | No. of studies | No. of participants | Statistical method | Effect size |
| 1 Participants complete cure Show forest plot | 1 | Risk Ratio (M‐H, Random, 95% CI) | Totals not selected | |
| Outcome or subgroup title | No. of studies | No. of participants | Statistical method | Effect size |
| 1 Participants complete cure (ITT) Show forest plot | 1 | Risk Ratio (M‐H, Random, 95% CI) | Totals not selected | |
| 2 Adverse effects Show forest plot | 1 | Risk Ratio (M‐H, Random, 95% CI) | Totals not selected | |
| 2.1 Hypersensitivity | 1 | Risk Ratio (M‐H, Random, 95% CI) | 0.0 [0.0, 0.0] | |
| 2.2 Mild pruritus | 1 | Risk Ratio (M‐H, Random, 95% CI) | 0.0 [0.0, 0.0] | |
| 2.3 Erithema and oedema | 1 | Risk Ratio (M‐H, Random, 95% CI) | 0.0 [0.0, 0.0] | |
| Outcome or subgroup title | No. of studies | No. of participants | Statistical method | Effect size |
| 1 Lesions cured Show forest plot | 1 | Risk Ratio (M‐H, Random, 95% CI) | Totals not selected | |
| 2 Scarring Show forest plot | 1 | Risk Ratio (M‐H, Random, 95% CI) | Totals not selected | |
| 3 Microbiological cure of skin lesions Show forest plot | 1 | Risk Ratio (M‐H, Random, 95% CI) | Totals not selected | |
| Outcome or subgroup title | No. of studies | No. of participants | Statistical method | Effect size |
| 1 Lesions cured Show forest plot | 1 | 80 | Risk Ratio (M‐H, Random, 95% CI) | 0.71 [0.25, 2.06] |
| Outcome or subgroup title | No. of studies | No. of participants | Statistical method | Effect size |
| 1 Participants complete cure Show forest plot | 2 | 383 | Risk Ratio (M‐H, Random, 95% CI) | 1.00 [0.86, 1.17] |
| 2 Adverse effects Show forest plot | 3 | Risk Ratio (M‐H, Random, 95% CI) | Subtotals only | |
| 2.1 Skin/local reaction | 3 | 463 | Risk Ratio (M‐H, Random, 95% CI) | 0.94 [0.45, 1.93] |
| 3 Microbiological cure of skin lesions Show forest plot | 2 | 383 | Risk Ratio (M‐H, Random, 95% CI) | 1.03 [0.88, 1.20] |
| Outcome or subgroup title | No. of studies | No. of participants | Statistical method | Effect size |
| 1 Participants complete cure Show forest plot | 1 | Risk Ratio (M‐H, Random, 95% CI) | Totals not selected | |
| Outcome or subgroup title | No. of studies | No. of participants | Statistical method | Effect size |
| 1 Participants complete cure Show forest plot | 1 | Risk Ratio (M‐H, Random, 95% CI) | Totals not selected | |
| Outcome or subgroup title | No. of studies | No. of participants | Statistical method | Effect size |
| 1 Participants complete cure Show forest plot | 1 | Risk Ratio (M‐H, Random, 95% CI) | Totals not selected | |
| Outcome or subgroup title | No. of studies | No. of participants | Statistical method | Effect size |
| 1 Participants complete cure Show forest plot | 1 | Risk Ratio (M‐H, Random, 95% CI) | Totals not selected | |
| 2 Recurrence Show forest plot | 1 | Risk Ratio (M‐H, Random, 95% CI) | Totals not selected | |
| 3 Scarring Show forest plot | 1 | Risk Ratio (M‐H, Random, 95% CI) | Totals not selected | |
| Outcome or subgroup title | No. of studies | No. of participants | Statistical method | Effect size |
| 1 Participants complete cure Show forest plot | 1 | Risk Ratio (M‐H, Random, 95% CI) | Totals not selected | |
| 2 Adverse effects Show forest plot | 1 | Risk Ratio (M‐H, Random, 95% CI) | Totals not selected | |
| 2.1 Cutaneous reaction | 1 | Risk Ratio (M‐H, Random, 95% CI) | 0.0 [0.0, 0.0] | |
| Outcome or subgroup title | No. of studies | No. of participants | Statistical method | Effect size |
| 1 Participants complete cure Show forest plot | 1 | Risk Ratio (M‐H, Random, 95% CI) | Totals not selected | |
| 2 Microbiological cure of skin lesions Show forest plot | 1 | Risk Ratio (M‐H, Random, 95% CI) | Totals not selected | |
| Outcome or subgroup title | No. of studies | No. of participants | Statistical method | Effect size |
| 1 Lesions cured Show forest plot | 1 | Risk Ratio (M‐H, Random, 95% CI) | Totals not selected | |
| 2 Scarring Show forest plot | 1 | Risk Ratio (M‐H, Random, 99% CI) | Totals not selected | |
| 3 Microbiological cure of skin lesions Show forest plot | 1 | Risk Ratio (M‐H, Random, 95% CI) | Totals not selected | |
| Outcome or subgroup title | No. of studies | No. of participants | Statistical method | Effect size |
| 1 Participants complete cure Show forest plot | 1 | Risk Ratio (M‐H, Random, 95% CI) | Totals not selected | |
| 2 Microbiological cure of skin lesions Show forest plot | 1 | Risk Ratio (M‐H, Random, 95% CI) | Totals not selected | |
| Outcome or subgroup title | No. of studies | No. of participants | Statistical method | Effect size |
| 1 Lesions cured Show forest plot | 1 | Risk Ratio (M‐H, Random, 95% CI) | Totals not selected | |
| Outcome or subgroup title | No. of studies | No. of participants | Statistical method | Effect size |
| 1 Lesions cured Show forest plot | 1 | Risk Ratio (M‐H, Random, 95% CI) | Totals not selected | |
| Outcome or subgroup title | No. of studies | No. of participants | Statistical method | Effect size |
| 1 Lesions cured Show forest plot | 1 | Risk Ratio (M‐H, Random, 95% CI) | Totals not selected | |
| Outcome or subgroup title | No. of studies | No. of participants | Statistical method | Effect size |
| 1 Lesions cured Show forest plot | 1 | Risk Ratio (M‐H, Random, 95% CI) | Totals not selected | |
| 2 Participants complete cured Show forest plot | 1 | Risk Ratio (M‐H, Random, 95% CI) | Totals not selected | |
| 3 Adverse effects Show forest plot | 2 | Risk Ratio (M‐H, Random, 95% CI) | Totals not selected | |
| 3.1 Pain | 1 | Risk Ratio (M‐H, Random, 95% CI) | 0.0 [0.0, 0.0] | |
| 3.2 Burning | 1 | Risk Ratio (M‐H, Random, 95% CI) | 0.0 [0.0, 0.0] | |
| 3.3 Itching | 1 | Risk Ratio (M‐H, Random, 95% CI) | 0.0 [0.0, 0.0] | |
| 3.4 Inflammation | 1 | Risk Ratio (M‐H, Random, 95% CI) | 0.0 [0.0, 0.0] | |
| 3.5 Pruritus and erythema | 1 | Risk Ratio (M‐H, Random, 95% CI) | 0.0 [0.0, 0.0] | |
| 3.6 Severe pain | 1 | Risk Ratio (M‐H, Random, 95% CI) | 0.0 [0.0, 0.0] | |
| Outcome or subgroup title | No. of studies | No. of participants | Statistical method | Effect size |
| 1 Lesions cured Show forest plot | 1 | Risk Ratio (M‐H, Random, 95% CI) | Totals not selected | |
| 2 Adverse effects Show forest plot | 1 | Risk Ratio (M‐H, Random, 95% CI) | Totals not selected | |
| 2.1 Inflammation | 1 | Risk Ratio (M‐H, Random, 95% CI) | 0.0 [0.0, 0.0] | |
| Outcome or subgroup title | No. of studies | No. of participants | Statistical method | Effect size |
| 1 Participants complete cure Show forest plot | 1 | Risk Ratio (M‐H, Random, 95% CI) | Totals not selected | |
| 2 Participants with treated lesions that recur Show forest plot | 1 | Risk Ratio (M‐H, Random, 95% CI) | Totals not selected | |
| 3 Adverse effects Show forest plot | 1 | Risk Ratio (M‐H, Random, 95% CI) | Totals not selected | |
| 3.1 Itch and burning | 1 | Risk Ratio (M‐H, Random, 95% CI) | 0.0 [0.0, 0.0] | |
| Outcome or subgroup title | No. of studies | No. of participants | Statistical method | Effect size |
| 1 Lesions cured Show forest plot | 1 | Risk Ratio (M‐H, Random, 95% CI) | Totals not selected | |
| Outcome or subgroup title | No. of studies | No. of participants | Statistical method | Effect size |
| 1 Lesions cured Show forest plot | 1 | Risk Ratio (M‐H, Random, 95% CI) | Totals not selected | |
| 2 Adverse effects Show forest plot | 1 | Risk Ratio (M‐H, Random, 95% CI) | Totals not selected | |
| 2.1 Sporotrichotic dissemination | 1 | Risk Ratio (M‐H, Random, 95% CI) | 0.0 [0.0, 0.0] | |
| 2.2 Allergic reaction | 1 | Risk Ratio (M‐H, Random, 95% CI) | 0.0 [0.0, 0.0] | |
| Outcome or subgroup title | No. of studies | No. of participants | Statistical method | Effect size |
| 1 Lesions cured Show forest plot | 1 | Risk Ratio (M‐H, Random, 95% CI) | Totals not selected | |
| Outcome or subgroup title | No. of studies | No. of participants | Statistical method | Effect size |
| 1 Lesions cured Show forest plot | 1 | Risk Ratio (M‐H, Random, 95% CI) | Totals not selected | |
| 2 Recurrence Show forest plot | 1 | Risk Ratio (M‐H, Random, 95% CI) | Totals not selected | |
| 3 Speed of healing (weeks) Show forest plot | 1 | Mean Difference (IV, Random, 95% CI) | Totals not selected | |
| 4 Adverse effects Show forest plot | 1 | Risk Ratio (M‐H, Random, 95% CI) | Totals not selected | |
| 4.1 Ulceration and necrosis | 1 | Risk Ratio (M‐H, Random, 95% CI) | 0.0 [0.0, 0.0] | |
| Outcome or subgroup title | No. of studies | No. of participants | Statistical method | Effect size |
| 1 Lesions cured Show forest plot | 1 | Risk Ratio (M‐H, Random, 95% CI) | Totals not selected | |
| 2 Recurrence Show forest plot | 1 | Risk Ratio (M‐H, Random, 99% CI) | Totals not selected | |
| 3 Speed of healing (weeks) Show forest plot | 1 | Mean Difference (IV, Random, 95% CI) | Totals not selected | |
| 4 Adverse effects Show forest plot | 1 | Risk Ratio (M‐H, Random, 95% CI) | Totals not selected | |
| 4.1 Ulceration and necrosis | 1 | Risk Ratio (M‐H, Random, 95% CI) | 0.0 [0.0, 0.0] | |
| Outcome or subgroup title | No. of studies | No. of participants | Statistical method | Effect size |
| 1 Lesions cured Show forest plot | 1 | Risk Ratio (M‐H, Random, 95% CI) | Totals not selected | |
| 2 Microbiological cure of skin lesions Show forest plot | 1 | Risk Ratio (M‐H, Random, 95% CI) | Totals not selected | |
| Outcome or subgroup title | No. of studies | No. of participants | Statistical method | Effect size |
| 1 Participants complete cure Show forest plot | 1 | Risk Ratio (M‐H, Random, 95% CI) | Totals not selected | |
| 2 Adverse effects Show forest plot | 1 | Risk Ratio (M‐H, Random, 95% CI) | Totals not selected | |
| 2.1 Erythema | 1 | Risk Ratio (M‐H, Random, 95% CI) | 0.0 [0.0, 0.0] | |
| 2.2 Mild pain | 1 | Risk Ratio (M‐H, Random, 95% CI) | 0.0 [0.0, 0.0] | |
| 2.3 Hearing acuity problems | 1 | Risk Ratio (M‐H, Random, 95% CI) | 0.0 [0.0, 0.0] | |
| Outcome or subgroup title | No. of studies | No. of participants | Statistical method | Effect size |
| 1 Participants complete cure Show forest plot | 1 | Risk Ratio (M‐H, Random, 95% CI) | Totals not selected | |
| 2 Adverse effects Show forest plot | 1 | Risk Ratio (M‐H, Random, 95% CI) | Totals not selected | |
| 2.1 Local inflammatory reactions | 1 | Risk Ratio (M‐H, Random, 95% CI) | 0.0 [0.0, 0.0] | |
| Outcome or subgroup title | No. of studies | No. of participants | Statistical method | Effect size |
| 1 Participants complete cure Show forest plot | 1 | Risk Ratio (M‐H, Random, 95% CI) | Totals not selected | |
| Outcome or subgroup title | No. of studies | No. of participants | Statistical method | Effect size |
| 1 Lesions cured Show forest plot | 1 | Risk Ratio (M‐H, Random, 95% CI) | Totals not selected | |
| Outcome or subgroup title | No. of studies | No. of participants | Statistical method | Effect size |
| 1 Participants complete cure Show forest plot | 1 | Risk Ratio (M‐H, Random, 95% CI) | Totals not selected | |
| 2 Adverse effects Show forest plot | 1 | Risk Ratio (M‐H, Random, 95% CI) | Totals not selected | |
| 2.1 Reulceration | 1 | Risk Ratio (M‐H, Random, 95% CI) | 0.0 [0.0, 0.0] | |
| 2.2 Keloïd scars | 1 | Risk Ratio (M‐H, Random, 95% CI) | 0.0 [0.0, 0.0] | |
| Outcome or subgroup title | No. of studies | No. of participants | Statistical method | Effect size |
| 1 Lesions cured Show forest plot | 1 | Risk Ratio (M‐H, Random, 95% CI) | Totals not selected | |
| 2 Recurrence Show forest plot | 1 | Risk Ratio (M‐H, Random, 95% CI) | Totals not selected | |
| 3 Adverse effects Show forest plot | 1 | Risk Ratio (M‐H, Random, 95% CI) | Totals not selected | |
| 3.1 Dizziness and nausea | 1 | Risk Ratio (M‐H, Random, 95% CI) | 0.0 [0.0, 0.0] | |
| 3.2 Hypersensitive reaction | 1 | Risk Ratio (M‐H, Random, 95% CI) | 0.0 [0.0, 0.0] | |
| Outcome or subgroup title | No. of studies | No. of participants | Statistical method | Effect size |
| 1 Lesions cured Show forest plot | 1 | 433 | Risk Ratio (M‐H, Random, 95% CI) | 0.91 [0.53, 1.55] |
| 2 Adverse effects Show forest plot | 1 | Risk Ratio (M‐H, Random, 95% CI) | Totals not selected | |
| 2.1 Hyperpigmentation and redness | 1 | Risk Ratio (M‐H, Random, 95% CI) | 0.0 [0.0, 0.0] | |
| 2.2 Hypertrophic scarring | 1 | Risk Ratio (M‐H, Random, 95% CI) | 0.0 [0.0, 0.0] | |
| 2.3 Systemic symptoms | 1 | Risk Ratio (M‐H, Random, 95% CI) | 0.0 [0.0, 0.0] | |
| Outcome or subgroup title | No. of studies | No. of participants | Statistical method | Effect size |
| 1 Lesions cured Show forest plot | 1 | Risk Ratio (M‐H, Random, 95% CI) | Totals not selected | |
| 2 Adverse effects Show forest plot | 1 | Risk Ratio (M‐H, Random, 95% CI) | Totals not selected | |
| 2.1 Hyperpigmentation | 1 | Risk Ratio (M‐H, Random, 95% CI) | 0.0 [0.0, 0.0] | |
| 2.2 Atrophic scar | 1 | Risk Ratio (M‐H, Random, 95% CI) | 0.0 [0.0, 0.0] | |
| 2.3 Hypopigmentation | 1 | Risk Ratio (M‐H, Random, 95% CI) | 0.0 [0.0, 0.0] | |
| Outcome or subgroup title | No. of studies | No. of participants | Statistical method | Effect size |
| 1 Partcipants complete cure Show forest plot | 1 | Risk Ratio (M‐H, Random, 95% CI) | Totals not selected | |
| 2 Adverse effects Show forest plot | 1 | Risk Ratio (M‐H, Random, 95% CI) | Totals not selected | |
| 2.1 Erythema | 1 | Risk Ratio (M‐H, Random, 95% CI) | 0.0 [0.0, 0.0] | |
| Outcome or subgroup title | No. of studies | No. of participants | Statistical method | Effect size |
| 1 Participants complete cure Show forest plot | 1 | Risk Ratio (M‐H, Random, 95% CI) | Totals not selected | |
| 2 Recurrence Show forest plot | 1 | Risk Ratio (M‐H, Random, 95% CI) | Totals not selected | |
| 3 Adverse effects Show forest plot | 1 | Risk Ratio (M‐H, Random, 95% CI) | Totals not selected | |
| 3.1 Mild erythema and itch | 1 | Risk Ratio (M‐H, Random, 95% CI) | 0.0 [0.0, 0.0] | |
| 4 Microbiological cure of skin lesions Show forest plot | 1 | 80 | Risk Ratio (M‐H, Random, 95% CI) | 0.97 [0.74, 1.26] |
| Outcome or subgroup title | No. of studies | No. of participants | Statistical method | Effect size |
| 1 Participants complete cure Show forest plot | 1 | Risk Ratio (M‐H, Random, 95% CI) | Totals not selected | |
| 2 Lesions cured Show forest plot | 1 | Risk Ratio (M‐H, Random, 99% CI) | Totals not selected | |
| 2.1 Males | 1 | Risk Ratio (M‐H, Random, 99% CI) | 0.0 [0.0, 0.0] | |
| 2.2 Females | 1 | Risk Ratio (M‐H, Random, 99% CI) | 0.0 [0.0, 0.0] | |
| Outcome or subgroup title | No. of studies | No. of participants | Statistical method | Effect size |
| 1 Participants complete cure Show forest plot | 1 | Risk Ratio (M‐H, Random, 95% CI) | Totals not selected | |
| 2 Speed of healing (weeks) Show forest plot | 1 | Mean Difference (IV, Random, 95% CI) | Totals not selected | |
| Outcome or subgroup title | No. of studies | No. of participants | Statistical method | Effect size |
| 1 Participants complete cure Show forest plot | 1 | Risk Ratio (M‐H, Random, 95% CI) | Totals not selected | |
| Outcome or subgroup title | No. of studies | No. of participants | Statistical method | Effect size |
| 1 Participants complete cure Show forest plot | 1 | Risk Ratio (M‐H, Random, 95% CI) | Totals not selected | |
| 2 Adverse effects Show forest plot | 1 | Risk Ratio (M‐H, Random, 95% CI) | Totals not selected | |
| 2.1 Erythema and oedema | 1 | Risk Ratio (M‐H, Random, 95% CI) | 0.0 [0.0, 0.0] | |
| Outcome or subgroup title | No. of studies | No. of participants | Statistical method | Effect size |
| 1 Participants complete cure Show forest plot | 1 | Risk Ratio (M‐H, Random, 95% CI) | Totals not selected | |
| Outcome or subgroup title | No. of studies | No. of participants | Statistical method | Effect size |
| 1 Lesions cured Show forest plot | 1 | Risk Ratio (M‐H, Random, 95% CI) | Totals not selected | |
| 2 Adverse effects Show forest plot | 1 | Risk Ratio (M‐H, Random, 95% CI) | Totals not selected | |
| 2.1 Hypopigmentation | 1 | Risk Ratio (M‐H, Random, 95% CI) | 0.0 [0.0, 0.0] | |
| Outcome or subgroup title | No. of studies | No. of participants | Statistical method | Effect size |
| 1 Lesions cured Show forest plot | 1 | Risk Ratio (M‐H, Random, 95% CI) | Totals not selected | |
| 2 Adverse effects Show forest plot | 1 | 390 | Risk Ratio (M‐H, Random, 95% CI) | 14.64 [0.86, 247.99] |
| 2.1 Hypopigmentation | 1 | 390 | Risk Ratio (M‐H, Random, 95% CI) | 14.64 [0.86, 247.99] |
| Outcome or subgroup title | No. of studies | No. of participants | Statistical method | Effect size |
| 1 Participants complete cure Show forest plot | 1 | Risk Ratio (M‐H, Random, 95% CI) | Totals not selected | |
| Outcome or subgroup title | No. of studies | No. of participants | Statistical method | Effect size |
| 1 Lesions cured Show forest plot | 1 | Risk Ratio (M‐H, Random, 95% CI) | Totals not selected | |
| 2 Adverse effects Show forest plot | 1 | Risk Ratio (M‐H, Random, 95% CI) | Totals not selected | |
| 2.1 Mild skin symptoms | 1 | Risk Ratio (M‐H, Random, 95% CI) | 0.0 [0.0, 0.0] | |
| Outcome or subgroup title | No. of studies | No. of participants | Statistical method | Effect size |
| 1 Lesions cured Show forest plot | 1 | Risk Ratio (M‐H, Random, 95% CI) | Totals not selected | |
| 2 Participants complete cure Show forest plot | 2 | 499 | Risk Ratio (M‐H, Random, 95% CI) | 1.23 [0.97, 1.55] |
| 3 Adverse effects Show forest plot | 1 | Risk Ratio (M‐H, Random, 95% CI) | Totals not selected | |
| 3.1 Allergic reaction | 1 | Risk Ratio (M‐H, Random, 95% CI) | 0.0 [0.0, 0.0] | |
| Outcome or subgroup title | No. of studies | No. of participants | Statistical method | Effect size |
| 1 Lesions cured Show forest plot | 1 | Risk Ratio (M‐H, Random, 95% CI) | Totals not selected | |
| 2 Adverse effects (serious) Show forest plot | 1 | Risk Ratio (M‐H, Random, 95% CI) | Totals not selected | |
| Outcome or subgroup title | No. of studies | No. of participants | Statistical method | Effect size |
| 1 Participants complete cure Show forest plot | 1 | Risk Ratio (M‐H, Random, 95% CI) | Totals not selected | |
| 2 Adverse event (secondary infection) Show forest plot | 1 | Risk Ratio (M‐H, Random, 99% CI) | Totals not selected | |
| Outcome or subgroup title | No. of studies | No. of participants | Statistical method | Effect size |
| 1 Participants complete cure Show forest plot | 1 | Risk Ratio (M‐H, Random, 95% CI) | Totals not selected | |
| Outcome or subgroup title | No. of studies | No. of participants | Statistical method | Effect size |
| 1 Adverse effects Show forest plot | 1 | Risk Ratio (M‐H, Random, 95% CI) | Totals not selected | |
| 1.1 Superinfection | 1 | Risk Ratio (M‐H, Random, 95% CI) | 0.0 [0.0, 0.0] | |
| 1.2 Keloid formation | 1 | Risk Ratio (M‐H, Random, 95% CI) | 0.0 [0.0, 0.0] | |
| Outcome or subgroup title | No. of studies | No. of participants | Statistical method | Effect size |
| 1 Lesions cured Show forest plot | 1 | Risk Ratio (M‐H, Random, 95% CI) | Totals not selected | |
| 2 Scarring Show forest plot | 1 | Risk Ratio (M‐H, Random, 95% CI) | Totals not selected | |
| 3 Microbiological cure of skin lesions Show forest plot | 1 | Risk Ratio (M‐H, Random, 95% CI) | Totals not selected | |
| Outcome or subgroup title | No. of studies | No. of participants | Statistical method | Effect size |
| 1 Participants complete cure Show forest plot | 1 | Risk Ratio (M‐H, Random, 95% CI) | Totals not selected | |
| 2 Adverse effects Show forest plot | 1 | Risk Ratio (M‐H, Random, 95% CI) | Totals not selected | |
| 2.1 Allergic reaction | 1 | Risk Ratio (M‐H, Random, 95% CI) | 0.0 [0.0, 0.0] | |
| 3 Development of cell‐mediated immunity Show forest plot | 1 | Risk Ratio (M‐H, Random, 95% CI) | Totals not selected | |
| Outcome or subgroup title | No. of studies | No. of participants | Statistical method | Effect size |
| 1 Participants complete cure Show forest plot | 1 | Risk Ratio (M‐H, Random, 95% CI) | Totals not selected | |
| Outcome or subgroup title | No. of studies | No. of participants | Statistical method | Effect size |
| 1 Participants complete cure Show forest plot | 1 | Risk Ratio (M‐H, Random, 95% CI) | Totals not selected | |
| Outcome or subgroup title | No. of studies | No. of participants | Statistical method | Effect size |
| 1 Participants complete cure Show forest plot | 1 | Risk Ratio (M‐H, Random, 95% CI) | Totals not selected | |
| Outcome or subgroup title | No. of studies | No. of participants | Statistical method | Effect size |
| 1 Participants complete cure Show forest plot | 1 | Risk Ratio (M‐H, Random, 95% CI) | Totals not selected | |
| Outcome or subgroup title | No. of studies | No. of participants | Statistical method | Effect size |
| 1 Participants complete cure Show forest plot | 1 | Risk Ratio (M‐H, Random, 95% CI) | Totals not selected | |
| 2 Adverse effects Show forest plot | 1 | Risk Ratio (M‐H, Random, 95% CI) | Totals not selected | |
| 2.1 Itching | 1 | Risk Ratio (M‐H, Random, 95% CI) | 0.0 [0.0, 0.0] | |
| Outcome or subgroup title | No. of studies | No. of participants | Statistical method | Effect size |
| 1 Participants complete cure Show forest plot | 1 | Risk Ratio (M‐H, Random, 95% CI) | Totals not selected | |
| 2 Speed of healing (weeks) Show forest plot | 1 | Mean Difference (IV, Random, 95% CI) | Totals not selected | |
| 3 Adverse effects Show forest plot | 1 | Risk Ratio (M‐H, Random, 95% CI) | Totals not selected | |
| 3.1 Allergic reaction | 1 | Risk Ratio (M‐H, Random, 95% CI) | 0.0 [0.0, 0.0] | |
| Outcome or subgroup title | No. of studies | No. of participants | Statistical method | Effect size |
| 1 Participants complete cure Show forest plot | 1 | Risk Ratio (M‐H, Random, 95% CI) | Totals not selected | |
| 2 Speed of healing (weeks) Show forest plot | 1 | Mean Difference (IV, Random, 95% CI) | Totals not selected | |
| 3 Adverse reaction Show forest plot | 1 | Risk Ratio (M‐H, Random, 95% CI) | Totals not selected | |
| 3.1 Allergic reaction | 1 | Risk Ratio (M‐H, Random, 95% CI) | 0.0 [0.0, 0.0] | |
| Outcome or subgroup title | No. of studies | No. of participants | Statistical method | Effect size |
| 1 Participants complete cure Show forest plot | 1 | Risk Ratio (M‐H, Random, 95% CI) | Totals not selected | |
| 2 Speed of healing (days) Show forest plot | 1 | Mean Difference (IV, Random, 95% CI) | Totals not selected | |
| 3 Adverse effects Show forest plot | 1 | Risk Ratio (M‐H, Random, 95% CI) | Totals not selected | |
| 3.1 Allergic reaction | 1 | Risk Ratio (M‐H, Random, 95% CI) | 0.0 [0.0, 0.0] | |
| Outcome or subgroup title | No. of studies | No. of participants | Statistical method | Effect size |
| 1 Participants complete cure Show forest plot | 1 | Risk Ratio (M‐H, Random, 95% CI) | Totals not selected | |
| 2 Adverse effects Show forest plot | 1 | Risk Ratio (M‐H, Random, 95% CI) | Totals not selected | |
| 2.1 Itching | 1 | Risk Ratio (M‐H, Random, 95% CI) | 0.0 [0.0, 0.0] | |
| 3 Microbiological cure of skin lesions Show forest plot | 1 | Risk Ratio (M‐H, Random, 95% CI) | Totals not selected | |